
Abstract
Cellulose acetate (CA) nanofiber membranes incorporated with diatomite (DE) were prepared by electrospinning to produce electrospun nanofiber membranes with high specific surface area and high porosity with fine pores. When the DE percentage increased from 0 to 30%, the water contact angle (WCA) of the membranes increased from 86.21° to 118.44°, indicating that neat CA nanofibers were more hydrophilic than CA/DE nanofibers and had a better wetting tendency. CA, CA-10DE, and CA-20DE nanofiber membranes showed a mean flow pore size (MFP) of 2.941, 2.681, and 2.408 μm, respectively, with narrow pore size distributions. However, the CA-30DE nanofiber membrane showed a smaller MFP size of 0.5014 μm. CA nanofibers were produced in the range of 206.31 to 281.13 nm. The dye removal ability of these membranes was tested using an aqueous solution of C.I. Reactive Red 141.
Introduction
Diatomite or diatomaceous earth (DE), which consists mainly of amorphous silica derived from opalescent frustules of diatoms, is a fine-grained, low-density biogenic sedimentary mineral. 1 There are known to be well over 100,000 different species of DE, each having a unique morphology. 2 They are characterized by a high porosity up to 80%, low density, and high surface area, and they also have a wide variety of shapes. 3 They are inexpensive and can be found in nature. Possessing a high sorption ability and surface area, DEs are potential adsorbents for pollutants found in industrial waste water, including dyes.2,4–7 Studies show that DEs could be used for the adsorption of some textile dyes, including reactive dyes.5,7,8
The nanofiber membranes prepared by the electrospinning method have unique properties such as high specific surface area and high porosity with fine pores. These properties led electrospun nanofiber membranes to be used for the removal of heavy metal ions9–11 and dye molecules from textile wastewater.12–14 Combining DE and nanofiber's unique properties would enable the use of DE-loaded nanofiber membranes in liquid filtration processes.
The electrospinning process simply uses a high voltage power source, a nozzle, and a collector covered with aluminum foil. 15 The potential difference between nozzle and collector leads stretches the solution and creates a thin jet of polymeric solution toward the collector. During this process, the solvent evaporates and ultrafine nanofibers are collected. 16 Electrospinning has attracted a great deal of attention due to its relative ease of use, adaptability, ability to fabricate fibers with diameters on the nanometer scale, 15 and potential for surface functionalization17,18 with the fiber's high surface area to volume or mass ratio, small inter-fibrous pore size, and high porosity.19,20
Cellulose acetate (CA)-based membranes are used for filtration of water-soluble oligomers and polymers, are especially suited for biological macromolecules, are used in aqueous systems,21,22 and for reverse osmosis. 23 They were also reportedly used to desalinate seawater.22,23 DE products are used in a variety of ways, such as reinforcing, stiffening, hardening of organic solids, reducing adhesion between solid surfaces, increasing viscosity, surfactant effects, hydrophobic effects, as absorbents and catalysts, and for cloud seeding. 24
In the present study, a hydrophilic CA was selected, and DE was incorporated along with CA nanofibers. This study was designed for development of CA/DE nanofibers with potential applications for wastewater treatment. To the author's best knowledge, incorporation of DE into CA nanofibers during electrospinning has not been previously reported.
Neat CA and CA/DE nanofiber membranes were prepared by electrospinning. X-ray powder diffraction (XRD) was used for phase identification and to determine the characteristic peaks, and X-ray fluorescence (XRF) was used to determine the elemental composition of DE. The interaction between CA nanofibers and DE was investigated by Fourier transform infrared spectroscopy (FTIR) analyses. Water contact angle (WCA) and swelling percentages of the nanofiber membranes were performed to determine wetting properties. Scanning electron microscope (SEM) analysis was used to compare the pore sizes of the produced CA nanofiber membranes and CA syringe filters (with pore sizes of 22 and 45 μm), and pore size measurements were performed for porosity evaluation. CA-nanofiber membranes were finally evaluated for the removal of C.I. Reactive Red 141 (Fig. 1) from aqueous solution.
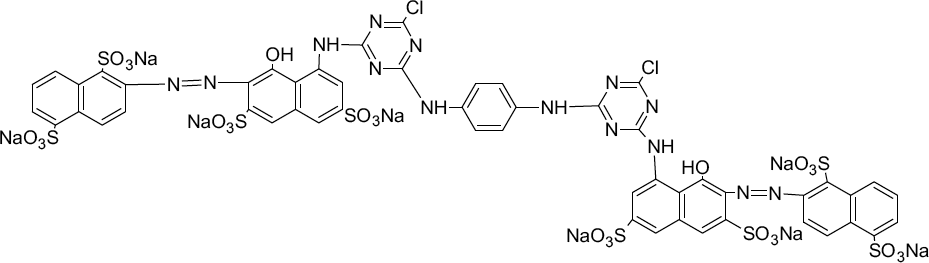
Reactive Red 141. 15
Reactive dyes are the most commonly-used dye class in the textile industry. However, due to their relatively lower levels of fixation and poor removal from wastewater, one of the main problems, visual pollution, is raised. With growing awareness and environmental concerns, measures should be taken to remove color from industrial discharges. Adsorption is one technique that can be used for color removal from textile wastewater. Polymeric membranes can be used for liquid filtration purposes and may also be used as an adsorbent for color removal. In this study, the effects of contact time, incorporation of DE into CA nanofibers, and the concentration of DE have also been investigated for color removal of Reactive Red 141.
Experimental
Materials
CA, with a number average molecular weight (Mn) of ∼30,000 g/mol and an acetylation degree of 39.8 wt% (Fig. 2), acetone, and dimethylacetamide (DMAc) were purchased from Sigma Aldrich. CA syringe filters with pore sizes of 22 and 45 μm were purchased from Isolab Laborgerate GmbH. DE was provided as a natural source from Spain. Reactive Red 141 was purchased from DyStar.
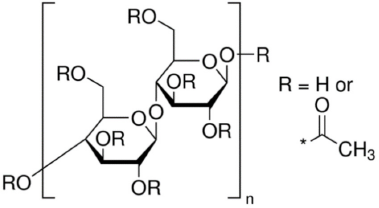
Cellulose acetate (CA). 22
Electrospinning
Homogeneous CA solutions were prepared by dissolving 16% (w/v) of CA powder in acetone/DMAc (2:1 v/v). DE was added into the spinning solutions followed by further stirring. To examine the effects of the amounts of DE, 10, 20, and 30% DE (w/w of polymer) concentrations were used. As a control, neat CA nanofibers were prepared by electrospinning.
Electrospinning of the polymer solutions was carried out by a setup consisting of a syringe (10 mL) with a stainless steel needle (22 gauge, fat tip), a ground electrode, and a high voltage supply (Simco, MP Series CM5 30 P, Charging Generator Output 30 kV DC). CA solutions were electros-pun at a voltage of 15 kV and a tip-to-collector distance of 15 cm with a feeding rate of 0.4 mL/h. A grounded rotating metal drum collector covered by a 90 mesh of plain weave monofilament 100% polyester screen mesh fabric was used as deposition material. Each polymer solution was electros-pun for 2 h.
Characterization and Analysis
XRF Analysis
XRF analysis was performed on DE powder samples with the Spectro XEPOS-II PEDXRF. DE powder sample (6.25 g) and binding wax (1.40 g) were mixed homogenously. The mixture was measured under 12-20 N/m of pressure after pressing the powder to obtain a 40-mm pellet.
XRD Analysis
An X-ray powder diffraction (XRD) pattern was determined for DE on a GNR APD 200 Pro X-ray diffractometer using CuKα radiation (λ = 0.15406 nm) for 2θ from 5° to 60° with an integration rate of 2 s for each angle. The obtained XRD diffractogram was identified using the Match program and the ICDD (International Centre for Diffraction Data) library.
FTIR Analysis
Fourier transform infrared spectroscopy (FTIR) analyses were carried out using a Cary 630 FTIR (Agilent Technologies). Scans were obtained in a spectral range from 650 to 4000 cm−1 with a resolution of 1 cm−1.
WCA Measurements
For determination of hydrophilicity of the CA-nanofiber membranes, WCA values were measured using a CAM 200 contact angle meter (KSV Instruments). The contact angles with distilled water were measured on the upper surface of the electrospun nanofiber membranes. The measurements were performed by the sessile drop method at ambient temperature. A real-time camera captured the image of the droplet.
Pore Size Measurements
The pore size and pore size distribution of the CA-nanofiber membranes were measured by capillary flow porometry (Porolux 1000). All samples were wetted using Galpore 16 (Porometer) (a wetting liquid with a low surface tension of 16 dyne/cm) and tested. The mean pore size of the samples was calculated under wet, dry, and half-dry conditions for syringe filters with pore sizes of 22 and 45 μm along with CA and CA/DE nanofibers for comparison. Syringe filters were coded as SF22 and SF45. Mean flow pore size (MFP), first bubble point (FBP), and pore size distribution (PSD) were measured by the wet-up/dry-up method and the analysis was done using the porometer system software. 25
SEM Analysis
The morphology of CA membranes (SF22 and SF45) and CA nanofibers were observed using a scanning electron microscope (SEM, Phenom G2pro). The electrospun nanofibers were sputtered with a thin layer of gold prior to SEM observation using a Quorum Q150R S ion sputtering device. The mean diameter of the resultant fibers was calculated from measurements at 5000× magnification using the Image J program (US National Institutes of Health and the Laboratory for Optical and Computational Instrumentation, University of Wisconsin). Approximately 50 measurements were carried out from different parts of each sample.
Thickness and Fiber Diameter Measurements and Statistical Analysis
The thicknesses of the nanofiber mats were measured using a Mitutoyo digital micrometer at 0.001 mm accuracy. All fiber diameter and thickness measurements were expressed as mean ±SD. Data were analyzed by one-way ANOVA followed by the Tukey HSD post-hoc test. Differences of p < 0.05 were considered statistically significant.
Color Removal Studies
CA-nanofiber membranes were used for the adsorption of a commercial reactive dye, Reactive Red 141. It was used without purification. NaCl and NaCO3 were added to the adsorption solution to simulate dyeing conditions. A maximum absorbance wavelength of 518 nm was checked during the drawing of the calibration curve from different concentrations of Reactive Red 141, and was also checked before and after the trials; it did not change. Kinetic studies were carried out in 15-mL test tubes containing 10 mL of the adsorption solution with 40 g/L NaCl, 10 g/L NaCO3, 85 mg/L of dye, and 10 mg of adsorbent. These tubes were stirred on the orbital shaker (Nüve, ST 402) at 25 °C over a time interval of 0-24 h. The residual dye concentration in the liquid was analyzed using a UV-Vis spectrophotometer (PerkinElmer Lambda 25) at 518 nm. The experiments were carried out in triplicate. The data were used to calculate the adsorption capacity (qe mg/g) of the adsorbent. The dye concentration on the adsorbent surface at equilibrium was calculated using Eq. 1. 26
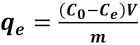
C0 is the initial dye concentration in the liquid phase (mg/L), Ce is the equilibrium dye concentration (mg/L), V is the total volume of dye solution used (L), and m is the mass of adsorbent used (g).
Swelling and Weight Loss of Nanofibrous Mats
Swelling of the CA and CA/DE electrospun nanofiber mats were measured upon exposure in distilled water for 4, 8, and 24 h. The samples were removed from the water and carefully blotted with tissue paper to remove the excess water from the surface. The degree of swelling due to water uptake was determined and the weight loss was calculated at the end after drying for 4 h at 70 °C in an oven. The percentage of degree of swelling and weight loss were calculated by Eqs. 2 and 3, respectively 27
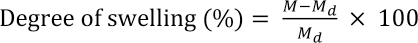
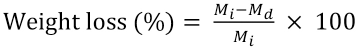
M is the weight of each nanofiber mat sample upon exposure to distilled water for 24 h, Md is the weight of the CA fibers after swelling and subsequent drying, and Mi is the initial weight of the sample.
Results and Discussion
Nanofiber Properties
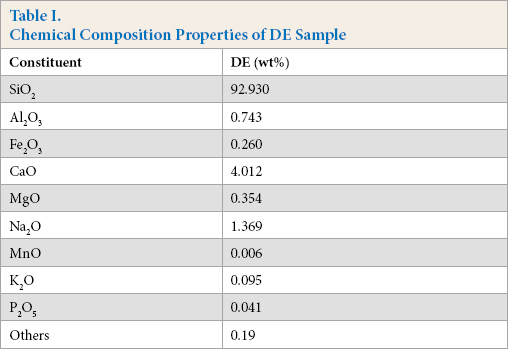
DE typically consists of 87-91% silicon dioxide (SiO2), with significant quantities of alumina (Al2O3) and ferric oxide (Fe2O3). 2 In this study, XRF analysis was used to determine the elemental composition of DE. According to XRF analysis, the main oxide, trace elements, and heavy metal results of DE are given in Table I. SiO2 was the main component (92.930%) and metal oxides, such as Al2O3, Fe2O3, CaO, and Na2O were the main minor constituents. The chemical composition of raw DE used in this experiment was similar to the sources found in other countries.8,28
Chemical Composition Properties of DE Sample
X-ray powder diffraction (XRD) was used for phase identification and to determine the characteristics peaks. Fig. 3 shows the XRD pattern (diffractogram) of DE powder. Results indicate that the samples consisted mainly of SiO2 (96.7%), consistent with the XRF analysis. Quartzized SiO2 structures were found at different phases. Phase distribution rates were 83.5% cristobalite SiO2, 29 9.2% quartz, 30 4.0% SiO2, 31 and 3.3% lime (CaO). 32 Liang et al. investigated the relationship between the cristobalite (fused silica) crystallization and mechanical strength, and their results indicated that higher quantities of cristobalite gave better refractoriness in terms of mechanical strength. 33 Main characteristic peaks at a diffraction angle of 2θ (21, 28, 31, and 35) belonged to cristobalite SiO2.
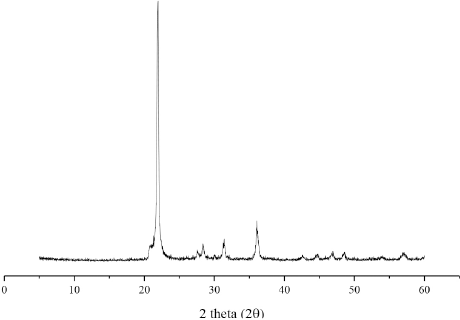
XRD diffraction patterns of DE powder.
The interaction between CA nanofibers and DE was investigated by FTIR analyses. Fig. 4a shows the FTIR spectra of CA polymer and DE. The wide bands centered for DE at 1064 cm−1 were due to Si–O–Si in-plane vibration (asymmetric stretching). Similar observations can be seen for DE at 789 cm−1, which are also characteristic of silica. 25 The most characteristic peaks for CA are at 1734 (carboxyl C=O),34,35 1638 (vinyl C=C vibration), 34 1430 (O=C–OR), 1366 (–CH2), 36 1215 (C–O stretching), 37 and 1120 cm–1 and 1029−1 (C–O–C).37,38
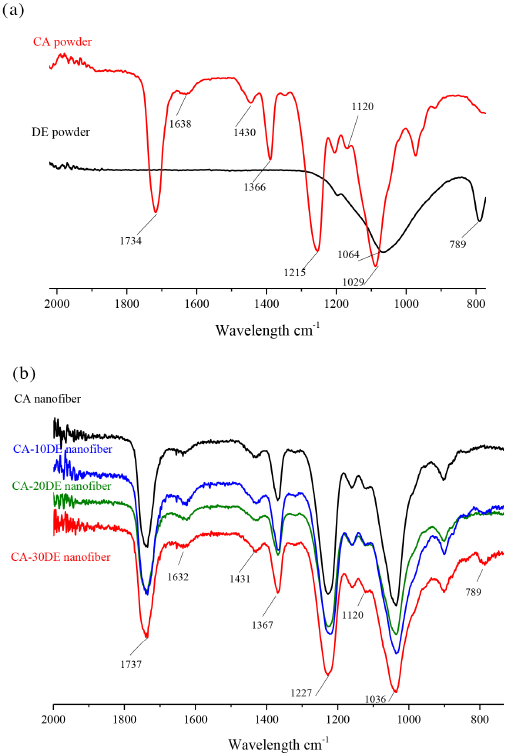
FTIR spectrum of (a) CA and DE powder, (b) CA, CA-10DE, CA-20DE, and CA-30DE nanofibers.
Fig. 4b shows the FTIR spectra of CA and CA/DE nanofibers. The spectrum of CA/DE nanofibers indicates that the DE is totally embedded inside the CA nanofibers.
The characteristic peaks for CA remain, with small shifts without the characteristic peaks of silica: 1737 (carboxyl C=O), 1632 (vinyl C=C vibration), 1431 (O=C–OR), 1367 (–CH2), 1227 (C–O stretching), and 1120 cm−1 and 1036 cm−1 (C–O–C). Peaks at 1069 and 789 cm−1 could not be seen in the spectra. Only the CA-30DE nanofiber spectrum has a peak at 789 cm−1, possibly related to some free DE on the surface.
For determination of hydrophilicity of the CA nanofiber membranes, WCA values between water droplets and the CA nanofiber membranes were measured and pictures were taken after 0.128 s. The average WCA values from the right, middle, and left of the nanofiber membranes are reported in Table II, along with droplet images on the surface of various CA/DE nanofibrous membranes.
WCA (°) and Droplet Images of CA and CA/DE Nanofibers
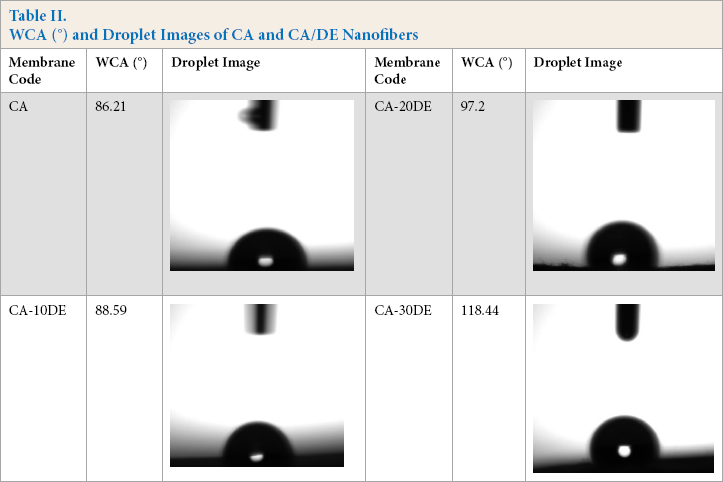
Diatomite materials can introduce hydrophobic effects. 24 The WCA value of the samples increased from 86.21° to 118.44° when the DE percentage was increased from 0 to 30%, indicating that neat CA nanofibers were more hydrophilic than CA/DE nanofibers and had a better wetting tendency.
To understand better the hydrophilic behavior of nanofiber membranes, the vertical capillary method was performed by capillary flow porometry. While the WCA method depends only on the surface penetration, the capillary method takes the whole nanofibers structure into account. 39
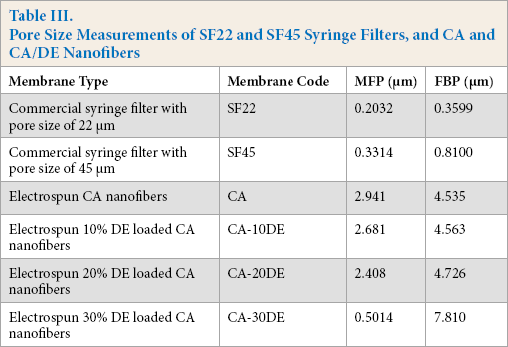
Table III shows the mean flow pore size (MFP) and the first bubble point (FBP). Figs. 5a and b show the pore size distribution (PSD) of the SF22, SF45 syringe filters, CA, and CA/DE nanofiber membranes. SF22 and SF45 filters gave narrow PSD values, with an average pore size of 0.2032 and 0.3314 μm, respectively (similar to the manufacturer's data), while CA, CA-10DE, CA-20DE nanofiber membranes gave quite larger MFP values of 2.941, 2.681, and 2.408 μm, respectively, but still with narrow PSD values. However, the CA-30DE nanofiber membrane had an MFP size of 0.5014 μm, which was less than that of the other CA nanofibers. This difference was related to both the smaller fiber diameters of CA-30DE nanofibers, as well as portions of the polymer solution occurring on the membrane surface due to the large amount of DE applied. Insoluble particles may agglomerate in the polymer solution, therefore preventing even dispersion, and making it difficult to obtain a high concentration of the filler within the composite. Agglomerated particles can also form localized accumulations during electrospinning, decreasing the spinnability, and leading to poor fiber and surface morphologies. 40 The 30% DE amount negatively affected the polymer spinnability that resulted in surface polymer deposits, so that the CA-30DE nanofiber membrane was the stiffest one tested. Use of 20% DE also caused some irregularities, but not as much as 30% DE.
Pore Size Measurements of SF22 and SF45 Syringe Filters, and CA and CA/DE Nanofibers
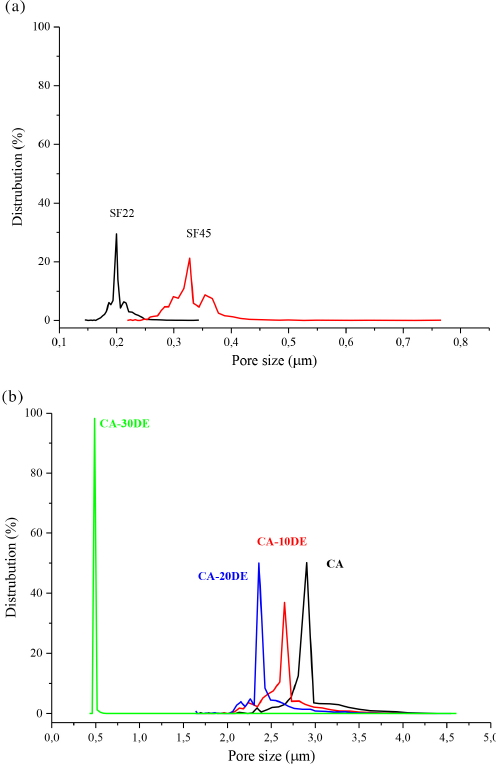
Pore size distribution of (a) SF22 and SF45 syringe filters, and (b) CA and CA/DE nanofibers.
Smaller membrane pore sizes led to higher liquid entry pressure values, which also resulted in a lower membrane wetting tendency. Liquid entry pressure is the minimum pressure needed for water to penetrate the pores of the membrane and is important for membrane distillation applications. 41 Adsorption is the capability of all solid substances to attract molecules of gases or solutions to their surface. 42 Optimization of these properties are essential for development of CA-nanofiber membranes that adsorb textile dyes from wastewater. The most important property of any adsorbent is its surface area and its structure. The chemical nature and polarity of the adsorbent surface can influence the attractive forces between the adsorbent and adsorbate 16 and wetting tendency affects the adsorption rate as well. Higher liquid entry pressure and lower wetting tendency are disadvantageous for this aim, so nanofiber membranes with larger pore sizes are more suitable for the adsorption process. Similar to the WCA results, the wetting tendency was lower with higher DE amounts. All CA/DE-nanofiber membranes had a lower wetting tendency than the neat CA-nanofiber membranes.
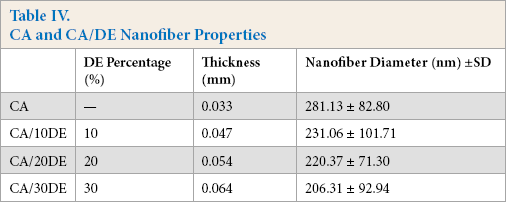
The surface morphology of SF22 and SF45 syringe filters, and the electrospun nanofibers were investigated by SEM imaging. Figs. 6a and b show the representative SEM images of SF22 and SF45 syringe filters, respectively, at two magnifications. The smaller porous structure of SF22 and SF45 can be clearly seen when compared to the electrospun nanofibers. Figs. 7a–d show the representative SEM images of the electrospun nanofibers, while Figs. 8a–d show their respective fiber diameter distributions. Based on these images, bead free electrospun nanofibers were produced with a greater porosity than the syringe membranes. The latter are produced by the reverse phase solvent cast method, where controlled evaporation or removal of the complex solvent system forms the porous structure. 43 The electrospinning method is more suitable for producing membranes with greater porosity, requiring lower operating pressures, than the solvent cast method. Table IV lists the DE percentage, thickness, and fiber diameters (206.31 to 281.13 nm) of the electrospun nanofibers. Differences in the fiber diameters were analyzed by one-way ANOVA followed by a Tukey test for pairwise comparison, with p < 0.05 considered statistically significant. A significant effect was found between DE incorporation and the nanofiber diameter. DE loading significantly decreased the mean nanofiber diameters compared to the neat CA nanofibers, but there was not a significant difference between 10, 20, and 30% DE-loaded nanofibers.
CA and CA/DE Nanofiber Properties
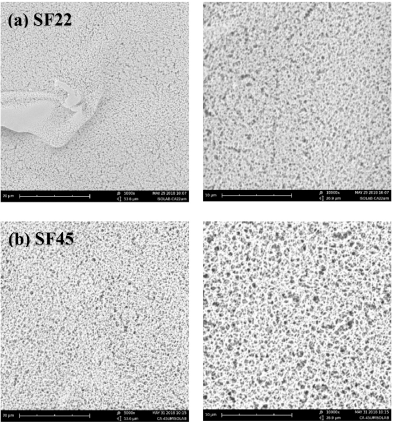
SEM images with 1000 × and 5000 × of (a) SF22 and (b) SF45 syringe filters.
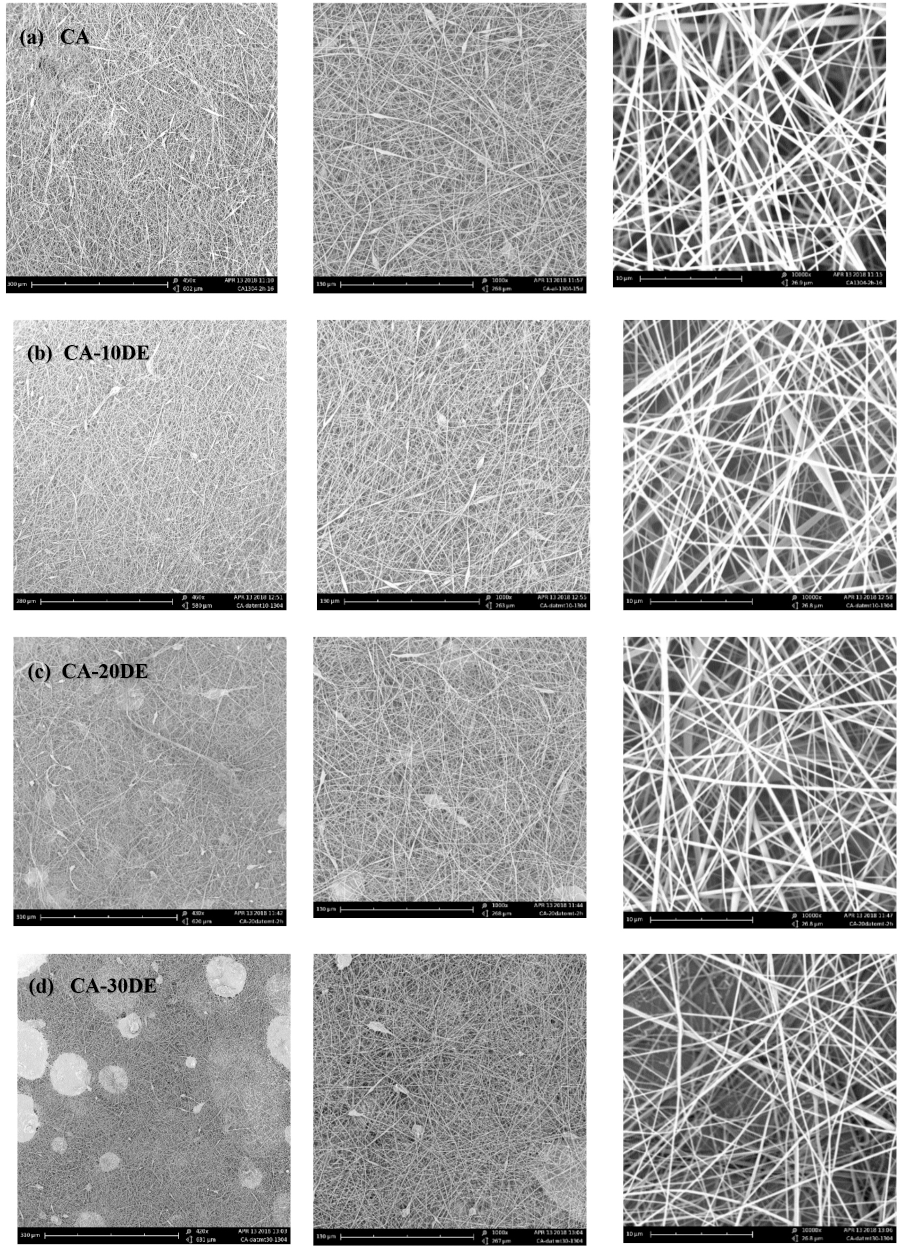
SEM images with ∼430×, 1000× and 5000× magnification of (a) CA, (b) CA-10DE, (c) CA-20DE, and (d) CA-30DE nanofibers.
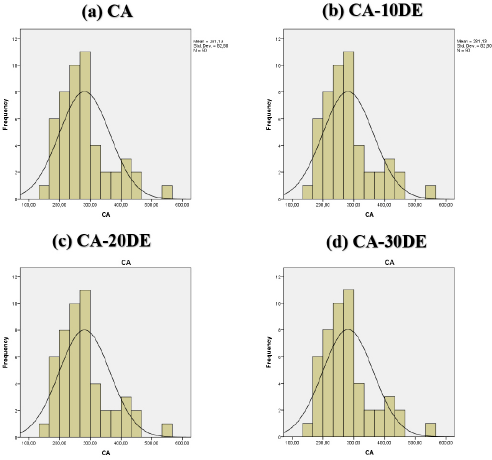
Fiber diameter distribution of (a) CA, (b) CA-10DE, (c) CA-20DE, and (d) CA-30DE nanofibers.
Wastewater Decolorization
To test textile wastewater decolorization, a Reactive Red 141 dye solution was used. To determine the adsorption rate, the adsorption of Reactive Red 141 dye onto the membranes was studied as a function of contact time. Fig. 9 presents the effect of contact time on the adsorption of Reactive Red 141 dye onto the CA, CA-10DE, CA-20DE, and CA-30DE nanofiber membranes. The equilibrium sorption capacity of CA, CA-10DE, CA-20DE, and CA-30DE nanofiber membranes after 24 h was 66.26 ± 3.57, 67.83 ± 3.62, 70.71 ± 3.13, and 72.27 ± 2.90 mg/g, respectively, for an initial dye concentration of 85 mg/L.
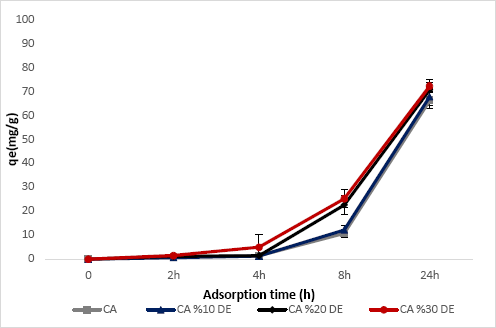
The adsorption capacity qe (mg/g) of Reactive Red 141 for CA, CA-10DE, CA-20DE, and CA-30DE nanofiber membranes at 85 mg/L initial dye Figure 8. The adsorption capacity (qe(mg/g)) of Reactive Red 141 by CA, CA-10DE, CA-20DE and concentrations after 0-24 h.
Initial adsorption capacities were quite low, possibly due to the low wetting character of the membranes. The adsorption capacity qe increased slightly with the increasing DE percentage due to the adsorption capacity of DE. The adsorption process is generally classified as physisorption or chemisorption. During the color removal from the dye solution, both physisorption and chemisorption took place and dyes were absorbed by the nanofibers. In physisorption, Van der Waals forces are effective, and in chemisorption, covalent bonding or electrostatic attraction are effective. Because of the hydroxyl groups still present in the structure of CA due to incomplete acetylation, chemisorption also occurred during color removal.
DEs characterized by a high porosity, low density, and large surface area make them ideal for physisorption. CA/DE nanofibers have a high sorption ability and surface area. Although, having a lower wettability and hydrophilicity, the highly porous structure of CA and CA/DE nanofibers favors Van der Waals force interactions for physisorption. Adsorption studies also indicated that even though CA-30DE nanofibers had a smaller pore size than the other electrospun nanofibers in this study, they still had a high porosity percentage (% porosity).
Swelling and weight loss percentages of the CA, CA-10DE, CA-20DE, and CA-30DE nanofiber membranes are given in Fig. 10. Without DE, the degree of swelling of CA nanofibers was about ∼953%. Swelling percentages decreased to a great extent by DE addition; ∼752, ∼324, and ∼230% for 10, 20, and 30% DE content, respectively, due to the hydrophobic effect of DE. CA nanofibers showed no weight loss, while CA/DE nanofiber membranes showed negligible weight losses of 1.42, 2.72, and 1.14% for 10, 20, and 30% DE content, respectively.
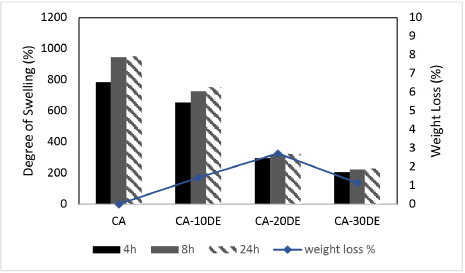
Swelling and weight loss of CA, CA-10DE, CA-20DE, and CA-30DE nanofiber membranes.
Conclusion
In this study, CA- and CA/DE-nanofiber membranes were prepared by electrospinning. XRD was used for phase identification and to determine the characteristic peaks, and XRF was used to determine the elemental composition of DE. According to XRF analysis, SiO2 was the main component (92.930%), and the metal oxides (Al2O3, Fe2O3, CaO, and Na2O) were minor constituents. XRD results were consistent with XRF analysis. The FTIR spectrum of CA/DE nanofibers indicate that the DE was totally embedded inside the CA nanofibers. WCA values of the nanofiber membranes increased from 86.21° to 118.44° Aw- hen the DE percentage increased from 0 to 30%, indicating that neat CA nanofibers were more hydrophilic than CA/DE nanofibers and had a better wetting tendency. To understand the hydrophilic behavior of the nanofiber membranes, the vertical capillary method was used. CA, CA-10DE, and CA-20DE nanofiber membranes showed MFP values of 2.941, 2.681, and 2.408 μm, respectively, with a narrow PSD range. However, the CA-30DE nanofiber membrane showed an MFP value of 0.5014 μm, which was less than that of other CA nanofibers, related to its smaller fiber diameters and stiffer structure. Based on the SEM images, bead free test electrospun nanofibers were produced with greater porosity when compared to syringe membranes. CA nanofibers were produced within the range of 206.31 to 281.13 nm. DE loading significantly decreased the mean nanofiber diameters compared to the neat CA nanofibers, but there was no significant difference between 10, 20, and 30% DE loaded CA nanofibers. The equilibrium sorption capacity of CA, CA-10DE, CA-20DE, and CA-30DE nanofiber membranes after 24 h was found to be 66.26 ± 3.57, 67.83 ± 3.62, 70.71 ± 3.13, and 72.27 ± 2.90 mg/g, respectively, for an initial dye concentration of 85 mg/L. The adsorption capacity qe increased slightly with an increase in DE percentage due to the adsorption capacity of DE. Without DE, the degree of swelling of CA nanofibers was ∼953%. Swelling percentages decreased to a great extent by DE addition which were ∼752, ∼324, and ∼230% for 10, 20, and 30% DE content, respectively, due to the hydrophobic effect of DE. The results show that electrospun CA nanofiber membranes can be used when good hydrophilicity and swelling properties are required. Whenever stiffer membranes with narrower pore sizes are required, CA/DE nanofiber membranes can be used.
Footnotes
Acknowledgment
The author acknowledges the Science and Technology Centre of Pamukkale University for the financial support given to this study (Project No: 2018HZDP007), and would also like to thank HYFIBER-Abalıoğlu Teknoloji for SEM and pore size measurements.