
Abstract
Cellulose acetate was dissolved in trifluoroacetic acid and electrospun onto polypropylene non-woven material. An upstream layer of polypropylene non-woven material was added to form a three-layered polypropylene/cellulose acetate/polypropylene filter. The thickness of the electrospun cellulose acetate layer was varied by changing the electrospinning time. The fabricated filter was then characterized. Cellulose acetate nanofibers were also electrospun onto an aluminum foil collector with the aim of studying the changes in fiber properties when they are electrospun onto the polypropylene non-woven material. The results obtained in this research work indicated that the layer of nanofibers electrospun onto polypropylene non-woven material increased the filtration efficiency of polypropylene non-woven material from 50.23% to 91.29%, but the quality factor reduced by 29.1%. When the cellulose acetate deposition time was increased from 3 h to 6 h, the filtration efficiency further increased to 98.26% and the quality factor increased by 0.6%. A comparison between cellulose acetate nanofibers electrospun using an aluminum foil as the collector and those electrospun directly onto the polypropylene non-woven material indicated that cellulose acetate fibers electrospun onto polypropylene non-woven material had poorer fiber quality properties.
Introduction
Electrospinning is a technique that uses high voltage to form a liquid jet from polymer solutions. Fibers in the nano-scale range are formed as the charged polymer solution is stretched continuously due to electrostatic repulsions of the surface charges and the solvent [1]. This method of using electrical potential to draw fibers was patented in 1934 by Formhals [2]. Since then, electrospun fibers have been used in various fields which include filtration, electrical, and biomedical applications [3]. Many polymers have been electrospun and the polymer of choice and the spinning solution is selected according to the intended application [4].
Cellulose acetate (CA) is a polymer obtained by substituting some of the hydroxyl groups in cellulose. CA has good chemical resistance, is stable and has good solubility in organic solvents [5]. CA also has the ability to selectively absorb low-level organic compounds and toxicity, and hence has found application in filtration especially in cigarette smoke filters [6]. CA nanofibers have been electrospun from various solvents [7–12], and a report of its possible use in filter materials has been published by Zhou et al. [11]. Nanofibers have good filtration properties due to their fine fiber diameter, narrow fiber distribution range, and high surface area. They, however, suffer from one major drawback: nanofibers lack sufficient strength to be used as stand-alone filters. Attempts to address the aforementioned drawback have been done by fabricating multi-layered filter materials, where one of the layers is made up of nanofibers and the other layers are made up of non-woven materials. In multi-layered filtration materials, the nanofibers provide improved filtration properties [13], while the non-woven layers provide support and strength [14]. Using the abovementioned approach, several researchers [15–18] have designed multi-layered filter materials using different polymers (as nanofibers) and a variety of non-woven materials. Dotti et al. [15] used three polymers (poly(ethylene oxide), poly(vinyl alcohol), and polyamide-6) to electrospin nanofibers, which were combined with non-woven polyester material to design filtration material. Nanofibers electrospun from poly(vinyl alcohol), poly(acrylonitrile), and polyamide-66 combined with polypropylene (PP) non-woven material provided an opportunity to study the possibility of using those nanofibers on PP non-woven material to design filtration material [16–18]. The web of nanofibers was reported to provide a much smaller pore size when compared to the pore provided by the non-woven material. Therefore, the addition of the web of nanofibers to the non-woven material produced better filtration material with higher filtration efficiency. The need for higher filtration materials cannot be over-emphasized. Till date the use of CA nanofibers combined with PP non-woven material has not been reported.
Given the good filtration properties of CA fibers, this study’s aim was to fabricate multi-layered filtration material using PP non-woven and CA nanofibers. The fabricated filtration material and the main elements of the filter (CA nanofibers and PP non-woven material) were then characterized.
Experimental
Materials
CA of molecular weight 30,000, acetyl content of 39.8%, and degree of substitution of 2.5 in pellet form were purchased from Shanghai Deng Wei Zhangmutou Plastics. Trifluoroacetic acid (TFA) solvent was purchased from Bepharm Ltd., Shanghai. PP melt blown non-woven material of basis weight 25 g/m2 used in this study was also purchased from local suppliers.
CA solution preparation
CA solution of concentration 15 wt.% was prepared by dissolving CA pellets in TFA. The solution was stirred for 24 h in a sealed glass container, using an electromagnetic stirrer to ensure homogenous mixing.
Electrospinning setup and process
The electrospinning equipment used in this research work had a syringe with a needle having an internal diameter of 0.7 mm. The syringe was mounted onto a syringe pump that was used to regulate the feed rate (kept constant at 0.3 ml/h). The voltage used was 25 kV, and the tip to collector distance was 10 cm. CA nanofibers were first electrospun onto the PP non-woven material using two sets of time: 3 and 6 h. The CA/PP materials were combined with an upstream layer of PP material (see Figure 1) to form a PP/CA/PP-3 and PP/CA/PP-6 for CA material electrospun for 3 and 6 h, respectively. CA nanofibers were also electrospun using an aluminum foil as the collector and were characterized. This was done with an aim to study the changes in the structure of the nanofibers (if any) when the electrospinning collector is varied.
Illustration of PP/CA/PP three-layered filter.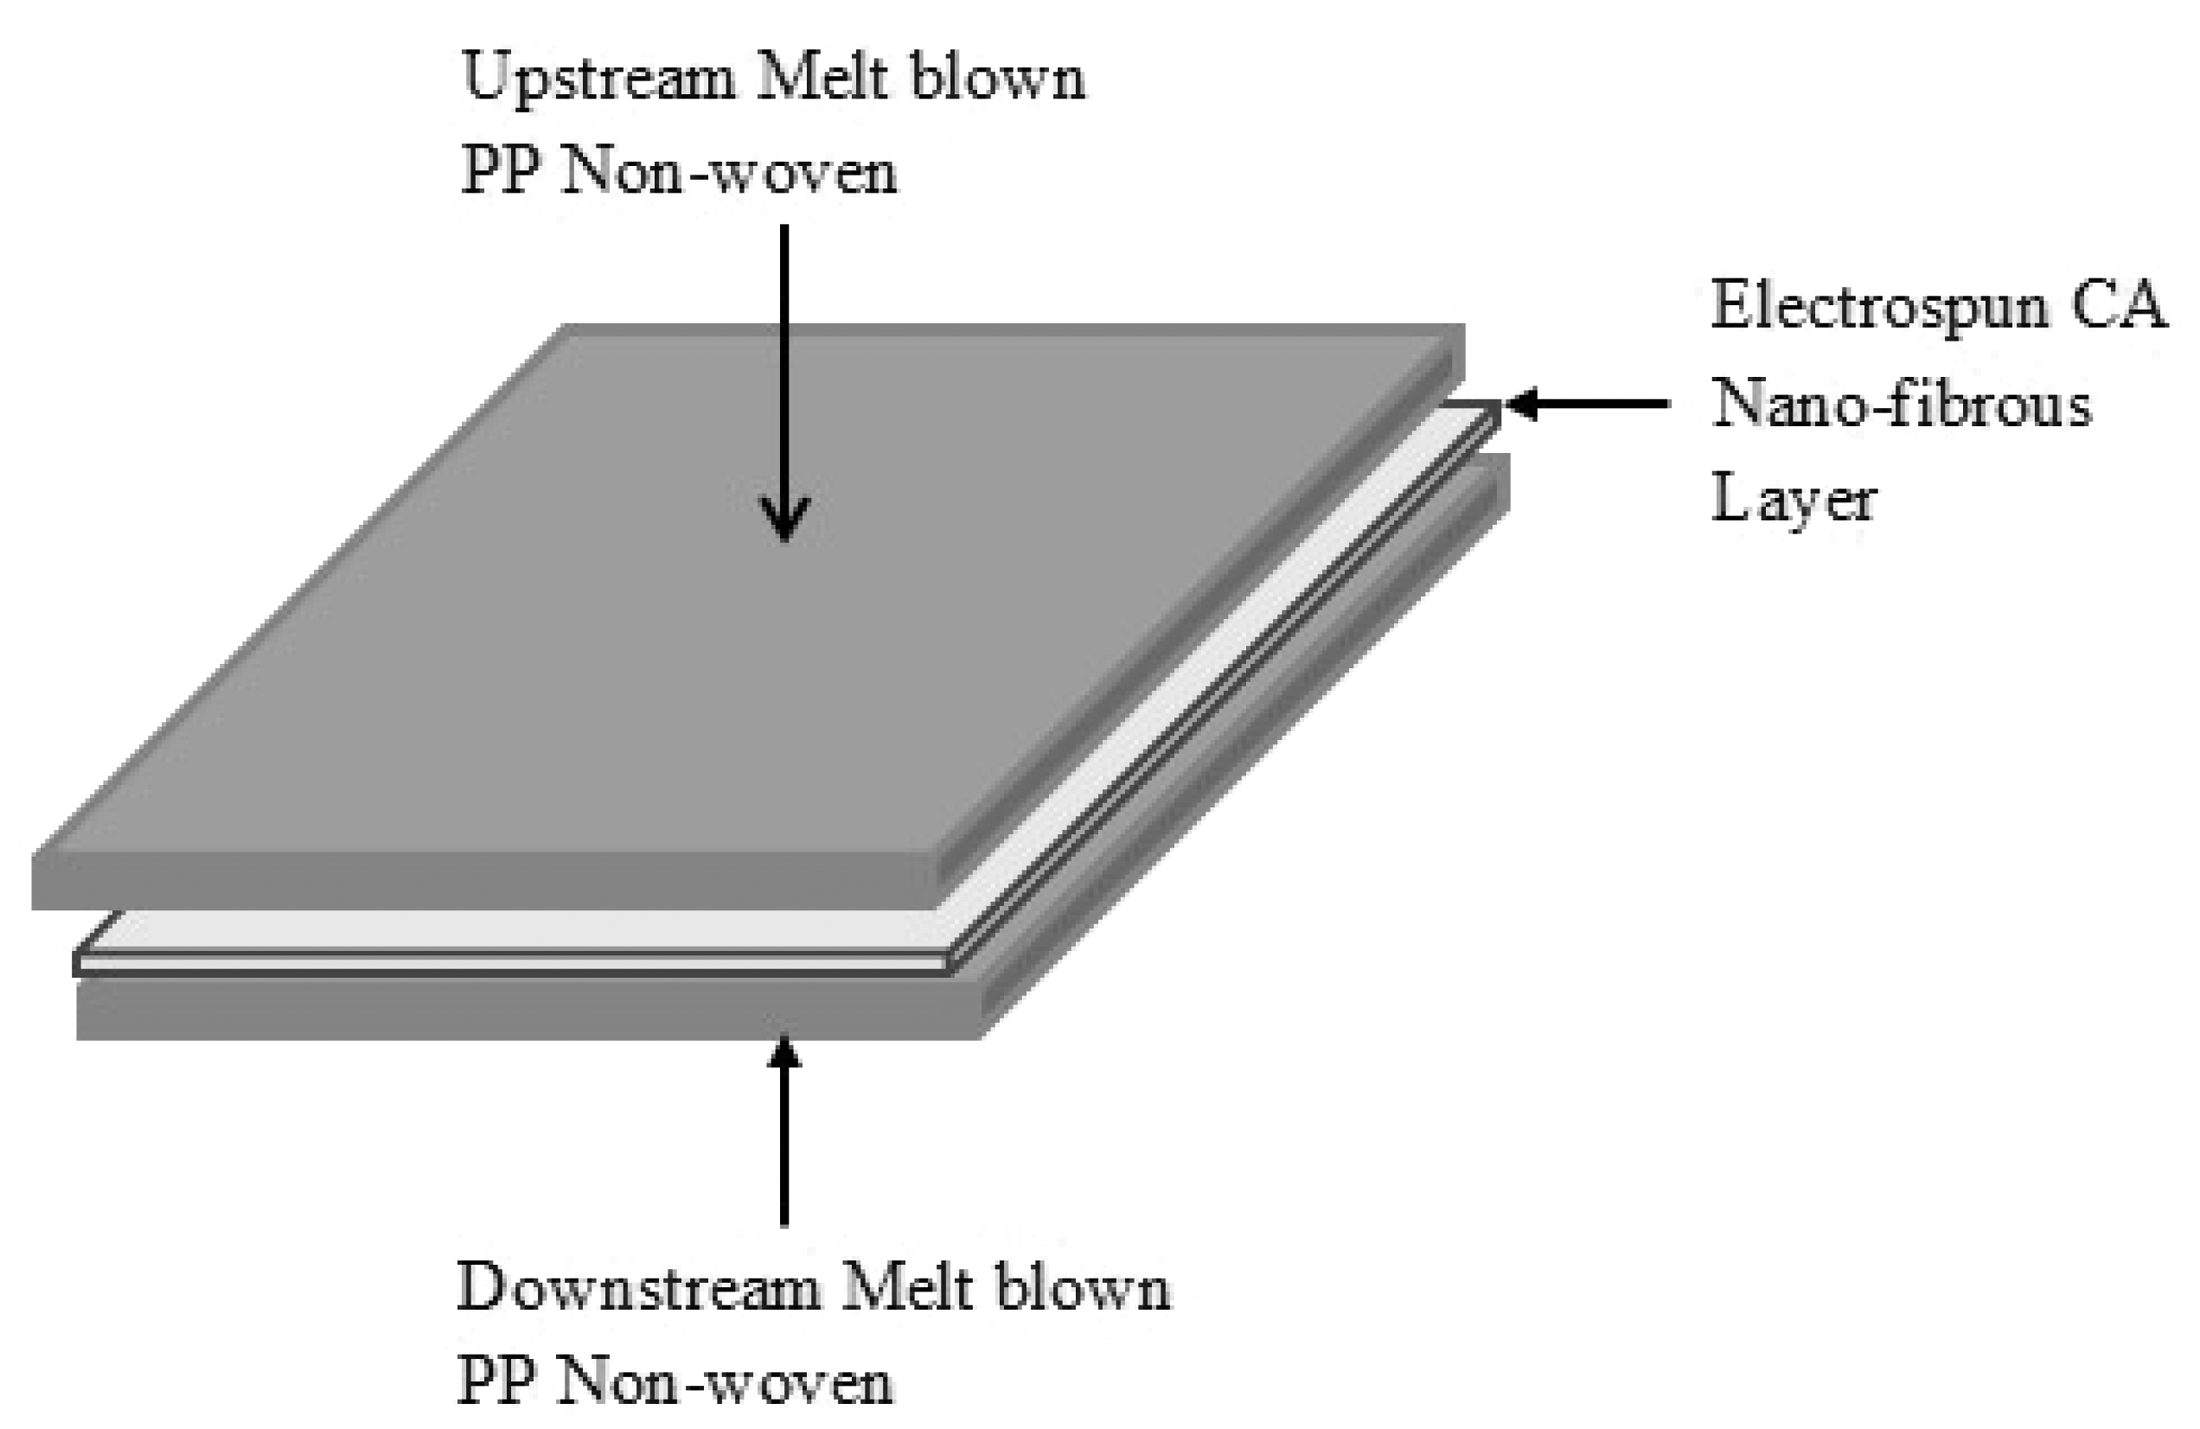
Methods
The morphologies of CA nanofibers and PP non-woven material were observed using scanning electron microscope (SEM) (Quanta 250). The fiber diameters were measured from the SEM images using a measurement tool in Adobe Acrobat X Pro 10.1.2.45 and further analyzed using Origin Pro v8.
The Brunauer-Emett-Teller (BET) surface area of CA nanofibers was calculated from nitrogen adsorption–desorption isotherm. The nitrogen adsorption–desorption isotherm was measured using Micromeritics TriStar II 3020 (V1.03) at 77.350 K.
The pore size distribution of CA nanofibers, PP non-woven filter, and the three-layered filter materials was analyzed using a porometer (Quantachrome Porometer 3G). The porometer uses liquid expulsion technique to measure through pore sizes. A sample of 25 mm diameter was mounted on the machine and wetted on one side using porofil (wetting fluid). Pressure (applied by pumping in gas) was applied to the wetted side of the sample and the resulting flow rate measured. This was done until the sample dried. A dry run (without the sample being wetted) was also done. The dry run and wet run results were used to obtain pore size distribution data, which were analyzed using Origin Pro v8.
Filtration efficiency and pressure drop of double-layered PP non-woven material and that of PP/CA/PP-3 and PP/CA/PP-6 were determined using an Automated Air Filter (Certitest, TSI Model 8130). Five samples were measured for each. This machine uses two photometers to measure penetration of particles through a filter. One photometer is placed before the filter and the other placed after the filter. The signals from the photometers are proportional to the particle mass received. The percentage particle penetration (p) is, therefore, obtained from the ratio of the signal before and after filtration. The filtration efficiency (η) can be obtained from penetration using the expression η = (1 − p). The aerosol used in the equipment was NaCl particles. Before the NaCl particles were used in the Automated Air Filter, they were analyzed using TSI-3934 scanning mobility particle sizer. Examination of the size distribution of NaCl particles generated showed that they were within a mean diameter of 0.26 µm, count median diameter of 0.075 µm, and geometric deviation of less than 1.83, as specified for use in the machine. The flow rate used to test the samples was 32 l/min.
Results and discussion
Fiber morphology and distribution
The CA nanofibers electrospun on aluminum foil and the PP non-woven material were characterized using SEM and the results are given in Figures 2 and 3. The fiber distribution graph showed that the CA nanofibers had a uniform distribution that deviated slightly from a normal distribution curve. The mean fiber diameter ranged from 120 nm to 130 nm and exhibited a standard deviation of 36 nm.
SEM image and fiber distribution graph of electrospun CA nanofibers. SEM image and fiber distribution graph of PP non-woven filter.

The PP non-woven filter material on the other hand had a non-uniform fiber distribution with a mean fiber diameter range of 2 µm to 4 µm as shown in Figure 3. Its standard deviation was 1.81 µm.
The surface area of CA nanofibers
CA nanofibers electrospun using aluminum foil as the collector were tested using BET method and the adsorption–desorption isotherms obtained are shown in Figure 4. From the shape of the isotherm, it can be inferred that the isotherms correspond to type II adsorption. Using International Union of Pure and Applied Chemistry classification, it can be inferred that CA nanofibers have macropores, that is to say the size of the nanofibers ranged from 50 nm to 1 µm [19].
Gas adsorption desorption isotherm of CA nanofibers.
The adsorption–desorption curve is open-ended. Open-end adsorption–desorption curves have been reported to be a phenomenon associated with certain carbon containing materials. This occurs due to changes in the bulk density of the nanofibers, caused by nitrogen adsorption or irreversible nitrogen adsorption. It may also be due to retarded adsorption, where a certain energy barrier has to be exceeded by adsorbing and desorbing molecules [20]. The amount of nitrogen gas physically adsorbed by the pores of nanofiber samples gives an indication of the size and distribution of pores.
A BET plot obtained between relative pressure 0.065 and 0.20 was used to estimate the surface area of CA nanofibers. The BET surface area was then calculated from the slope and intercept of BET plot using BET equation. The BET surface area obtained for the CA nanofibers electrospun using an aluminum foil as the collector was 11.75 m2/g.
CA nanofibers electrospun using acetone/dimethylacetamide were reported to exhibit a BET surface area of 2.9 m2/g [21]; therefore, the BET surface area of the CA nanofibers electrospun in this research work exhibited a much larger BET surface area (11.75 m2/g). It can, therefore, be concluded that CA nanofibers electrospun using TFA as the solvent have a much higher potential in the fabrication of filter material since it has a higher surface area, which is a desirable characteristic in high-efficiency filtration material.
Pore size and distribution
CA nanofibers gathered on aluminum foil collector and double-layered PP non-woven materials were analyzed for pore size and distribution. The graphs are shown in Figure 5. The mean pore size was 0.463 µm and 15.640 µm for CA nanofibers and PP non-woven material, respectively. The pore size distribution for CA nanofibers had a narrower range with the minimum pore size being 0.393 µm and maximum pore size being 0.934 µm. The mean pore size of 0.463 µm confirmed that CA nanofibers contain macropores (50 nm–1 µm).
Pore size and distribution for: (a) CA nanofibers (b) PP non-woven filter.
The PP non-woven material showed a wide pore size range of 10.802 µm and 28.344 µm for the minimum and maximum pore size, respectively. The wider pores and wider pore size distribution range are not desirable for high filtration efficiency filters.
Filtration efficiency
The double-layered PP non-woven and the fabricated three-layered filters were tested for filtration efficiency. The average filtration efficiency results for PP non-woven material, PP/CA/PP-3, and PP/CA/PP-6 were plotted in a graph as shown in Figure 6. The standard deviation was 2.14% and 0.927% for the PP/CA/PP-3 and PP/CA/PP-6 filter materials, respectively. It was evident that the addition of CA nanofibrous layer onto PP non-woven material increased the filtration efficiency from 50.23% to 91.29% for PP/CA/PP-3. In this research work, the pore size for a web of CA nanofibers and PP non-woven material was 0.463 µm and 15.64 µm, respectively. Therefore, the increase in filtration efficiency in the PP/CA/PP-3 filtration material could be attributed to the addition of the CA nanofibers which were characterized by a smaller pore size. Similar results were obtained by other researchers who used other types of nanofibers combined with non-woven materials to fabricate filter materials [16–18].
Graph of average filtration efficiency.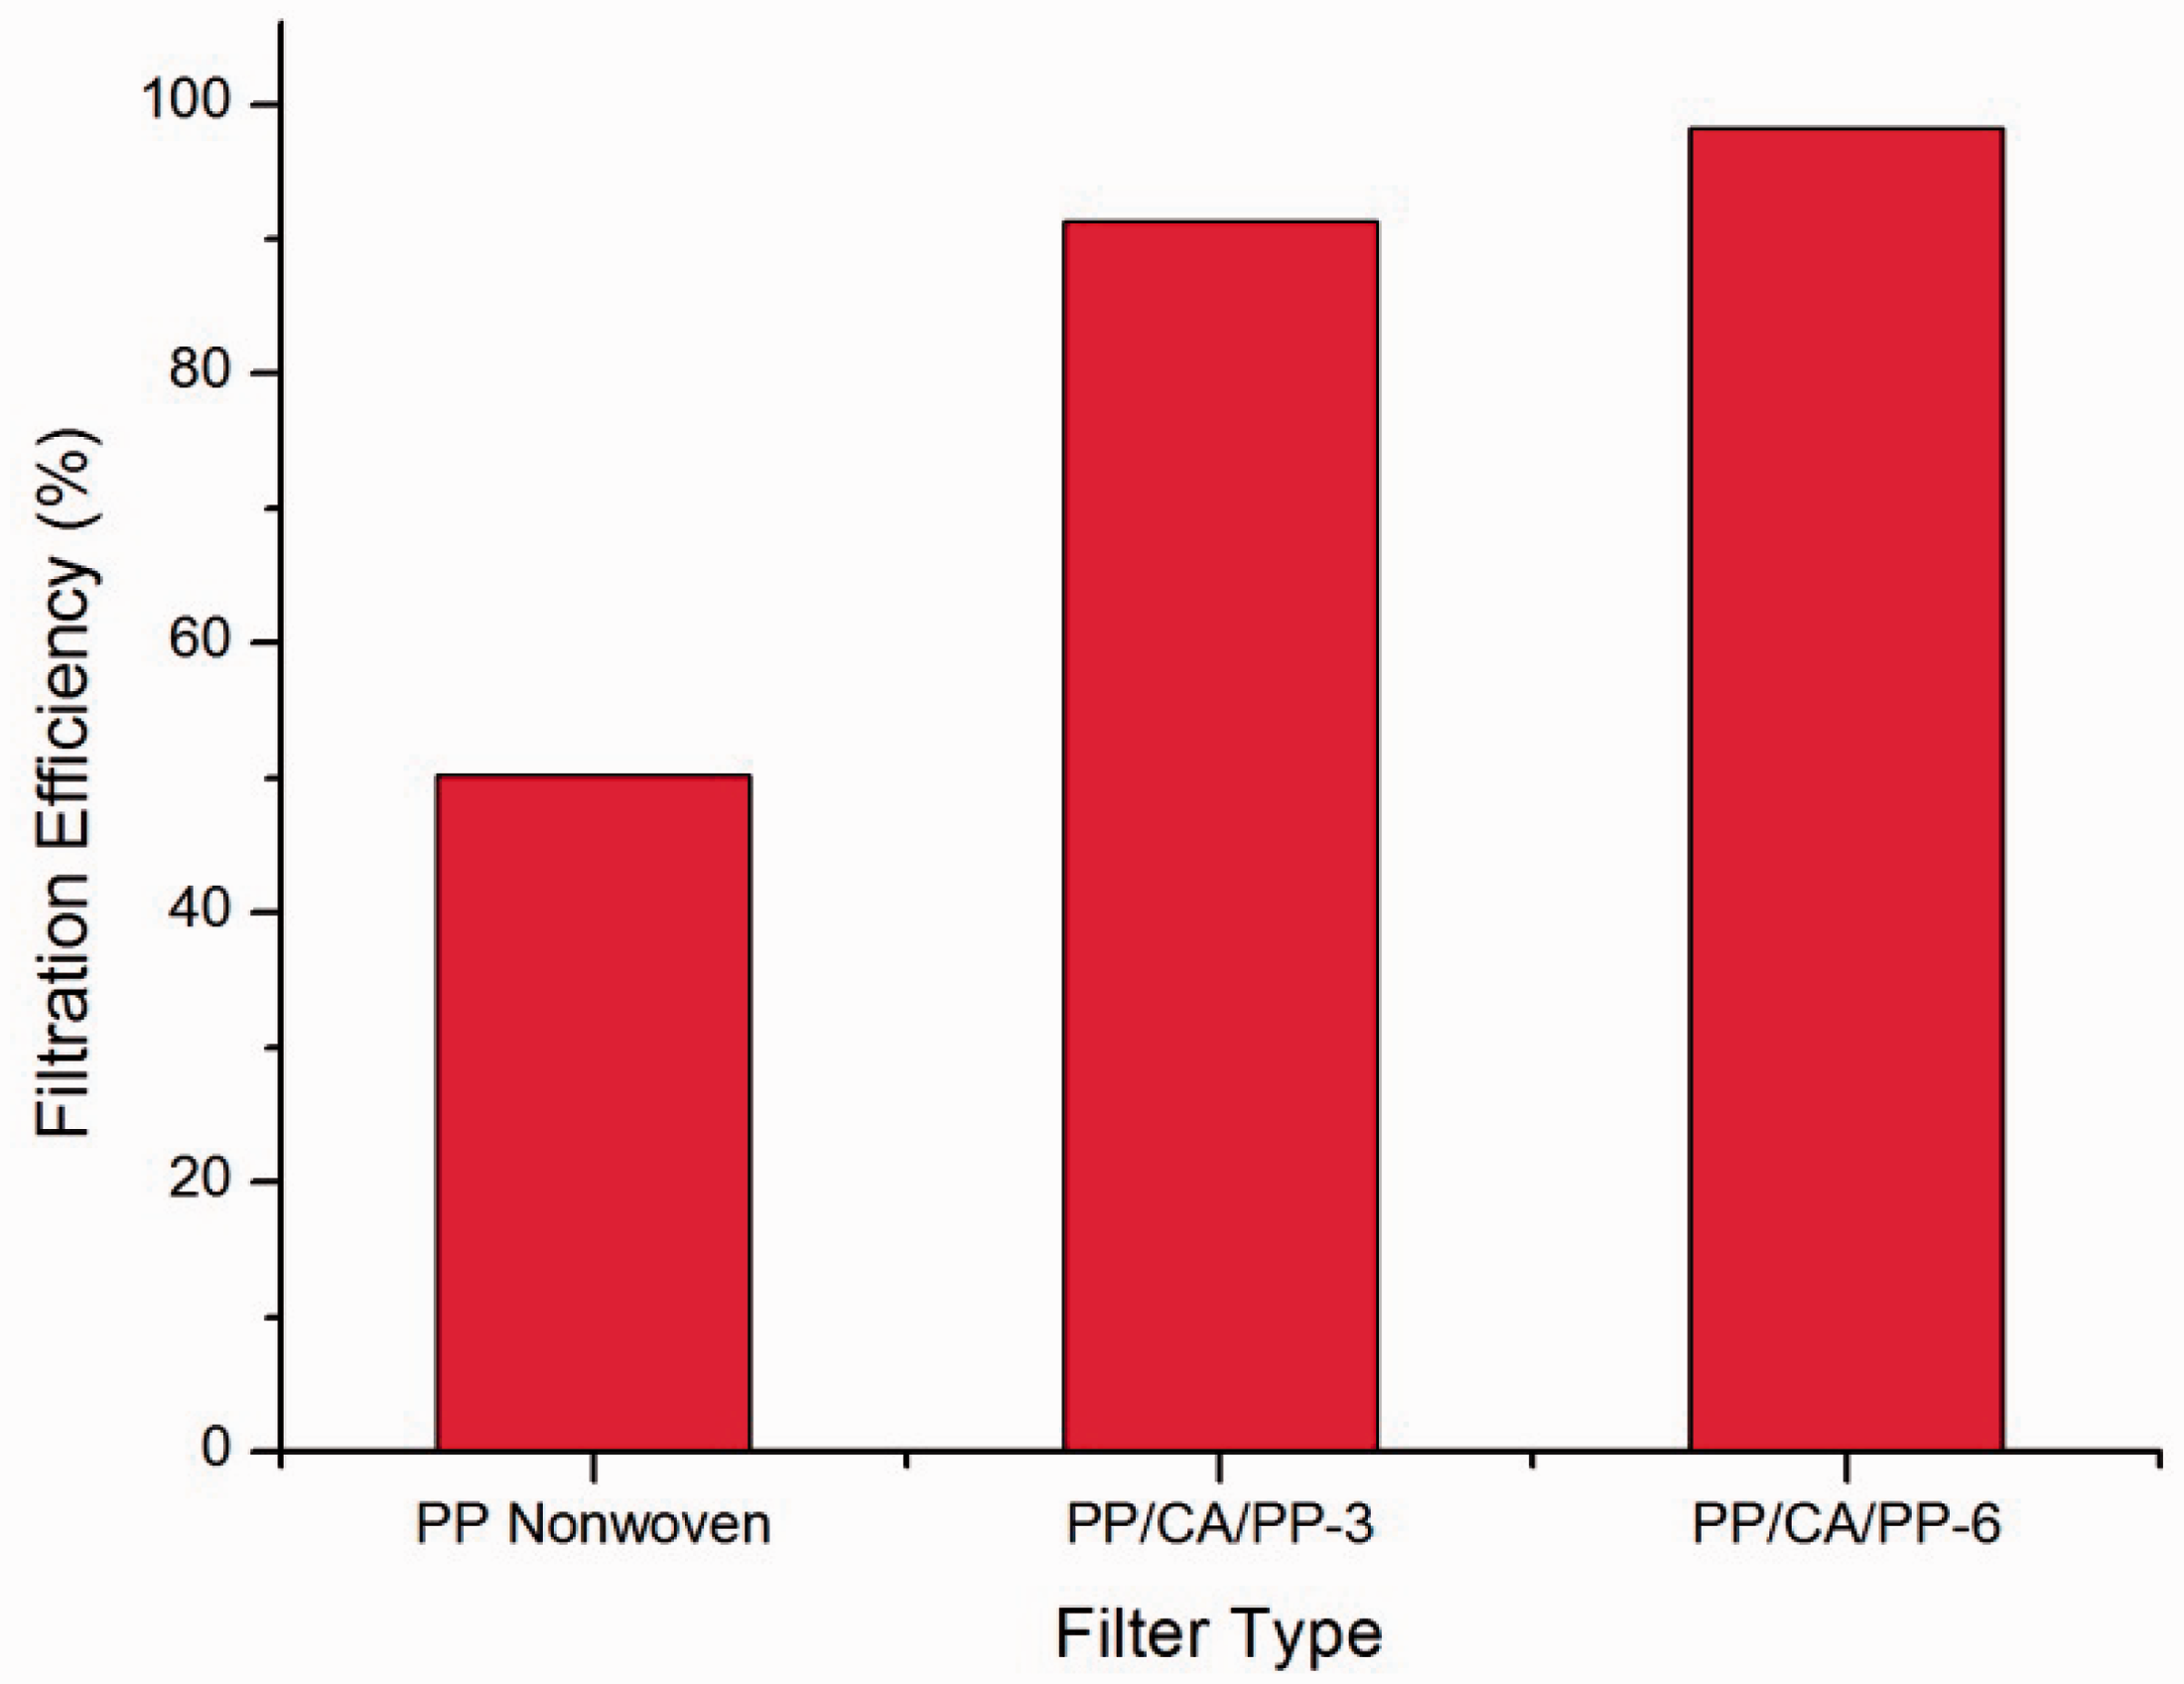
When the thickness of CA nanofibrous layer was increased (by changing the Electrospinning time from 3 h to 6 h), the filtration efficiency further increased from 91.29% to 98.26%. This could be due to the fact that a thicker nanofibrous layer would increase depth filtration, leading to an increase in filtration efficiency. The basis weight of the non-woven increased by 8.6% and by 18.1% when CA was deposited for 3 h and 6 h, respectively.
Many national and international standards for testing particulate filters exist [22]. Several types of aerosols are also available for measuring filtration efficiency, but NaCl is commonly used. Since the machine used in this research work to evaluate the filtration efficiency conforms to BS EN 1822-5: 2009 standards, the efficiency obtained can be compared with the standard recommendations. The filtration efficiency obtained from the three-layered PP/CA/PP-6 material can be classified as an EPA filter of class E11. Since the NaCl particles used had a mean mass diameter of 0.26 µm, for an efficiency of 98.26% (for PP/CA/PP-6) only 1.74% of the NaCl particle managed to penetrate the filter. Given that the filtration efficiency for the PP/CA/PP-3 sample was 91.29% and the penetration was 8.71%, the PP/CA/PP-6 sample can be deemed to be a better filtration material. Therefore, the improvement of the filtration efficiency can be attributed to the increase in the thickness of the CA nanofiber layer.
Filtration involves the combination of different mechanisms. Each filter material combines different mechanisms to efficiently eliminate different particle sizes. Common filtration mechanisms include: direct interception, inertial impaction, and Brownian diffusion. Particles of 1–10 µm are filtered through inertial impaction. This occurs when heavy particles, due to their motion, are thrown onto the fibers of a filter material and are retained due to their high inertia. The heavy particles will be filtered by the non-woven layer. Particles having a size range of 0.3 µm to 1 µm are filtered through direct interception by the nanofibrous layer. This mechanism occurs when particles come into contact with the filter medium and are held by weak forces (van der Waals) and remain trapped. These trapped particles can also be used to trap other particles. Particles of less than 0.3 µm traveling in Brownian motion attempt to go through the fiber and in the process get trapped inside the fiber. This mechanism is called diffusion. It has been reported that nanofibrous layers are responsible for diffusion filtration [23,24]. Considering the characteristic of the PP/CA/PP filter material fabricated and tested in this research work, it can be concluded that the PP/CA/PP filter material can be used as ULPA filter, if the CA nanofibrous layer is increased to enhance diffusion.
Pressure drop and quality factor
Average pressure drop and quality factor results.
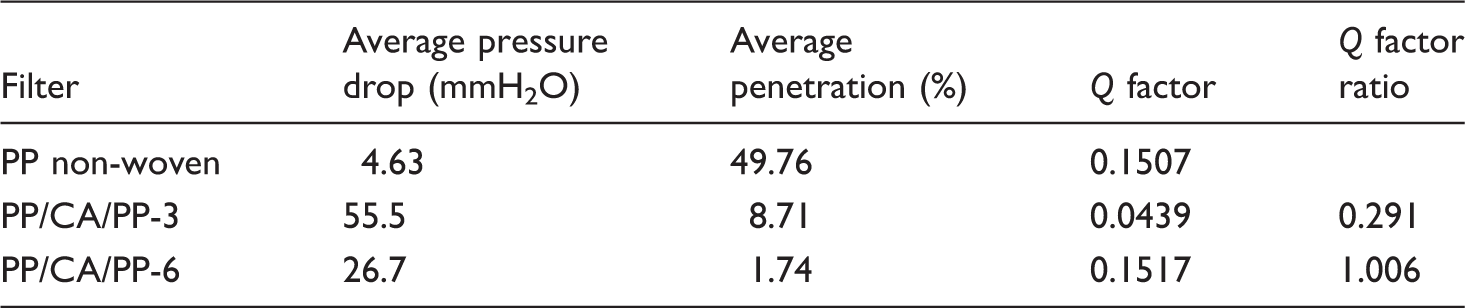
On increasing the deposition time of CA nanofibers in the PP/CA/PP-6 sample, the pressure drop decreased to 26.7 mmH2O. This was a deviation from the generally accepted trend.
Graham et al. [26] reported that for fibers with diameters smaller than 500 nm, slip flow must be considered. Normally, filtration theory assumes a continuous flow around fibers in a filter, with no slip at the surface of fibers. For nano-scale fibers, this assumption becomes invalid because the fibers have a smaller diameter; hence, molecular movement of air molecules is significant when compared to the fiber size and field of flow. It is because of slip (at fiber surfaces) that drag force on the fiber is reduced. Slip flow is also reported to cause more air to flow near a fiber surface, thus causing an increase in filtration efficiency through increase in diffusion and interception [26]. Since the average diameter for CA nanofibers used in the fabrication of PP/CA/PP material was below 500 nm, it can be assumed that slip flow occurred. The reduction in pressure drop from 55.5 mmH2O in PP/CA/PP-3 to 26.7 mmH2O in PP/CA/PP-6 could, therefore, be attributed to slip flow. Increasing the layer of CA in PP/CA/PP-6 (by increasing the deposition time), a denser web of nanofibers was formed on the PP/CA/PP-6 material. Since it is known that slip flow occurs at the fiber surface, it follows that in PP/CA/PP-6, more fibers were exposed at the surface than in PP/CA/PP-3. This could be one of the possible causes of reduced pressure drop in PP/CA/PP-6. As mentioned earlier, CA on PP/CA/PP-3 led to a mass increase of 8.6% and 18.1% in PP/CA/PP-6. This shows that on increasing the deposition time (from 3 h to 6 h) the mass of CA deposited was doubled. Although the deposition of CA appeared to be uniform, there might have been slight variations throughout the filter since electrospinning jet is random. This slight unevenness in deposition of CA could also have caused a reduction in pressure drop in PP/CA/PP-6.
To further understand the performance of the filter samples the Quality factor (Q) was calculated, using the values of average pressure drop and average penetration (1-average filtration efficiency). This quantity (equation (1)) is unit-less and measures the performance of a filter. A larger Q factor indicates a better filter performance.

The results of Q factor are shown in Table 1. The Q factor shows that despite the increase in filtration efficiency in PP/CA/PP-3, the performance is still low when compared to that of PP non-woven without the nanofibrous layer. This is because a good filter is not only evaluated by its filtration efficiency but also by its pressure drop. CA nanofibrous layer electrospun for 3 h gave a higher pressure drop. When the nanofibrous layer was electrospun for 6 h in PP/CA/PP-6, the Q factor increased. A high Q factor indicates a filter of better performance. From Q factor ratios, comparison of the PP non-woven material and the PP/CA/PP-6 showed an improvement of 0.6%. This seems like a small improvement, but when the filtration efficiencies are compared, PP/CA/PP-6 filter material would be adjudged to be a better filtration material.
Further analysis of PP/CA/PP-6
Since the three-layered filter obtained by electrospinning CA onto PP non-woven for 6 h (PP/CA/PP-6) had a better filtration efficiency and a lower pressure drop, further analysis of pore size and pore size distribution was undertaken and the results are given in Figure 7.
Pore size and distribution for PP/CA/PP-6.
The mean pore size for the PP/CA/PP-6 material was 1.267 µm, and the pore size range was 0.710 µm and 2.577 µm for minimum and maximum pore size, respectively.
Comparing the pore size of the CA nanofibers electrospun onto aluminum foil, which was 0.463 µm, the PP/CA/PP-6 can be adjudged to be a poorer filtration material; however, CA nanofibers cannot be used as stand-alone filtration material due to poorer mechanical strength. A double layer of PP non-woven recorded a pore size of 15.64 µm, which implies that the PP/CA/PP-6 is a better filtration material than a double layer of PP non-woven material.
The pore size distribution for the PP/CA/PP-6 material was wider (0.393–0.934 µm for CA nanofibers electrospun on aluminum foil and 0.710–2.577 µm for CA nanofibers electrospun onto PP and used in the PP/CA/PP-6 filter material).
An analysis of the properties of the CA nanofibers electrospun directly onto the PP material and used in the fabrication of the PP/CA/PP-6 material was undertaken with an aim of trying to understand the contribution of the CA nanofibers in the filtration property of the PP/CA/PP-6 material.
The SEM image and fiber distribution of CA electrospun directly onto the PP non-woven material are given in Figure 8. The CA nanofibers deposited onto PP non-woven material to form PP/CA/PP-6 filter had larger diameter ranging from 300 to 400 nm compared to those electrospun onto aluminum foil which were 120–130 nm. They also had a non-uniform fiber distribution with a wider range. The difference in CA nanofiber morphology, pore size, and distribution, could be attributed to the differences in collector properties.
SEM image and fiber distribution graph of CA nanofibers deposited on PP non-woven.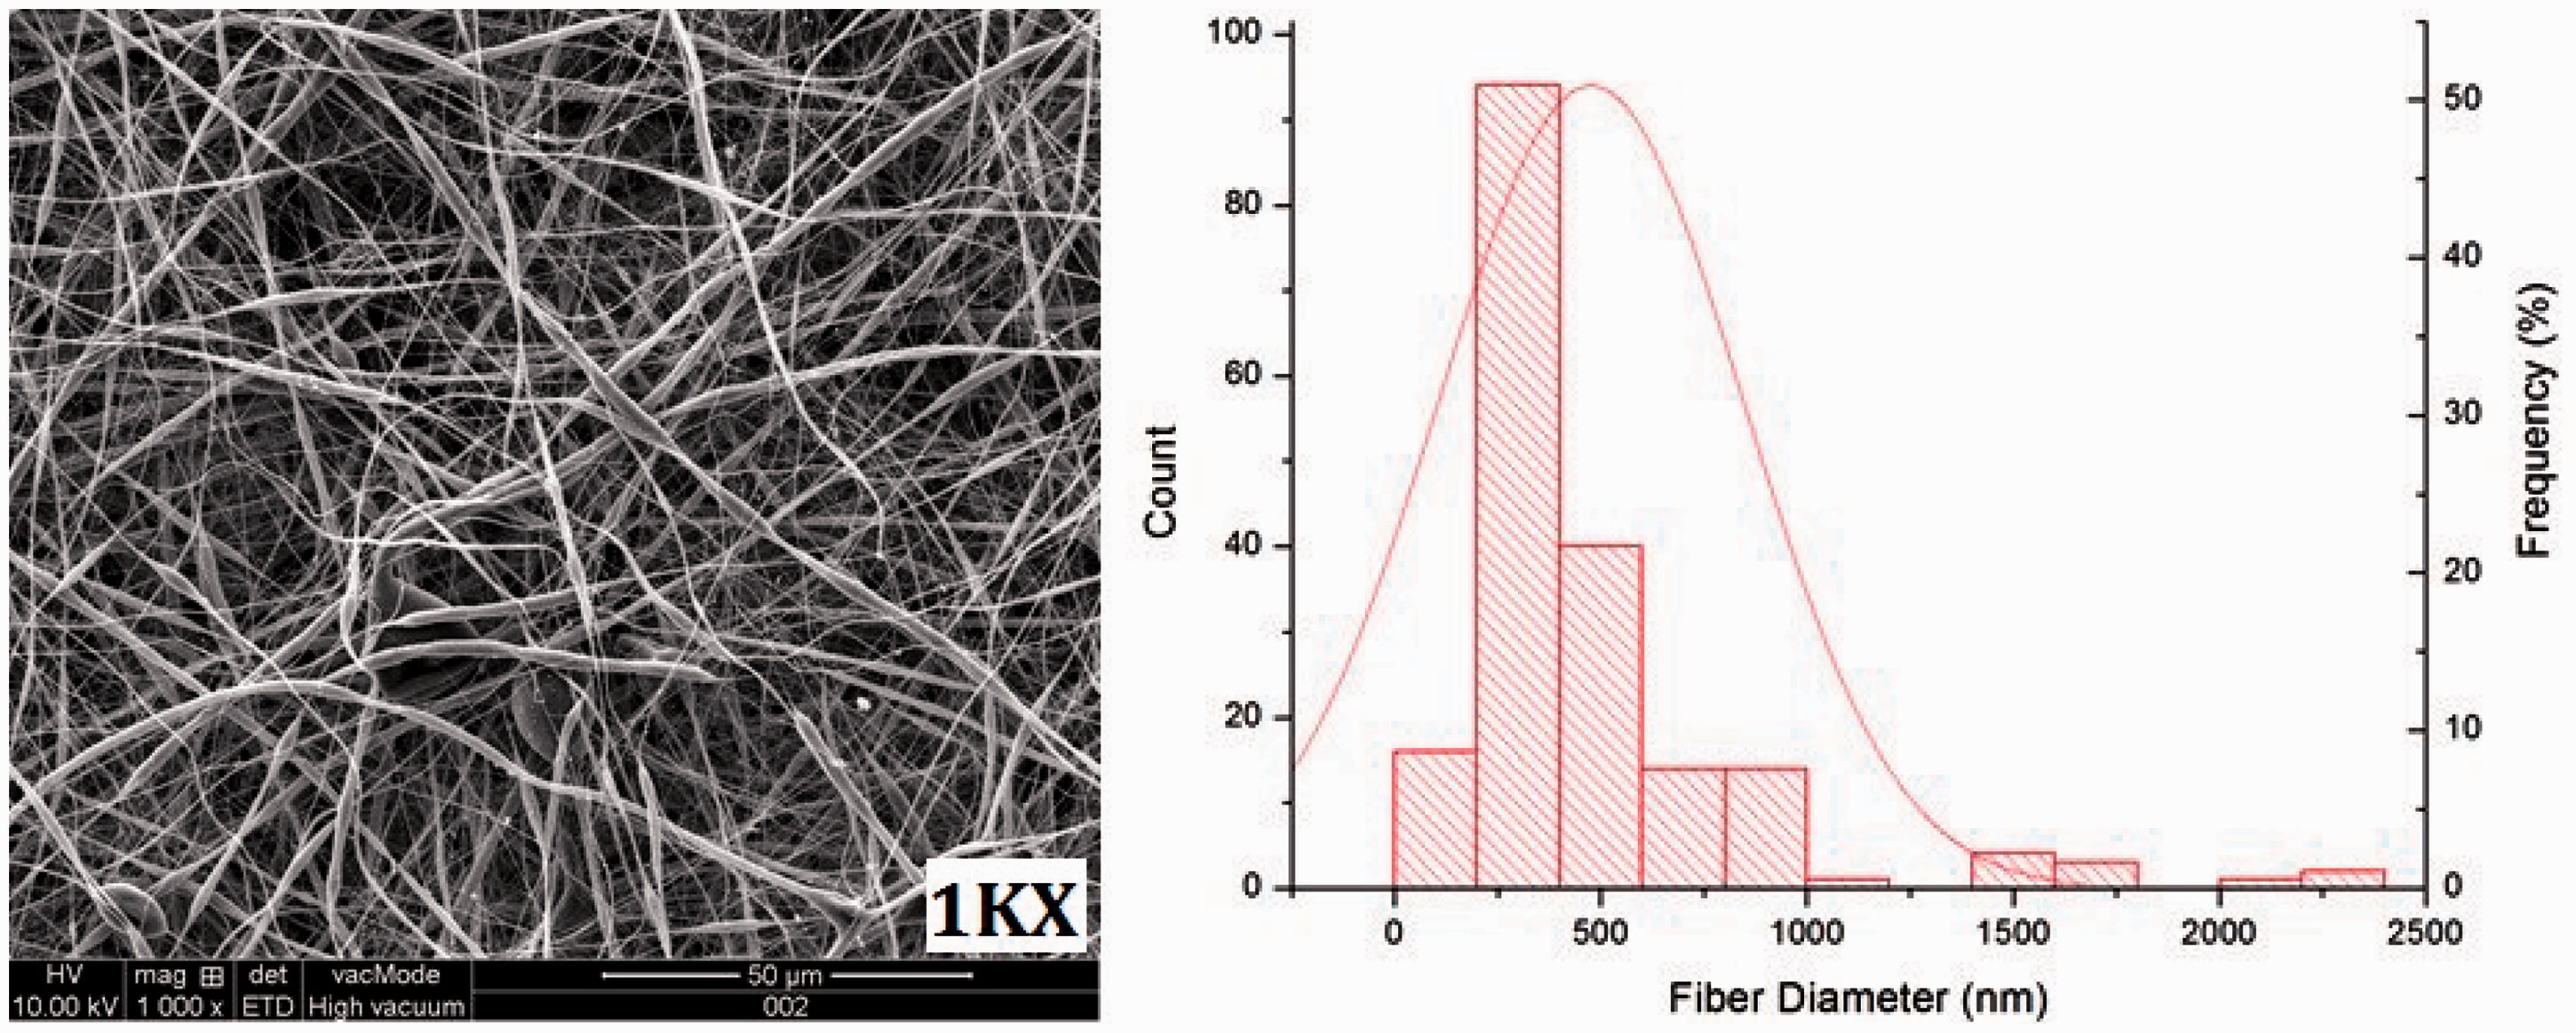
It is known that polymer solutions travel towards the collector screen of an electrospinning equipment because of charge differences. The dissipation of the residual charge determines how fibers interact with each other and their arrangement in the membrane. Non-conducting surfaces tend to get less fiber deposition, leading to lower packing density. This is due to the accumulation of repulsive forces on the surface of a non-conducting collector. For collector with higher conductivity (like aluminum foil), charges are easily dissipated thus allowing attraction of more fibers. The porosity of the collector may also affect the deposition of nanofibers on a collector screen. Porous materials produce low packing density compared to smooth surfaces like foils [4,12]. Due to the above reasons, the CA nanofibers electrospun onto aluminum foil had different fiber morphology, pore size, and pore size distribution when compared to CA electrospun onto PP non-woven collector, which was porous and had lower conductivity.
Conclusion
The electrospinning of CA nanofibers and its use in high efficiency filtration were investigated. According to the results obtained in this research work, it can be concluded that the increase in the thickness of the CA nanofiber layer improved filtration efficiency. Pressure drop was found to reduce at high CA deposition time. Based on the performance of the PP/CA/PP filter, it was adjudged to be a high-efficiency filtration material. When the nanofibers were electrospun onto non-woven material during fabrication of the PP/CA/PP filter, the properties of the CA nanofibers were adversely affected compared to those electrospun using an aluminum foil as the collector surface.
Footnotes
Declaration of Conflicting Interests
The author(s) declared no potential conflicts of interest with respect to the research, authorship, and/or publication of this article..
Funding
The author(s) received no financial support for the research, authorship, and/or publication of this article.