
Abstract
This paper presents a quantitative analysis method for determining Tencel G100 (lyocell) fiber and bamboo-based rayon content, and that of their blends, using a formic acid/zinc chloride dissolution procedure. Sodium dodecyl sulfonate was used as the cleaning solution. A standard curve was generated to measure fiber content. The application of this method provided a means of quantifying two regenerated cellulosic fibers.
Introduction
Lyocell is processed using a special environmentally-protective method within a sealed, circulating system. The wood pulp raw material is directly dissolved in N-Methylmorpholine N-oxide (NMMO), and from this, the spinning glue size is spun into the textile fiber using the NMMO spinning process. 1 Lyocell is considered a typical “green” fiber. 2 It can be crosslinked during the production process or used as is without crosslinking. Crosslinked lyocell has different properties than ordinary lyocell. 3 Crosslinked lyocell fabric is not a fibrillation fiber. It is usually used to make light fabrics, such as bed sheets and garments such as trousers, with minimal pilling. Ordinary lyocell is a fibrillation fiber and usually used to make peach-skin style clothing (e.g., underwear). At present, most lyocell fiber in the market comes from the Lenzing Group.
Bamboo-based rayon 4 is made from bamboo pulp and its production process is similar to viscose fiber. It is one type of regenerated cellulose fiber and has unique properties, for example solubleness, 5 deodorizing, hygroscopic, and wet permeable functions. 6 It has extensive uses in underwear, towels, stockings, and bed sheets.
The production technology processes of lyocell and bamboo-based rayon are different, so their physical properties and usages are dissimilar. However, both fibers are regenerated cellulosic fibers, and therefore have similar chemical properties, making them difficult to quantify when used together in the same fabric. 7 According to previous studies8-10 for regenerated cellulose, this paper presents a quantitative analysis method for determining Tencel G100 (lyocell) and bamboo-based rayon fiber content, and that of their blends, using a formic acid/zinc chloride dissolution procedure.
Experimental
Sample Preparation
Tencel G100 (lyocell) from Lenzing and bamboo-based rayon (Hebei Jigao Chemical Fiber Co. Ltd) undyed fibers were used. The fibers were weighed after drying and the lyocell was mixed with the bamboo-based rayon in proportions of 1, 5, 10, 20, 30, 40, 60, and 100% lyocell.
Reagents
Pulverous zinc chloride (16 g, Tianjin Zhiyuan Chemical Reagent Co. Ltd.) was added to formic acid (74 g, Tianjin Zhiyuan Chemical Reagent Co. Ltd.), with water added to give a final weight of 100 g, to form the zinc chloride/formic acid reagent. Ethylic acid (40 mL, Tianjin Yongda Chemical Reagent Co. Ltd.) was diluted to 1 L with water. Sodium dodecyl sulfonate (1 g, Tianjin Yongda Chemical Reagent Co. Ltd.) was diluted to 1 L with water. Sodium hydrosulfite (5 g, Tianjin Yongda Chemical Reagent Co. Ltd.) was diluted to 100 mL with 70 °C water—this solution should be used as soon as possible.
Equipment
A dehydrator was filled with allochroic silica gel. Analytical balance accuracy was 0.0001 g or better than 0.0001 g. The drying oven temperature was kept at 105 ± 3 °C. One water bath shaker temperature was kept at 42 ± 1 °C, and the other one was kept at 70 ± 2 °C. Their oscillation frequency was 100 times/min. A 60∼65-mesh hemispherical stainless-steel strainer was used.
Procedures
Before the experiment, the samples should be pulled into yarns. The length of the yarns was 20-30 mm. Before dissolving, as a general procedure, any dyed samples to be tested (1 g) should be decolorized in sodium hydrosulfite solution (100 mL) at 70 °C for 10∼20 min. Then, a sample (∼1 g) was placed in a conical flask containing the formic acid/zinc chloride reagent (100 mL solution/g of sample), the flask covered, and then shaken for 60 ±1 min in a 42 ± 1 °C water bath shaker. After the reaction, the sample was poured into the stainless-steel strainer. Ten the remaining jelly-like colloidal material was collected using glass rods or tweezers and put back into the conical flask. The sodium dodecyl sulfonate solution (200 mL solution/g of sample) was poured back into the covered conical flask at ambient temperature. The covered conical flask was oscillated vigorously and the jelly-like colloidal material became fibrous. Next, the fiber was poured into the stainless-steel strainer. Ten the above steps were repeated once again. The remaining fiber (composed of lyocell) was rinsed with running water, and the cleaned fiber suspended in 50 mL of dilute ethylic acid water for 10 min. After cleaning in running water, the fibers were rinsed with 200 mL distilled water, put in a weighing bottle, dried, and weighed.
Results and Discussion
Standard Curve Method Plotting
The application of the standard curve method reduced errors caused by the environment's temperature, reagent and instruments used, and human factors, to a minimum 8 which avoided the shortcomings of the d-value method.
The seven samples containing 5% to 100% lyocell mixed with the bamboo-based rayon were processed according to the above procedure. The results are given in Table I.
Lyocell Content (5 to 100%) in Lyocell/Bamboo-Based Rayon Mixture Standards
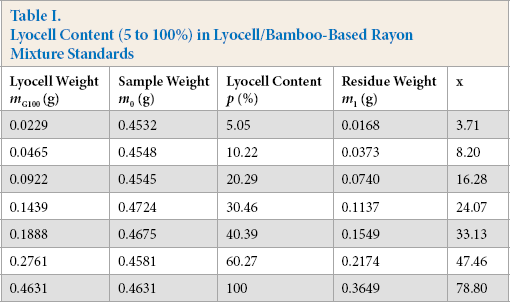
An alternative is to plot a p-x curve, where p is the initial percent weight content of lyocell used and x is the percent of the residual weight obtained as determined by Eq. 1.
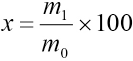
m1 is the residue weight and m0 is the initial sample weight. A plot of this graph is shown in Fig. 1.
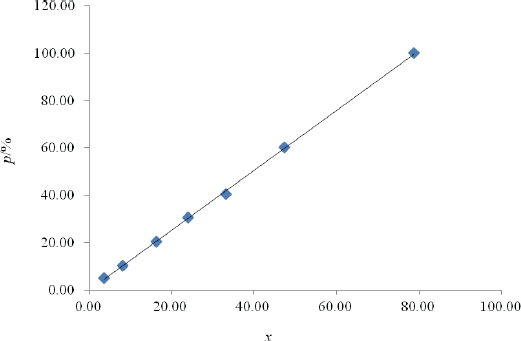
Plot of percent residual lyocell weight vs. percent initial lyocell weight for lyocell/bamboo-based rayon mixtures.
Fig. 1 demonstrates a linear relation between p and x that can be expressed as Eq. 2. The correlation coefficient was 0.9996.
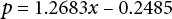
Eq. 2 can be used to quantify lyocell content in lyocell/bamboo mixtures. The more general form of the expression is given in Eq. 3.

k is the slope of the standard curve and b is the p-intercept of the standard curve. Since b ≠ 0, errors existed in the measured values.
Detection and Quantitation Limits
A total of six samples each of 1% and 5% lyocell fiber mixed with bamboo-based rayon were processed according to the experimental procedure, using a bath ratio of 1:100. The results are given in Table II.
Lyocell Content (1% and 5%) in Lyocell/Bamboo-Based Rayon Mixture Standards
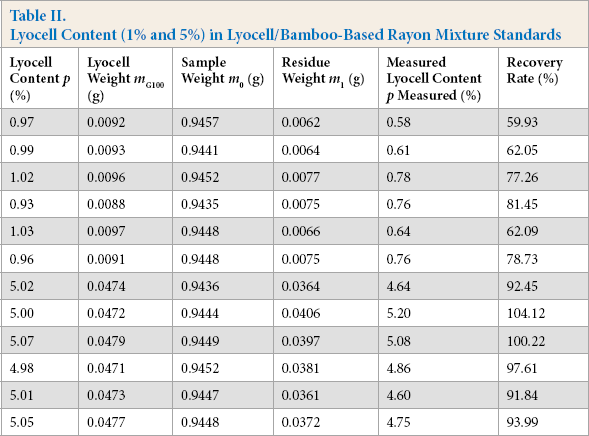
Based on the results in Table II, 1% was identified as the detection limit of the method. The results showed considerable variability between values for the 1% samples, whereas the values for the 5% samples were consistent. Considering analytical balance errors, 5% lyocell was identified as the quantitative limit of the method.
Method Robustness
Extraneous factors (i.e., temperature, time, bath ratio, and oscillation frequency) impacted the results. Samples with a lyocell content of 60% were dissolved in formic acid/zinc chloride reagent, with changes in the experimental conditions, to verify the influence of the various factors as a test of method robustness.
Based on the robustness test method in the AOAC Guidelines for Signal Laboratory validation, 11 seven factors of the experiment were selected, and two different levels of each factor were chosen. The robustness determination was carried out in eight experiments. The results are given in Table III.
Procedure Robustness Experiments
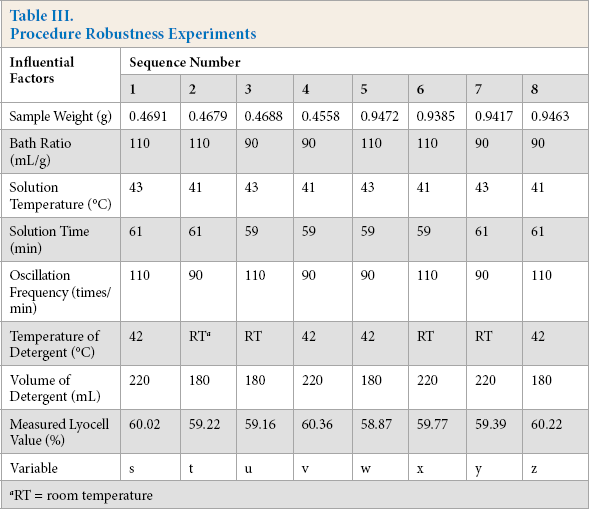
RT = room temperature
The eight robustness experiments were divided into two groups to test the influence of every factor. The influence of the first factor (sample weight) could be calculated by the difference between 0.25(s + t + u + v) and 0.25(w + × + y+ z) and was named d1. The results of difference test statistics are shown in Table IV.
Statistics of Influence Factors
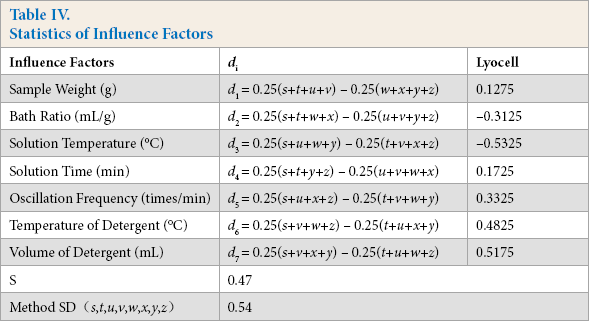
A comparison of di and method standard deviation (SD) indicates that if the d i value was greater than two times the method SD, this influence factor had a significant effect on the method. In this robustness experiment, every d i value was less than two times the method SD, indicating that the seven influence factors considered had little effect on experimental results when they were changed within the restricted scope of this robustness test (Table III). The standard deviation caused by environmental factors is given by Eq. 4.
The smaller the value of S, the less the influence of environment factors were on the method.
Accuracy
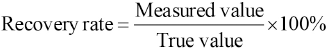
Accuracy refers to the closeness between the measured results and the true values. It is generally indicated by sample recovery rate as shown in Eq. 5.
Experimental data from lyocell/bamboo-based rayon mixture (containing 5,10,40, 60, and 100% lyocell) dissolutions were analyzed by the standard curve method and the results given in Table V.
Accuracy Results
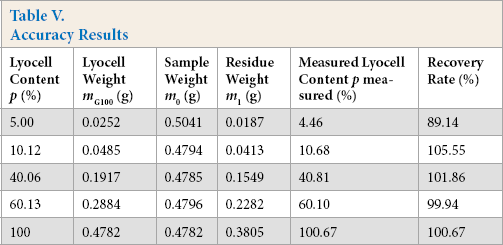
The sample recovery rate was in the 89 to 106% range and the absolute errors between the actual content and measured content of lyocell were less than ±1%, which met the requirements for fiber quantitative analysis.12-14
Precision
Lyocell/bamboo-based rayon samples composed of six samples each containing 5, 60, and 100% lyocell were processed according to the experimental procedure. The results are shown in Table VI.
Precision Results
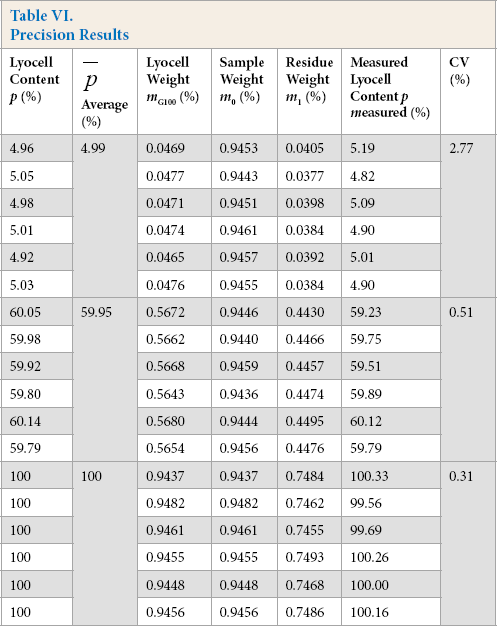
A t-test was used to evaluate the results. The statistics of dispersion were then calculated; t5% = 0.147, t60% = 1.693, and t100% = 0.01. These three values were less than t0.05/6 = 1.943, which showed that there were no significant differences between measurement results for samples of different proportions and average value.
External Laboratory Accuracy and Precision
This method was verified by several standard testing laboratories using standard curve methods. Lyocell/bamboo-based rayon samples composed of six samples each containing 5% and 80% lyocell were processed according to the experimental procedure by each external laboratory. The results were shown in Table VII.
External Laboratory Accuracy and Precision Results
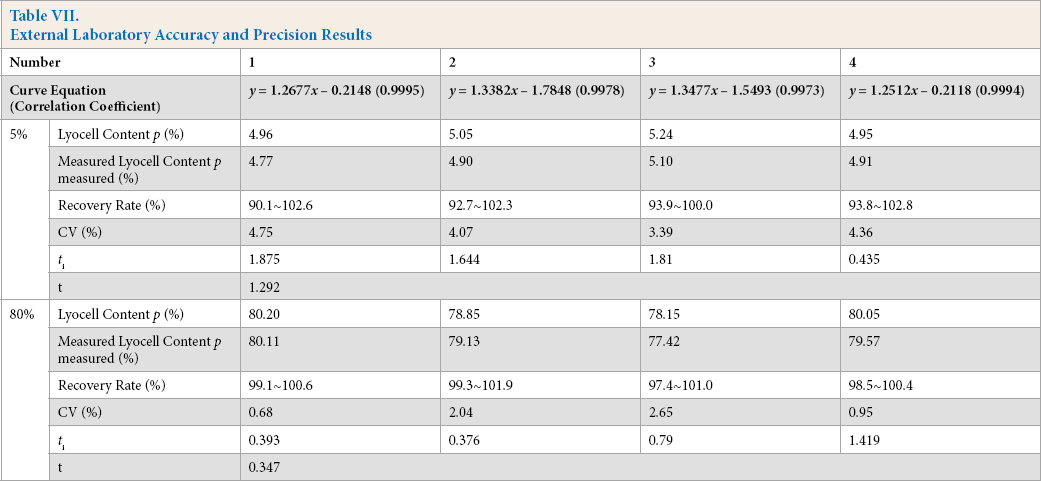
The results show that for the two kinds of samples, the sample recovery rate was between 90% and 103%. The ti value from each laboratory was less than t0.05/6 = 1.943 both for 5% and 80% samples. The calculated t values of the 24 groups of experimental data from four laboratories were 1.292 for 5% and 0.347 for 80% lyocell, which were both less than t0.05/24 = 1.711. Therefore, no significant differences between determination results for samples containing 5% and 80% lyocell and the universal mean were found among laboratories.
Conclusion
Tencel G100 (lyocell) and bamboo-based rayon are both regenerated cellulosic fibers, and their structures and properties are similar. Although it is difficult to quantify them, this paper offers a solution—the result of a large number of experiments.
The experimental conditions used to quantify the mixture of lyocell and bamboo-based rayon included a formic acid/zinc chloride dissolution procedure, a bath ratio of 100 mL/g of fibers, a temperature of 42 °C for 60 min, and an oscillation frequency of 100 times/min. The colloidal material was then cleaned in a sodium dodecyl sulfate solution. The standard curve method was used to process the data, which is a good way to decrease errors caused by operators, environment temperature, reagents, and instruments, and to give accurate results.