
Abstract
This paper presents a quantitative analysis method for determining Tencel A100 (lyocell) fiber and viscose fiber content, and that of their blends, using a formic acid/zinc chloride dissolution procedure. Ultrasonic treatment was used in this procedure. A standard curve was generated to measure fiber content. This minimized errors caused by laboratory temperature changes, reagents and instruments used, and human factors.
Keywords
Introduction
Regenerated cellulose fibers have similar molecular structures and properties, making quantitation among these related fibers a challenge for analysis. Dissolution methods are traditionally used for quantitative analysis of textile fibers.1,2 Lindman discussed the dissolution mechanism of cellulose fibers, which was of great significance for identification and quantitative analysis of regenerated cellulose fibers. 3 However, use of a dissolution method to quantify lyocell fiber and viscose fiber blended products has not been reported. AATCC Test Method (TM) 20A, is a quantitative analysis method that can distinguish between cotton and regenerated cellulose fibers in mixtures. 1 Zhaowen stated that lyocell fiber and Modal fiber could be identified using the formic acid/zinc chloride dissolution process, but pointed out that this method could not be used to quantify the two fibers in mixtures. 4 Existing analysis methods for regenerated cellulose fibers and their mixtures include microscopic1,5 and spectrophotometric 6 methods. But these methods proved to be inadequate and incapable of quantitating regenerated cellulose fiber mixtures.
Previously, a qualitative method for identifying Tencel A100 (lyocell) and viscose content in mixtures was developed. 7 In the current work, a standard curve was produced from data obtained by using the formic acid/zinc chloride dissolution process to quantitatively distinguish Tencel A100 (lyocell) and viscose fibers, separately and in blends, under certain conditions. Results were obtained in a manner that reduced errors, and that were more accurate than the d-value method.
Experimental
Sample Preparation
Tencel A100 (lyocell) from Lenzing and viscose (Shanghai Textile Industry Institute of Technical Supervision standard) fibers (split into individual fibers) were used. The fibers were weighed after drying and the A100 fiber was mixed with the viscose fiber in proportions of 0.5, 5, 10, 15, 20, 25, 30, 40, 60, and 100% (all A100 fiber).
Reagents
Pulverous zinc chloride (20 g) was added to formic acid (68 g), with water added to a final weight of 100 g to form the zinc chloride/formic acid reagent. Ammonia (20 mL) was diluted to 1000 mL with water. Sodium hydrosulfite (5 g) was added to 100 mL 70 °C water. All chemicals were obtained from the Tianjin Zhiyuan Chemical Reagent Co. Ltd.
Equipment
A dehydrator was filled with allochroic silica gel. Analytical balance accuracy was 0.0001 g or better than 0.0001 g. The drying oven temperature was kept at 105 ± 3 °C. The water bath shaker temperature was kept at 44 ± 1 °C (or at 70 ± 2 °C for decolorization of dyed samples) and its oscillation frequency was 100 times/min. A 60∼65-mesh stainless steel strainer was used. The ultrasonic cleaner temperature was kept at 44 ± 3 °C.
Procedures
Samples (∼1 g, pulled into yarns 20-30 mm long) were placed in a conical flask with cover containing formic acid/zinc chloride reagent (100 mL solution/g of sample) and shaken for 90 ± 2 min in a water bath shaker. After the reaction, the sample was poured into a stainless-steel strainer. Ten, the remaining jelly-like colloidal material was collected using glass rods or tweezers and put back into the conical flask. The formic acid/zinc chloride solution was poured back into the covered conical flask at the same temperature and volume and the flask put into the ultrasonic cleaner for 1 min. After sonication, the mixture was filtered with the stainless-steel strainer, and after collecting the remaining colloidal material, it was put back into the conical flask with cover, and the above steps were repeated. Finally, 44 °C distilled water (200 mL) was poured into the conical flask— the remaining colloidal material returned to fibrous form. Ultrasonic cleaning for 1 min was then performed, the fibers poured back into a stainless-steel strainer, and after filtration, put back into the conical flask with cover. These steps were repeated twice more. The remaining fiber was rinsed with running water, and the cleaned fiber suspended in dilute ammonia water (50 mL) for 10 min. After cleaning in running water, the fibers were rinsed with distilled water, (200 mL) put in a weighing bottle, dried, and weighed.
Results and Discussion
Standard Curve Method
Curve Plotting
The nine samples containing 5% to 100% A100 fiber mixed with viscose fiber were processed according to the above procedure. The results are given in Table I.
A100 Content (5 to 100%) in A100/Viscose Mixture Standards Results
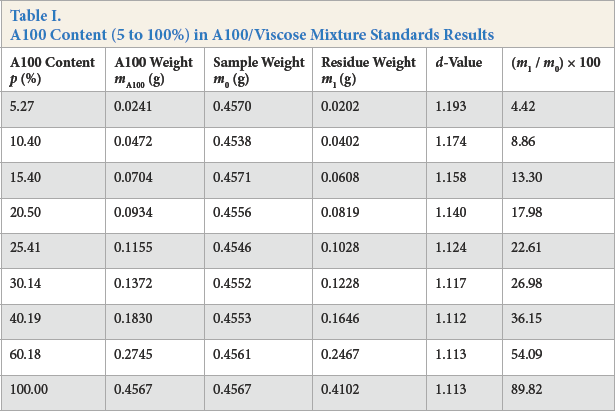
The d-value, defined as the weight of the initial A100 fiber content divided by the weight of the residue mass remaining at the end of the experiment, was used as one measure of A100 content in AlOO/viscose mixtures (Table I). If the traditional d-value method is used for data analysis, the detection range cannot be determined. Also, the d-value is influenced by variables including reagents, equipment, human factors, and environment.
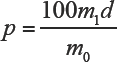
An alternative is to plot ap-x curve, where p is the initial percent weight content of A100 used and x is the percent of the residual weight obtained as determined by Eq. 1.
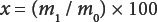
m1is the residue weight and m0 is the initial sample weight. A plot of this graph is shown in Fig. 1.
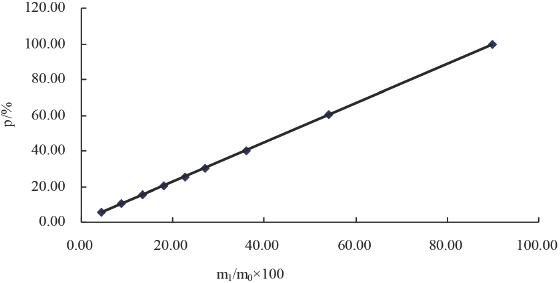
Plot of percent residual A100 weight vs. percent initial A100 weight for A100/viscose mixtures.
Fig. 1 demonstrates a linear relation between p and x that can be expressed as Eq. 2 (correlation coefficient = 1.0000).
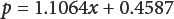
Eq. 2 can be used to quantify A100 content in AlOO/viscose mixtures. The more general form of the expression is given in Eq. 3.

k is the slope of the standard curve and b is thep-intercept of the standard curve. Since b
Detection and Quantitation Limits
A total of six samples each of 0.5% and 5% A100 fiber mixed with viscose fiber were processed according to the experimental procedure, using a bath ratio of 1:100. The results are given in Table II.
A100 Content (0.5% and 5%) in A100/Viscose Mixture Standards Results
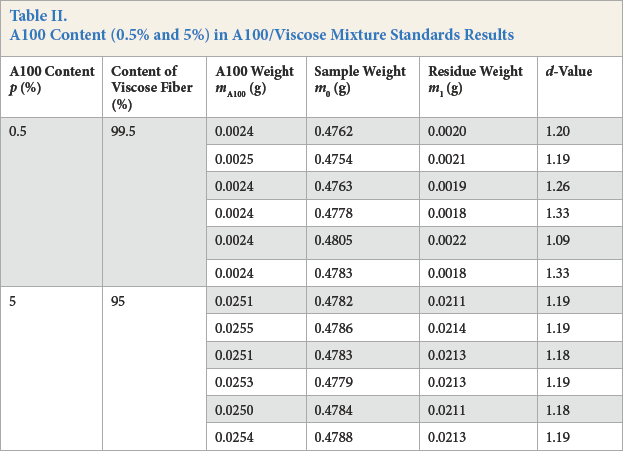
Based on the results in Table II, 0.5% was identified as the detection limit of the method. The d- value method showed considerable variability between values for the 0.5% samples, whereas the values for the 5% samples were consistent. Considering analytical balance errors, 5% A100 was identified as the quantitative limit of the method.
Method Robustness
The environment had little effect on the results, but extraneous factors (i.e., temperature, time, bath ratio, and oscillation frequency) did impact the results.
Samples with an A100 content of 60% were dissolved in formic acid/zinc chloride reagent, with changes in the experimental conditions, to verify the influence of the various factors as a test of method robustness.
Based on the robustness test method in the AOAC Guidelines for Signal Laboratory validation, 8 seven factors of the experiment were selected and two different levels of each factor were chosen. The robustness determination was carried out in eight experiments. The results are given in Table III.
Procedure Robustness Experiments
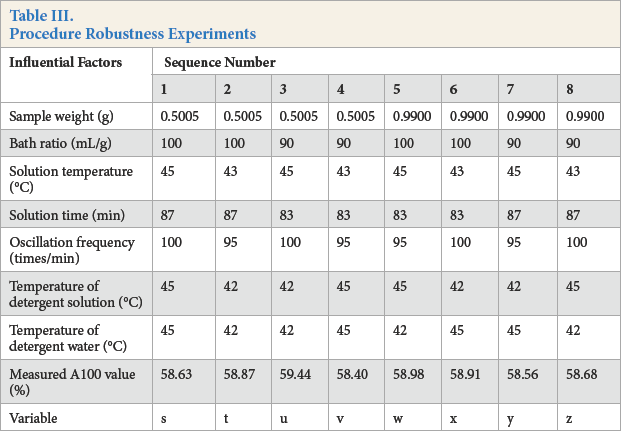
The eight robustness experiments were divided into two groups to test the influence of every factor. The influence of the first factor (sample weight) could be calculated by the difference of ¼ (s+t+u+v)and ¼ (w+x+y+z), and it was named d1. The results of difference test statistics are shown in Table IV.
Statistics of Influence Factors
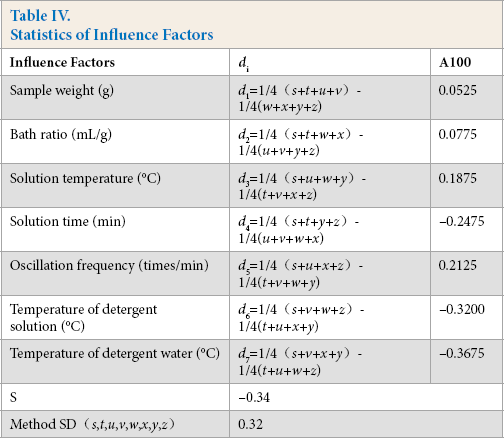
A comparison of di and method standard deviation (SD) indicates that if the di-value was greater than two times the method SD, this influence factor had a significant effect on the method. In this robustness experiment, every di-value was less than two times the method SD, indicating that the seven influence factors considered had little effect on experimental results when they were changed within the restricted scope of this robustness test (Table III).
The standard deviation caused by environmental factors was given by Eq. 4.
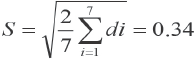
The smaller the value of S, the smaller the influence of environmental factors on the method.
Accuracy
Non-Dyed Fibers
Accuracy refers to the closeness between the measured results and the true values, it generally indicated by sample recovery rate as shown in Eq. 5.
Experimental data from A100/viscose mixtures (containing 5, 10, 40, 60, and 100% A100) dissolution were analyzed by the standard curve method and the results given in Table V.
A100/Viscose Non-Dyed Mixture Results
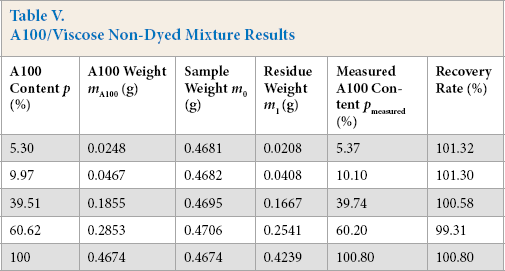
The sample recovery rate was in the 90% to 110% range and the absolute errors between the actual content and measured content of Tencel A100 were less than ± 1%, which met the requirements for fiber quantitative analysis.1,2,8
Dyed Fiber
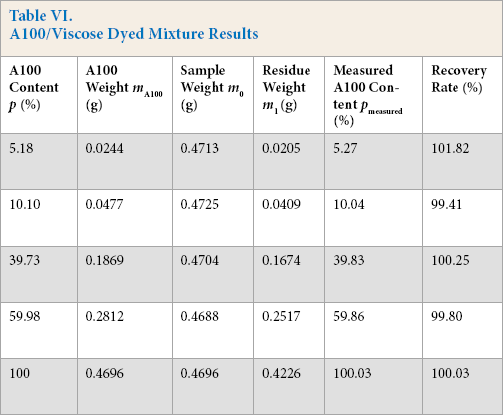
A100 and viscose fibers were dyed by reactive dyeing according to a certain process, decolorized using a 5% sodium hydrosulfite solution at 70 ± 2 °C for 5–20 min, and processed according to the experimental procedure. The results are given in Table VI. After dyed fiber decolorization, the sample recovery rate was in the 90% to 110% range and the absolute errors between the actual content and measured content of A100 fiber were less than ± 1%, which was consistent with the results for the non-dyed fiber accuracy experiments.
A100/Viscose Dyed Mixture Results
Precision
A100/viscose samples containing six samples each containing 5, 60, and 100% A100 were processed according to the experimental procedure. The results are shown in Table VII.
Precision Results
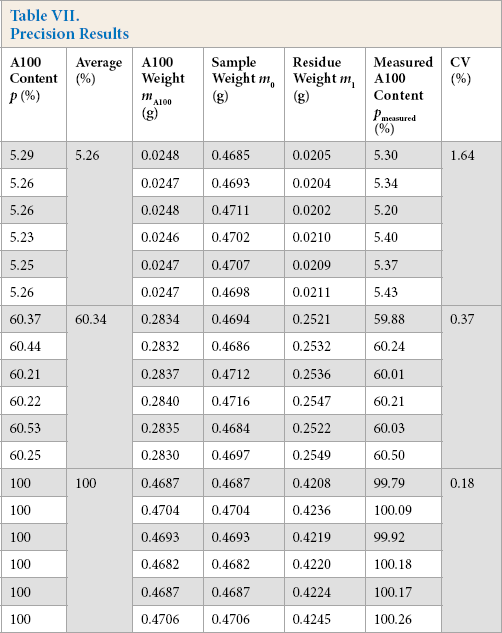
A t-test was used to evaluate the results. The statistics of dispersion were then calculated; t5% = 1.756, t60% = 1.238, and t100% = 0.856. These three values were less than t0.05/6 = 1.943, which showed that there were no significant differences between measurement results for samples of different proportions and average value.
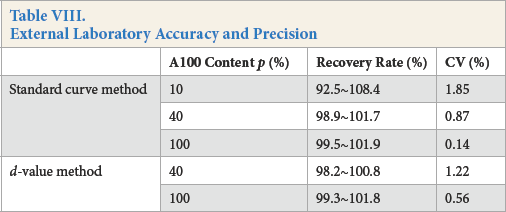
External Laboratory Accuracy and Precision
This method was verified by several standard testing laboratories using both standard curve and d-value methods. The results (Table VIII) show that the sample recovery rate was between 90% and 110%.
External Laboratory Accuracy and Precision
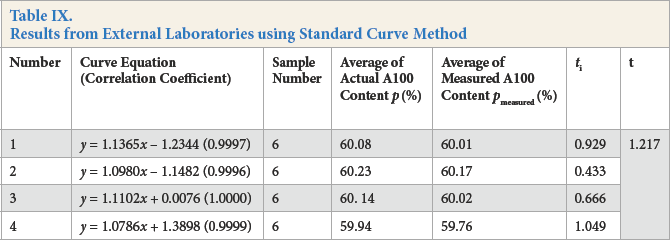
Samples of A100/viscose containing 60% A100 were determined by different laboratories and the results shown in Table IX. The ti value from each laboratory was less than t0.05/6 = 1.943. The calculated t value of 24 groups of experimental data from 4 laboratories was 1.217 which was less than t0.05/24 = 1.711. Therefore, no significant differences between determination results for samples containing 60% A100 and the universal mean were found among laboratories.
Results from External Laboratories using Standard Curve Method
d-Value Method
According to Table I, the d-value of A100 in A100/viscose mixtures tended to stabilize at 1.11 when the A100 content was greater than 40%. Therefore, this value could be used directly to calculate the A100 content in A100/viscose mixtures containing greater than 40% A100 in accordance with AATCC TM 20A 1 and ISO 1833.19 using Eq. 6.
d = 1.11 is the correction factor of variation in weight of A100/viscose mixtures.
Conclusion
Using formic acid/zinc chloride as a dissolution procedure, viscose fibers could be dissolved at certain temperatures and time, while Tencel A100 (lyocell) would remain undissolved. This made quantitative analysis of A100/viscose mixtures possible. Partial dissolution of A100/viscose mixtures for optimal quantitative analysis occurred using 80:20 formic acid/zinc chloride, a bath ratio of 100 mL/g of fibers, a temperature of 44 °C for 90 min, and an oscillation frequency of 100 times/min, followed by ultrasonic treatment.
The d-value method was significantly impacted by the content of A100 in blended products containing less than 40% A100. However, a linear relationship for A100 content in A100/viscose mixtures was found using the standard curve method. This method was suitable for A100/viscose mixture quantitative analysis in which the content of A100 was greater than 5%. The detection limit for A100 was 0.5% and quantitative limit was 5%. A large amount of data showed that the detection limit determined from the standard curve method was 0.5%, and the corresponding quantitative limit was 5%. This method had good robustness within the specified experimental conditions, and gave high veracity and precision.
Alternatively, the d-value method (where d = 1.11) was suitable for A100/viscose mixtures in which the A100 content was greater than 40%.
The two methods were highly accurate and met the needs of fiber content quantitative analysis for domestic and foreign products. The sample recovery rates were between 90% and 110%. The absolute error was less than ± 1% and the precision was acceptable.
Additionally, the dissolution time of viscose fiber is longer than rayon made from bamboo and Modal fiber, indicating that this method may be suitable for blended products constituted by A100, bamboo-derived viscose, and Modal fibers.
At present, quantitative analysis methods for blended products composed of regenerated cellulose fibers is a well-known challenge for the textile industry. This study established a quantitative analysis method for blended products composed of A100 and viscose fiber, which may offer options for quantitative analysis of regenerated cellulose fibers and their mixtures in the future.