
Abstract
In this study, polycaprolactone (PCL) was dissolved in 9:1 chloroform:ethanol mixture at 14%, 16%, 18% and 20% w/v concentrations. Then, acetic acid and formic acid were added at pre-determined amounts to 18% PCL/chloroform:ethanol solution system separately. Before production, viscosity and conductivity of prepared solutions were measured. Electrospinning technique was used for fabrication of fibrous webs. Morphology of produced webs was observed under a scanning electron microscope while fiber diameter measurements and pore analysis were realized via Image J Software System. The effect of polymer concentration and acidic solvent additions to mostly used chloroform solvent was investigated based on fiber morphology. Results indicate that the increase in polymer concentration increases the fiber diameter which leads to larger average pore area. Electrospinning of PCL with 16% to 20% polymer concentrations in chloroform:ethanol solvent system results in micro fibers. On the other hand, fiber diameter reduced from microscales to nanoscales with the addition of either acetic or formic acid. Fibers produced from PCL/chloroform:ethanol solution at 18% polymer concentration have 2.22 µm average fiber diameter, whereas 158 nm and 256 nm diameter fibers were successfully produced without a bead-like structure by 120 µl of acetic and formic acid additions to the same solution system.
Introduction
In tissue engineering, it is accepted to be successful to the degree that it mimics the target tissue [1]. Based on the dimensional similarity of natural extracellular matrix (ECM), nanofibrous scaffolds are inevitable environments which promote cell attachment and proliferation [2–4]. Various techniques have been proposed to produce scaffolds from biomaterials, one of which is the electrospinning [5,6]. Electrospinning is a technique to create continous fibrous layers within ranging fiber diameters from few nanometers to some micrometers under electrical field [7,8]. Vascular grafts are the scaffolds where electrospun fibrous webs are nominated as candidates for single layer or multilayer designs.
Among several design strategies, fiber diameter and pore size of fibrous scaffolds are one of the most determinant parameters for tissue designs, i.e. multilayer vascular grafts. Since blood vessels are composed of layered structures, pore size distribution of layers differ from each other based on cell type content and their functions in related layers. Pore size of the scaffold should enable smooth muscle cell diffusion in tunica media (the middle layer of native blood vessel) while hindering blood leakage in tunica intima (the inner layer of native blood vessel) [9–12]. Therefore, the improved spinnability of biomaterials with differing characteristics according to desired requirements lead up design flexibility in tissue designs.
Biocompatibility, long-term biostability after implantation, and rubbery properties are the preference reasons of polycaprolactone (PCL) to be used in electrospun vascular grafts [13,14]. Both polymer concentration and the corresponding solvent identity can be used to manipulate the final physical properties of electrospun PCL to create vascular scaffolds targeting the specifications such like fiber diameters and pore size of the desired application [15–17]. Since there are many solvents for PCL such like methylene chloride and dimethyl form amide, chloroform is the one that is mostly preferred for electrospinning of polycaprolactone due to its less hazardous properties especially for medical and tissue engineering applications [18,19]. However, it is known that only PCL microfibers around 2–5 µm diameters [18–20] can be achieved from electrospinning of PCL/chloroform solution. For nanofibrous PCL webs, alternative solvent systems are required. Acetic acid and formic acid were used as solvents for PCL alone or in a mixture, as alternative solvent systems for chloroform to produce nanofibers [13].
In this study, chloroform was used as main solvent and mixed alternately with acetic and formic acid in various amounts to find an optimum solvent system for PCL nanofibrous webs that can be used in tissue engineered designs, i.e. multilayer vascular grafts.
Materials and methods
Solution preparation
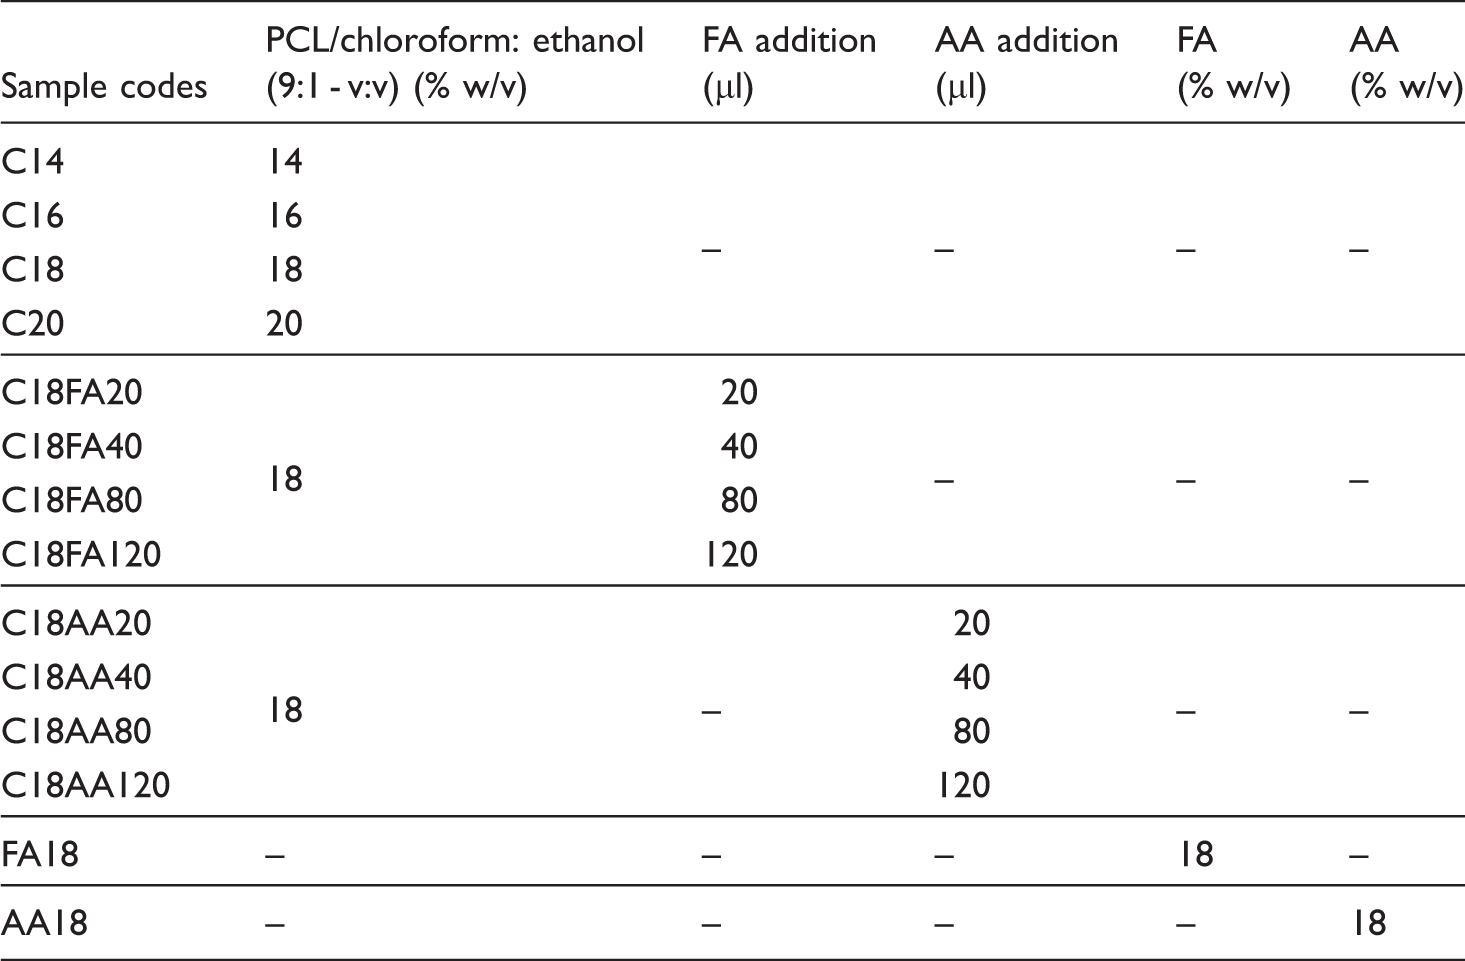
Sample codes and details.

Electrospinning
The basic electrospinning apparatus (Inovenso, Turkey, Figure 1) was used in horizontal feeding direction. The distance between the needle tip and the collector was adjusted to 20 cm and needle diameter was chosen as 0.8 mm. Feed rate, voltage and production time were varied in ranges of 0.4–1 ml/h, 12–15 kV and 10–20 min, respectively, based on used solvent systems. All samples were produced under laboratory conditions.
Electrospinning apparatus.
Solution characterization
Solution viscosities were determined by a HAAKE RotoVisco 1 from Thermo Scientific paired with Rheowin 4 Job and Data Manager Software. Measurements were realized at 24℃ with a RV1 spindle at 10 r/min to 4000 r/min for 90 s.
Conductivity of each solution was measured by electrical conductivity meter (Chromservis, Eutech Instruments, CON 510) which has a glass probe suitable for solutions used in this work.
Morphological characterization of fibrous webs
Morphology of the fibrous scaffolds was observed under ZEISS EVA, MO10 scanning electron microscope after sputter coating with gold alloy. Average fiber diameters were measured from at least 100 fibers for each of five SEM images (standard deviations are added in bar graphs as error bars) while pore areas and porosities were analyzed based on thresholding technique by Image J Software System (version 1.48) from five SEM images (average values ± standard deviations are given). Thresholding techique is based on the principal of separating the pixels which fall in defined range from those which do not. A grayscale image is converted to binary Black & White colour by defining a grayscale cut-off point. Grayscale values below the cut-off become black and those above become white. Thresholding is commonly used when detecting edges, counting particles, or measuring pore areas [21,22].
FTIR analysis was realized using Perkin Elmer, Spectrum Two Model FTIR to observe if there is residual solvent in the fibrous webs after production. IR spectrum of C18 and C18AA120 were analyzed in fibrous webs and compared with the measured IR spectrum of chloroform solvent and PCL granule.
Results
Solution characterization
Solution conductivity is mainly determined by the polymer type, solvent sort, and the additives [23]. Conductivity of solvents used in this study was measured as 0.00 µS/m, 0.00 µS/m, 0.65 µS/m and 230 µS/m, respectively, for chloroform, acetic acid, ethanol and formic acid. It is known from the literature [24] that pure acetic acid has very low polarity thus it is nonconductive unless it is mixed with water or other conductive additives. On the other hand, formic acid is defined as one of the most polar acids [13]. The electrical conductivity and viscosity of 18% PCL dissolved in pure AA and FA solvents were measured as 0.00 µS/m and 88.9 µS/m, and 0.142 Pa.s and 0.041 Pa.s, respectively. The spinnabilities of 18% PCL/AA and PCL/FA solutions were so poor that no fibrous webs were achieved via electrospinning of these solutions.
It is clear from Figure 2 that viscosity is under influence of polymer concentration. The increase in polymer concentration results in polymer viscosity increment [23,25,26]. On the other hand, conductivity of these samples was measured as 0.00 µS/m, so do pure chloroform solvent.
Viscosity change as a function of polymer concentrations.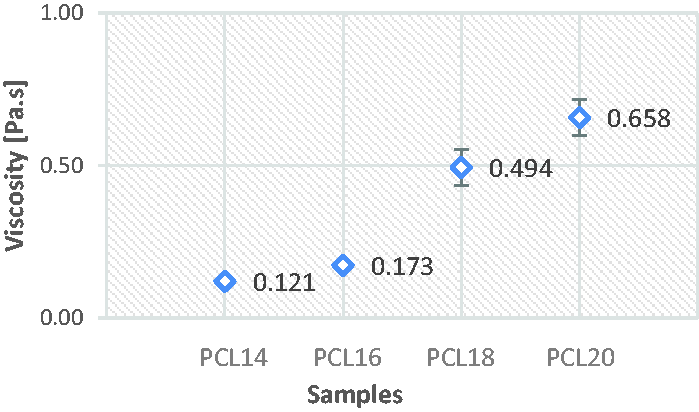
Since the addition of acetic acid does not vary the conductivity of the chloroform solution (because both their conductivities were measured as 0.00 µS/m), formic acid addition increases the conductivity of the chloroform solutions (Figure 3(a)) [23]. On the other hand, there is no clear effect of additional acids on viscosity of PCL/chloroform solutions observed in this study (Figure 3(b)).
Effects of additional (a) formic acid on conductivity and (b) acetic and formic acids on viscosity of C18 solution.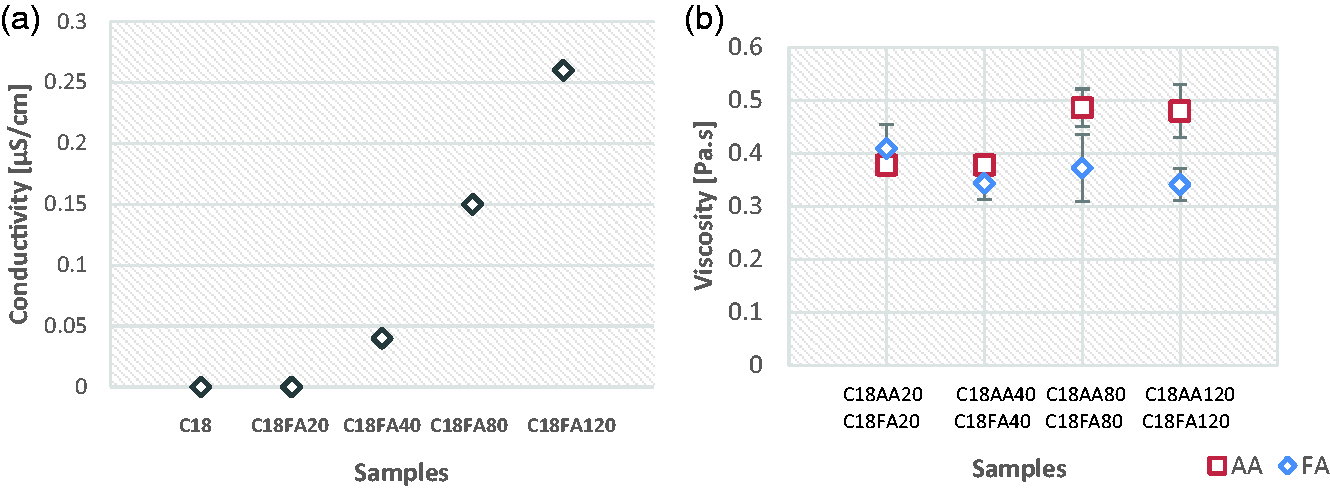
Morphological analysis
SEM images of fibrous webs including varied polymer concentrations (14–20%) of PCL/chloroform:ethanol solutions are illustrated in Figure 4 while Figures 5 and 6 show the images of AA additions and FA additions, respectively, to PCL/chloroform:ethanol solutions.
SEM images of (a) C14, (b) C16, (c) C18, and (d) C20. SEM images of (a) C18AA20, (b) C18AA40, (c) C18AA80, and (d) C18AA120. SEM images of (a) C18FA20, (b) C18FA40, (c) C18FA80, and (d) C18FA120.
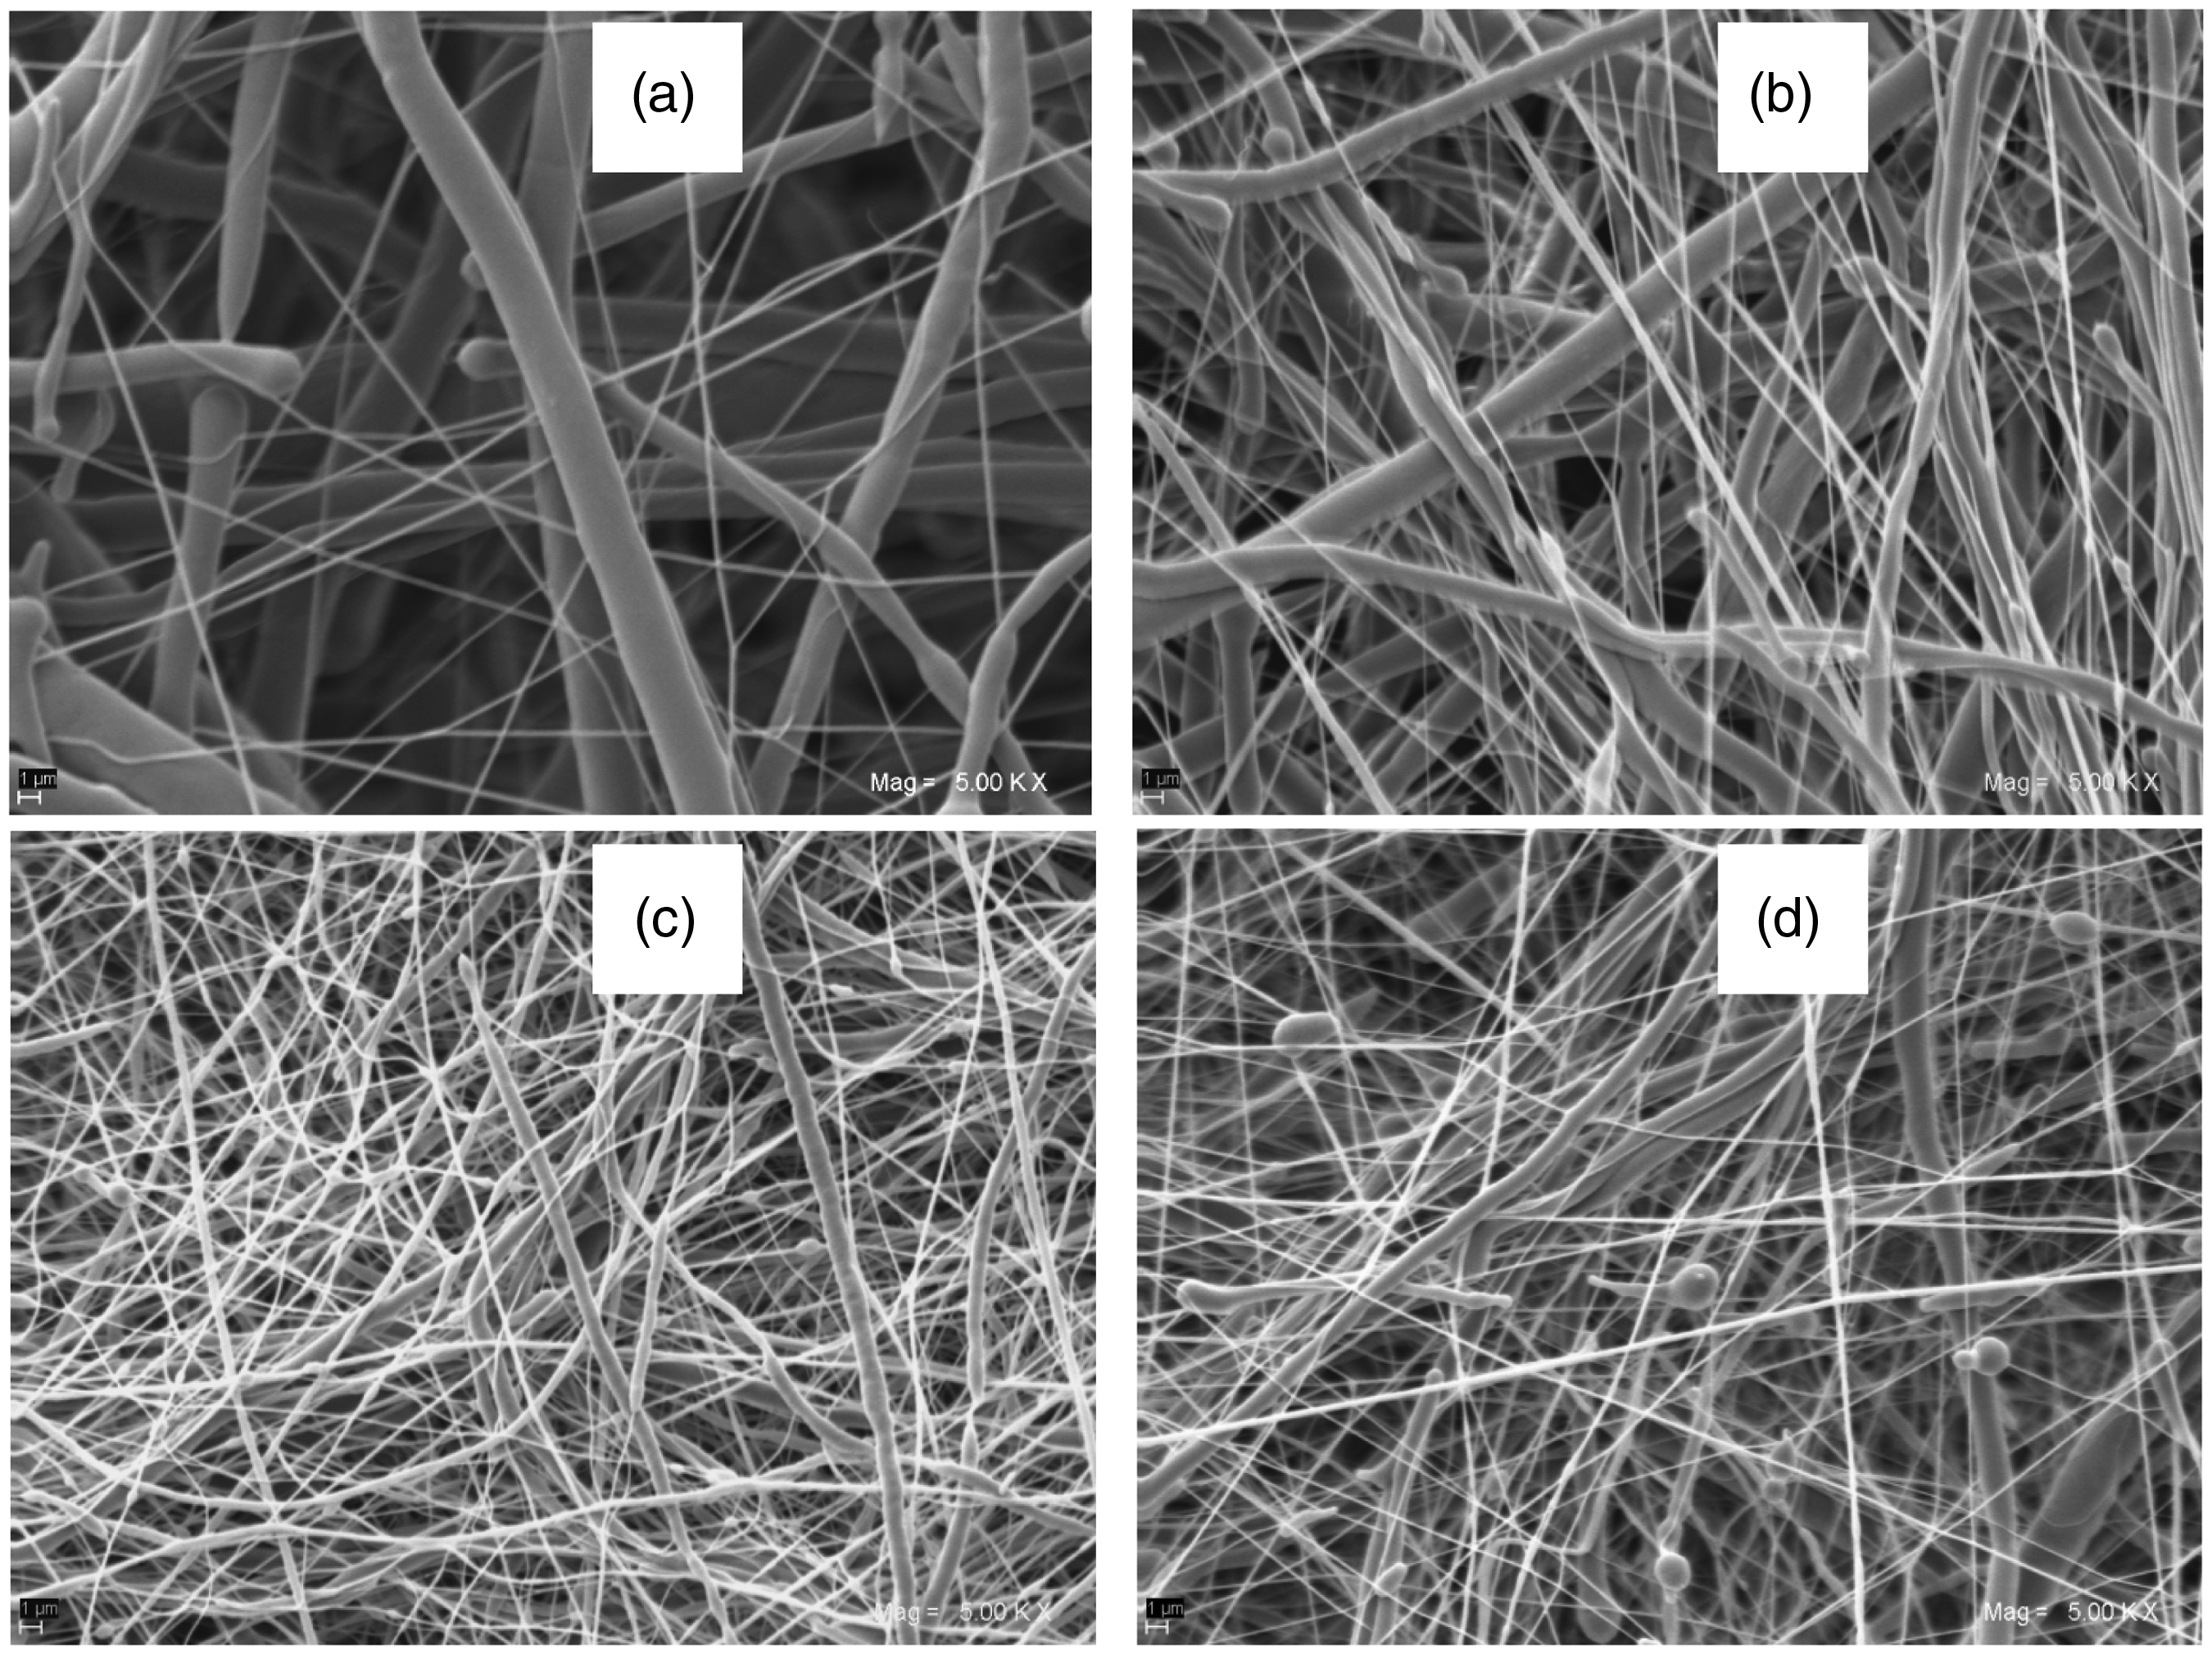

Although C14 has continuous nano fibrous structure, large beads were observed in SEM images (Figure 4(a)). In all other samples, micro fibrous structures were achieved (Figure 4(b) to (d)). In Figures 5(a) and (b) and 6(a) and (b) nanofibers and microfibers were observed together. However, Figures 5(c) and (d) and 6(c) and (d) indicate confluent nanofibrous structures.
No fibrous web formation was achieved from 18% PCL/AA and PCL/FA solutions. It can be resulted from too low viscosities of the solutions [26]. It is also studied in the literature that there is no steady state conditions for PCL/pure formic acid or PCL/pure acetic acid solutions which may result in PCL degradation [13]. The reason is explained with highly polar formic acid and poorly polar acetic acid, both of which lead to unstable electrospinning process. Therefore, the mixture of these two acids [13] or addition of conductive additives like salt [27,28] to acetic acid is suggested as a good solution to improve the spinnability of PCL in acids.
Image J analysis
Fiber diameter
Fibrous webs produced from chloroform:ethanol solvent system (Figure 4) are composed of micro fibers except C14 (Figure 7). Although C14 has nano scale fibers, large beads were observed in morphological analysis (Figure 4(a)). Figure 4 also indicates that, average fiber diameter increases with increasing PCL concentration [25,29]. Moreover, high standard deviation was observed which states that there are different fiber diameter groups in the samples.
Fiber diameters of C14, C16, C18, and C20.
Figure 8 shows the fiber diameters of C18 and its acidic solvent added samples. Results indicate that the addition of both acetic and formic acid causes a decrease in fiber diameter. Although 20 µl and 40 µl acid adition have appreciable but not so respectable effects on fiber diameter due to its high standard deviations, 80 µl and 120 µl result in distinct drop of fiber diameters with lower standard deviations. Samples of C18AA80 and C18AA120 show the smallest average fiber diameters. (196 nm and 158 nm). Since there is no clear change in viscosities of the solution after acid additions were observed (Figure 3(b)), increasing conductivity by adding formic acid (Figure 3(a)) and decreasing surface tension with acetic acid concentration as reported in the literature [30] might be the reason for reducing fiber diameters.
Fiber diameters of the samples.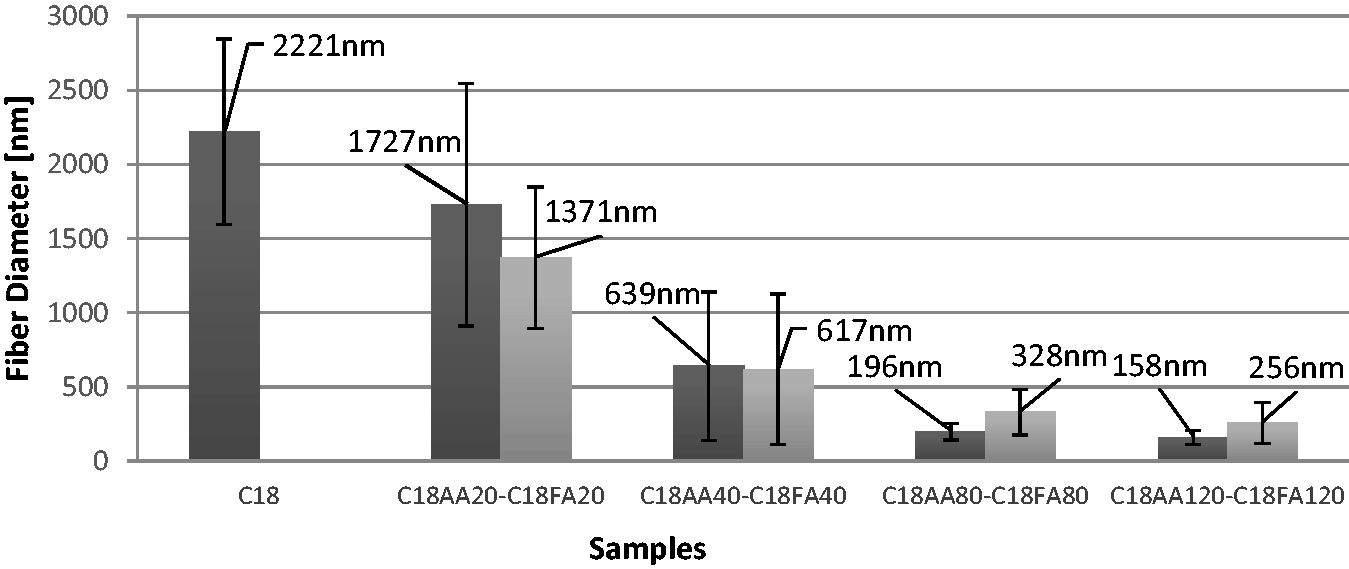
On the other hand, it can be noted from SEM images of C18AA20, C18FA20, C18AA40 and C18FA40 that there are different fiber diameter groups in the structure (Figures 5(a) and (b) and 6(a) and (b)). Image J analysis results also prove these visuals. Average fiber diameters were measured as 1.72 µm and 1.37 µm, respectively, for C18AA20 and C18FA20. On the other hand, it is clear from SEM images that these samples are composed of both nano and micro fibers which results in high deviation of average values. So, while discussing the average fiber diameters mentioned in Figure 8, this must be taken into account.
According to Figure 9, C18AA20 has both nano and micro fibers with an average of 196 nm and 2.05 µm diameters while C18FA20 contents both nano and micro fibers with an average of 153 nm and 1.92 µm diameters. Similar results were achieved for samples C18AA40 and C18FA40 which are composed of 246 nm/1.57 µm and 160 nm/1.16 µm diameter fibers. The reason of these two grouped fiber diameter distribution can be the poor effect of acid solvent.
Fiber diameter distribution for C18AA20, C18FA20, C18AA40, and C18FA40.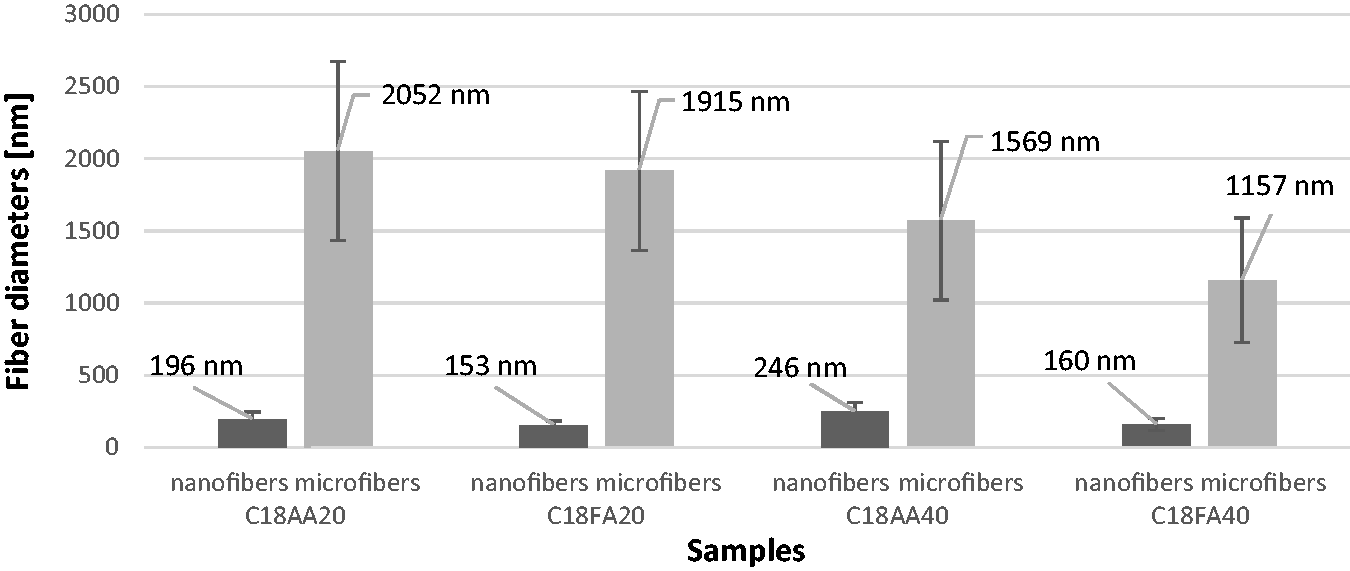
Pore area and porosity
SEM images and their thresholdings of samples used for Image J pore area and porosity analysis are illustrated in Figures 10 and 11. The average pore area and porosity test results can be found at Table 3.
SEM images and thresholdings of (a) C14, (b) C16, (c) C18, and (d) C20 for Image J Analysis. SEM images and thresholdings of (a1) to (d1): C18AA20, C18AA40, C18AA80, C18AA120; (a2) to (d2): C18FA20, C18FA40, C18FA80, C18FA120 for Image J Analysis. Average pore area and porosity results and their standard deviations.


According to the data given in Table 3, it can be said that, pore area is mostly under the influence of fiber diameters [12]. The evaluated pore area for sample C18 is around 10 µm2 but it reduced almost 50 times for samples C18AA80, C18AA120, C18FA80 and C18FA120 to around 0.2 µm2 based on fiber diameter decrement, i.e. acidic solvent additions. Porosity has a tendency of increase in a similar way of pore area. Since this is a 2D software analysis based on thresholding technique, porosity values are calculated from surface of the SEM image which results in higher porosities in larger diameter fibers.
FTIR analysis
FTIR analysis graphs are given in Figure 12.
FTIR analysis of (a) chloroform solvent (x), C18 fibrous web (y) and PCL granule (z) and (b) C18AA120 fibrous web (w) and C18 fibrous web (y).
According to Figure 12(a), C18 shows very similar peak characteristic with PCL granules differing from chloroform solvent. In Figure 12(b), C18 and C18AA120 show similar behaviours which can be accepted as there is no notable residual acetic acid solvent in C18AA120. When Figure 12(a) and (b) are compared to each other, none characteristic peaks of chloroform (3034 cm−1 /CH stretch, 1220 cm−1/ CH wag, 774 cm−1 and 680 cm−1/CCl3 stretches) were found in both C18 and C18AA120 fibrous webs [31].
Conclusion
In this study, electrospun webs including microfibers were produced from PCL/chloroform:ethanol solution, the average fiber diameter of which is 2.22 µm. On the other hand, since no fibrous webs were achieved when PCL was dissolved in pure acids, the addition of acetic or formic acid solvents to PCL/chloroform:ethanol solution caused a notable drop in fiber diameters (for AA up to 158 nm, for FA up to 256 nm).
Although chloroform has already accepted solvent for medical use of PCL with its less harmful properties, producing microfibers limits its use where mimicking ECM is a necessity. Vascular grafts are one of the potential application areas for nanofibrous PCL webs that ECM is required to be mimicked for endothelial cells’ attachment and proliferation. Therefore, addition of acetic acid or formic acid to PCL/chloroform:ethanol solutions can be used where nanofibrous PCL webs are required especially for tissue designs or specifically multilayer vascular grafts due to its less hazardous properties.
Footnotes
Acknowledgements
The authors are thankful to Technical University of Liberec, Department of Nonwovens and Nanofibrous Materials for assisting solution characterization equipments.
Declaration of Conflicting Interests
The author(s) declared no potential conflicts of interest with respect to the research, authorship, and/or publication of this article.
Funding
The author(s) disclosed receipt of the following financial support for the research, authorship, and/or publication of this article: This study was supported by TUBITAK (The Scientific and Technological Research Council of Turkey) (Project Number 214M089) and Istanbul Technical University, Scientific Research Projects (Grant Number BAP37678).