
Abstract
The apparel industry is characterized by a globally-connected supply chain of producers and suppliers, which presents challenges when dealing with the enforcement of environmental regulations. Apparel industry leaders have recognized the need for improved environmental stewardship and have moved towards more collective efforts to address the toxins that are produced as part of their manufacturing processes. This study focuses on textile dyeing, one of the largest contributors to hazardous chemicals in the apparel supply chain, as a starting point for an apparel manufacturer's environmental assessment of their product offerings.
Introduction
In recent years, sustainable production has grown in importance due to rising concerns about the lasting environmental effects created by industry. This has impacted the fashion industry and has become a driving force to rethink production processes throughout the supply chain.
Leading innovators are pioneering new designs and manufacturing strategies to demonstrate environmental consciousness. Leading apparel retailers and manufacturers recognized opportunities for improving the lifecycle of their products and formed the Zero Discharge of Hazardous Chemicals (ZDHC) Program in 2011. The ZDHC Program includes a global portfolio of fashion brands, including fast fashion leaders H&M and Inditex (parent of Zara), committed to eliminating harmful toxins by 2020 through assessments and changes in their chemical management practices. Major apparel brands, retailers, and suppliers, representing over 30% of the apparel industry's global market share, also organized to create the Sustainable Apparel Coalition (SAC) in 2012 to develop an industry-wide, self-assessment tool for the evaluating the sustainability of apparel and footwear products. This tool, known as the Higg Index, measures the environmental impact of products based on their manufacturing and distribution stages using data reported from water and land use intensity, energy consumption, physical waste generated, chemicals, and toxins used, as well as social and labor impacts. 1
Members of ZDHC and SAC recognize that the apparel industry is a major contributor to both waste creation and resource depletion. In virtually every step, from fiber production to final garment, energy is consumed and waste has the potential to pollute the environment. SAC member, Levi Strauss, even found that consumer care practices, like laundering, are a major factor in a garment's environmental impact since both energy and water consumption are involved. 2 Additionally, direct disposal of apparel products to landfill at the end of their use by consumers can prolong negative environmental impacts, since petroleum-based synthetic textiles have a slow rate of biodegradability and can release toxins in the process. Even natural fibers, like wool and cotton, which are fully biodegradable, can negatively impact the environment at the fiber production stage due to use of water and agrochemicals (e.g., fertilizers, pesticides, and herbicides). 3 Researchers have also begun to use the publicly accessible Higg Index to evaluate garments made with various fabrics and finishes. One study found that a 100% polyester garment had a higher sustainable ranking than a 100% cotton wrinkle-free or 100% rayon garment based on the garment's lack of a finishing process as well as its lower overall consumer maintenance (drying and ironing). 4 In another study comparing six cotton T-shirt brands, an organic cotton T-shirt was found to be the most sustainable of all the brands based not only on its fiber content, but also for the use of an enzyme wash (instead of a basic softener) and for having a higher material use efficiency. 5
While all steps from fiber production to final garment contribute to some form of resource depletion and waste creation, there is a disproportionate impact on the environment in the textile production phase mainly due to water use and pollution from untreated effluents. This includes the fiber, yarn, and fabric production stages, where substances, including but not limited to waxes, oils, organic compounds, acids/alkalis, fibers/fiber particles, pesticides, heavy metals, and other compounds may become major pollutants. 6 According to the ZDHC, there are at least eleven chemical classes used in typical textile production, with some classified as carcinogenic. The list includes alkylphenol eth-oxylates (APEOs), halogenated flame-retardants, chlorinated solvents, chlorinated benzenes, chlorophenols, ortho-phthal-ates, and azo dyes. 7 These pollutants often end up discharged in effluent (wastewater) via the multitude of liquid-based application steps, liquid processing, and washings.
Wastewater pollution is an environmental issue that affects regions beyond where it is discharged. Pollutants can potentially penetrate into the water table, end up in drinking water, contaminate crops, and destroy aquatic ecosystems. The dyeing and finishing sectors of the apparel industry are responsible for the majority of water resource use.
Common assessments of water pollution from dyestuffs use tests for organic and inorganic compounds, as well as toxicology experiments. To discern the amounts of organic compounds present, chemical oxygen demand (COD), biochemical oxygen demand (BOD), total organic carbon (TOC), and Oil & Grease (O&G) tests are performed. 8 BOD is the most comprehensive organic testing method and traditionally the most widely used procedure. However, as it takes five days to perform this test, it is being gradually replaced by other, less time-consuming methods. 8 COD is defined by the US Environmental Protection Agency as “a measure of the oxygen-consuming capacity of inorganic and organic matter present in water or wastewater [or] the amount of oxygen consumed from a chemical oxidant in a specific test.” 9 COD testing can be finished in a matter of hours and can be used in facilities with a close-to-real-time monitoring system for determining levels of organic compounds in wastewater. With this information, changes can be quickly implemented by facility employees. 8 COD is very useful in determining the level of organic contaminants, however, individual components and levels cannot be isolated with this method. TOC testing is a relatively new method which measures the amount of carbon found as organic compounds and is often used as a non-specific indicator of water quality or the cleanliness of pharmaceutical manufacturing equipment. Toxicology testing can also give more of an effect-based impact report on wastewater.
Dye effluent also increases COD and BOD levels in the bodies of water it enters. 10 Additives to dye baths, such as ionic salt compounds and heavy metals including chromium, may also be released. Some dyes themselves are toxic—the azo dye class, which makes up 50% of all dyes produced each year (including those used in textiles), contains a number of dyes that are toxic, mutagenic, and may lead to some cancerous byproducts during breakdown. 11 The Ecological and Toxicological Association of Dyes and Organic Pigments Manufacturers (ETAD) notes that manufacturers should take extreme caution when using azo dyes, since when they are combined, some that do not exhibit degradation to carcinogens on their own, have been shown to form these compounds when combined with other dyes (2002). 12 Manufactured dyes are also engineered to be complex and stable structures, indicating that once they are put into the environment, it will take them a long time to be degraded and thus removed. 10
Some wastewater filtration efforts have also appeared to be ineffective. Most of the current technology is not suitable to remove textile effluent contamination from water as the systems in place have been created solely to treat biological waste. 13 The result of this is the passage of large quantities of dyes through treatment facilities. Even when manufacturers, industrial parks, and municipalities use water treatment facilities to solve the toxicity problem, they may have little impact due to a lack of adequate technology. Greenpeace's Toxic Treads report (2012) researched the growing issue of the shared water treatment facilities used in industrial complexes by many factories. The report notes that many industrial parks have implemented shared water treatment centers to make it easier for the enterprises to collectively release excess toxins. 14
Ma et al. notes that brands must look past the “first tier” of their supply chain, which is often limited to just the cut and sew facilities, and make sure all manufacturers that are part of the process are conforming to both governmental regulations and the brands’ own environmental policies as well. 15 This may be a collaborative effort in which the brands may use their resources, such as research and development facilities, to explore and create new innovative methods of manufacturing that facilities can implement.
Waterless dyeing methods are being researched to both reduce the amount of water use and the amount of waste caused by dyes and dyebath additives such as surfactants and metallic ions from salts used for exhaustion, leveling, or other purposes. Solution dyeing is not a new process, and has existed since the 1950s. At the present time, this method is not typically used for apparel fibers, but rather for fiber types that are difficult to dye, such as polypropylene, or for heavy-duty applications, such as interior textiles for hospitals, hotels, and other high-traffic areas. This method enables durability since the fabrics do not easily lose color or degrade due to simple physical wear or the use of chemicals necessary to clean these areas.
In the solution dyeing process for polyester, the polymer solution is melt spun and dyes or pigments are added most often as melt chips. 16 This process requires no water and results in virtually no waste. This is not a perfect process; it can only be used for petroleum-based synthetic fibers and large lots of fiber must be produced to make the process financially viable. It is difficult to clean the machinery between colors and the polymer to coloration material ratio must be optimized to ensure adequate color strength. 16 There are also color issues—there is less control and precision over the color than traditional dyeing and no possibility for a “lab dip” process, so color decisions must be committed to earlier in the process.
Other waterless dyeing and low water use alternatives to the traditional dyeing process are continually being researched and developed. This includes dyeing with supercritical carbon dioxide, which has emerged in recent years as a viable method for synthetic fibers. Supercritical carbon dioxide (CO2) is a good choice for a solvent as it is safe, already used in food processing applications, and is readily available as waste from other industrial applications. 17 In 1993, Saus and his team were able to successfully dye polyester fabric with disperse dyes at a 98% exhaustion rate—much higher than traditional dyebath based methods—using supercritical CO2. 17 This is a completely waterless dyeing method as it uses CO2 as a solvent at high pressure and temperature, where it exhibits both liquid and gaseous phase properties. The high exhaustion rate, ability to recover dye and solvent, short dyeing time, and lack of other requirements are also favorable with regards to resource and energy efficiency and waste reduction.
Because of the many positive traits of supercritical CO2 dyeing, others have researched its commercial applications. It has been successfully scaled up by several research groups including Banchero et al. 18 Nike has taken an interest in this technology and joined forces with a Dutch company, DyeCoo, in 2012 to further develop the process for mass production. 19 Similar to solution dyeing, it has fiber-type limitations, as it is currently only effective in dyeing hydro-phobic fibers such as polyester with disperse dyes. Attempts to dye natural fibers to commercially acceptable quality with this method have thus far been unsuccessful. However, unlike solution dyeing, this method may be used at the yarn or even the fabric stage of production, making it appealing to fashion brands as color commitments can be made much later in the process.
These new dyeing methods are an important step in helping apparel and textile firms advance towards more environmentally friendly practices during production processes. However, the environmental impact of dyes does not stop at the production stage. With every wash by the end consumer, some dye may be removed from the fabric and expelled through a municipal water system, discharged as runoff, or disposed of in other possible manners depending on the home or laundromat's setup. These dyes and finishes may have detrimental effects to the environment when compounded with other garments and multiple washings. To test the residual dye left on the fabrics, a dye extraction from the fabrics may be performed and high performance liquid chromatography (HPLC) can be used for analysis. 13 There are also other clues that point to dye removal during laundering. These include colorfastness tests (e.g., crockfastness and wash fastness) that can indicate dye loss into wash water. If there was a visible loss of color of the tested fabric, then dye was likely discharged into the wash water.
Given the variety of environmental challenges posed by dye use in the apparel supply chain, fashion companies may need more information when deciding to address the potential for environmental improvements. An assessment of existing fabrics included in current product offerings can be an insightful starting point and enable meaningful strategies for prioritizing elimination of toxic substances and environmentally hazardous processes. The most widely used fabrics in the apparel industry are cotton and polyester, which offer product benefits in their homogeneous state, but can also provide additional comfort, care, and performance features when blended together or with other fibers (e.g., spandex).
Market price considerations can also influence manufacturer decisions to seek out a blended fabric. For example, an increase in the price of cotton may result in the use of a blend with polyester to maintain production volumes and control costs. Environmentally speaking, it can be challenging to identify a fabric that has low or no negative impacts, appeals to end-use consumers, and is available in quantities that can meet existing market demands for production. In an evaluation of the most commonly used textiles, all the textiles examined were found to generate pollution at the processing and fabrication stage. 3 However, reduced environmental impacts were found when the textiles were evaluated based on their creation from a renewable resource, the ability to fully biodegrade, and the ability to be recycled. With these criteria, textiles made from recycled fibers (e.g., cotton, wool, nylon, and polyester) offer the greatest environmental benefit compared to the production of virgin fibers, particularly synthetics. Organically grown, plant-based natural fibers (e.g., linen, hemp, and cotton) provide the next best level of environmental benefit due to renew-ability, biodegradability, and the lack of agrochemicals. 3 Textile and fiber manufacturers are responding to a growing demand for more sustainable materials on the part of apparel producers and retailers. This is driven by consumer interest in supply chain transparency, as well as competitive advantage that is tied to corporate sustainability ratings. 20 Innovations like Invista's bio-based spandex or Lenzing's viscose rayon alternative, Tencel, allow apparel producers to maintain consistency in their products while reducing the negative environmental impacts associated with traditional methods of fiber generation.
Apparel manufacturers trying to reduce the environmental impact of their supply chains are faced with a myriad of production and distribution factors to consider, along with mitigating the risks of operations disruptions. Fabric selection, a large contributor to final garment cost, may just be one aspect of a manufacturer's effort, but can be a valuable starting point due to the variety and severity of environmental impacts resulting from textile production. 21 To help prioritize fabric choices based on environmental impact, a series of tests were conducted for an apparel manufacturer specializing in performance wear. Testing included evaluating three different fabric types used in the manufacturer's products for (1) color-fastness, (2) effluent quality, and (3) COD. The manufacturers provided all of the fabric samples for testing.
Experimental
Materials and Procedures
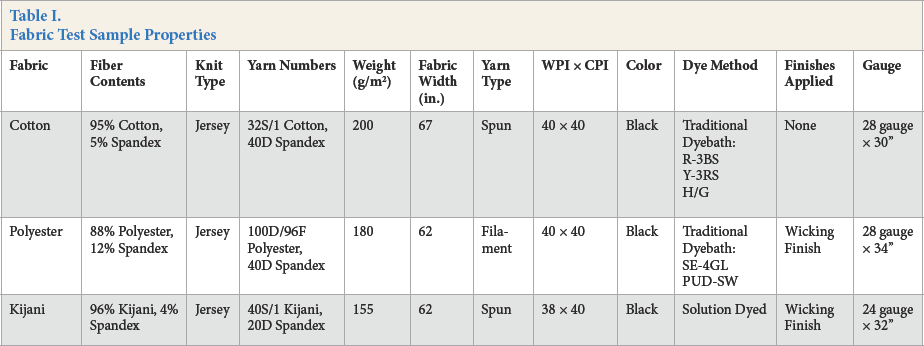
Tree types of fabric samples were provided by the WINDS group. The WINDS group is a synthetic fiber, yarn, and performance wear manufacturing partner for companies in the B2B apparel supply chain. These fabrics were dyed in WuXi Hengnuo Textile Technology Co. Ltd. in China, which is a contracted factory with the WINDS group. For details of the dyeing process used, contact the authors. Samples details are given in Table I. All samples were jersey knitted fabrics and were conditioned for at least 24 h under standard laboratory conditions (21 °C and 65% relative humidity (RH)).
Fabric Test Sample Properties
HCl (36.5 to 38.0 % w/w, CAS 7647-01-0, Catalog No. A144C-212), methanol (CAS 67-56-1, Catalog No. A452-4), DMSO (CAS 67-68-5, Catalog No. D128-4), HPLC-grade acetonitrile (CAS 75-05-8, Catalog No. A998-4), formic acid (CAS 64-18-6, Catalog No. A118P-500), and HPLC-grade water (CAS 7732-18-5, Catalog No. W5-4) were all purchased from Fisher Scientific.
Colorfastness to Hypochlorite Bleach in Home Laundering
AATCC Test Method (TM) 188-2010 was used to determine the colorfastness of all three fabrics to sodium hypochlorite bleach. 22 A sample of each of the three fabrics was weighed according to test specifications of 110 ± 10 g and the actual weight was recorded. The final weight after five washing cycles was noted and recorded as well. The samples were laundered using a Whirlpool 3.5 cu. f. Front Load Washer (Model #WFW9050XW00) and a Whirlpool Electric Dryer with AccuDry Drying (Model #WED9050XW1). The samples were washed on the machine's “Normal” cycle, using warm water, 100 g of Tide HE Liquid Detergent and 240 mL of Pure Bright Sodium Hypochlorite Bleach (contains 6% sodium hypochlorite). The samples were dried using the “Normal” dryer cycle.
Colorfastness to Powdered Non-Chlorine Bleach in Home Laundering
AATCC TM 172-2010 was used to determine the colorfast-ness to non-chlorine bleach. 23 One sample of each of the three fabrics was weighed according to test specifications of 110 ± 10 g and the actual weight was recorded. The final weight after five washing cycles was noted and recorded as well. The samples were laundered and dried with the equipment described previously. The samples were washed on the machine's “Normal” cycle, using warm water, 100 g of Tide HE Liquid Detergent and 50 g of Clorox 2 Non-Chlorine Bleach. The samples were dried using the “Normal” dryer cycle.
Crockfastness Test
AATCC TM 8-2007 was used to determine both dry and wet crockfastness with an SDL Atlas Crockmeter (Model CM-1). 24 For each of the three fabrics, five samples were cut diagonally across the fabric to prevent samples from being next to each other. The face of the fabric samples was always oriented outward for consistency. There was no pretreatment (washing or other) of the test fabric samples. An after-treatment of ironing the wet and dry dyed test swatches after testing was done to allow them to dry faster and fatten them for ease of evaluation without any wrinkles.
COD Test
COD, commonly used to indirectly measure the concentration of organic compounds in wastewater, was analyzed using US EPA Standard Method 5220 D. 25 Wastewater samples were collected directly from effluent in the dyeing factory at Wuxi, China. Tree samples were collected for each washing and dyeing procedure and influent. There are two washing steps for Kijani polyester fabric, * six washing and dyeing steps for polyester fabric, and eleven washing and dyeing steps for cotton fabric. At each step, three samples were collected.
Disclaimer: The use of a company or product name is solely for the purpose of providing specific information and does not imply any endorsement or promotion by Cornell University
HPLC Analysis of Extracted Dyes and Wastewater
All five standard dye samples were provided by WINDS group. The chemical structures for four of the five dyes used are shown in Fig. 1. Y-3RS, R-3BS, and H/G dyes were used for cotton fabrics. Y-3RS is C.I. Reactive Yellow 17626or C.I. Reactive Yellow 145. 27 C.I. Reactive Yellow 176 has a molecular formula of C29H21ClN8Na4O16S5 and MW = 1025.26. 26 C.I. Reactive Yellow 145 has a molecular formula of C28H20Cl9Na4O16S5 and MW = 1026.25. 27 R-3BS is C.I. Reactive Red 19528 or C.I. Reactive Red 239. 29 C.I. Reactive Red 195 has a molecular formula of C31H19ClN7Na5O19S6 and MW = 1136.32. 28 C.I. Reactive Red 239 has a molecular formula of C31H24ClN7O19S6 and MW = 1026.40. 19 H/G is an unknown mixture that probably contains reactive dyes.
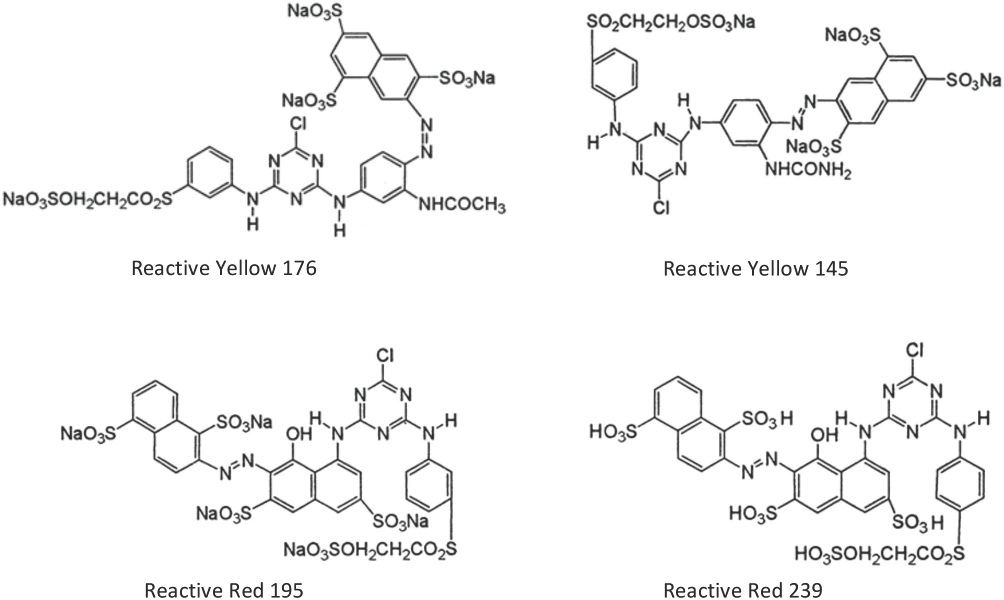
Chemical structures of dyes used for dyeing four cotton samples.
SE-4GL and PUD-SW dyes were used for polyester fabrics. SE-4GL is C.I. Disperse Yellow SE-4GL 30 and PUD-SW is an unknown mixture that probably contains disperse dyes.
The five dye samples used to originally to dye the fabric were prepared as standards by first dissolving 25.0 mg of dye in 100 mL of dimethylsulfoxide (DMSO) in a volumetric flask. This resulted in a 0.250 mg/mL initial concentration for all five dyes. These stock solutions were used to create 1:1 (dye solution:deionized water (DI)) serial dilutions ranging in concentrations from 0.250 mg/mL to 0.00391 mg/mL. The dye solutions were then filtered, using glass fiber syringe filters, into HPLC vials and analyzed using HPLC with diode array detection (DAD).
Dye concentrations in extraction and wastewater samples were determined by using these standards to create baseline calibration curves from HPLC analysis.
The extraction process was modified from one used in a previous paper. 31 To extract the dyes from the fibers, ∼25 mg of each fabric sample was cut and placed in a beaker containing 20 mL of a 2:1:1 (v/v/v) HCl:methanol:DI water solvent solution. The samples were then heated in an oven at 105 °C for 30 min and quickly cooled in a cold-water bath upon removal. All beakers were then placed in a vacuum desiccator (at 29 kPa) with silica gel pellets until the fabric samples were completely dry (∼48 h). When dry, 2 mL of DMSO was added to the beakers and observations were recorded. The resulting solution of extracted dye was then filtered, using glass fiber syringe filters, into HPLC vials. Analysis was then performed using HPLC-DAD.
A portion of the wastewater samples were used for HPLC analysis, just as a portion of the same samples were tested for COD. They were prepared by first diluting the samples to appropriate concentrations for HPLC-DAD analysis. Samples with measured COD values of less than 1000 were diluted by a factor of 1:9 (wastewater sample:DI water), while those with measured COD values of greater than 1000 were diluted using a 1:99 ratio (wastewater sample:DI water). The diluted wastewater sample solutions were then filtered, using glass fiber syringe filters, into HPLC vials and HPLC-DAD analysis was then performed.
Analytical Methods and Instruments
Hypochlorite and Non-Chlorine Bleaching
The color change (ΔE) was measured instrumentally using a MacBeth Color Eye spectrophotometer (with the D65 (daylight) setting as illuminant) following AATCC Evaluation Procedure (EP) 7-2009 and the ΔE value of the fabrics was automatically calculated. 32 Visual observations and comparisons of the original sample vs. the AATCC Gray Scale using AATCC Evaluation Procedure (EP) 1 were also made. 33 For both methods, the face of the fabric was evaluated for consistency.
Crockfastness
Samples were evaluated using the AATCC Chromatic Transference Scale and AATCC EP 8-2010. 33
COD Test
A Hach DRB 200 COD reactor and Hach DR900 colorimeter were used to measure the COD. Sample (2.00 mL) was added to the vial of Hach COD test kit (Hach EW-99574-25 and Hach EW-99574-26). DI water (2.00 mL) was added to the vial as blank. Vials were heated for 2 h at 150 °C using Hach DRB 200 COD reactor. After cool down, the vials were analyzed on the colorimeter at 420 nm for COD level 3 to 150 mg/L (Hach EW-99574-25) and at 620 for COD level 20 to 1500 mg/L (Hach EW-99574-26). Samples with COD levels greater than 1500 mg/L were diluted by a factor of 10 and analyzed using the Hach EW-99574-26 test kit.
HPLC Analysis
An Agilent 1100 series HPLC-DAD system was used. Separation was achieved using a 250 × 4.6 mm i.d. stainless steel C-18 column, 5 μm particle size (Restek Corp.) A gradient elution was applied with solvents A (HPLC-grade acetonitrile) and B (1% formic acid in HPLC-grade water) as follows: 0-5.7 min, 90 to 20% B; 5.7-10 min, 20 to 61% B; 10-15 min, 61% B. The flow rate was 1.0 mL/min and the injection volume was 20 μL. The detection wavelengths for DAD were 272 nm and 430 nm. The column temperature of the HPLC was 25 °C. The standard, extraction, and wastewater samples were all analyzed using this method.
Results and Discussion
Hypochlorite Bleaching Colorfastness
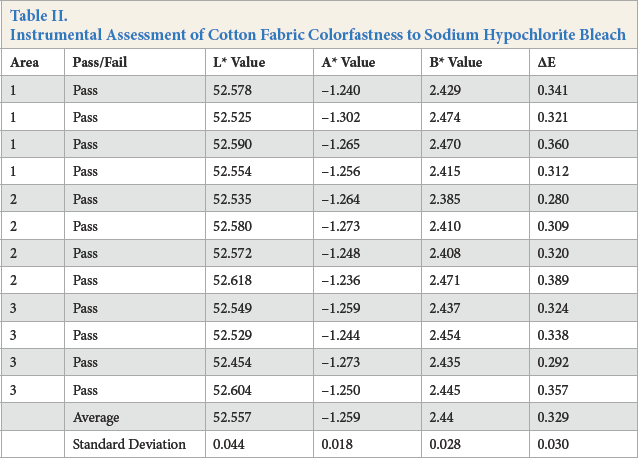
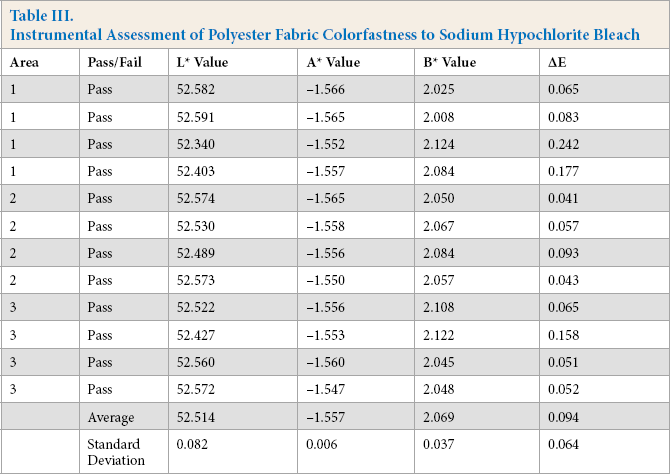
Instrumental assessment results for the ΔE values of test specimens are listed in Tables II–IV. The results of the visual assessments are listed in Table V.
Instrumental Assessment of Cotton Fabric Colorfastness to Sodium Hypochlorite Bleach
Instrumental Assessment of Polyester Fabric Colorfastness to Sodium Hypochlorite Bleach
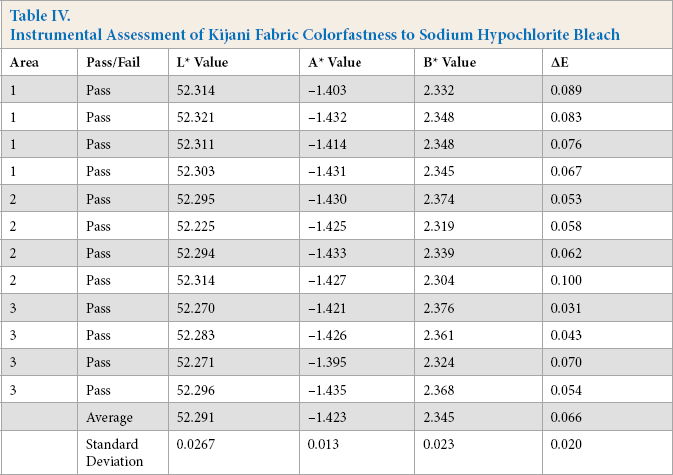
Instrumental Assessment of Kijani Fabric Colorfastness to Sodium Hypochlorite Bleach
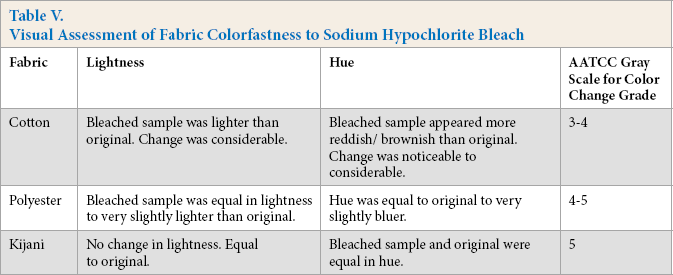
Visual Assessment of Fabric Colorfastness to Sodium Hypochlorite Bleach
For the instrumental assessment, Kijani fabric had the lowest ΔE value of 0.066, followed by polyester with an ΔE value of 0.094, and then by cotton with an ΔE value of 0.329.
The visual assessment of color change paralleled these results, with the Kijani fabric sample receiving a 5 rating on the AATCC Gray Scale, followed by polyester fabric with a 4-5 rating, and finally cotton fabric with a 3-4 rating. The cotton fabric sample had a considerable/noticeable hue change to more reddish/brownish, the polyester fabric had a slight blue hue change, while Kijani fabric had no hue change.
Kijani fabric performed well in both assessment methods as it is a solution-dyed fabric so the color cannot be removed, whereas the color of both traditionally dyed fabrics penetrated only the exterior of the yarn and can be removed in laundering or affected by chemicals to cause color change.
The calibration of the MacBeth Color Eye spectrophotometer can affect its values and the visual assessment is limited by the researcher's eyesight and perception. These factors should be noted and may also account for the differences in results.
Non-Chlorine Bleaching Colorfastness
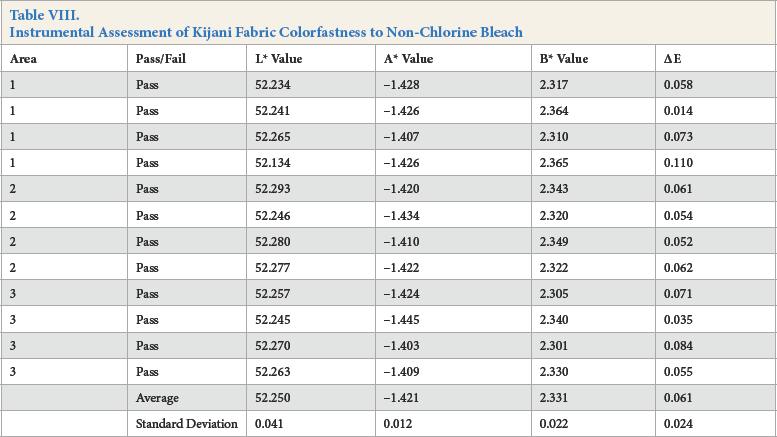
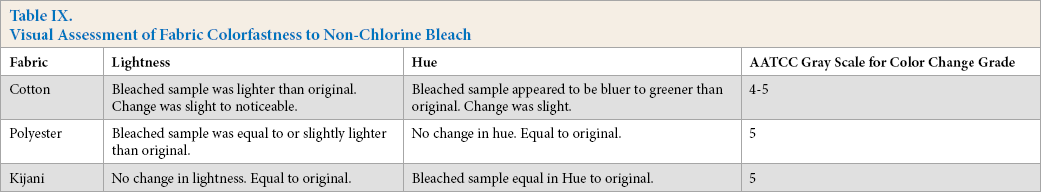
Instrumental assessment results for the ΔE values of test specimens are listed in Table VI–VIII. The results of the visual assessments are listed in Table IX.
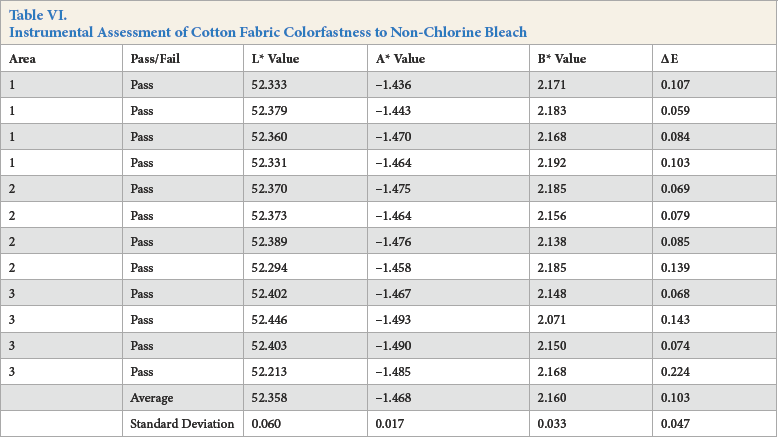
Instrumental Assessment of Cotton Fabric Colorfastness to Non-Chlorine Bleach
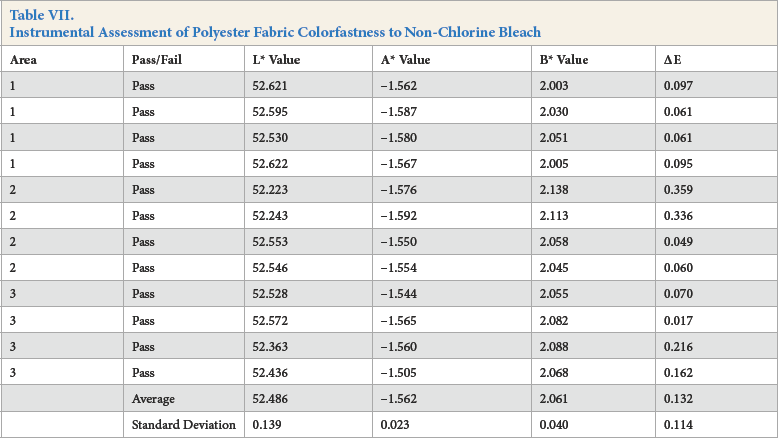
Instrumental Assessment of Polyester Fabric Colorfastness to Non-Chlorine Bleach
Instrumental Assessment of Kijani Fabric Colorfastness to Non-Chlorine Bleach
Visual Assessment of Fabric Colorfastness to Non-Chlorine Bleach
For the instrumental assessment, Kijani fabric had the lowest ΔE value of 0.061, followed by cotton fabric with an ΔE value of 0.103, and then by polyester fabric with an ΔE value of 0.132.
The visual assessment of color change provided slightly different results, with both Kijani and polyester fabrics scoring a 5, and cotton fabric scoring a 4-5 AATCC Gray Scale rating. It was also noted that the cotton sample was very slightly bluer in hue than the original fabric.
Again, as mentioned previously, Kijani fabric performed well in both assessment methods as it is a solution-dyed fabric.
Crockfastness
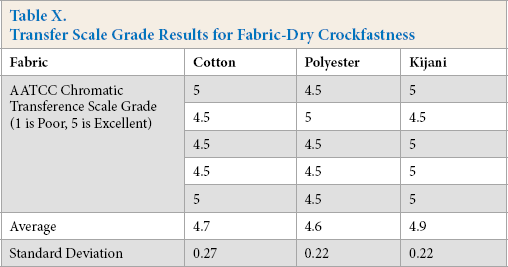
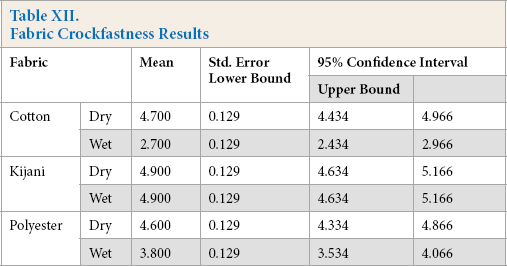
The results for dry and wet crockfastness are shown in Tables X and XI, respectively. Statistical analysis of ANOVA tests was performed on the data. The estimates are listed in Table XII and pairwise comparisons are listed in Table XIII.
Transfer Scale Grade Results for Fabric-Dry Crockfastness
Transfer Scale Grade Results for Fabric-Wet Crockfastness

Fabric Crockfastness Results
Pairwise Comparison for Fabric Crockfastness Results
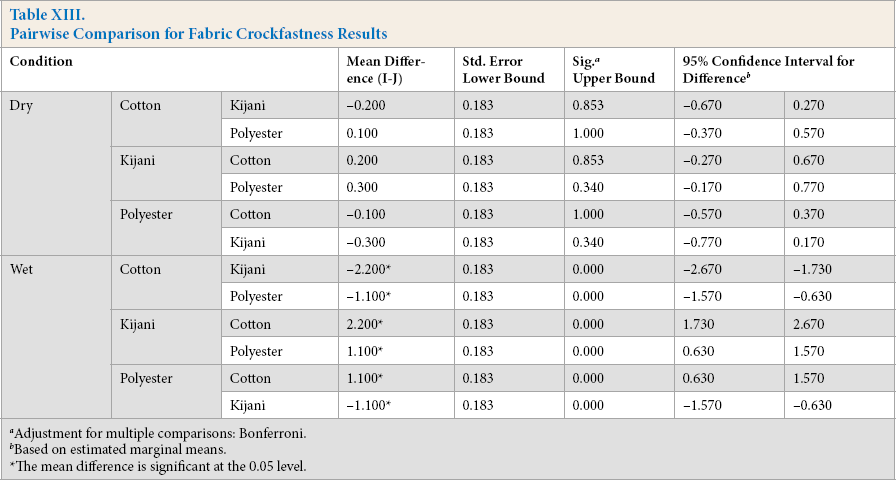
Adjustment for multiple comparisons: Bonferroni.
Based on estimated marginal means.
The mean difference is significant at the 0.05 level.
For dry crockfastness, there were no significant results as shown by the ANOVA analysis. All fabric samples experienced minimal to no crocking and would be more than acceptable in everyday wear.
For wet crockfastness results, all means were significantly different. The Kijani fabric performed the best with a rating of 4.9, followed by the polyester fabric with a 3.8 rating, and then the cotton fabric with a 2.7 rating.
As Kijani fabric is solution dyed, the pigment particles are incorporated directly into and throughout the fiber. Only the small amount of pigment on or near the very exterior of the fiber can be removed by crocking, resulting in color transfer to the white test fabric. As polyester and cotton are traditionally dyed, all the dye is near the yarn exterior and may be removed by abrasion, resulting in crocking color transfer to the white test fabric.
The cotton fabric may have performed poorly for several reasons. The reactive dyes used to color it are more water soluble than the disperse dyes used in the coloration of polyester, making them easily removed during wet crocking and transferred through the water to the other fabric. The reactive dyes may not be as well fixed to the fabric as the polyester dyes. As the cotton yarn is spun, tiny particles of fibers may be broken of and transferred to the test fabric during crocking tests.
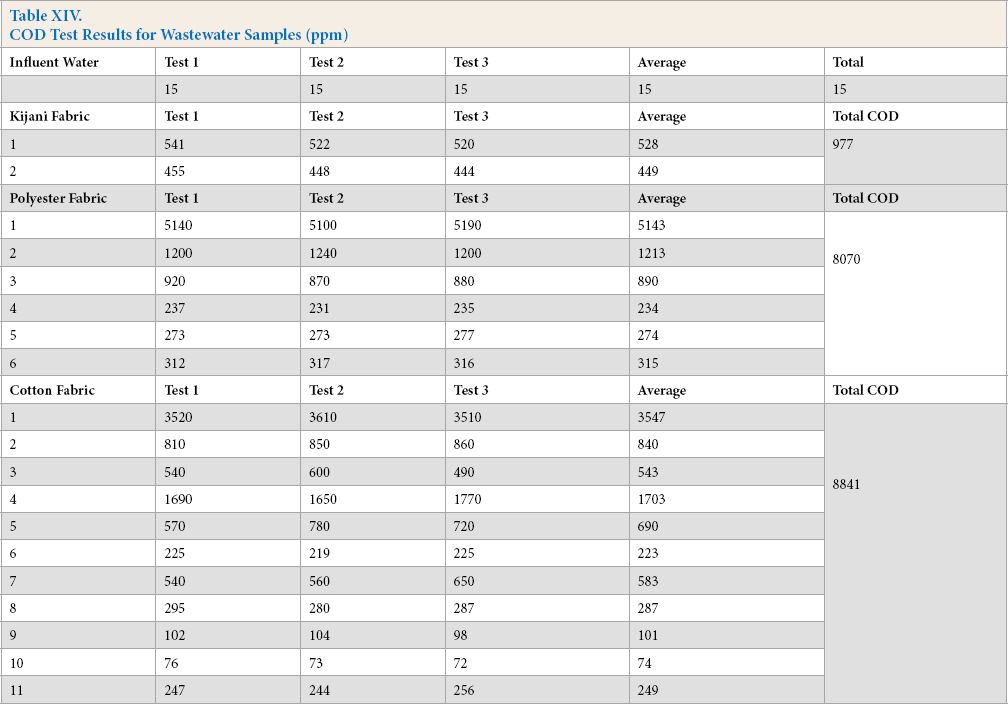
COD
COD test results for three types of fabric washings are shown in Table XIV and Fig. 2. Tap water was used as influent water—it had a very low COD value (15 ppm). Kijani fabric washings had a much lower overall COD value among the three types of fabrics since it did not require as many washings and no dye effluent was created. Cotton fabric washings had the highest COD value, which may be due to the typical low exhaustion rate of reactive dyes used to dye this fabric, as well as requiring the greatest number of washings. Polyester fabric washings also had a high COD value due to its traditional dyeing process and multiple washings.
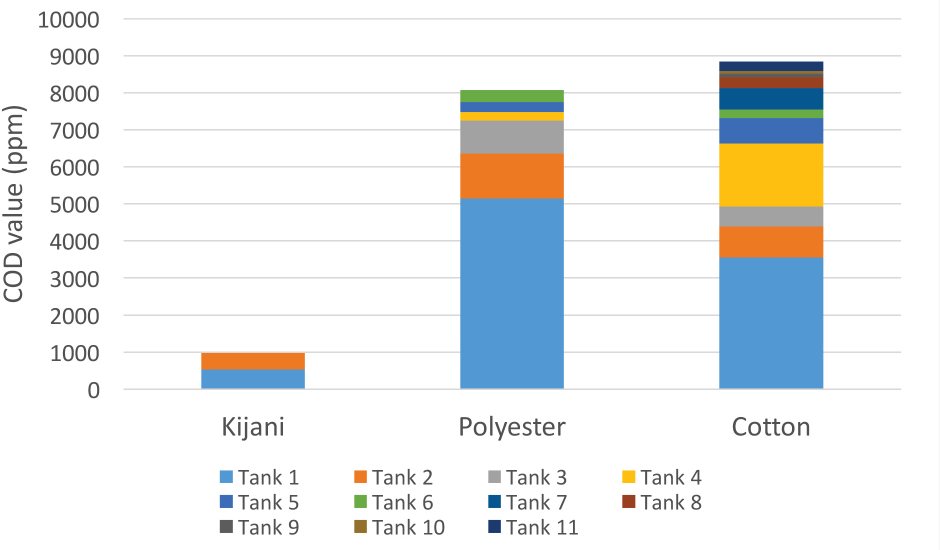
Total COD results for wastewater.
COD Test Results for Wastewater Samples (ppm)
HPLC Results
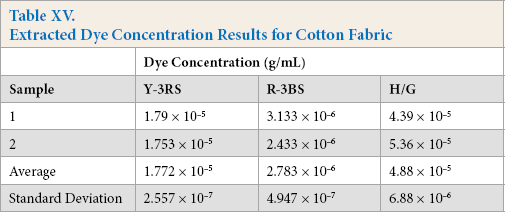
After DMSO was added into the extracted dye solution, observations were made for the three types of test fabrics. The cotton solution extract immediately turned a light red color, the polyester solution extract had a light-yellow color, while the Kijani solution extract was basically colorless. HPLC analysis revealed no dye was extracted from the Kijani fabric sample. HPLC analysis results for the cotton and polyester solution extracts are shown in Fig. 3 and Tables XV and XVI.
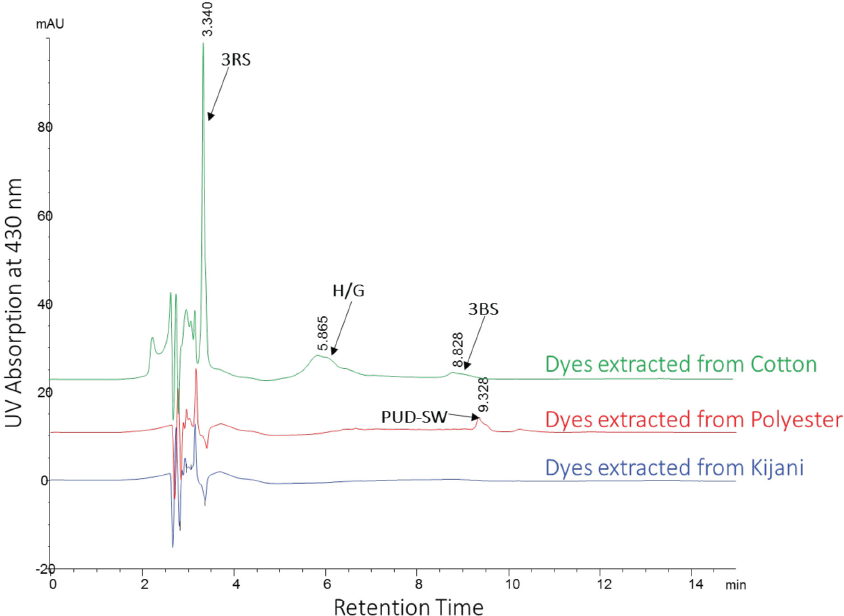
HPLC results of dye extraction.
Extracted Dye Concentration Results for Cotton Fabric
Extracted Dye Concentration Results for Polyester Fabric
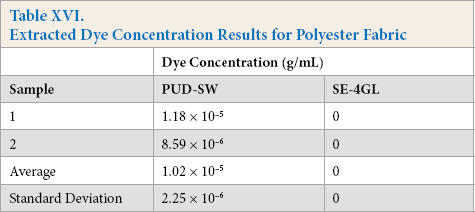
In this test, fabric dyes were extracted using a 2:1:1 37% HCl:methanol:water solution. This fabric dye extraction is somewhat harsher than a traditional home machine washing scenario due to the use of concentrated HCl, however, if there is little or no or dye removal, it may be assumed that the same will be true in a home laundry environment. If a fabric does effuse a large amount of dye, then it could negatively affect the environment during production and use.
The Kijani fabric extract performed the best, with no dyes being extracted. The polyester extract performed the second best, with an average of 1.02 × 10⁻⁵ g/mL of only one dye, PUD-SW, being extracted. The cotton extract performed the worst with 1.772 × 10⁻⁵ g/mL of Y-3RS extracted, 2.783 × 10⁻⁶ g/mL of R-3BS extracted, and 4.88 × 10⁻⁵ g/mL of H/G extracted.
Kijani fabrics cannot have dyes extracted as the color is imparted via melted pigments, whereas the cotton and polyester fiber fabrics are bonded to the dyes with covalent bonding, steric factors, ionic bonding, or through weak molecular forces, which allow some dye to be removed through extraction or even home laundering.
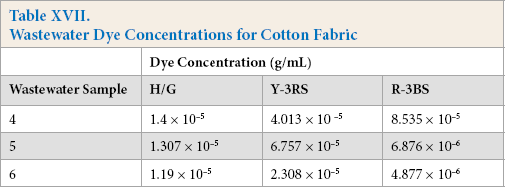
The HPLC analysis of wastewater was limited to dyes, as testing for surfactants, fixing agents, and other compounds are not possible with this setup. There were no dyes detected from Kijani fabric wastewater. Dyes were detected in tanks 4, 5, and 6 of cotton fabric wastewater (Table XVII), and tanks 2 and 3 of polyester fabric wastewater (Table XVIII).
Wastewater Dye Concentrations for Cotton Fabric
Wastewater Dye Concentrations for Polyester Fabric
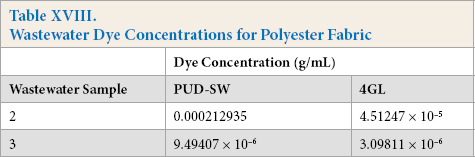
For the cotton test fabrics, the dyes remained at a detectable level in the wastewater in the third washing after dyeing, whereas for the polyester test fabrics, the dye remained detectable in the second washing after dyeing. Kijani test fabrics, however, had no detectable dyes in any of the waste-water samples provided, proving that, in comparison, that a much cleaner wastewater effluent was produced overall. Also, many fewer washings were required for the Kijani fabric, in comparison to the multiple washings required to remove excess dyes not fully bonded to the cotton or polyester fibers that were dyed via traditional dyeing processes.
Conclusion
Kijani fiber blend is a textile innovation developed by the WINDS Group, a global apparel manufacturer of performance apparel. The proprietary pre-coloring process (solution dyeing) used to produce Kijani fabric does not require a traditional dyebath and can provide some environmental benefits, especially water conservation and quality. Kijani fabric was compared to two other common fabric types used by the manufacturer for performance apparel to evaluate potential environmental benefits. The Kijani fabric is a cotton/spandex blend, and an alternative to the traditionally-dyed cotton/spandex blend offered by the manufacturer.
Overall, both Kijani and the traditionally-dyed polyester/ spandex blend gave better results for wastewater and dye extraction when compared to the traditionally dyed cotton/ spandex blend. Considering environmental concerns over water pollution resulting from textile production, the COD test results and HPLC analysis for Kijani fabric showed no detectable fabric dyes in wastewater samples. These results suggest a reduced environmental impact during both production and consumer laundering resulting from the Kijani pre-coloring process. The pre-coloring process limits color selection and response time to color trends in the apparel industry, which may restrict widespread industry adoption and consumer acceptance. However, as apparel brands and retailers seek solutions to environmental challenges in their supply chains, this process can provide a viable option for reducing water pollution from dyes in support of improved water conservation and quality.
Footnotes
Acknowledgments
The authors would like to acknowledge WINDS Group for funding this research, and the Cornell Institute of Fashion and Fiber Innovation for its support of this research.