
Abstract
The aim of this study was to assess the potential of utilizing Lactobacillus delbrüeckii spp. bulgaricus in order to improve the characteristics of dairy wastewater and produce biomethane. Nuclear magnetic resonance was utilized to assess the metabolites present in the unprocessed wastewater. It was determined that wastewater is a good source of important bio-refinery relevant compounds and therefore wastewater has a potential to be utilized during fermentation as nutrients source. Upon wastewater fermentation, the chemical oxygen demand and biological oxygen demand significantly decreased (respectively 97.0 and 97.8%). Protocols were tested for one- and two-stage fermentation. During the one-stage fermentation, lactic acid bacteria were not added to the wastewater. During the two-stage fermentation, acetogenesis and methanogenesis occurred separately with the addition of L. delbdueckii during the acetogenesis stage. The highest yield of methane was obtained from wastewater upon two-stage fermentation (76% two-stages compared to 38% one-stage). Therefore, L. delbrüeckii have the potential to be utilized to ferment dairy WWs and produce methane. Such treatment of wastewater not only produces methane, but also decreases the polluting effect of the waste streams, by reducing the chemical oxygen demand and biological oxygen demand to 0.199 and 0.031 g/l, respectively.
Keywords
Introduction
The concept of renewable energy and waste recycling has recently received a lot of attention (Demirel et al., 2005). The food sector, especially dairy industry, has one of the highest consumptions of water and is one of the biggest producers of effluent (Britz et al., 2006; Ramjeawon, 2000). Dairy wastewater (WW) is generated in the milk-processing unit, mostly during pasteurization, homogenization of fluid milk and the production of dairy products such as butter, cheese, milk powder, etc. Most of the milk processing units utilize a “clean in place” (CIP) system, which pumps cleaning solutions through all of the equipment in this order: water rinse; caustic solution (sodium hydroxide) wash, water rinse, acid solution (phosphoric or nitric acid) wash, water rinse and sodium hypo-chlorite disinfectant. Hence, the resulting WW can contain detergents, sanitizers, basics, salts and organic matter, depending upon the source (Belyea et al., 1990; Thompson and George, 1998). Large amounts of water are used to clean dairy processing plants and, if not handled properly, are huge pollutants (Demirel et al., 2005). The dairy industry utilizes different methods to treat dairy WW (Sharma, 2014). One of the most commonly used methods is biological treatment, i.e. aerobic or anaerobic fermentation (Gavala et al., 1999; Monroy et al., 1995; Panesar et al., 2007; Passeggi et al., 2009; Rivas et al., 2011; Vidal et al., 2000). This method has a relatively low cost, is easily implemented and offers the possibility of selling or using the obtained treated products. Among all biological treatment methods used, methanogenesis or anaerobic digestion (AD) is the most popular. Anaerobic digestion is the biological process in which organic material of a substrate is degraded by microorganisms in the absence of oxygen (Gendebien et al., 2010; Rodriguez, 2011). Such process is widely used to treat industrial and farm wastes because it produces biogas with a high percentage of methane that can be used as energy source (Silva and Naik, 2004). In order to increase the agro-food industry sustainability, it is of high importance to improve AD protocols in order to obtain a higher content of biogas and to reduce the pollution of industrial wastes.
Anaerobic digestion occurs in four separate phases: hydrolysis, acidogenesis, acetogenesis and methanogenesis. For a long time, the one-stage AD was the preferred method for treatment of various WW. In the one-stage AD method, all the reactions of hydrolysis, acidogenesis, acetogenesis and methanogenesis take place in the same reactor (Demirel et al., 2005). However, this kind of system is ineffective when treating wastes with high organic load rate and/or highly biodegradable content is used. Separating the AD into two stages has the potential to increase the yield of methane. Lactic acid bacteria (LAB) take part in the hydrolysis, acidogenesis and acetogenesis reactions. These bacteria produce substances, such as acids, fatty acids, carbon dioxide and peptides (Cintas et al., 2001), which are involved in methanogenesis and has the potential to increase biomethane production. Lactobacillus delbrueckii spp. bulgaricus is widely used to produce cheese, yogurt curd cheese and other products and thus is suitable to grow in dairy media (Kafsi et al., 2014). In this article, Lactobacillus delbrueckii spp. bulgaricus was utilized for the first time to increase the methane production and decrease pollution out of dairy WW.
Materials and methods
Dairy WW samples
Dairy residues samples including “clean-in-place” (CIP) water from washing machines used in milk production and WW was obtained from a Lithuanian dairy company (WW1 sample) and from the Institute for Food Technology Novi Sad (Serbia) (WW2, WW3 and WW4 samples).
Nuclear magnetic resonance (NMR) metabolic profiling of the dairy WW samples
Samples WW3 and WW4 were analysed by NMR. In all, 900 µL of the sample were mixed with 100 µL of 1 mM 3-(trimethylsilyl)-propionic-2,2,3,3-d4 acid sodium salt (TSP) in 20 mM phosphate buffer, pH 7.0 in an eppendorf tube and centrifuged at 20,000 g for 5 min. In all, 600 µL of the centrifuged sample were transferred in a standard 5 mm NMR tube. 1D 1H, 2D 1H-1H TOCSY, 1H-13C HSQC and 1H-13C HMBC NMR spectra were acquired at 300 K with a Bruker Avance 600-MHz spectrometer equipped with 5-mm z-gradient TXI (H/C/N) cryoprobe. All the mentioned above NMR experiments were acquired using the standard Bruker pulse sequences noesygppr1d; mlevgpphprzf; hsqcetgpprsisp2.2 and hmbcgplpndprqf, correspondingly and using standard settings. Each acquired spectrum was processed with the TopSpin 3.2 (Bruker, Germany) software. NMR assignment was performed using registered experiments and the available NMR databases (BMRB, HMDB). The spectra were calibrated against an external standard, assigning a chemical shift of 0 ppm to the TSP signal both in 1H and 13C dimensions. The ERETIC2 (Electronic Reference To access In-vivo Concentrations, Bruker) quantification tool was used for metabolites quantification. The amount of lactose in each analysed sample was calibrated to 100% and the relative content of WW metabolites was calculated.
The determination of chemical composition of the WW
Soluble dry matter was assessed using the refractometric method described by Hoehn et al. (2003). In order to measure the total dry matter, 5 g of sample were dried at 102 ± 2℃ until the weight of the sample became constant. To improve the surface of evaporation, 5 g of quartz sand was added to the samples. The protein content was measured by the Kjeldahl method as described by “Association of Official Analytical Chemist’s methods” (AOAC, 2000a). Fat content was estimated as described by the American Association of Cereal Chemists (AACC, 2000b) (Method 30-12 A). Direct reducing sugars and total carbohydrates were measured according to the AACC methods (Method 80-68) (AACC, 2000b). For the pH measurements, a pH metre (PP-15, Sartorius, Gottingen, Germany) was used.
Microorganisms for WW treatment
LAB Lactobacillus sakei KTU05-6, Pediococcus acidilactici KTU05-7, three Pediococcus pentosaceus strains (KTU05-8, KTU05-9, KTU05-10) and Lactobacillus delbrueckii subsp. bulgaricus were used for dairy WW treatment. The LAB were stored at −70℃ in 25% glycerol solution. LAB were refreshed and propagated in a de Man, Rogosa and Sharpe (MRS) broth (CM 0359, Oxoid Ltd, Hampshire, UK) for 24 h at 35℃ (for Pediococcus genera and Lactobacillus sakei) and 42℃ (for L. delbrueckii subsp. bulgaricus).
Sludge
Anaerobic sludge was obtained from a Lithuanian food manufacturing company and was used for biogas production.
Determination of volatile acidity
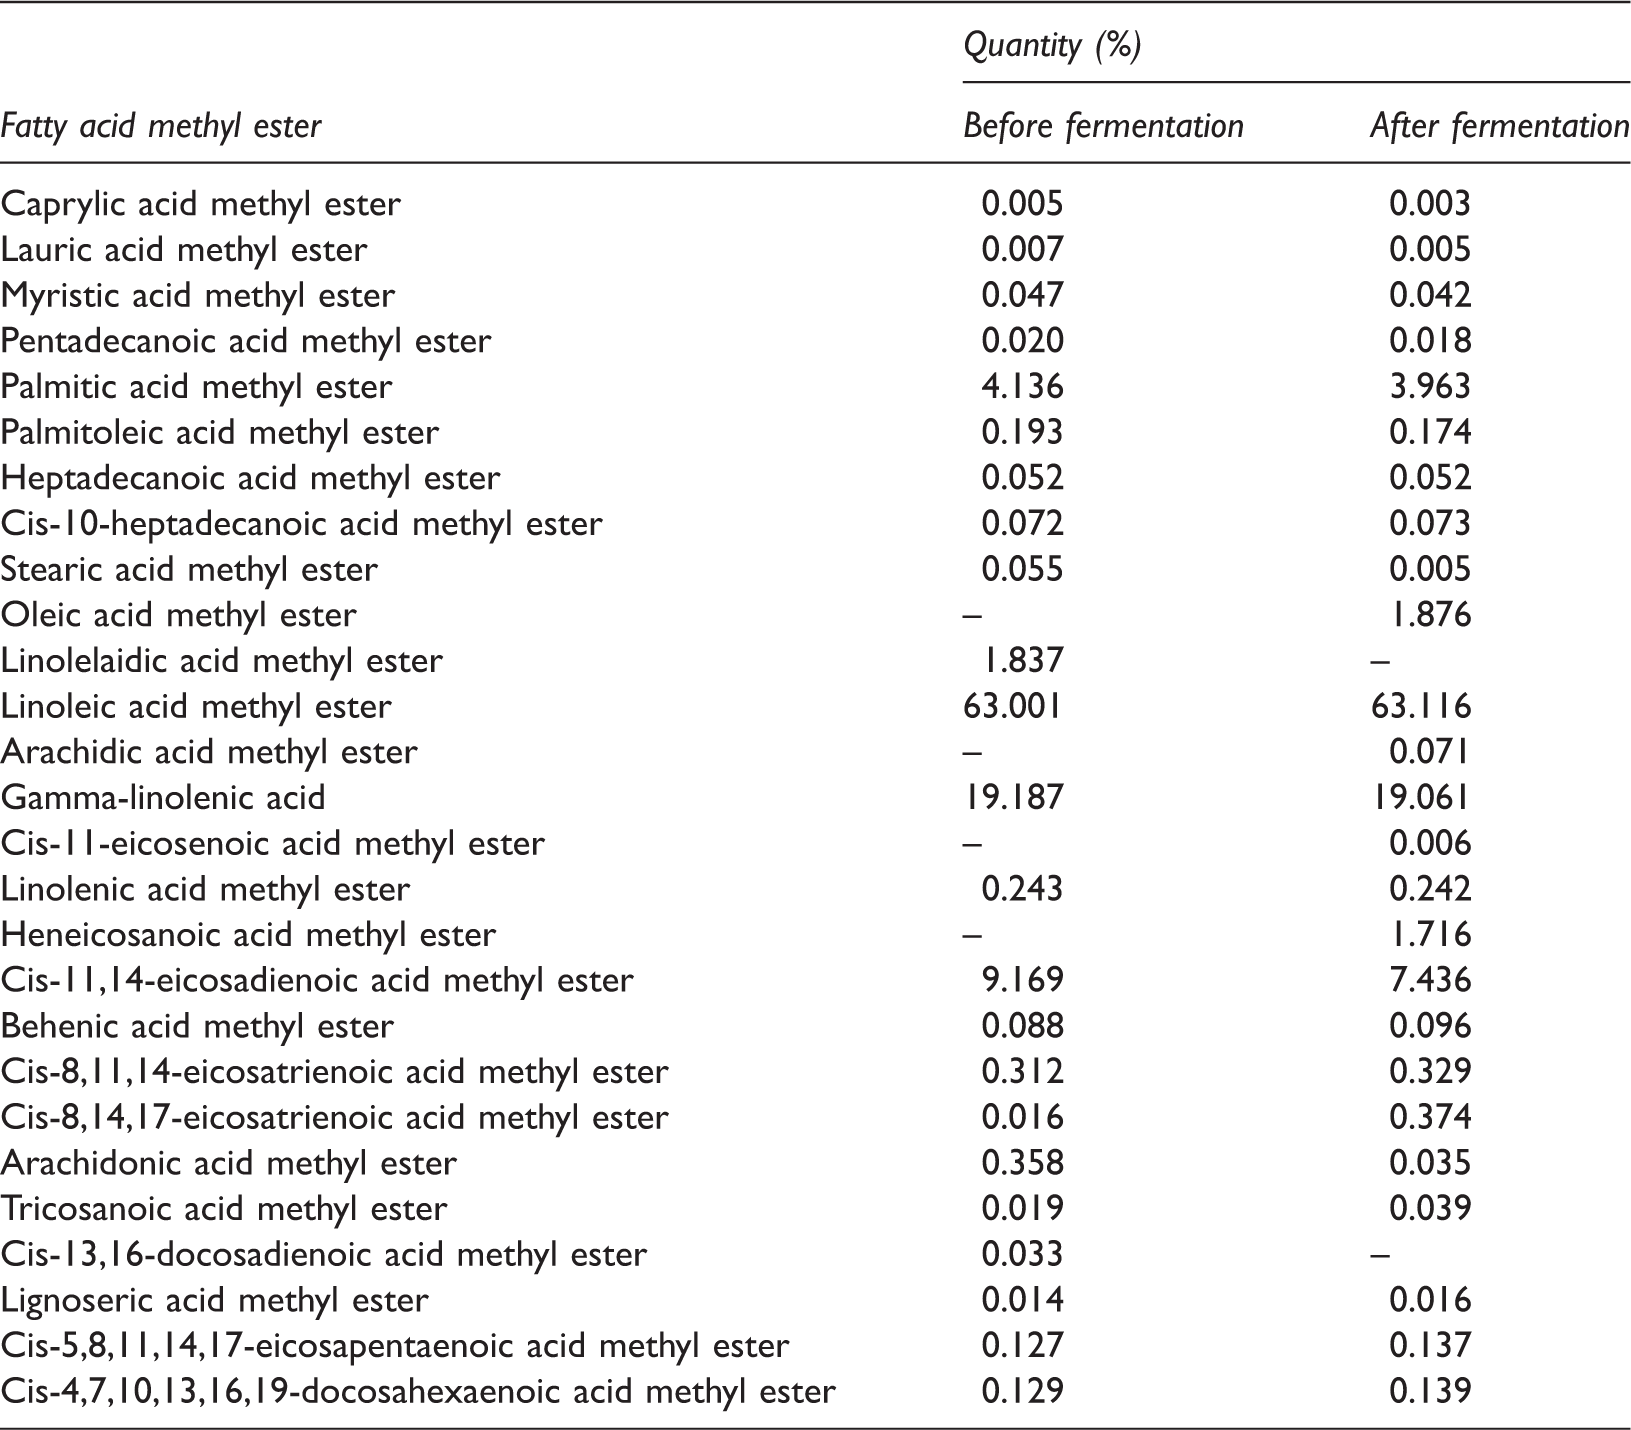
In order to determine which LAB strain to use, the amount of volatile acid compounds produce by the different strains was first tested. In all, 25 ml of the fermented WW2 sample for 42 h under optimal temperature was distilled using a Behr S4 Distillation unit (Lab Unlimited UK, Behr, Frimley, UK). Sample preparation for distillation was carried out with the following procedure: 25 ml of sample was poured into the distillation flask, 50 ml of distilled water and 3 ml of 5% sulphuric acid was added. Then the whole flask was placed into the distillation unit and an appropriate distillation program (80% power, 540 s duration) was started. When the accumulated distillate reached 150 ml, the distillation was stopped. The distillate was titrated with 0.1 M NaOH solution using 3–4 drops of 1% phenolphthalein indicator, until the solution turned pink and the colour did not disappear for at least 1 min. The content of 0.1 M NaOH solution used for titration was recalculated to the content of 1 M NaOH required to neutralize volatile acid compounds (mainly acetic acid) in a 100 ml sample. Fatty acids were determined by gas chromatography with flame ionization detector before and after WW fermentation using by L. delbrueckii subsp. bulgaricus. Gas chromatography analyses were performed on a model HRGC 5300 Mega Series, Carlo Erba (Milano, Italy) equipped with a split/splitless capillary injector and a flame ionization detector. Analytical separation was achieved on an RT-2560 capillary column (100 m × 0.20 mm i.d.) with 0.25 µm film thickness (Alltech, Illinois, USA). Helium was used as carrier gas (with a constant flow rate of 1 ml/min). Temperature setting was as follows: injector 220℃ and detector 240℃. The oven temperature was held at 80℃ for 5 min, programmed to 240℃ at 4℃/min and held for 30. Acid methyl esters identified by retention time, and the content of fatty acid was calculated by comparison peak areas with standard peak areas. SupelcoTM 37 Component FAME Mix (Sigma – Aldrich Co) was used for the identification of compounds in reference 37 mixture of fatty acids.
Biogas production process
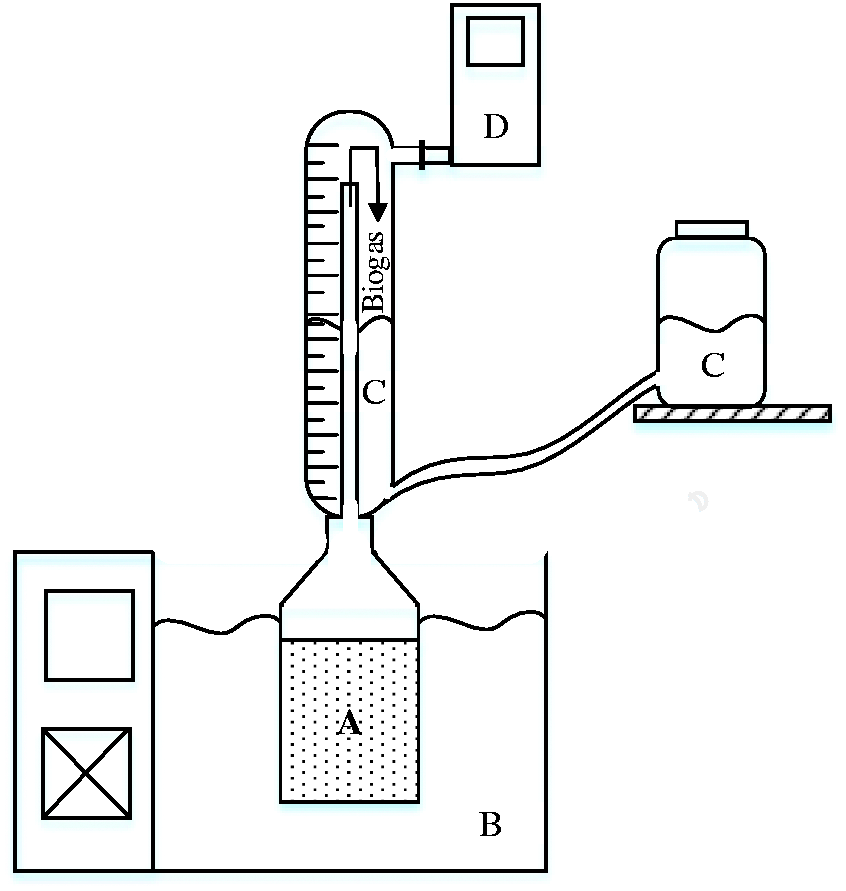
Figures 1 and 2 show how biogas was generated from WW by one- and two-stage fermentation. The experimental reactor for biogas production is presented in Figure 3. For the one-stage biogas production, the pH of the WW samples was adjusted with Na2CO3 up to a pH of 7.1–7.2. After pH adjustment, the WW samples were mixed with anaerobic sludge in a 1:1 ratio in 1000 ml glass bottles. The total volume was 800 ml. The media were supplemented with 1 ml per litre of a trace element solution (nitrilotriacetic acid 1.5 g, MgSO4·7H2O 3.0 g, MnSO4·H2O 0.5 g, NaCl 1.0 g, FeSO4·7H2O 0.1 g, CoSO4·7H2O 0.18 g, CaCl2·2H2O 0.1 g, ZnSO4·7H2O 0.18 g, CuSO4·5H2O 0.01 g, KAl(SO4)2·12H2O 0.02 g, H3BO3 0.01 g, Na2MoO4·2H2O 0.01 g, NiCl2·6H2O 0.03 g, Na2SeO3·5H2O 0.3 mg, K2HPO4 0.35 g, KH2PO4 0.23 g, distilled water up to 1 l). Methanogenesis was carried out at 37℃ for 11 days. For biogas purification, 6 mol/l NaOH was used. The biogas was measured using an Optima 7 Biogas Analyser (MRU Messgeräte für Rauchgase und Umweltschutz GmbH, Neckarsulm, Germany).
The scheme of one-stage (acetogenesis) protocol of methane production applied in the work. The scheme of two-stage (acetogenesis and methanogenesis) protocol of methane production applied in the work. Scheme of the experimental set-up used for anaerobic digestion of WW (A = substrate; B = water bath; C = saturated sodium hydroxide solution; D = gas analyser).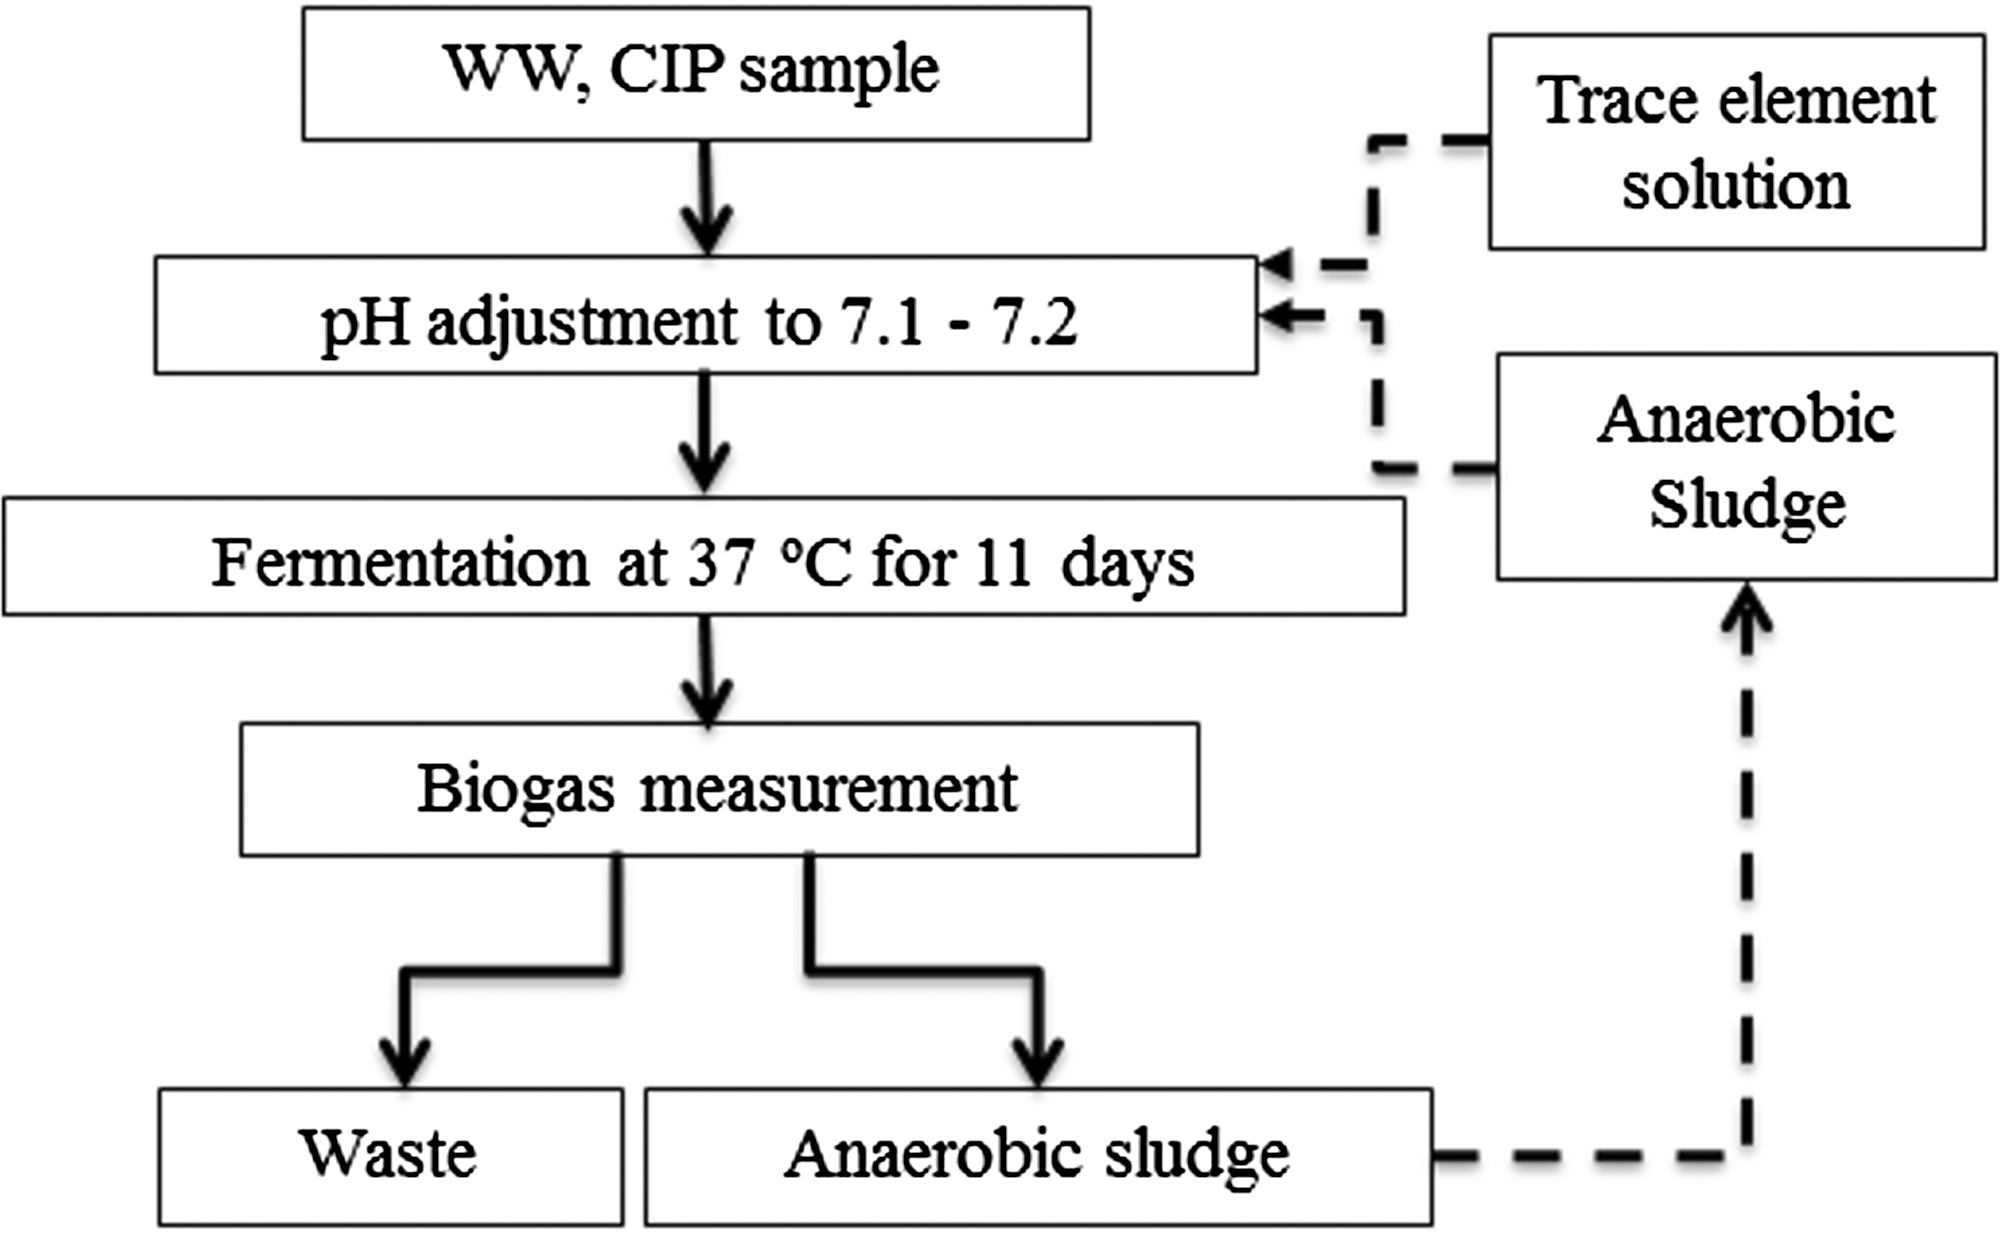
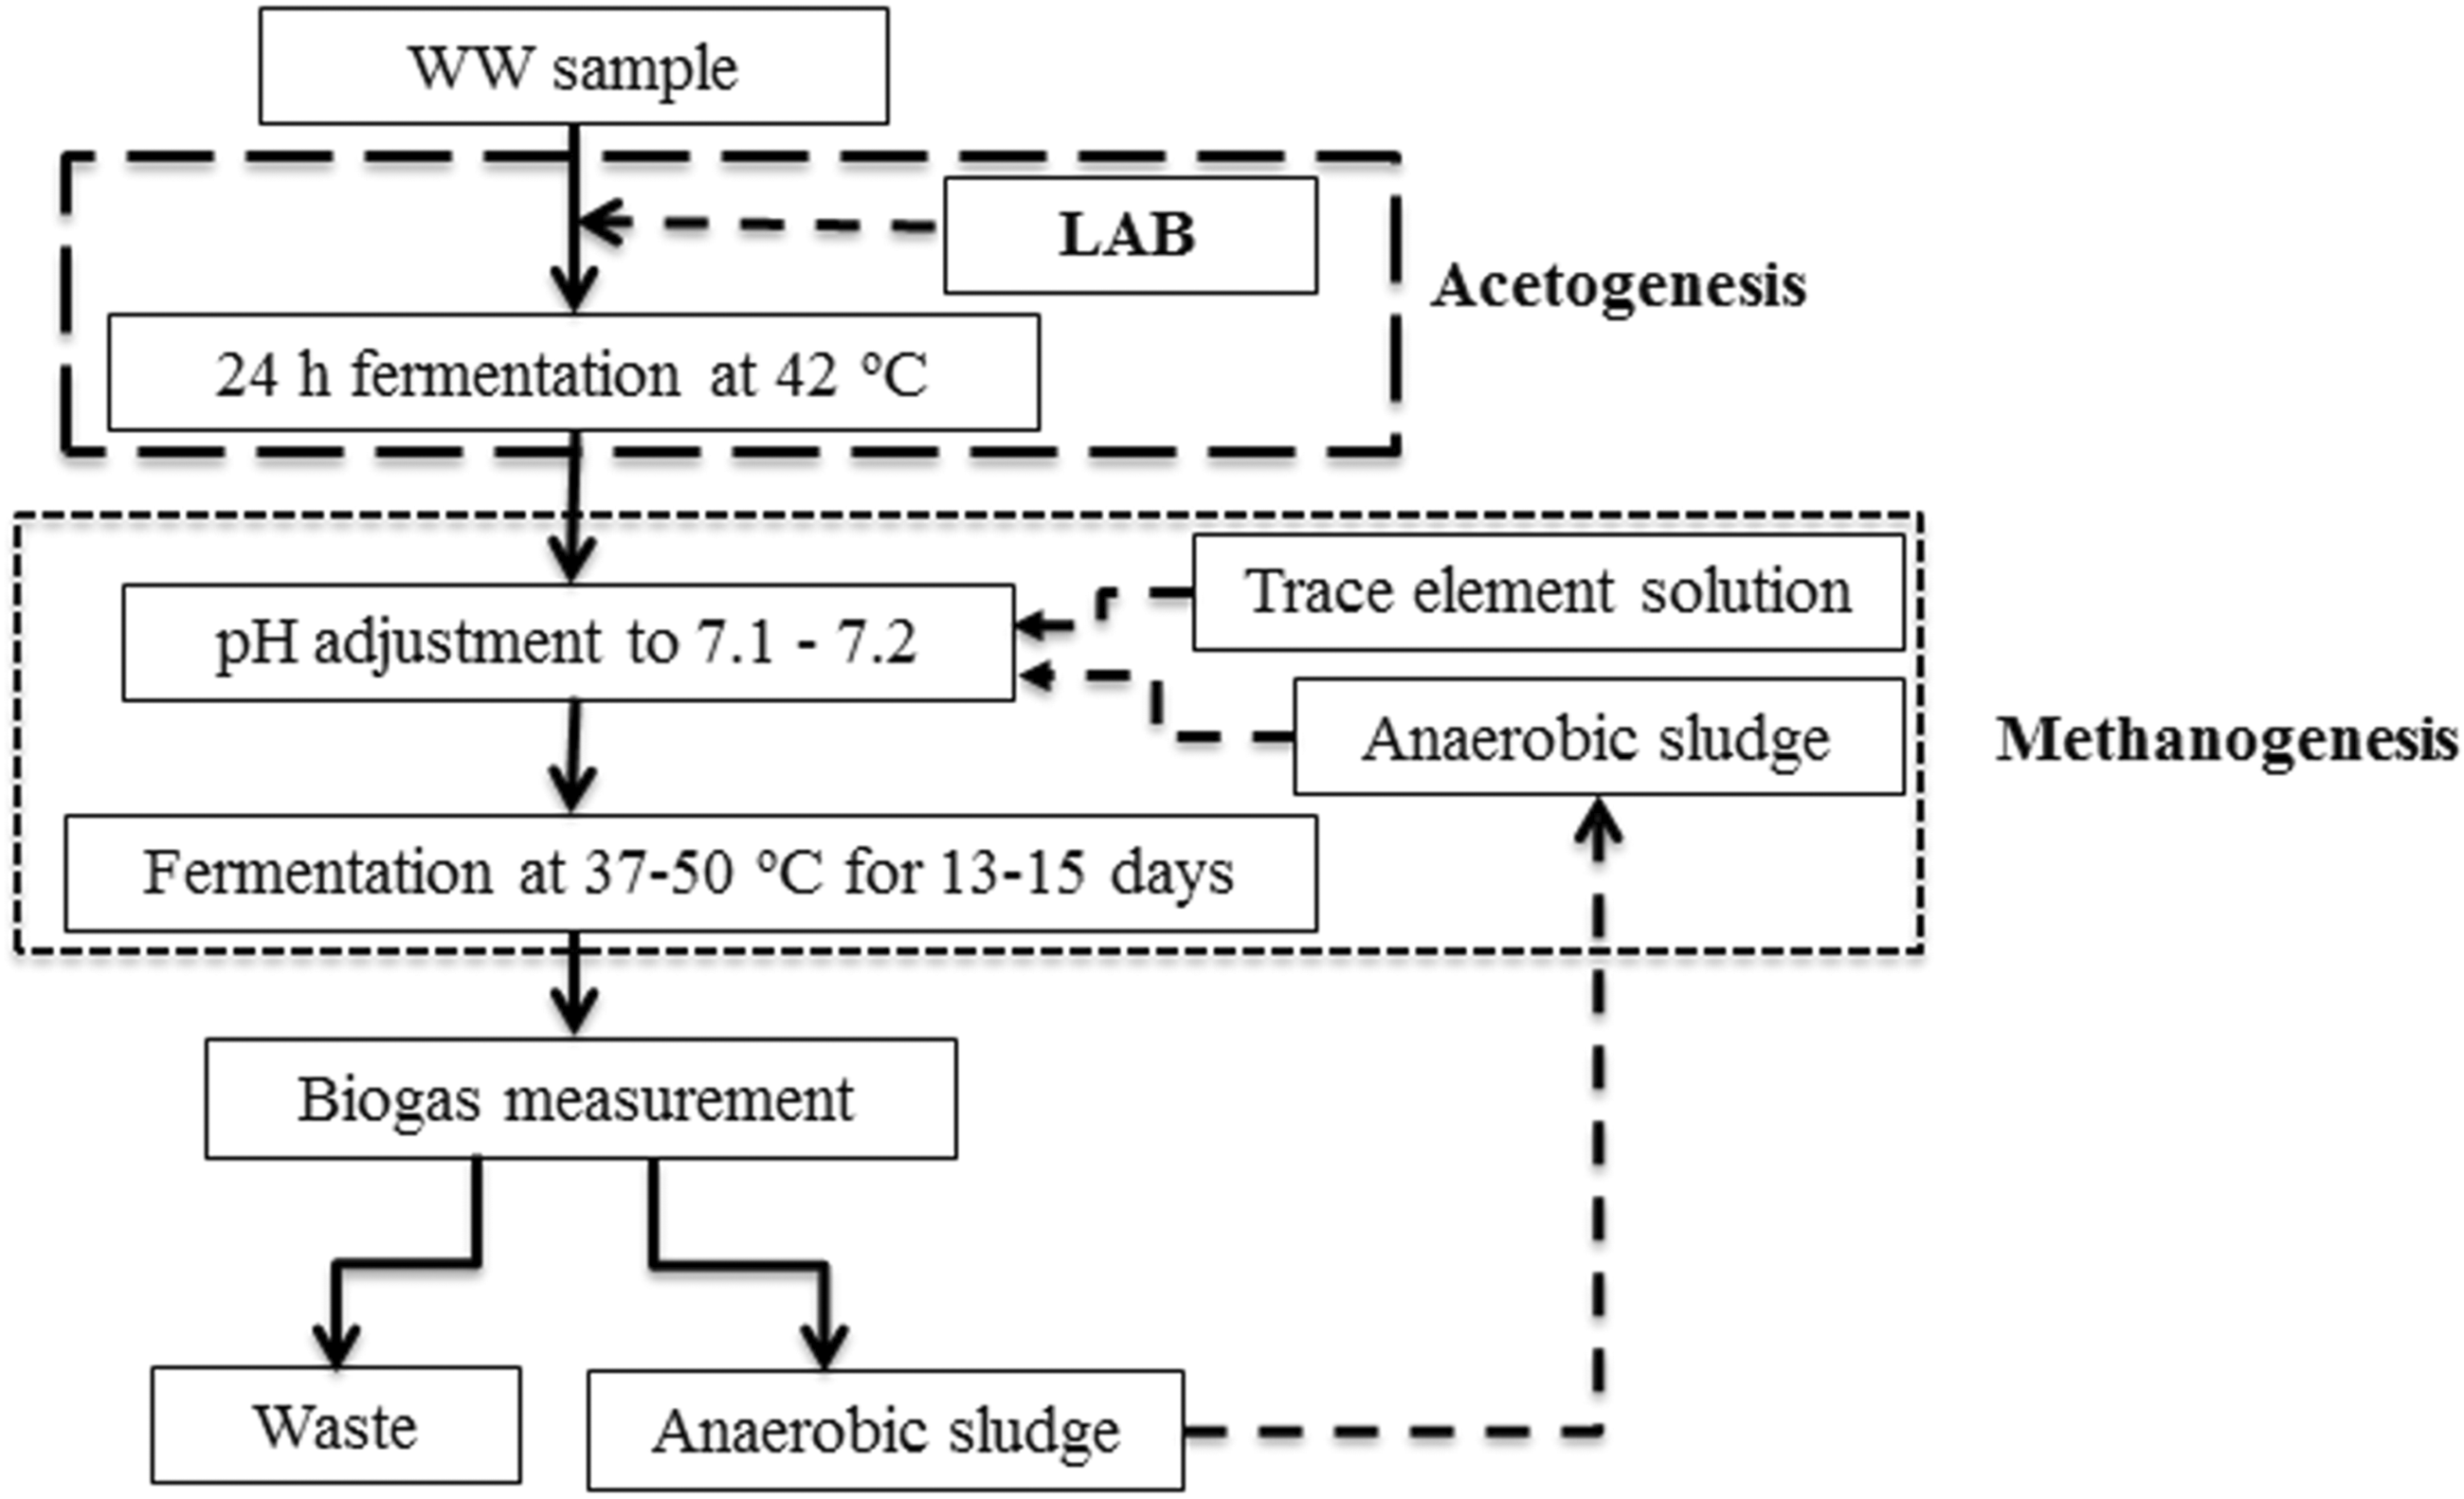
For the two-stage fermentation, first 2% of L. delbrueckii subsp. bulgaricus (propagated in MRS media) suspension was used to ferment WW at 42℃ temperature for 24 h. After 24 h of fermentation with LAB, the pH values of the samples were adjusted with Na2CO3 up to a pH of 7.1–7.2. One millilitre per litre of trace element solution was added to the solution as described above.
Chemical oxygen demand (COD) and biochemical oxygen demand (BOD) analysis
The COD and BOD of the WW samples after acetogenesis and after methanogenesis were measured utilizing the Standard Methods for the Examination of Water and Wastewater (Maiti, 2004).
Statistical analysis
Statistical data analysis was performed using a Microsoft Excel spreadsheet and the statistical program for Windows (SPSS Ver.16.0). Means were compared using one-way analysis of variance. The significance level was set to P < 0.05.
Results and discussion
NMR analysis of the dairy WW samples
Relative content of the main metabolites in the WW samples.
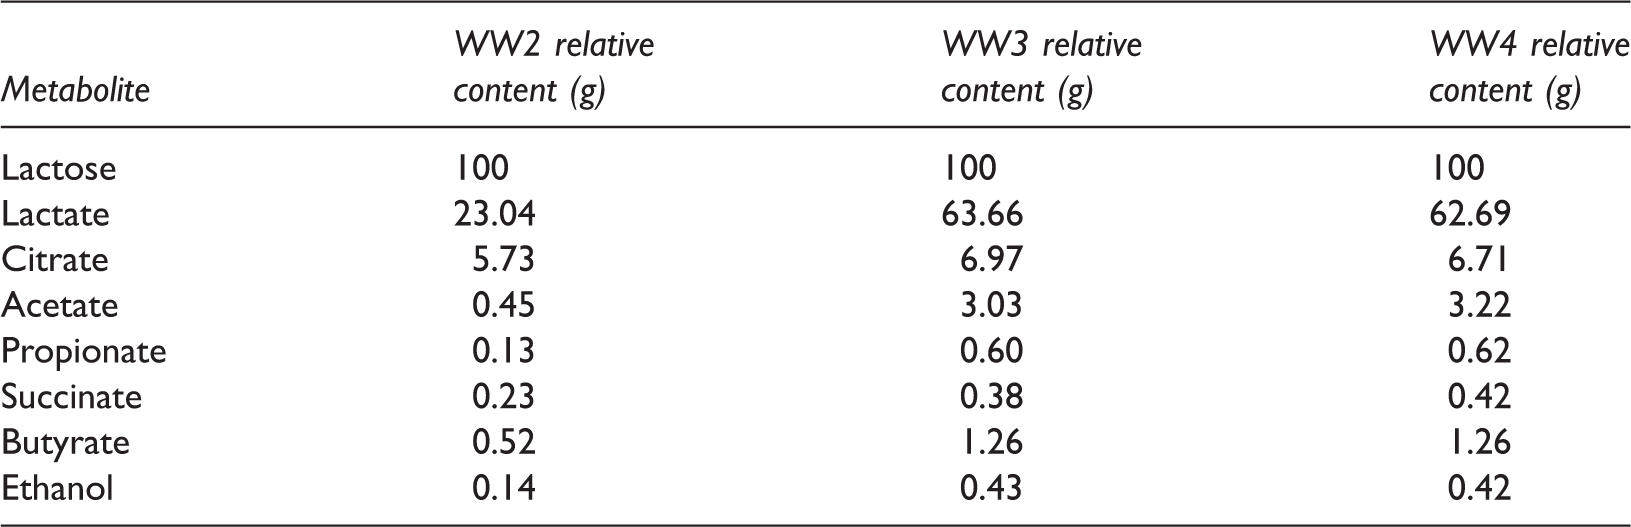
The data were normalised to the lactose content in each sample.
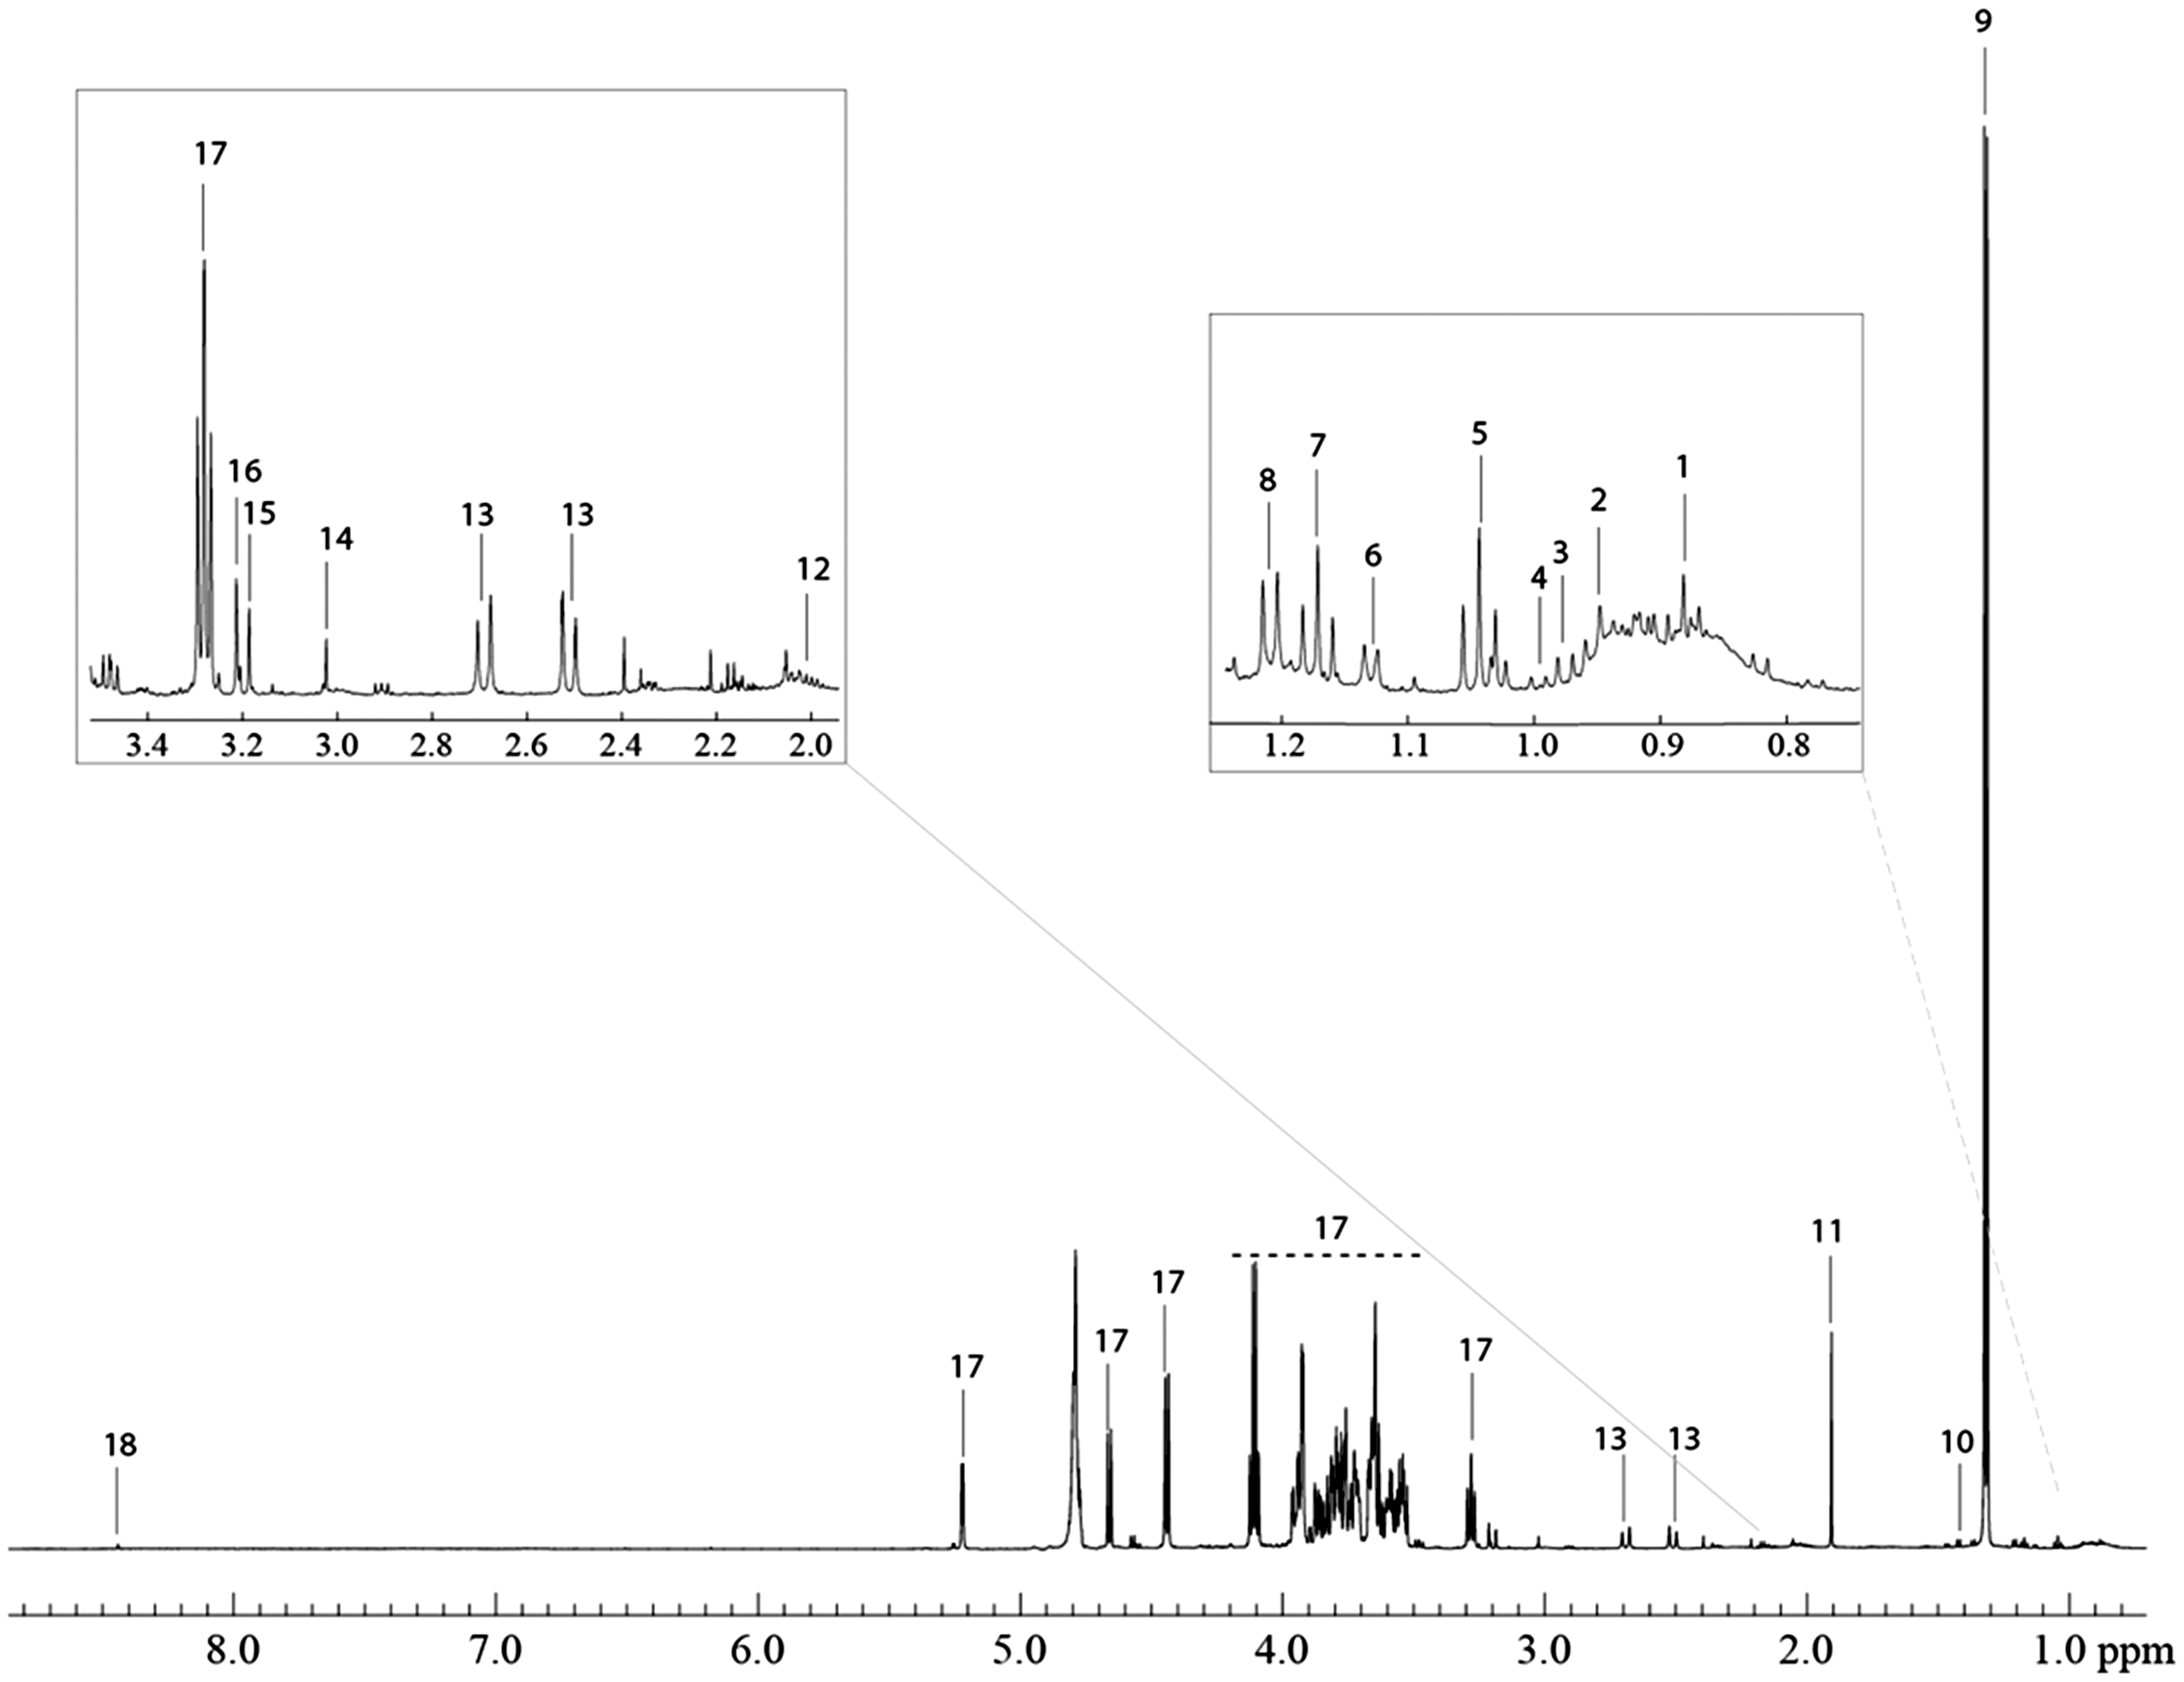
In all, 600 MHz 300 K 1D 1H NMR spectrum of the WW3 sample. The assigned metabolites are as follows: 1 – butyrate; 2 – leucine; 3 – valine; 4 – isoleucine; 5 – propionate; 6 – 1,2-propanediol; 7 – ethanol; 8 – 2,3-butanediol; 9 – lactate; 10 – alanine; 11 – acetate; 12 – proline; 13 – citrate; 14 – creatine; 15 – choline; 16 – carnitine; 17 – lactose; 18 – formate.
Characteristics of the dairy WW samples
Characteristics of the dairy wastewater samples.
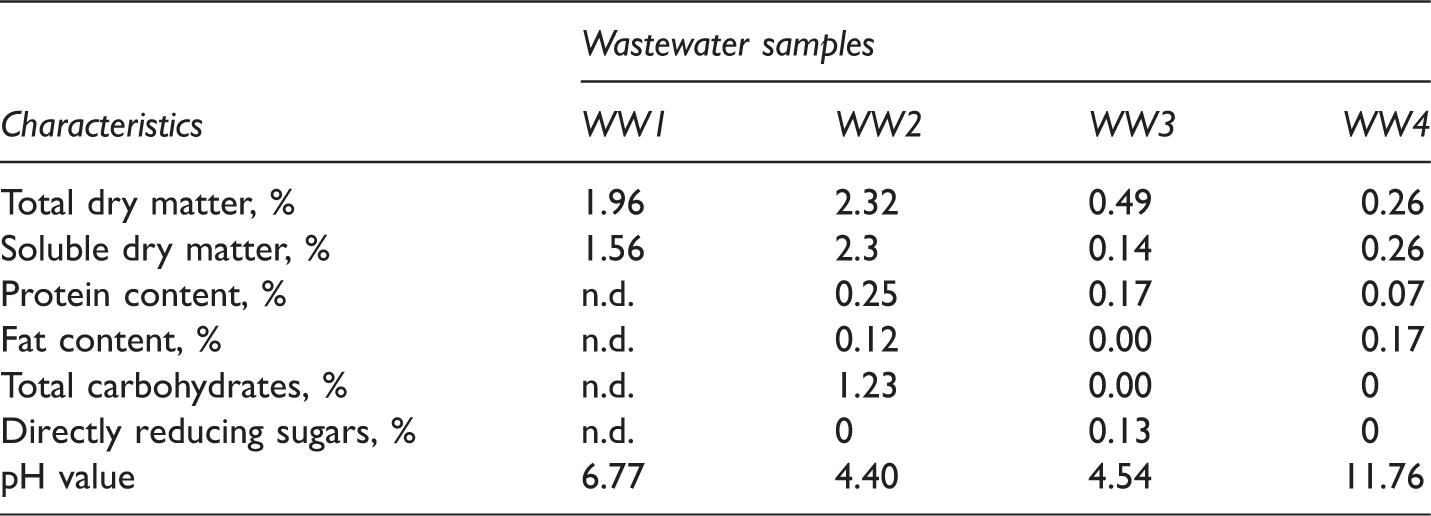
n.d.: not determined.
Ability of LAB to produce volatile acidic compounds
It was determined that the content of volatile acids in the WW samples upon fermentation with LAB depends on the fermentation time and the used LAB strains (Figure 5). The highest amount of volatile acidic compounds was produced during 24 h of fermentation with L. delbruecki spp. bulgaricus. The content of volatile acids compounds after fermentation with the other tested LAB was significantly lower. The content of volatile acidic compounds during fermentation with L. delbruecki spp. bulgaricus first increased up to 8 g/l after 24 h of fermentation, whereas after 48 h, the content of acidic volatile compounds decreased 2 times. Meanwhile, the content of volatile acidic compounds during WW fermentation without starter cultures was the lowest after 24 h with 1.6 and 2.8 g/l after 48 h. This suggests the suitability of L. delbruecki spp. bulgaricus for the acetogenesis processes. Therefore, for further experiments, L. delbruecki spp. bulgaricus was used for the WW acidification process. L. delbruecki spp. bulgaricus are thermophilic, rod shaped, gram positive, non-motile bacteria. Common to this species is the ability to ferment sugar substrates into lactic acid products under anaerobic conditions. An earlier Kafsi et al. (2014) study of the first completely sequenced L. delbruecki ssp. bulgaricus genome revealed the characteristics of a genome in an active phase of rapid evolution, in what appears to be an adaptation to the milk environment. These bacteria are historically distinguished on the basis of their capacity to metabolize different carbohydrates (Weiss et al., 1983). As noted, such properties are restricted to enzyme expression within its genome. L. delbrueckii subsp. bulgaricus can metabolize lactose, glucose, fructose and mannose (Kitazawa et al., 2000).
The content of volatile acid compounds produced from WW2 after 24 and 48 h of fermentation with LAB (K-control without LAB; Pp10, Pp9, Pp8 – P. pentosaceus strains; Pa7 – P. acidilactici; Ls – L. sakei; Lb – L. delbrüeckii spp. bulgaricus).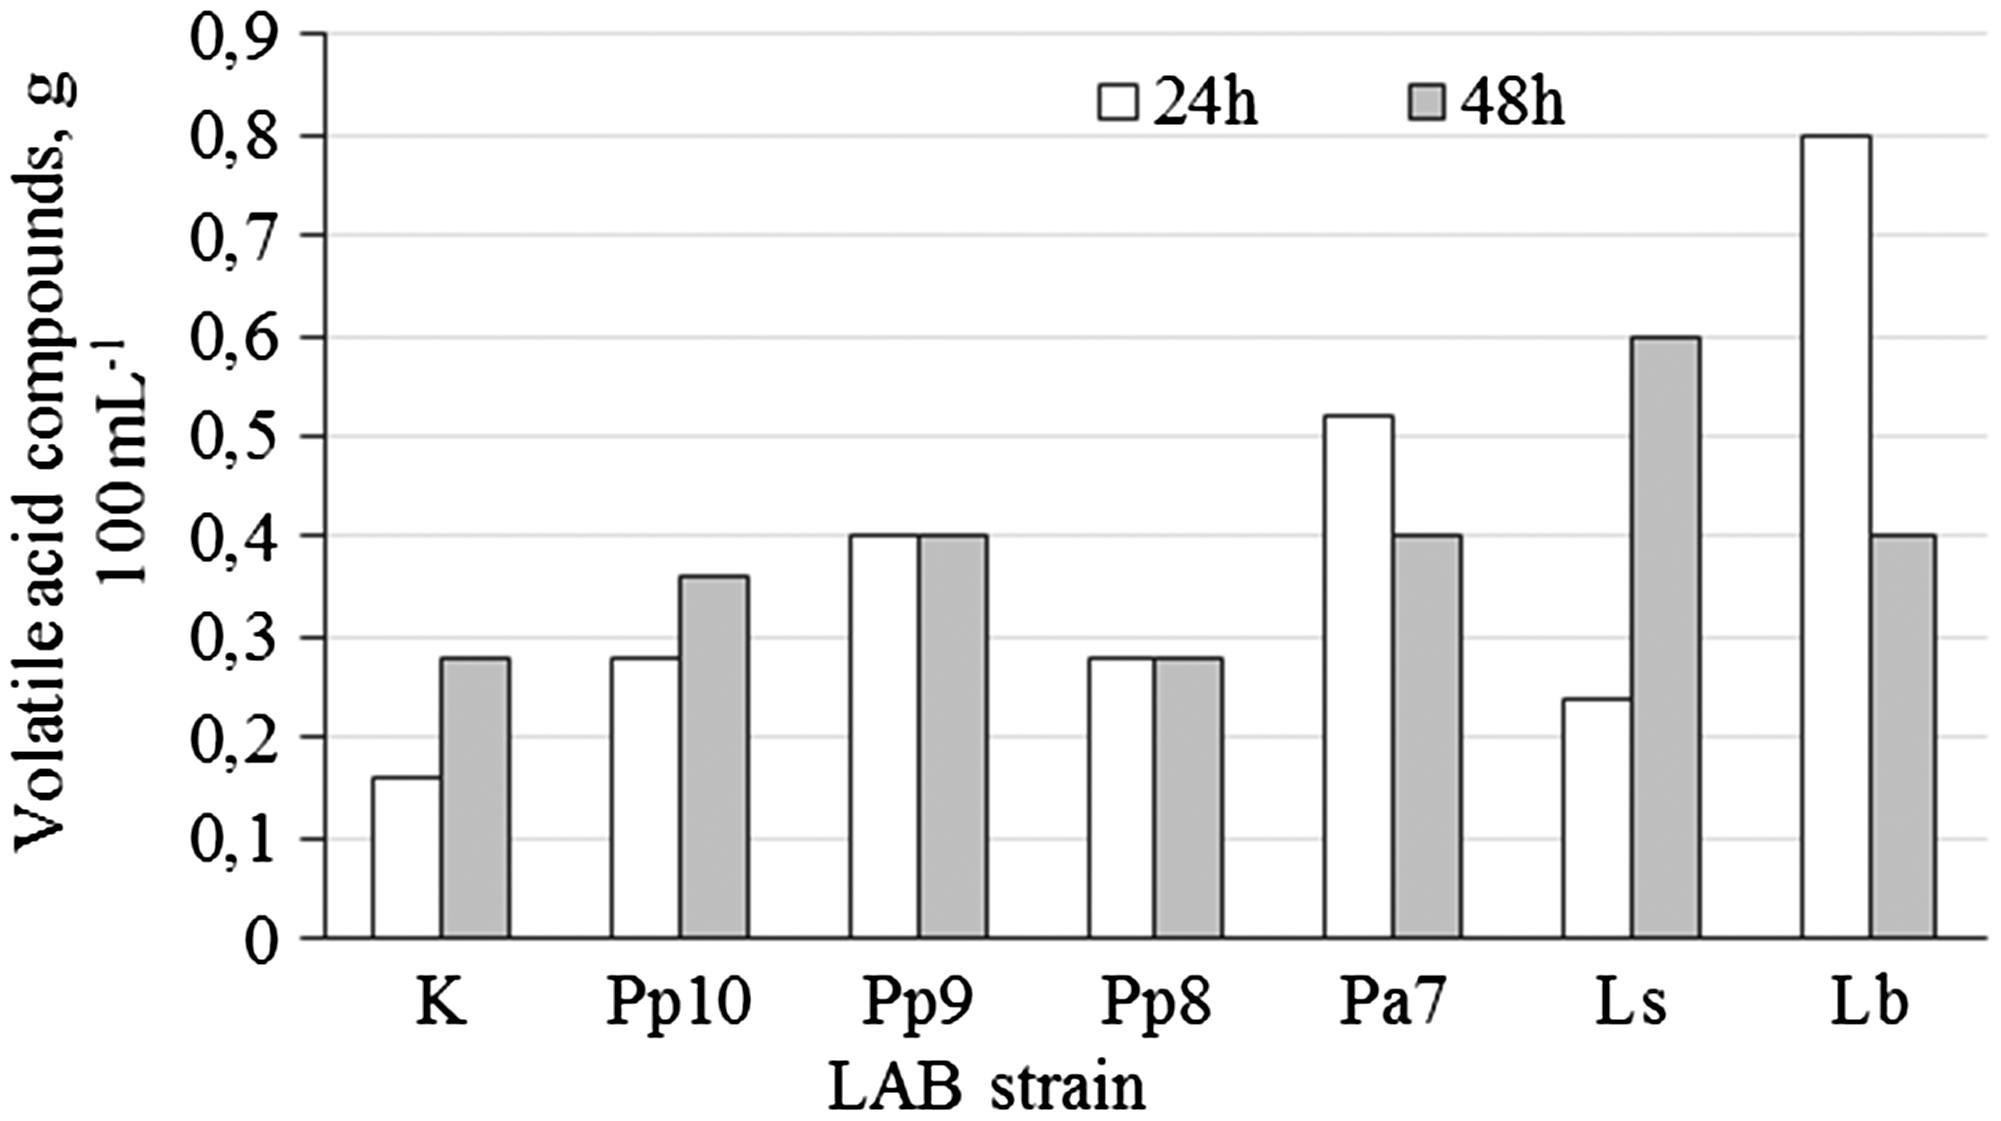
Percentages of fatty acids in pasteurized cheese whey permeate before and after fermentation.
Biogas production from WW samples
Figure 6 illustrates the amounts of methane produced upon methanogenesis (one-stage biogas production) and separate acetogenesis and methanogenesis processes (two-stage biogas production). Fermenting using the two-stage process increased the methane production from all dairy WW samples. The highest methane production of 70% and 76% were obtained from the samples WW2 and WW3 upon two-stage biogas production, whereas significantly less methane was produced using the one-stage fermentation protocol (respectively 18% and 38%). WW4 was the sample from which the lowest yield of methane was obtained during the one-stage fermentation (2% one-stage, 37% two-stage). The low methane yield of WW4 could be explained by its initial chemical composition: the lowest available amount of protein, total dry matter, total carbohydrates, directly reducing sugars and a very high pH value (11.76). These results suggest that the composition of WW strongly affects methane production even when the WW is obtained from the same dairy company. The content of methane significantly increased by applying a two-stage fermentation protocol to WW samples containing higher amount of protein and total dry matter. This could be explained that LAB during acidogenesis increase the amount of volatile acid compounds (Figure 5) that has the potential to increase the formation of a higher content of methane.
The content of biogas under one- and two-stage methane production (after 11 days, at 37℃, alkaline cleaning) from different WW.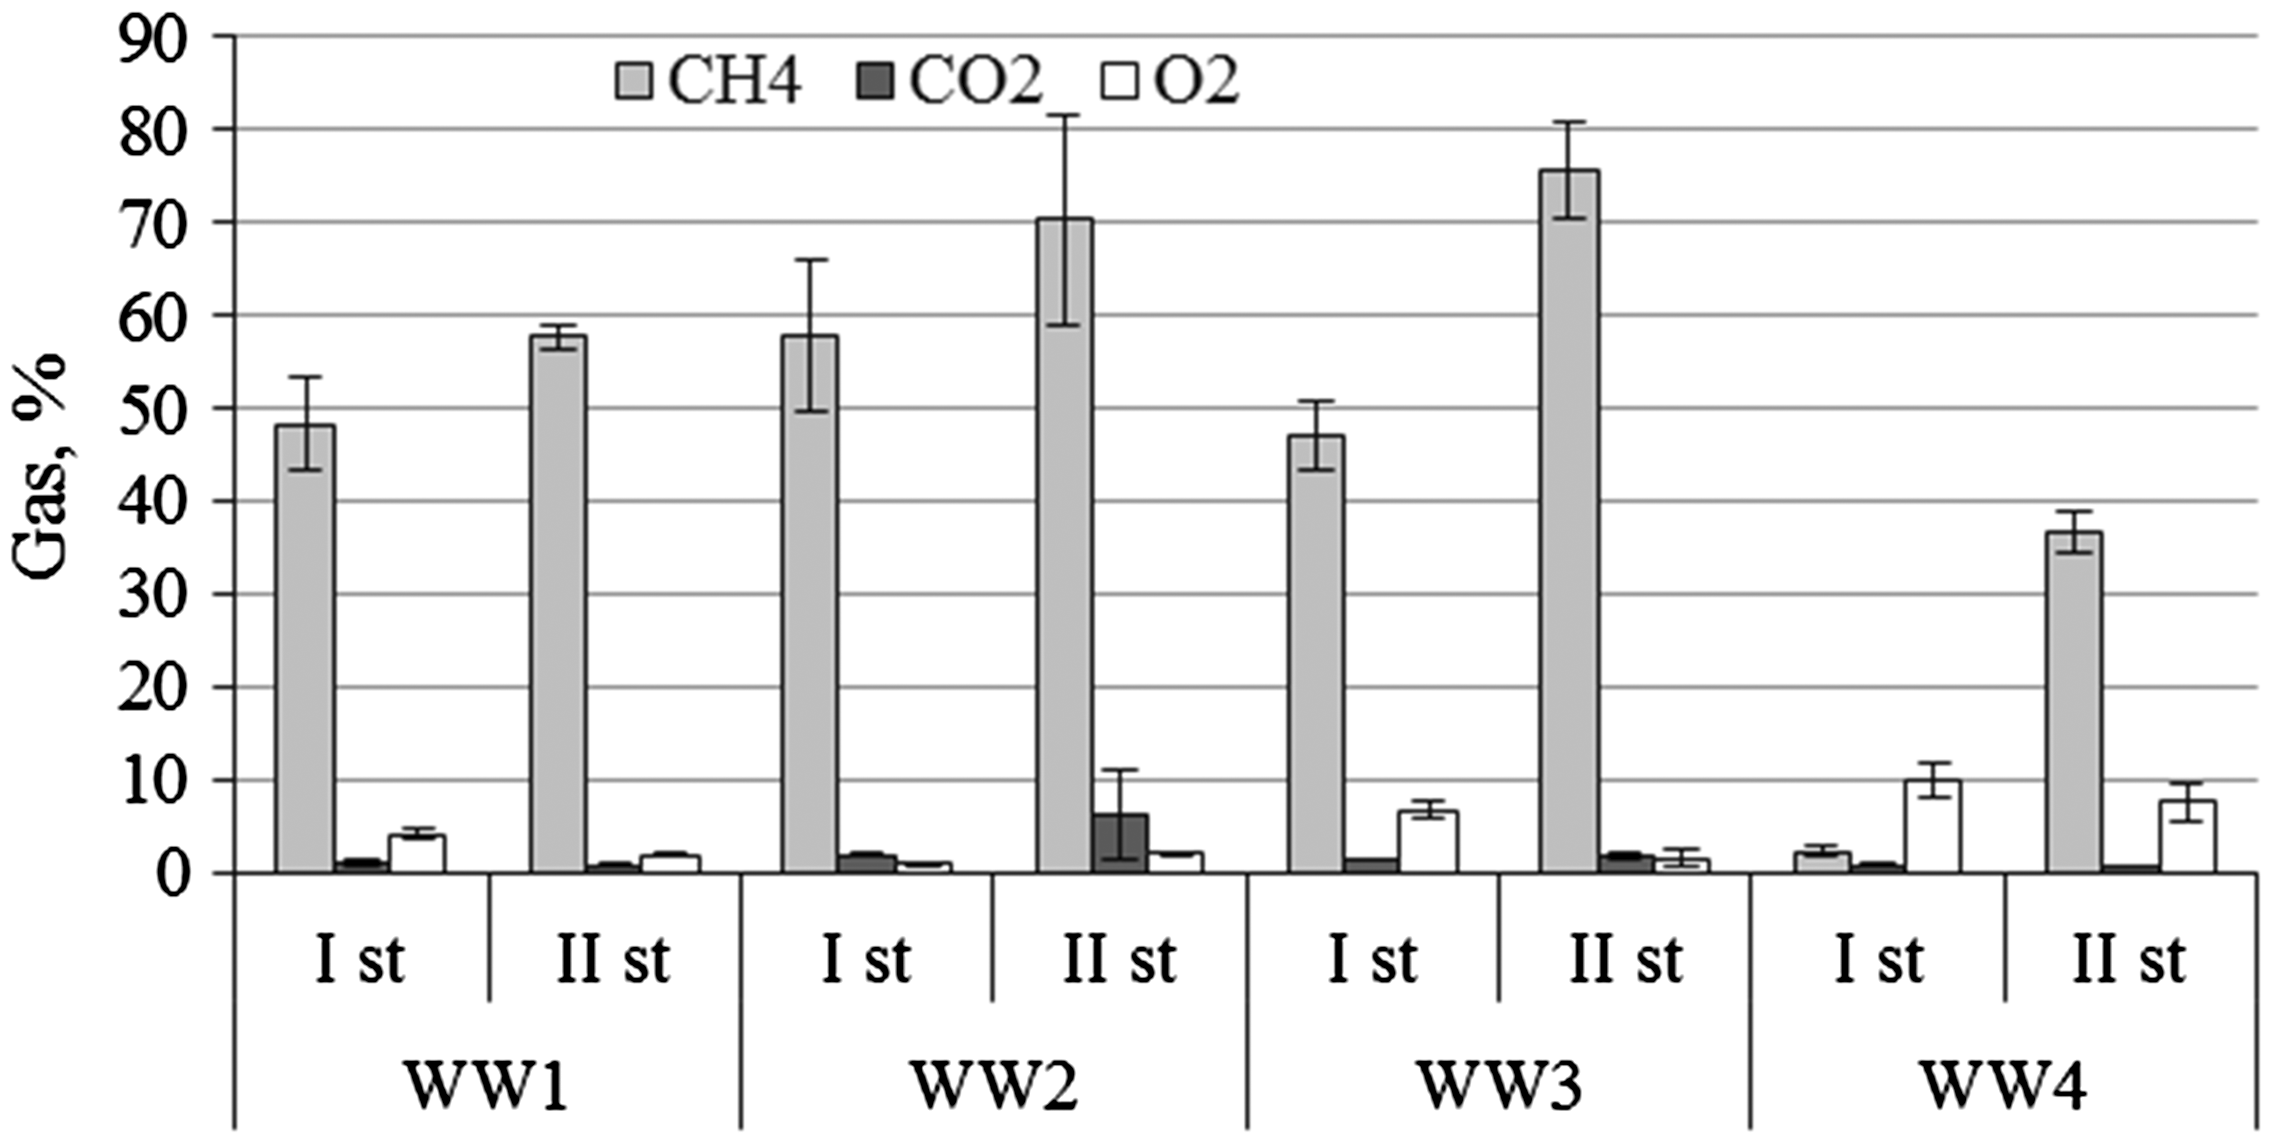
The content of carbon dioxide varied from 0.73% to 6.19% after 11 days of biogas production, whereas the content of O2 varied from 0.9% to 10% (see Figure 6). The lowest values were detected after a two-stage fermentation procedure. This indicates that a two-stage system is especially suitable for treating dairy WW containing high amounts of organic compounds, as it can improve the stability and efficiency of the process. The separation of the acetogenesis and methanogenesis processes into two separate stages increases the substrate hydrolysis efficiency. The two-stage process also allows to better control the pH, concentrations of acids and nutrients, temperature and organic load rates. All these parameters, if let uncontrolled, may lead to an inhibition of the methanogens used for biogas production (Appels et al., 2008; Parawira et al., 2005). Moreover, Appels et al. (2008) and Demirel et al. (2005) have shown that separating these steps increases the amount of initial sugars converted into volatile fatty acids, compared to the single-stage system. Our study suggests that a two-stage fermentation with Lactobacillus delbrueckii subsp. bulgaricus has the potential to be utilised for the production of biogas and is to be preferred to the one-stage process.
Methane impurity
The most common impurity in methane production is H2S. The content of H2S in biogas from the WW samples varied from 0 to 252.5 ppm. The concentration was found to depend upon the WW sample utilised and the fermentation protocol (one-stage compared to two-stages). A significant higher H2S content (7 to 252.5 ppm (0.0012 to 0.0330% of total biogas content)) was detected after the two-stage protocol compared to the one-stage fermentation (0 to 49 ppm (up to 0.008% of total biogas content)) (see Figure 7); moreover, much less biogas was generally produced during the one-stage reaction. This trend might be explained by the fact that higher amounts of volatile acid compounds may lead to hydrogen sulphide formation. Similar data were reported by Chambers and Potter (2002) who noted that the H2S in biogas can range between 50–10,000 ppm depending on the feed material composition. Truong and Abatzoglou (2005) reported that the H2S levels range between 200–5000 ppm in biogas from municipal facilities and over 30,000 ppm from industrial WW treatments. These authors also report that impurities, such as ammonia and sulphur compounds, may have an inhibitory effect on the AD process leading to a lower yield of methane (Truong and Abatzoglou, 2005).
The content of H2S under one- and two-stage methane production (after 11 days, at 37℃, alkaline cleaning) from different WW.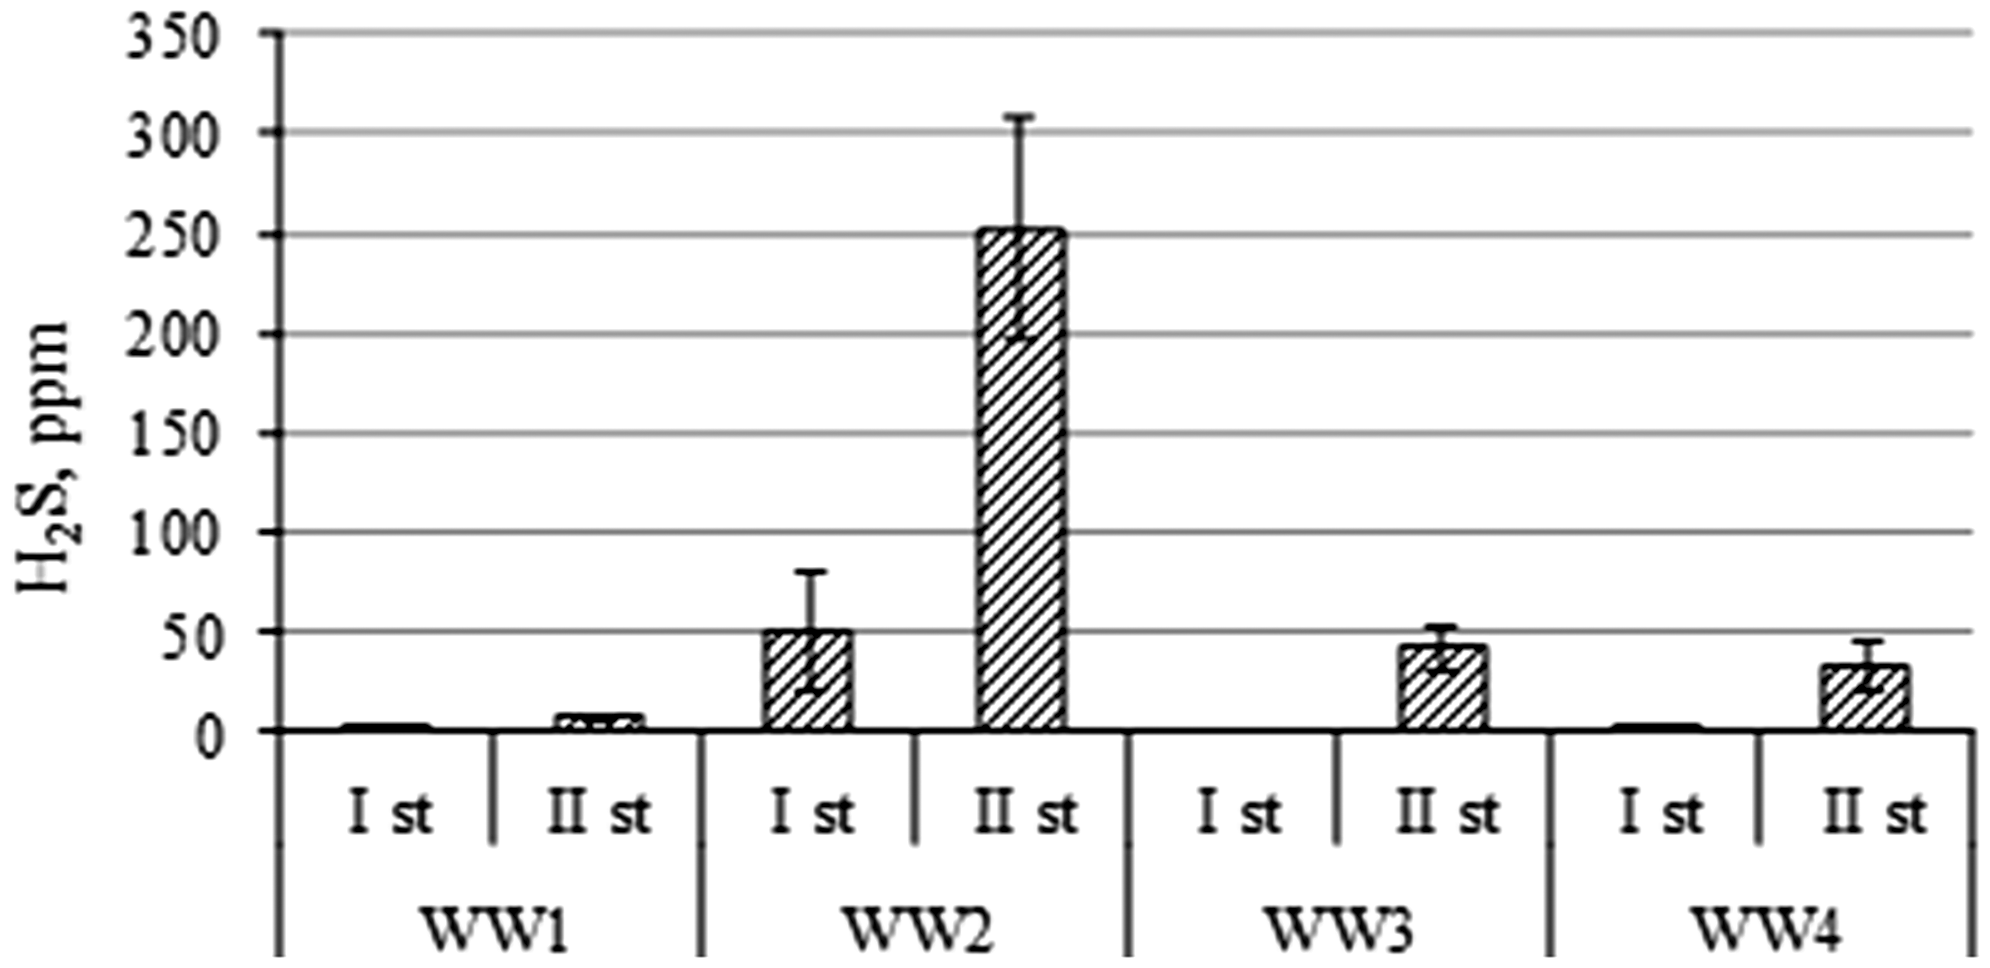
The second most common gas obtained during methane (CH4) production is carbon dioxide (CO2). The composition of the biogas (CH4 and CO2) obtained within this study is presented in Figure 8. Sample WW1 produced the highest content of CH4 98.0% and 98.7% under one- and two-stage protocols, respectively. A similar CH4 content was obtained from the WW3 sample with, respectively, 97.2% and 97.8%. From the WW2 sample, 96.9% and 91.9% of methane was obtained, whereas the CH4 content of WW4 was significantly higher after the two-stage (98.0%) biogas production in comparison with the one-stage process (75.8%). The results show that CO2 content mainly depend on WW type.
The purity of biogas from the WW samples using one and two-stages of biogas production (after 11 days, at 37℃, alkaline cleaning).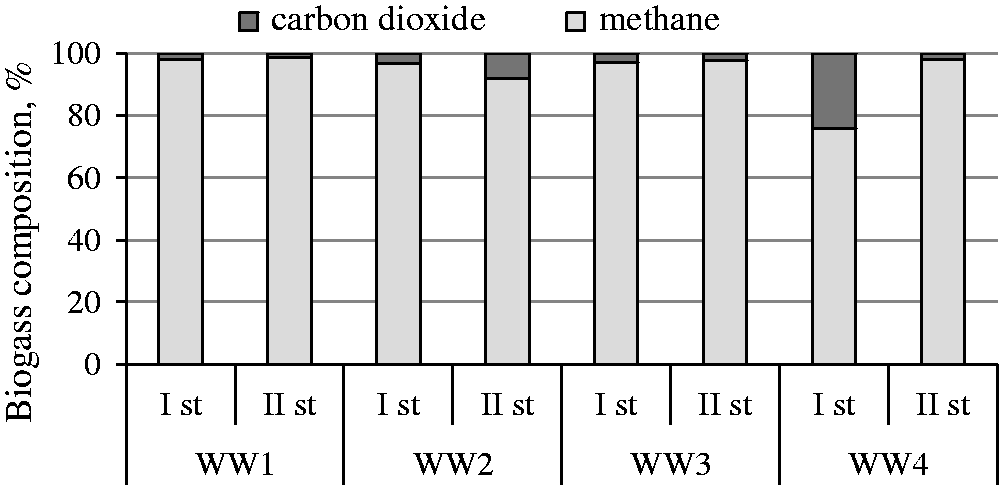
The influence of WWs fermentation on sludge BOD and COD values
COD and BOD values of WW before and after treatment.
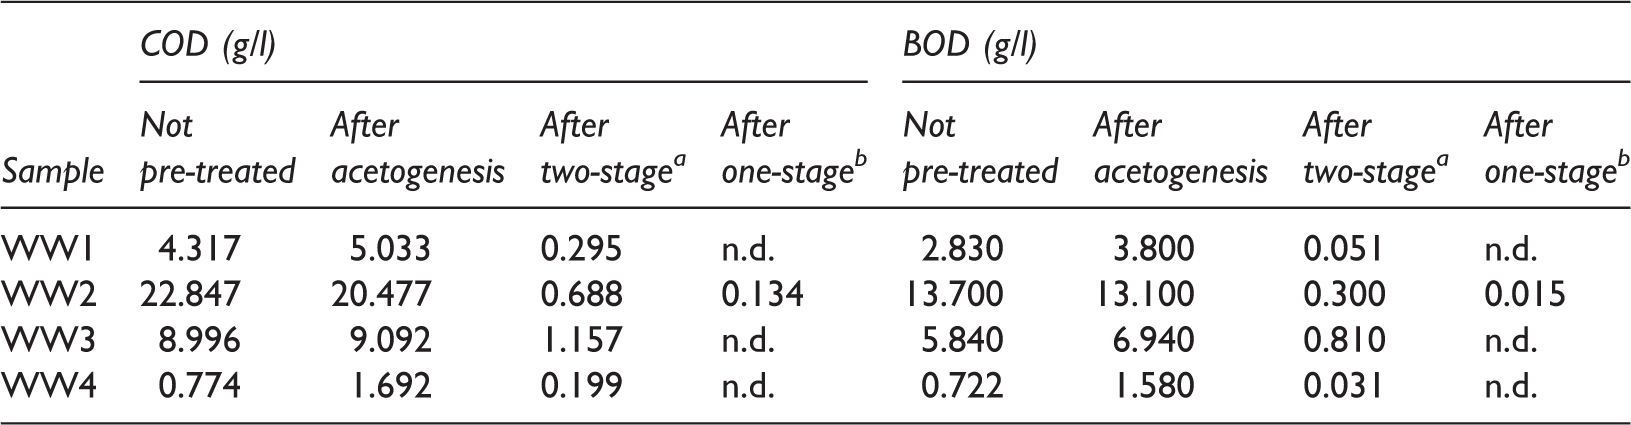
After acetogenesis and methanogenesis.
After methanogenesis.
n.d.: not determined.
Conclusions
Dairy WW is a good source of important bio-refinery relevant compounds such as lactose, lactic, acetic and citric acid. Other compounds present within the samples are amino acids, alcohols, organic acids and trimethylalkylammonium compounds. Out of the studied strains, Lactobacillus delbrueckii subsp. bulgaricus produces the highest levels of volatile acidic compounds and is therefore most suited for processing dairy WWs. The efficiency of the methanogenesis process and the biogas yield is significantly affected by the fermentation protocol and the WW sample utilised. The separation of acetogenesis and methanogenesis in a two-stage process is preferable, as it increases methane content. The pre-treatment of dairy WWs with anaerobic sludge for 11 days effectively decreases the COD and BOD of 99.9% and 99.4%, respectively. The content of H2S in biogas from the WW samples varied from 0 to 252.5 ppm and is dependent on the fermentation protocol and the WW sample utilised.
Footnotes
Declaration of conflicting interests
The author(s) declared no potential conflicts of interest with respect to the research, authorship, and/or publication of this article.
Funding
The author(s) disclosed receipt of the following financial support for the research, authorship, and/or publication of this article: This work has received funding from the European Union’s Seventh Framework Programme for research, technological development and demonstration (Grant Agreement Number 613589, SUSMILK).