
Abstract
TNF-α alters leukocyte adhesion molecule expression of cultured endothelial cells like human umbilical vein endothelial cells (HUVEC). This study was designed to investigate the changes in vascular cell adhesion molecule-1 (VCAM-1), intercellular adhesion molecule-1 (ICAM-1), and platelet endothelial cell adhesion molecule-1 (PECAM-1) expression with TNF-α stimulation in cultured human neonatal dermal lymphatic endothelial cells (HNDLEC). The real-time quantitative PCR analysis on HNDLEC showed that TNF-α treatment leads to increases of VCAM-1 and ICAM-1 mRNAs to the 10.8- and 48.2-fold levels of untreated cells and leads to a reduction of PECAM-1 mRNA to the 0.42-fold level of untreated cells. Western blot and immunohistochemical analysis showed that TNF-α leads to VCAM-1 and ICAM-1 expressions that were inhibited by antiserum to human TNF receptor or by AP-1 inhibitor nobiletin. In flow cytometry analysis, the number of VCAM-1- and ICAM-1-positive cells increased, and PECAM-1-positive cells decreased with TNF-α treatment. Regarding protein amounts produced in cells and amounts expressed on the cell surface, VCAM-1 and ICAM-1 increased in HNDLEC and HUVEC, and PECAM-1 decreased in HNDLEC in a TNF-α concentration-dependent manner. VCAM-1, ICAM-1, and PECAM-1 protein amounts in TNF-α-stimulated cells were lower in HNDLEC than in HUVEC. This suggests that the lymphatic endothelium has the TNF-α-induced signaling pathway, resulting in increased VCAM-1 and ICAM-1 expression to a weaker extent than blood endothelium and PECAM-1 reduction to a stronger extent than blood endothelium.
Keywords
C
On the other hand, expression of leukocyte adhesion molecules on lymphatic vessels in human somatic tissue has been reported (Sawa et al. 1999; Ebata et al. 2001). Lymphatic vessels express only PECAM-1 in the normal human small intestine, whereas they express VCAM-1 and ICAM-1 in the inflamed human small intestine, suggesting that induction of leukocyte adhesion molecules with inflammatory cytokines occurs in lymphatic vessels as well as in blood vessels (Sawa et al. 1999). Expression dynamics of these molecules on the lymphatic endothelium with inflammatory cytokines is poorly understood; however, recent discoveries of several lymphatic endothelial markers such as LYVE-1, podoplanin, and Prox-1 (Banerji et al. 1999; Breiteneder-Geleff et al. 1999; Wigle and Oliver 1999; Schacht et al. 2003; Saharinen et al. 2004) have enabled an analysis of the events for adhesion molecule expression in lymphatic endothelium. The present study was designed to investigate the change of VCAM-1, ICAM-1, and PECAM-1 expression with TNF-α stimulation in cultured human lymphatic endothelium.
Materials and Methods
Cell Culture
HNDLEC (AngioBio; Del Mar, CA), HUVEC (CC-2505; Cambrex BioScience Walkersville, Walkersville, MD), and human dermal vascular endothelial cells (HDVEC; CC-2543, Cambrex BioScience) were cultured in endothelial cell basal medium (Cambrex).
Immunostaining
Cells were cultured on poly-L-lysine-coated coverslips (Sigma Diagnostics; St Louis, MO) in a six-well plate. Cells forming a 90% confluent monolayer (5 × 10⁵ cells/well) were cultured with the human recombinant TNF-α (10 ng/ml; DakoCytomation, Copenhagen, Denmark) for 24 hr, air dried for 15 min, and fixed in 30% acetone-10 mM PBS, pH 7.2, for 10 min at 4C. Cells were treated with 1 μg/ml of rhodamine-conjugated concanavalin A (rhodamine-conjugated Con A; Molecular Probes, Eugene, OR) diluted in PBS for 5 min at 37C to visualize the cell membrane and immunostained with 1 μg/ml of mouse monoclonal antibodies for human VCAM-1, ICAM-1, and PECAM-1 (R&D Systems; Minneapolis, MN) for 8 hr at 4C. After reacting with the first antibodies, cells were exposed to 0.1 μg/ml of Alexa Fluor (AF) 488-conjugated goat anti-mouse IgG (Molecular Probes) for 1 hr at 20C and examined by laser-scanning microscopy (Axiovert 135M; Carl Zeiss, Jena, Germany) with a ×52 oil planapochromatic objective lens (numerical aperture ×1.3).
To test the expression of lymphatic endothelial cell markers, cells cultured without TNF-α were treated with 1 μg/ml rhodamine-conjugated Con A (Molecular Probes), immuno-stained with 1 μg/ml rabbit anti-human Prox-1 (AngioBio) and mouse anti-human podoplanin (AngioBio), treated with AF 488-conjugated goat anti-mouse or rabbit IgGs (Molecular Probes), and examined by laser-scanning microscopy as described above.
The effect of TNF-α on the expression of adhesion molecules in lymphatic vessels was tested with an in vivo model, using 8-week-old wild-type mice (C57BL6/J; The Jackson Laboratory, Bar Harbor, ME). A 10-μl volume of 100 ng/ml TNF-α diluted in saline or 10 μl of saline was injected into the tongue, frozen 10-μm sections were cut in a cryostat after 24 hr, and the sections were fixed in 30% acetone-PBS for 10 min at 4C. Sections were treated with a cocktail of antibodies as follows: 0.5 μg/ml goat anti-mouse LYVE-1 (R&D Systems), 0.5 μg/ml rat anti-mouse VCAM-1 (R&D Systems), rat anti-mouse ICAM-1 (R&D Systems), or rat anti-mouse PECAM-1 (Southern Biotechnology Associates; Birmingham, AL) for 8 hr at 4C. After reacting with the first antibodies, sections were exposed to a cocktail of antibodies as follows: 0.1 μg/ml AF488-conjugated rabbit anti-goat IgG and AF568-conjugated rabbit anti-rat IgG (Molecular Probes) for 1 hr at 20C and examined by laser-scanning microscopy as described above.
Reverse-Transcriptase PCR and Real-Time PCR
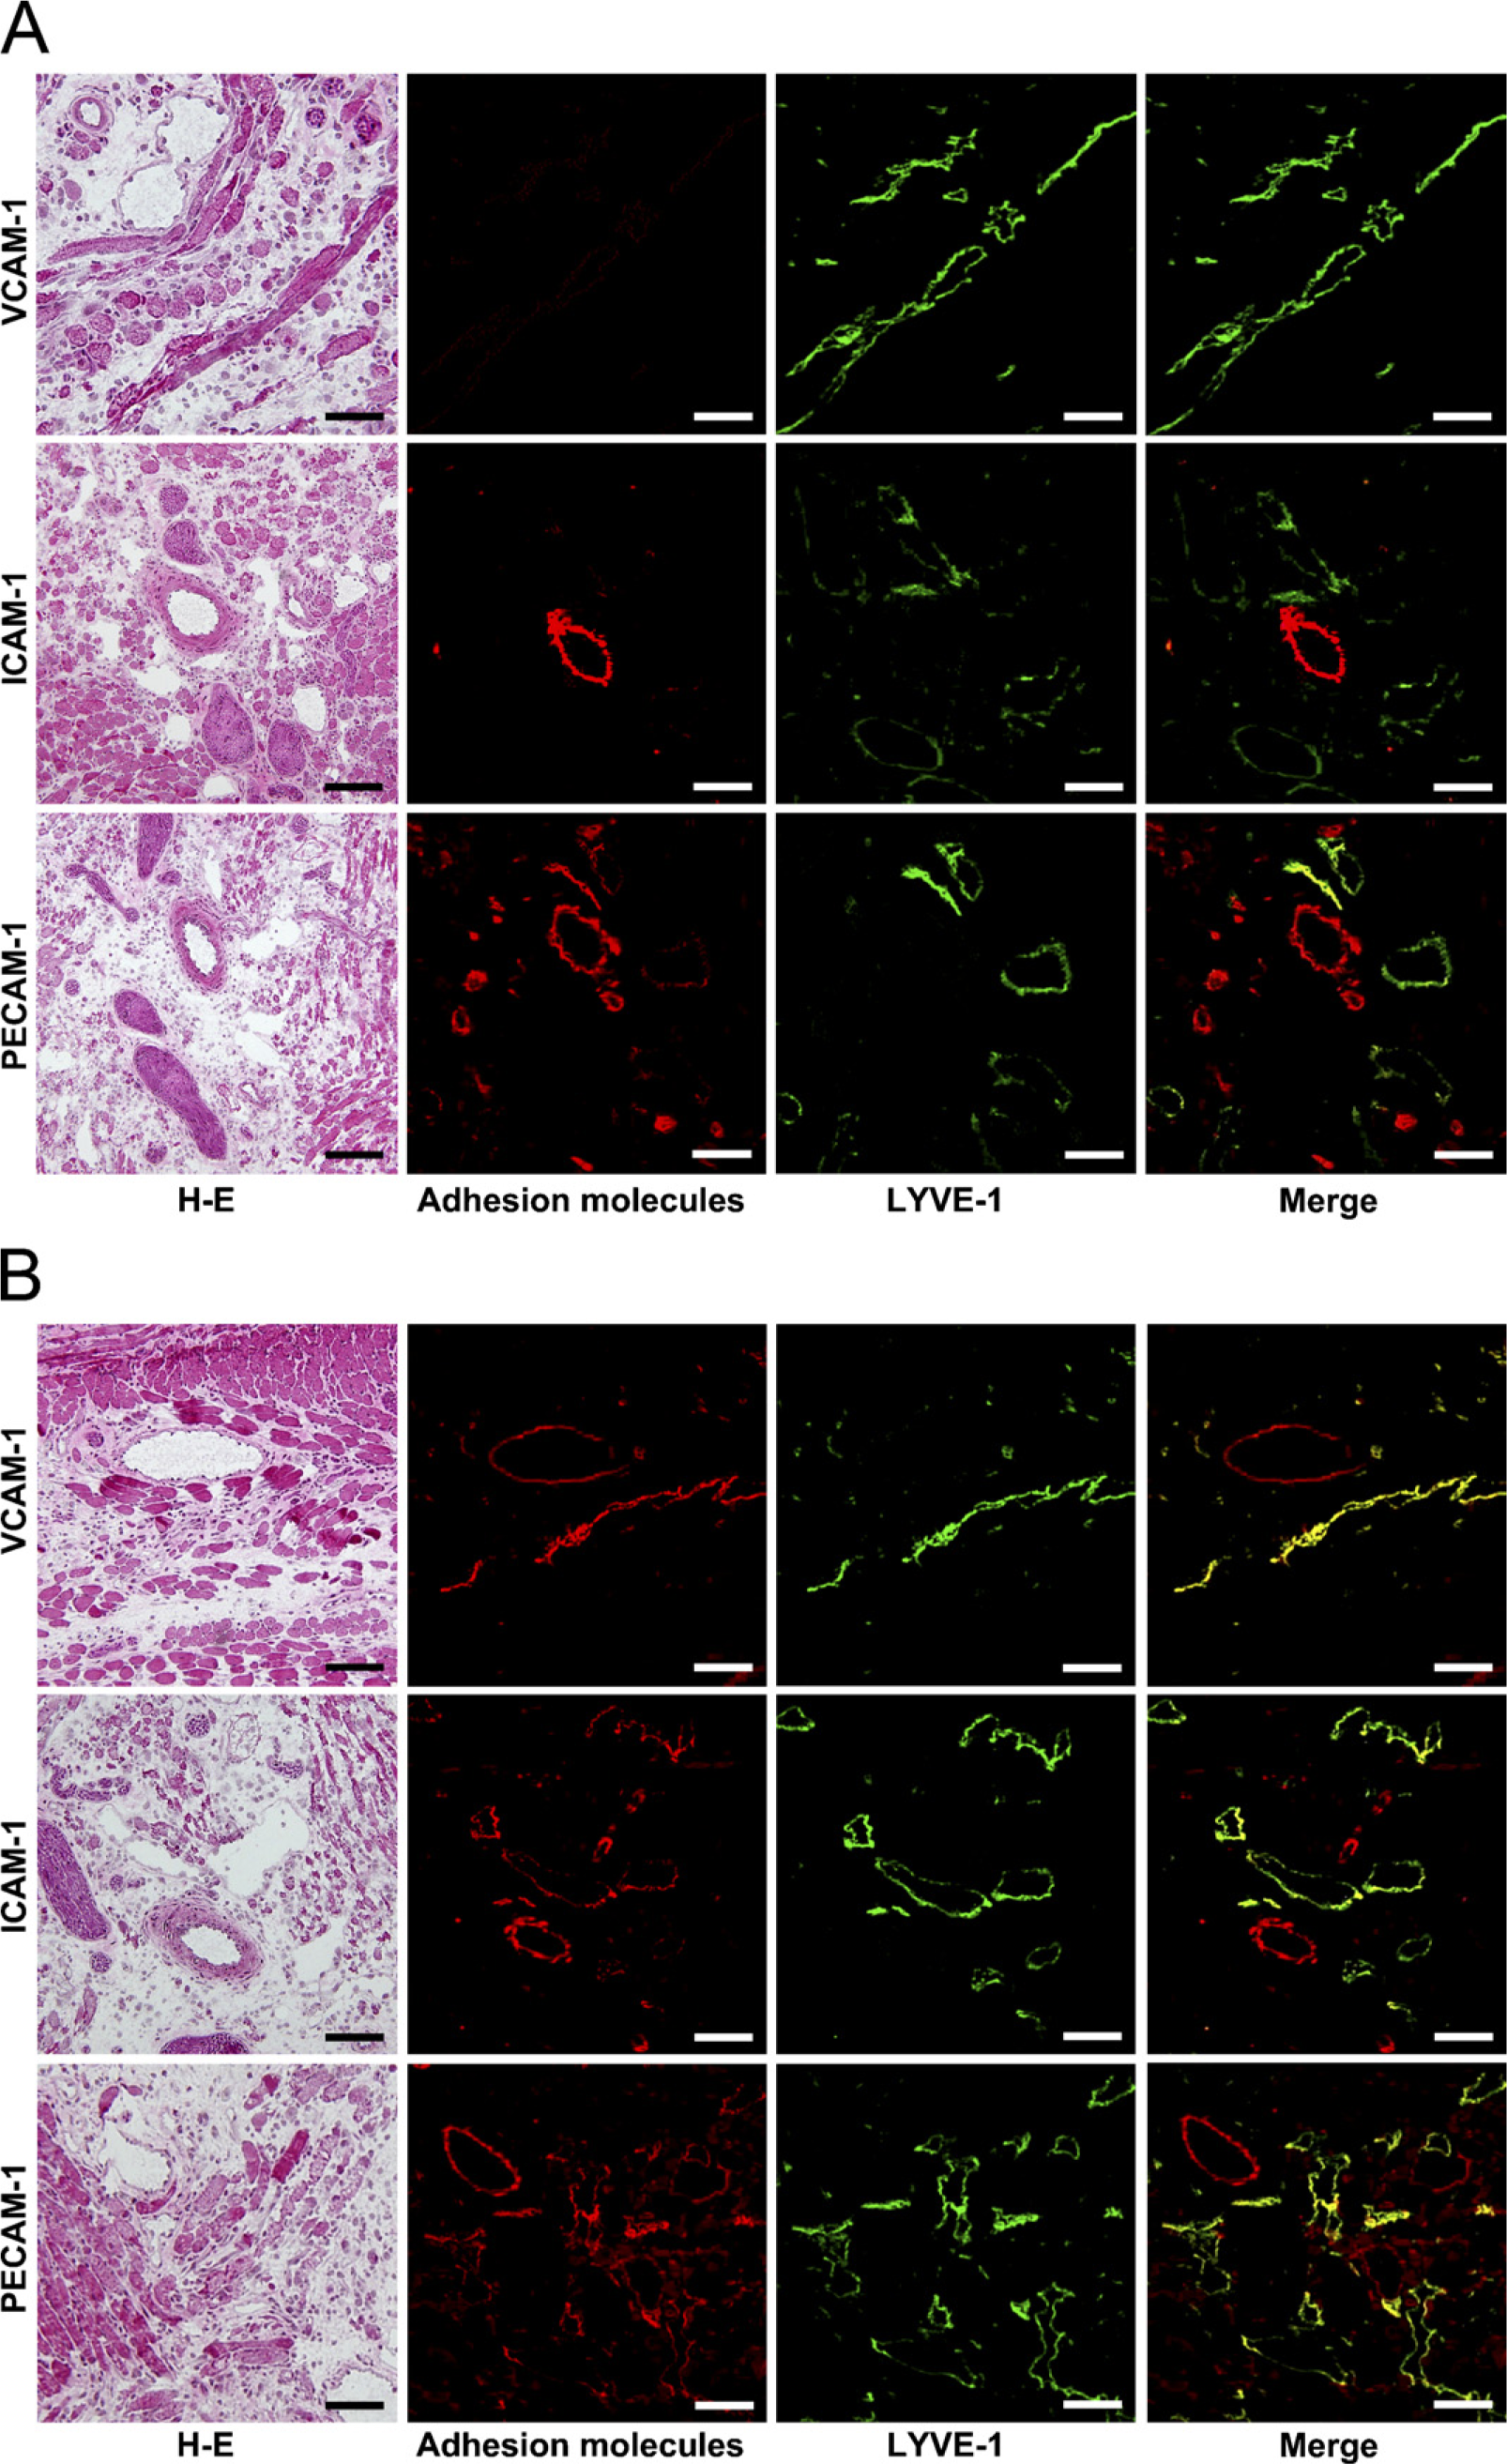
HNDLEC and HUVEC forming a 90% confluent mono-layer (5 × 10⁵ cells/well) in a six-well plate were treated with TNF-α (10 ng/ml; DakoCytomation) for 24 hr, and extraction of total RNA from a monolayer was achieved with a QIAshredder column and RNeasy kit (Qiagen; Tokyo, Japan). Contaminating genomic DNA was removed using DNAfree (Ambion; Huntingdon, UK), and reverse transcriptase was performed on 30 ng of total RNA followed by 25–30 cycles of PCR for amplification with 50 pM of primer sets using the Ex Taq hot start version (Takara Bio; Otsu, Japan). We used primer sets of β-actin, Prox-1, podoplanin, VCAM-1, ICAM-1, and PECAM-1, where the specificities had been confirmed by the manufacturer (Sigma-Genosys Ltd.; Cambridge, UK) (Table 1). PCR products were separated on 2% agarose gel (NuSieve; FMC, Rockland, ME) and visualized by Syber Green (Takara Bio). The correct size of the amplified PCR products was confirmed by gel electrophoresis, and amplification of accurate targets was confirmed by sequence analysis.
Sequence of primers
VCAM-1, vascular cell adhesion molecule-1; ICAM-1, intercellular adhesion molecule-1; PECAM-1, platelet endothelial cell adhesion molecule-1.
To quantify adhesion molecule mRNA generation, cDNA samples were analyzed by real-time quantitative PCR. A total of 1 μl of cDNA was amplified in 25 μl using PowerSYBR Green PCR Master Mix (Applied Biosystems; Foster City, CA) in a 7500 Real Time PCR System (Applied Biosystems) according to the manufacturer's instructions, and fluorescence was monitored at each cycle. Cycle parameters were 95C for 15 min to activate Taq followed by 40 cycles of 95C for 15 sec, 58C for 1 min, and 72C for 1 min. For real-time analysis, a standard curve was constructed from amplicons for β-actin in three serial 4-fold dilutions of cDNA stock from HNDLEC not treated with TNF-α. The β-actin cDNA levels in each sample were quantified against a standard curve by allowing the software to accurately determine the sample β-actin units. Adhesion molecule cDNA levels in each sample were quantified against a standard curve as the sample adhesion molecule units and were normalized to the sample β-actin units. Thus, relative adhesion molecule production units were expressed as arbitrary units, calculated according to the following formula: relative adhesion molecule production units = sample adhesion molecule units/sample β-actin units.
Immunoprecipitation and Western Blot
HNDLEC and HUVEC monolayers (106 cells) were treated by TNF-α (10 ng/ml) for 24 hr, pretreated by a cocktail of goat antiserum to human TNF receptor (TNFR) I and II (100 ng/ml) (R&D Systems) for 2 hr, and then treated by TNF-α (10 ng/ml) for 24 hr or pretreated by 64 μM nobiletin for 2 hr and then treated by TNF-α (10 ng/ml). Cells were solubilized in 1 ml of cell lysis buffer (50 mM HEPES, pH 7.3, 150 mM NaCl, 1.5 mM MgCl2, 1 mM EDTA, 100 mM NaF, 10 mM Na pyrophosphate, and 1% Triton X-100 and 5% glycerol). The lysate of whole cell protein (2 mg/ml) was centrifuged at 12,500 × g for 20 min at 4C, and 10 μl of 1 mg/ml mouse anti-human VCAM-1, anti-human ICAM-1, or antihuman PECAM-1 IgG1s (R&D Systems) and 30 μl of Protein G-agarose beads (Roche Diagnostics GmbH; Mannheim, Germany) were added to a 1-ml volume of a supernatant. After gently shaking the mixture at 4C for 12 hr, the beads were washed five times in the washing buffer (10 mM Tris-HCl containing 0.05% Tween 20, pH 7.4), mixed in 0.1 ml of sample buffer, and centrifuged at 500 × g for 5 min at 4C. The supernatant was loaded on 15% polyacrylamide gel by electrophoresis, and the separated proteins were transferred onto a PVDF membrane (Invitrogen Life Technologies; Carlsbad, CA). Immunoblots with 10 ng/ml of rabbit antiserum for human VCAM-1 (Santa Cruz Biotechnology; Santa Cruz, CA), goat antiserum for human ICAM-1 (R&D Systems), or rabbit antiserum for human PECAM-1 (Santa Cruz Biotechnology) were performed on the separated proteins immunoprecipitated with mouse IgG1s and visualized by 1 ng/ml of peroxidase-conjugated donkey anti-rabbit IgG (Amersham Biosciences; Buckinghamshire, UK) or rabbit anti-goat IgG (Santa Cruz Biotechnology) and chemiluminescence substrate (ECL plus Western Blotting Detection System; Amersham Biosciences) on X-ray film.
Flow Cytometry
HNDLEC forming a 90% confluent monolayer in a six-well plate (5 × 10⁵ cells/well) were cultured with TNF-α (10 ng/ml; DakoCytomation) for 24 hr at 37C, detached by cell dissociation buffer (Invitrogen Corporation; Grand Island, NY), fixed in 5% formalin-PBS for 5 min at 20C, washed in ice-cold PBS by centrifugation (200 × g for 8 min at 4C), and resuspended in 2 ml PBS containing mouse monoclonal antibodies for human VCAM-1, ICAM-1, or PECAM-1 (100 ng/ml; R&D Systems) in a six-well plate with gentle shaking. After reacting for 1 hr at 20C, cells were washed in PBS by centrifugation and exposed to AF488-conjugated goat anti-mouse IgG (0.1 μg/ml; Molecular Probes) in a six-well plate with gently shaking. To minimize nonspecific binding of antibodies, incubation was conducted in the presence of isotype-matched mouse IgG (50 μg/ml; Sigma). Cells treated with only a second antibody served as controls. The cell suspension was pelleted by centrifugation (200 × g for 8 min at 4C), resuspended in 1-ml sheath fluid (IsoFlow; Beckman Coulter, Fullerton, CA), and filtrated through nylon mesh. Flow cytometry was performed by a FACScan (BD Biosciences; Mountain View, CA) using CellQuest software (BD Biosciences) with appropriate single-stained samples for setting the compensation. The number of cells expressing adhesion molecules was determined according to a forward light scatter/side light scatter gating combined with an FL-1 channel for immunostaining.
ELISA
Cells forming a 90% confluent monolayer in a 100-mm dish (2 × 10⁶ cells/well) were cultured with 0, 1, 5, 10, and 20 ng/ml of TNF-α (DakoCytomation) for 24 hr at 37C and solubilized in 1 ml of cell lysis buffer (pH 7.3) (50 mM HEPES, 150 mM NaCl, 1.5 mM MgCl2, 1 mM EDTA, 100 mM NaF, 10 mM Na pyrophosphate, and 1% Triton X-100 and 5% glycerol). The lysate of whole cell protein (2 mg/ml) was centrifuged at 12,500 × g for 20 min at 4C, and the supernatant was diluted 1:5 in a 0.1 M carbonate-bicarbonate buffer (pH 9.6). A 0.2-ml volume of the 6-fold dilution was placed in a 96-well microtitration plate for 4 hr at 37C, incubated with 0.2 ml of 0.1% goat serum, and treated with 0.18 ml of 100 ng/ml mouse monoclonal antibodies for human VCAM-1, ICAM-1, and PECAM-1 (R&D Systems) diluted in a 10-mM Tris-HCl buffer containing 0.05% Tween 20 (TTBS) for 1 hr at 37C and with 0.18 ml of 10 ng/ml peroxidase-conjugated goat anti-mouse IgG (Amersham Biosciences) diluted in TTBS for 30 min at 37C. After washing with TTBS, a 0.18-ml volume of the substrate (ABTS microwell peroxidase substrate system; KPL, Gaithersburg, MD) was placed, and the absorbance change at 405 nm was measured by a microplate reader after incubation for 5 and 15 min at 37C. The wells only treated with a second antibody served as blanks. Amounts of VCAM-1, ICAM-1, and PECAM-1 produced in cells were estimated by the binding activity of antibodies for the three to wells, expressed as the mean ab-sorbance of peroxidase-metabolizing substrate of five wells.
Expression of lymphatic endothelial cell markers in human neonatal dermal lymphatic endothelial cells (HNDLEC). (
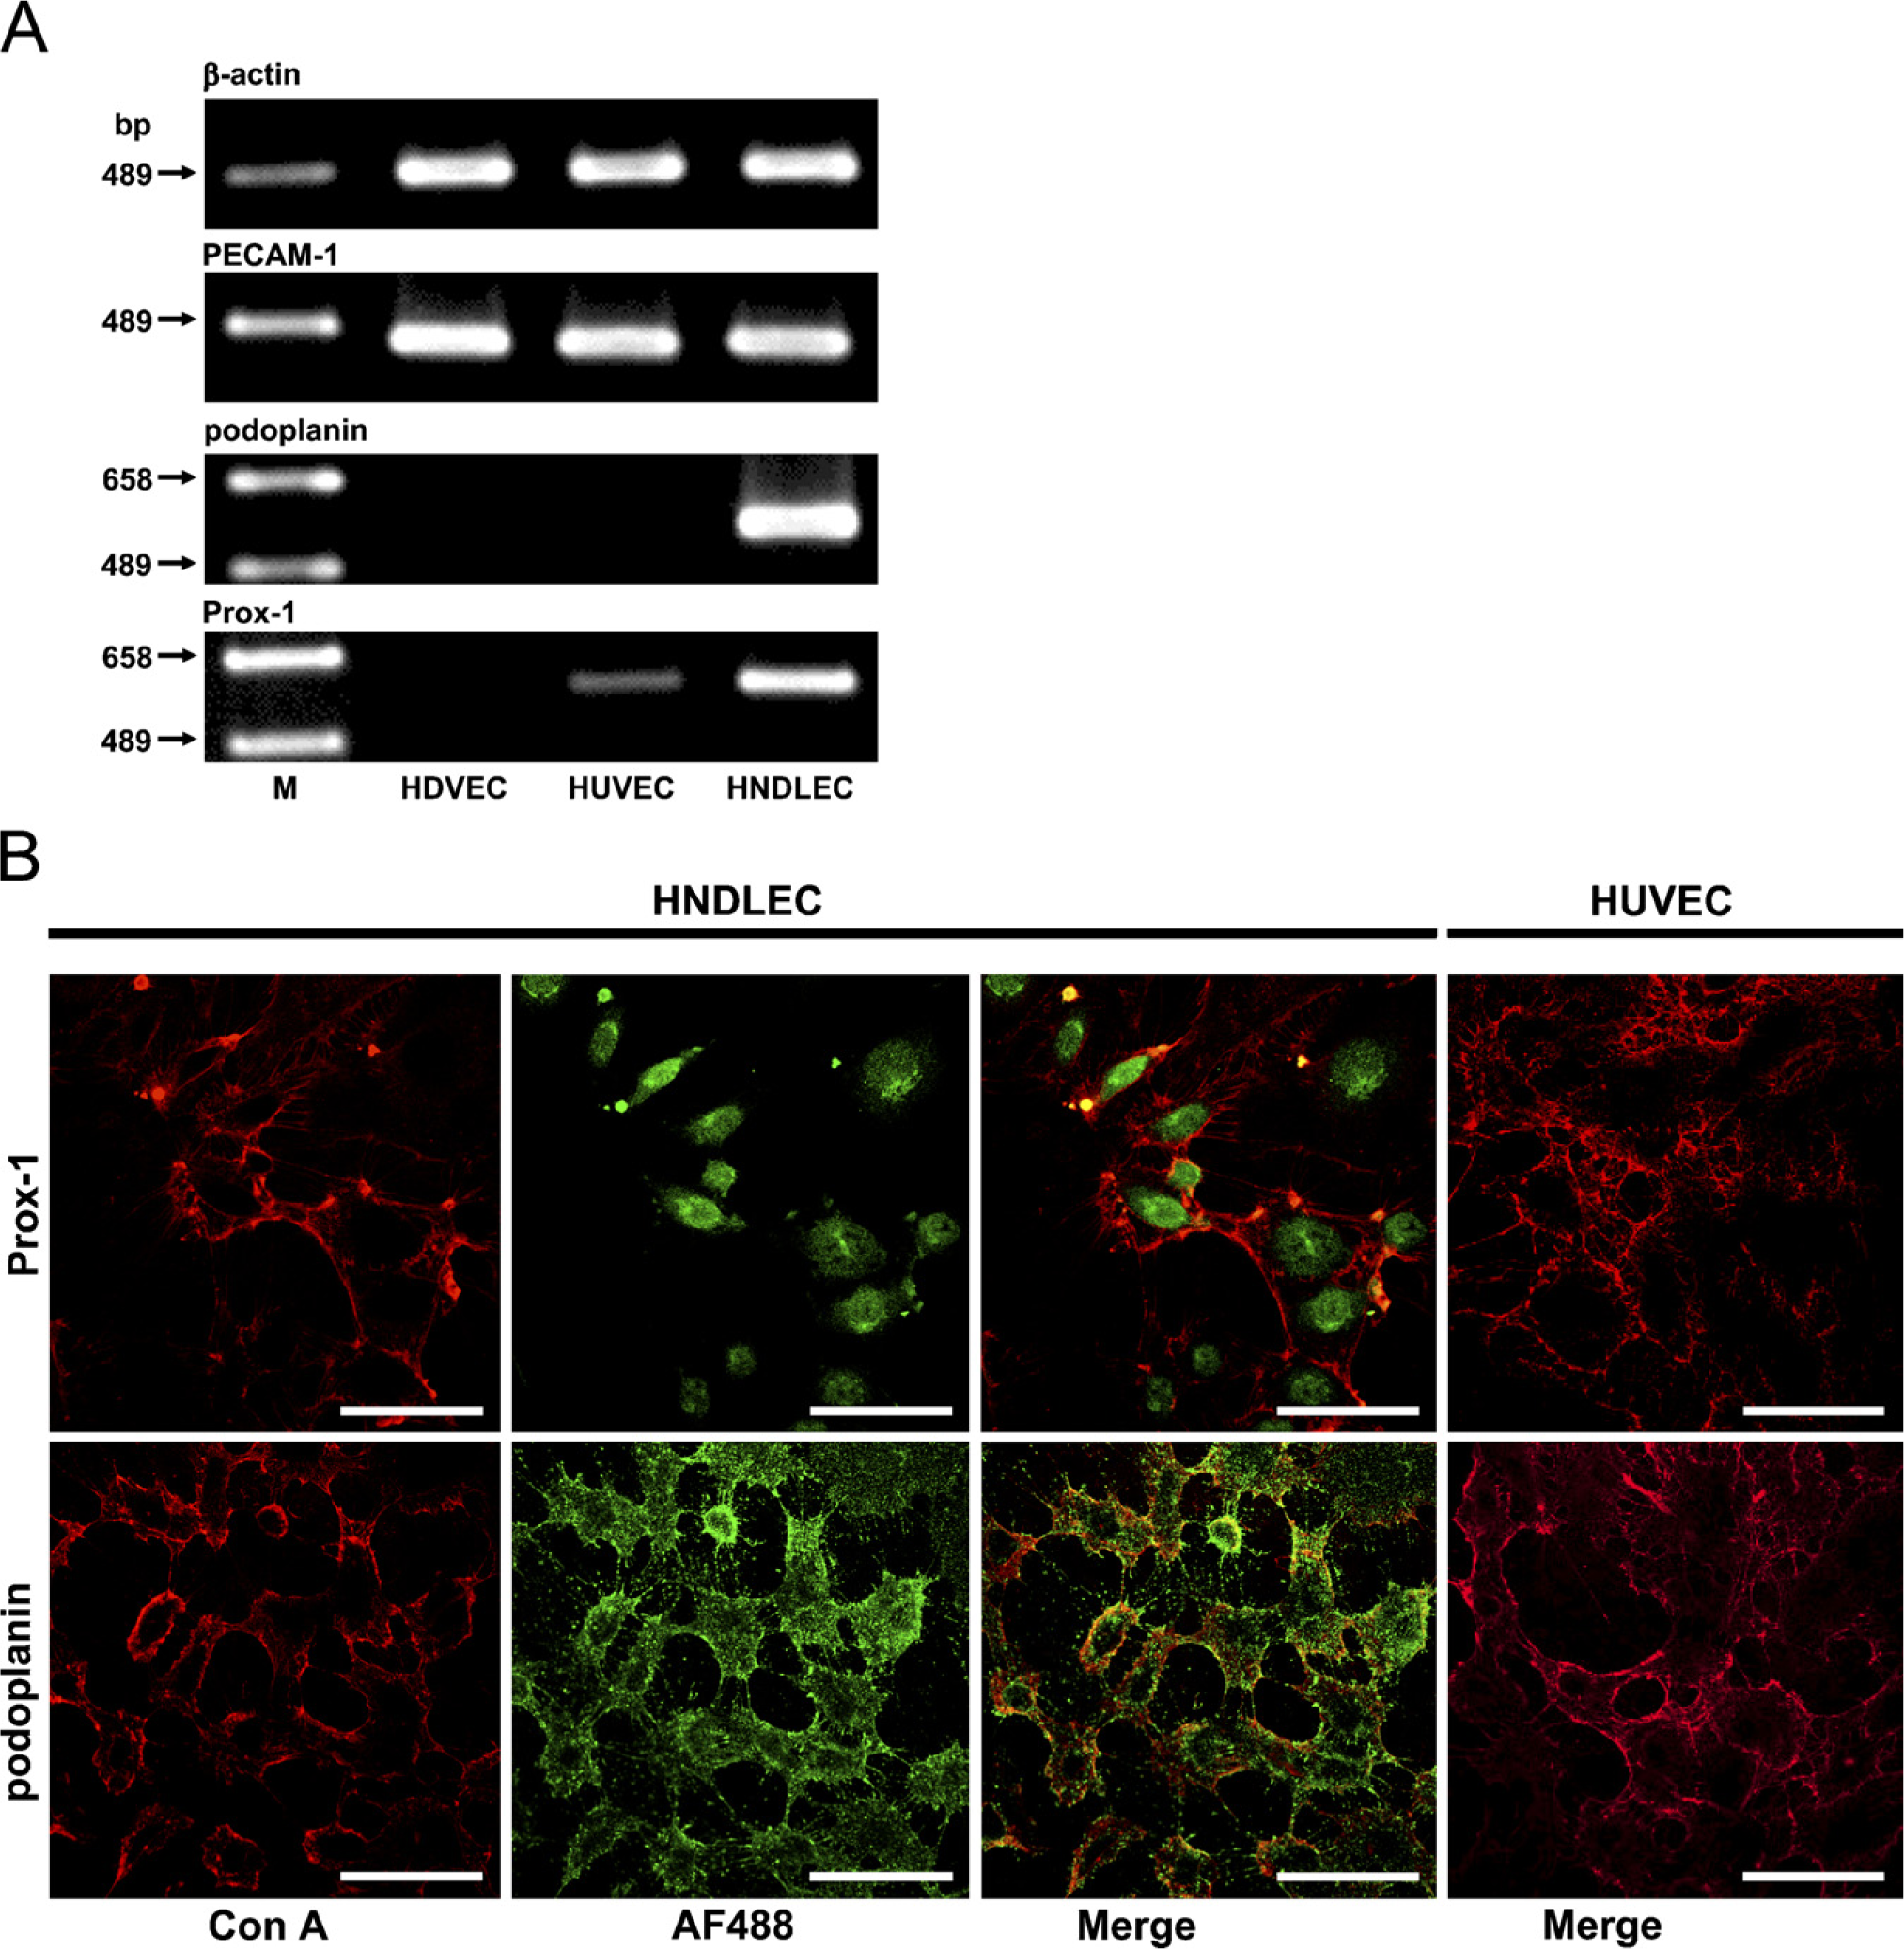
Effect of TNF-α on the production of leukocyte adhesion molecule mRNAs. (A) RT-PCR analysis. RT-PCR products for VCAM-1 and ICAM-1 mRNAs increased in a dose-dependent manner upon treatment with TNF-α in HNDLEC and HUVEC. Levels of RT-PCR products for VCAM-1 and ICAM-1 mRNAs were lower in HNDLEC than in HUVEC treated with TNF-α within the concentration of 0.01–1 ng/ml, and 0.01–0.1 ng/ml. RT-PCR products for PECAM-1 mRNA in HNDLEC and HUVEC treated with TNF-α were at the same levels as in untreated cells (
Cell ELISA
Cells forming a 90% confluent monolayer in a 24-well plate (105 cells/well) were cultured with 0, 1, 5, 10, and 20 ng/ml of TNF-α (DakoCytomation) for 24 hr or with 10 ng/ml of TNF-α for 0, 12, 24, and 36 hr at 37C. Cells were incubated with 100 ng/ml of mouse monoclonal antibodies for human VCAM-1, ICAM-1, and PECAM-1 (R&D Systems) for 1 hr and exposed to 10 ng/ml of peroxidase-conjugated goat anti-mouse IgG (Amersham Biosciences) for 30 min. All procedures were performed under the culture condition. After treatment with antibodies, cells were incubated with 1 ml peroxidase substrate (KPL) in a 24-well plate at 37C. The 0.1-ml aliquots from reaction products were transferred to a 96-well plate after 5 and 15 min, and absorbance changes at 405 nm were measured by a microplate reader. Wells treated with only a second antibody served as blanks. Amounts of VCAM-1, ICAM-1, and PECAM-1 expressed on the cell membrane were estimated by the binding activity of antibodies for the three to living cells in the wells under the culture condition, expressed as the mean absorbance of peroxidase-metabolizing substrate of five wells.
Statistics
All experiments were carried out five times repeatedly. Data are expressed as mean ± SEM. Statistical significance of differences was determined by the paired two-tailed Student's t-test with STATVIEW 4.51 software (Abacus Concepts; Calabasas, CA).
Results
Test for mRNA and Protein Production of Lymphatic Endothelial Cell Markers
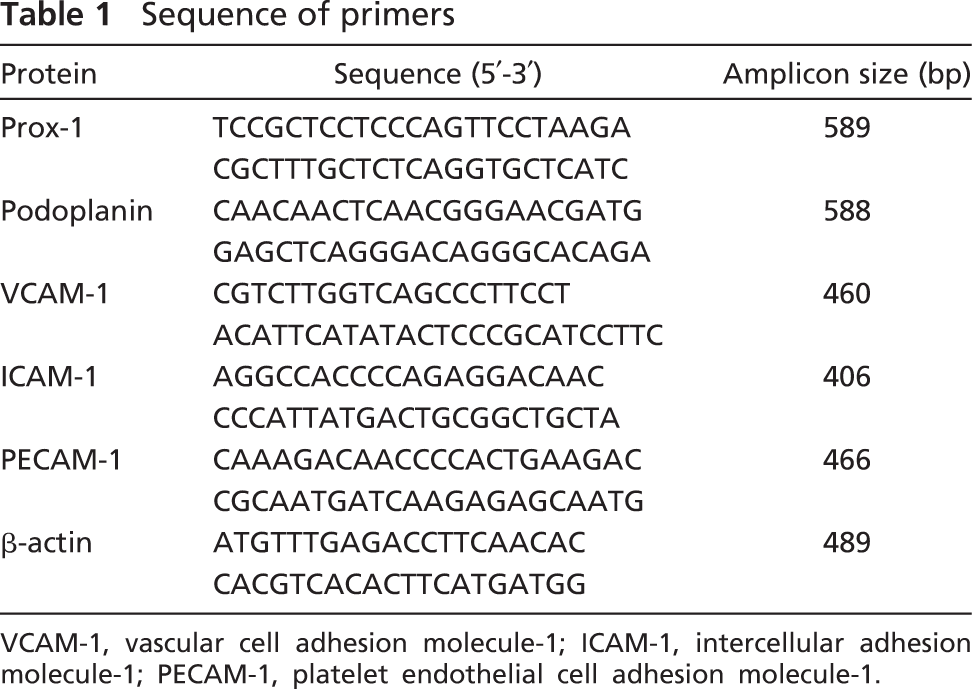
The endothelial cell marker PECAM-1 mRNA was expressed in HNDLEC as well as in HDVEC and HUVEC. RT-PCR products for podoplanin mRNA were detected in HNDLEC but not in HDVEC and HUVEC. RT-PCR products for Prox-1 mRNA were detected in HNDLEC but not in HDVEC and were detected weakly in HUVEC (Figure 1A). Expression of Prox-1 and podoplanin was immunohistochemically (IHC) observed in HNDLEC in the nuclei and in the cell membrane, respectively, whereas neither Prox-1 nor podoplanin was detected in HUVEC (Figure 1B).
Analysis for Production of Leukocyte Adhesion Molecule mRNAs
RT-PCR analysis showed the expression of VCAM-1 and ICAM-1 mRNAs increased in a dose-dependent manner upon treatment with TNF-α for 24 hr in both HNDLEC and HUVEC. Levels of VCAM-1 and ICAM-1 mRNA expressions were lower in HNDLEC than HUVEC treated with TNF-α within the concentration of 0.01–1 ng/ml and 0.01–0.1 ng/ml. Expression of PECAM-1 mRNA in both HNDLEC and HUVEC treated with TNF-α was at the same level as in untreated cells (Figure 2A). The real-time quantitative PCR analysis showed that TNF-α treatment leads to increases of VCAM-1 mRNA production in HNDLEC and in HUVEC to 10.8- and 13.9-fold levels of the mRNAs in untreated cells and leads to increases of ICAM-1 mRNA production in HNDLEC and in HUVEC to 48.2- and 8.6-fold levels of the mRNAs in untreated cells. HNDLEC produced VCAM-1 and ICAM-1 mRNA amounts that were statistically significantly lower than HUVEC in cells treated with TNF-α, as well as in untreated cells. PECAM-1 mRNA production amounts in HNDLEC and HUVEC with TNF-α treatment were at 0.42- and 0.44-fold levels of the mRNAs in untreated cells. HNDLEC produced PECAM-1 mRNA amounts that were significantly lower than HUVEC in cells treated with TNF-α, as well as in untreated cells (Figure 2B).
Analysis for Production of Leukocyte Adhesion Molecule Proteins
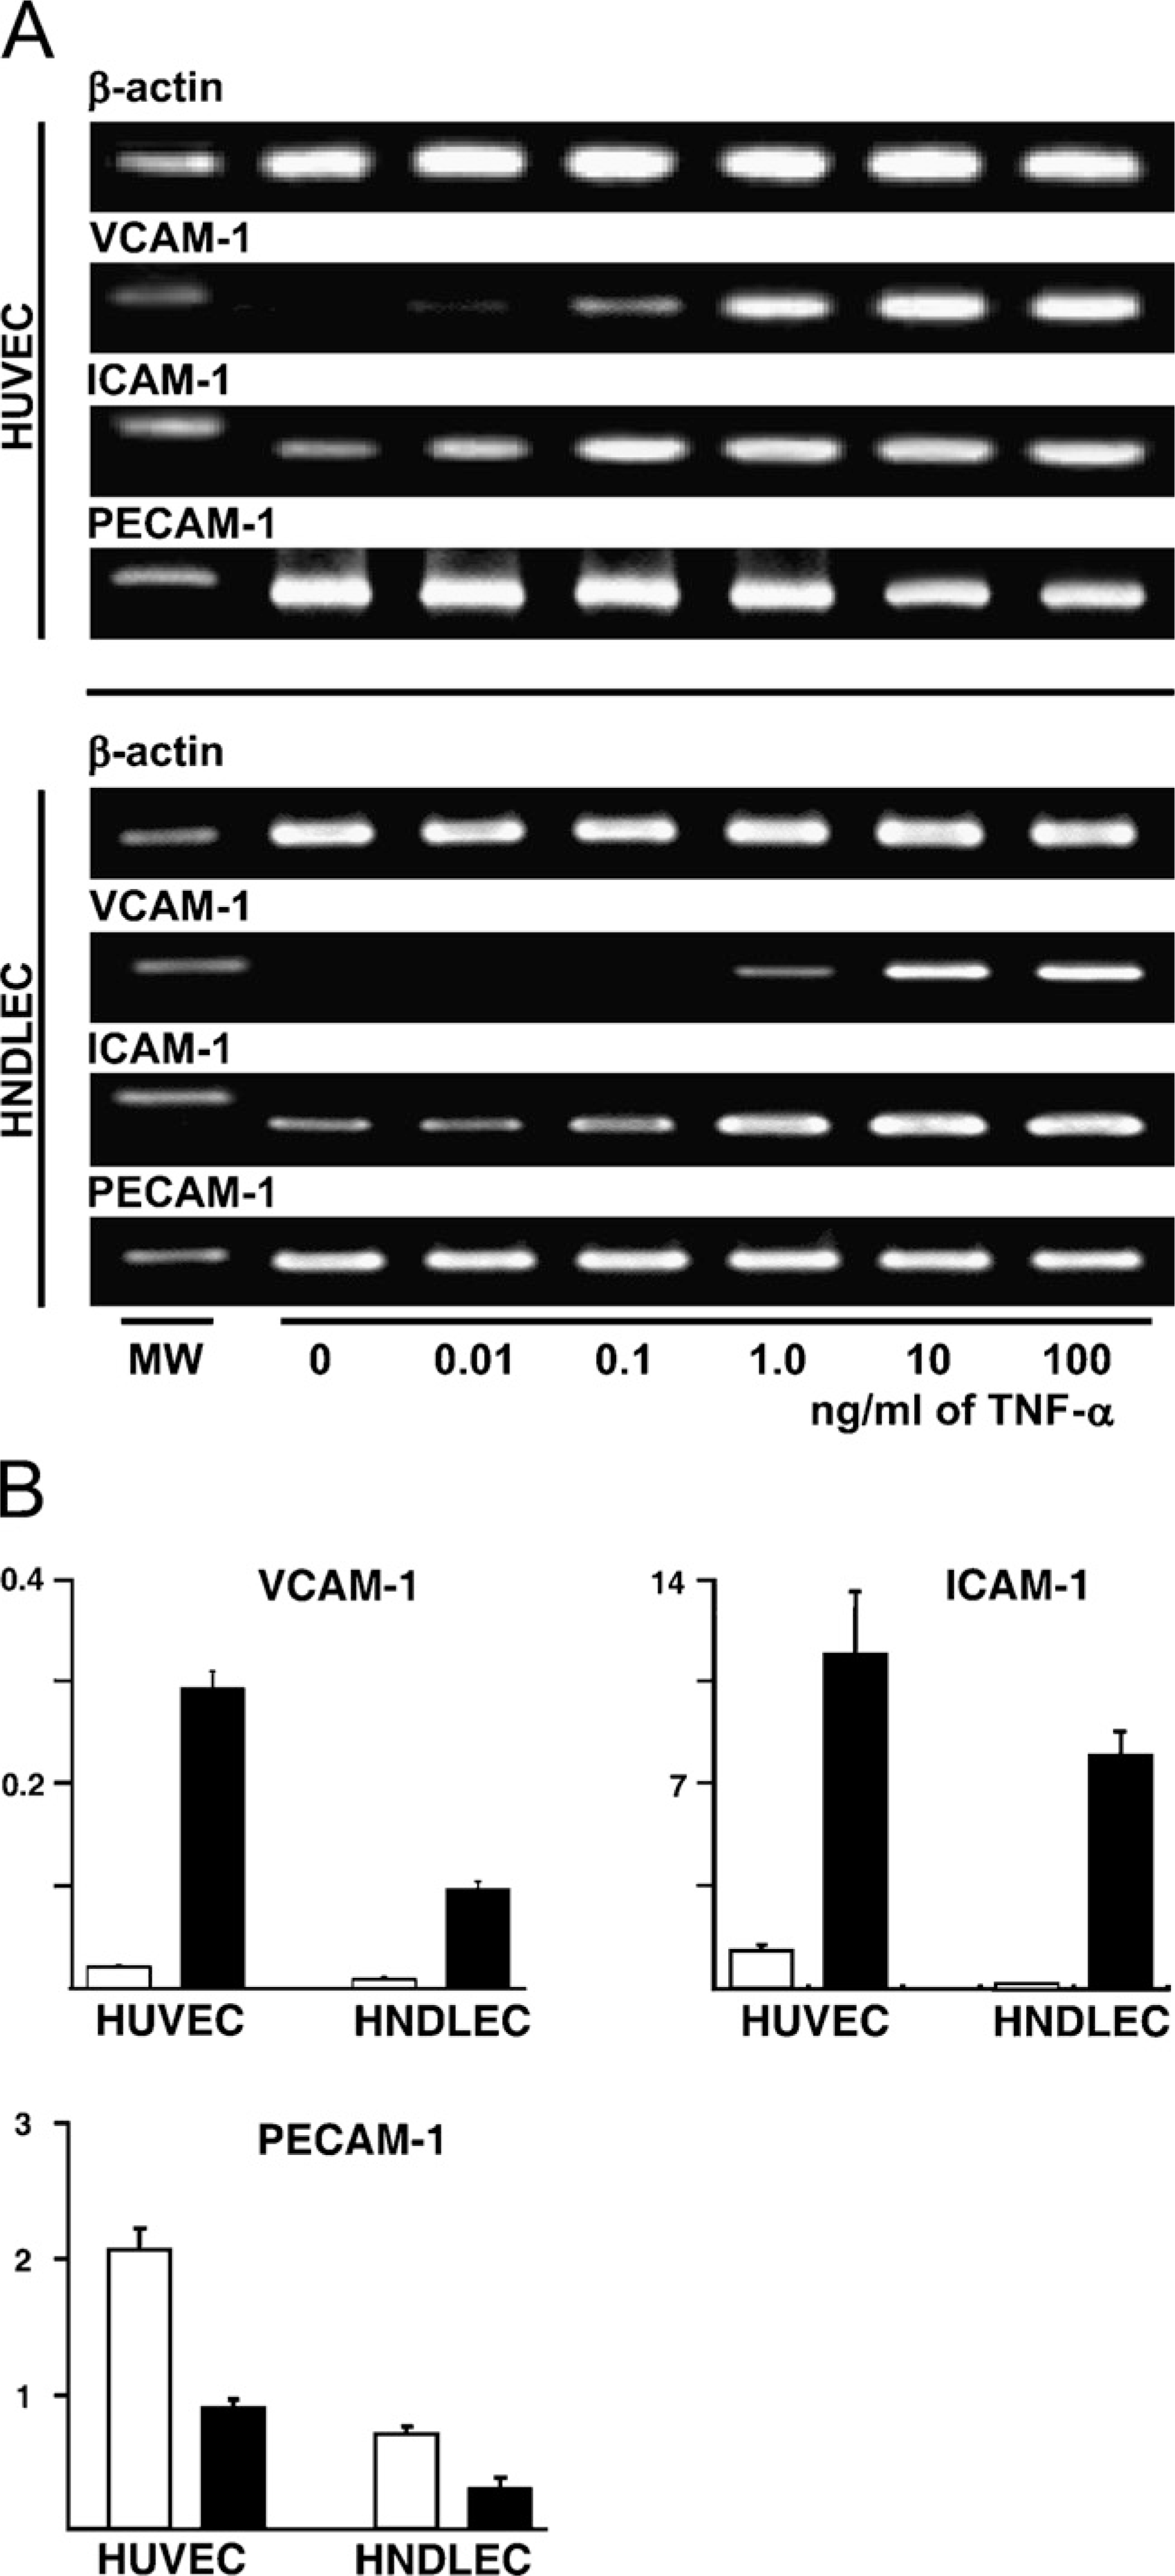
Effect of TNF-α on the expression of adhesion molecules was tested with an in vivo mouse model. In the tongue tissue injected with saline, VCAM-1 was not expressed at a detectable level in either lymphatic or blood vessels. ICAM-1 was not expressed at a detectable level in lymphatic vessels but there were blood vessels that expressed ICAM-1. PECAM-1 was expressed in lymphatic vessels at a lower level than in blood vessels (Figure 3A). In the tongue tissue injected with TNF-α, there were lymphatic and blood vessels expressing VCAM-1 and ICAM-1. No IHC significant differences of PECAM-1 expression were observed on the lymphatic and blood vessels between the tissue with or without TNF-α (Figure 3B).
In immunoprecipitated products in whole cell ly-sate, the increase of VCAM-1 and ICAM-1 was detected in both HNDLEC and HUVEC treated with TNF-α. Increase of VCAM-1 and ICAM-1 was inhibited by pretreatment with antiserum to human TNFR I and II or with nobiletin. PECAM-1 was detected to a similar extent in immunoprecipitated products in the lysate of untreated HNDLEC and HUVEC, in cells treated by TNF-α alone, in cells treated by antiserum to TNFR and TNF-α, and in cells treated by nobiletin and TNF-α. VCAM-1, ICAM-1, and PECAM-1 in immunoprecipitated products were detected to a lesser extent in HNDLEC than in HUVEC (Figure 4).
In the IHC analysis, VCAM-1 expression was not observed in HNDLEC, but there was a weak expression in cells treated with TNF-α. ICAM-1 expression was observed weakly in HNDLEC and strongly in cells treated with TNF-α. PECAM-1 expression was localized at cell-cell borders of HNDLEC confluent monolayers, and the expression decreased at cell-cell borders and increased in the cytoplasm by TNF-α treatment (Figure 5).
In the flow cytometry analysis, the number of HNDLEC expressing VCAM-1 and ICAM-1 on the cell surface increased with TNF-α treatment, and the ratio of increase was larger in ICAM-1 than in VCAM-1. The number of HNDLEC expressing PECAM-1 decreased with the TNF-α treatment (Figure 6).
In ELISA, it was shown that the production amounts of both VCAM-1 and ICAM-1 proteins were statistically significantly larger in HNDLEC treated with TNF-α in a range of 5–20 ng/ml than in untreated cells (Figure 7A). TNF-α-induced VCAM-1 and ICAM-1 production amounts increased in a concentration-dependent manner in a range of 5–20 ng/ml, and the increase rate slowed in ~10 ng/ml of TNF-α as a point of inflection as well as in HUVEC. The ratio of production amounts/total cell proteins was statistically significantly higher in ICAM-1 than in VCAM-1 in cells treated with each concentration of TNF-α (5, 10, and 20 ng/ml). The production amount of PECAM-1 was statistically significantly lower in HNDLEC treated with TNF-α in a range of 5–20 ng/ml than in untreated cells, as well as in HUVEC. The production amount of PECAM-1 in HNDLEC decreased in a TNF-α concentration-dependent manner in a range of 5–20 ng/ml, whereas PECAM-1 production was constant in a range of 5–20 ng/ml in HUVEC.
Leukocyte adhesion molecule expression in mouse tongue. Adhesion molecule expressions were visualized by an AF568-conjugated secondary antibody (in red), and lymphatic vessels were identified with LYVE-1 and visualized by an AF488-conjugated secondary antibody (in green). (
Induction of leukocyte adhesion molecules by TNF-α. In immunoprecipitated products in whole-cell lysate, VCAM-1 (110 kDa), ICAM-1 (90 kDa), and PECAM-1 (130 kDa) were detected in control cells (HUVEC). VCAM-1 and ICAM-1 were detected slightly, whereas PECAM-1 was detected strongly in untreated HNDLEC (LEC). Increase of VCAM-1 and ICAM-1 was detected in HNDLEC treated with TNF-α (LEC + TNF). Increase of VCAM-1 and ICAM-1 was inhibited by the pretreatment with a cocktail of goat antiserum to human TNFR I and II (LEC + TNF and anti-TNFR) or with nobiletin (LEC + TNF and Nob). PECAM-1 was also detected to a similar extent in immunoprecipitated products in the lysate of untreated HNDLEC, in cells treated by TNF-α only, in cells treated by antiserum to TNFR and TNF-α, and in cells treated by nobiletin and TNF-α. MW, molecular weight marker; Cont, controls.
In cell ELISA, it was shown that the membrane expression amounts of both VCAM-1 and ICAM-1 proteins were statistically significantly larger in HNDLEC treated with TNF-α in a range of 5–20 ng/ml than in untreated cells (Figure 7B). TNF-α-induced VCAM-1 and ICAM-1 membrane expression amounts increased in a concentration-dependent manner in a range of 5–20 ng/ml, and the increase rate slowed in ~10 ng/ml of TNF-α as a point of inflection, as well as the increase rate of the protein production in HNDLEC and HUVEC. The ratio of membrane expression amounts/cell numbers was higher in ICAM-1 than in VCAM-1 in cells treated with each concentration of TNF-α (5, 10, and 20 ng/ml). Membrane expression amounts were statistically significantly lower in HNDLEC treated with TNF-α in a range of 5–20 ng/ml than in the untreated cell, as well as in HUVEC. PECAM-1 membrane expression amount in HNDLEC decreased in a TNF-α concentration-dependent manner in a range of 5–20 ng/ml, and the decrease rate slowed in ~10 ng/ml of TNF-α as a point of inflection, whereas the PECAM-1 membrane expression amount in HUVEC was constant in a range of 5–20 ng/ml.
It was also shown that membrane expression amounts of VCAM-1 and ICAM-1 proteins were statistically significantly higher in HNDLEC treated with 10 ng/ml of TNF-α for 12, 24, and 36 hr than in the untreated cells in cell ELISA (Figure 7C). Membrane expression amount of PECAM-1 was statistically significantly lower in HNDLEC treated with 10 ng/ml TNF-α for 12, 24, and 36 hr than in the untreated cells. Increase of VCAM-1 and ICAM-1 and PECAM-1 decrease on the cell membrane by 10 ng/ml of TNF-α reached a plateau within 12–24 hr, as well as in HUVEC.
Production amounts and membrane expression amounts of VCAM-1, ICAM-1, and PECAM-1 in cells treated with TNF-α in a range of 5–20 ng/ml for 12–36 hr were statistically significantly less in HNDLEC than in HUVEC (Figure 7).
Discussion
Expression of Prox-1 and Podoplanin on HNDLEC
It has been established that Prox-1, a homeobox transcription factor, and podoplanin, a lung type I cell membrane-associated glycoprotein, are useful markers to identify lymphatic endothelium. Podoplanin−/- or Prox-1−/- mice have defects in lymphatic vessel but not in blood vessel or pattern formation (Wigle and Oliver 1999; Kriehuber et al. 2001; Schacht et al. 2003). In this study, expression of leukocyte adhesion molecules was investigated on HNDLEC expressing the endothelial cell marker PECAM-1 and also on cells expressing mRNAs and proteins of Prox-1 in the nuclei, which is a lymphatic endothelial cell proliferation inducer (Figure 1). RT-PCR products for Prox-1 were not observed in HDVEC but were detected weakly in HUVEC. HUVEC culture may contain cells having the ability to express the Prox-1 gene because Prox-1 acts as a master regulator for reprogramming of blood endothelial cells into the lymphatic endothelial phenotype (Hong et al. 2002; Petrova et al. 2002). HNDLEC expressed podoplanin, which was observed on the cell membrane and in the cytoplasm by IHC (Figure 1). mRNA and podoplanin protein were detected in HNDLEC but not in HDVEC or in HUVEC, suggesting that the HNDLEC culture is reliable as a lymphatic endothelial cell phenotype.
Effects of TNF-α on the Gene Expression of Leukocyte Adhesion Molecules
RT-PCR and real-time quantitative PCR analysis clearly showed that VCAM-1 and ICAM-1 mRNA production in HNDLEC significantly increased with TNF-α as well as in HUVEC (Figure 2). It has been established that VCAM-1 and ICAM-1 increase in the blood endothelium after TNF-α stimulation (Paleolog et al. 1994; Lawson et al. 1999; Nishibori et al. 2003). This suggests that the signal transduction through TNF-α receptors induces VCAM-1 and ICAM-1 gene expressions in lymphatic endothelium. On the other hand, the amounts of PECAM-1 mRNA decreased in HNDLEC as well as in HUVEC, although the decrease was not clearly detectable in the RT-PCR analysis (Figure 2). There are reports that treatment of endothelial cells with TNF-α leads to dramatic decreases in steady-state levels of PECAM-1 mRNA transcripts, and that both total cellular and cell-surface PECAM-1 protein decrease following cytokine treatment (Stewart et al. 1996; Murakami et al. 2000). There are also reports that cytokine stimulation does not alter PECAM-1 transcription or total surface PECAM-1 (Romer et al. 1995), and that the event needs both TNF-α and IFN-γ (Rival et al. 1996; Shaw et al. 2001). It is therefore thought that the modification of TNF-α-mediated PECAM-1 reduction may be different among endothelial cells in different tissue types, and that TNF-α may affect PECAM-1 gene expression in lymphatic endothelium. HNDLEC expressed VCAM-1, ICAM-1, and PECAM-1 mRNAs to a lesser extent than HUVEC in cells treated with TNF-α and in untreated cells (Figure 2). It is suggested that expression activities of these adhesion molecules are lower in lymphatic endothelium than in blood endothelium.
IHC analysis for the effect of TNF-α on the leukocyte adhesion molecule expression. HNDLEC was visualized by rhodamine-conjugated Con A (ConA, in red). Reaction products with antibodies to VCAM-1, ICAM-1, and PECAM-1 were visualized with an AF488-conjugated second antibody (AF488, in green). Reaction products with anti-VCAM-1 were not observed in HNDLEC but observed weakly in the cells treated with TNF-α. Reaction products with anti-ICAM-1 were observed weakly in HNDLEC and strongly in the cells treated with TNF-α. Reaction products with anti-PECAM-1 were localized at cell-cell borders of HNDLEC confluent monolayers, whereas they were decreased at cell-cell borders and increased in the cytoplasm with TNF-α. Bar = 100 μm.
Effects of TNF-α on the Production of Leukocyte Adhesion Molecules
Analysis of an in vivo model showed that there were no lymphatic vessels expressing VCAM-1 and ICAM-1 at the usual IHC detectable levels, and that VCAM-1 and ICAM-1 were expressed in lymphatic vessels with TNF-α, suggesting that TNF-α induces VCAM-1 and ICAM-1 expression in lymphatic vessels (Figure 3). TNF-α-induced VCAM-1 and ICAM-1 expression on the lymphatic endothelium may play a role in the collection of leukocytes into the lymphatic vessels in inflamed tissue. There were no significant differences of PECAM-1 expression between lymphatic vessels with and without TNF-α using IHC (Figure 3), suggesting that PECAM-1 production in lymphatic endothelium may not dramatically change in vivo.
Flow cytometry analysis for the effect of TNF-α on leukocyte adhesion molecule expression. Graphs show the number of HNDLEC treated with TNF-α of 10 ng/ml (red), untreated cells (green), and untreated cells reacting with only a second antibody as controls (black). Number of cells expressing VCAM-1 and ICAM-1 on the cell surface increased with TNF-α, and the ratio of increase was larger in ICAM-1 than in VCAM-1. The number of cells expressing PECAM-1 decreased with TNF-α.
Westernblot analysis showed the increase of VCAM-1 and ICAM-1 with TNF-α in HNDLEC to a lesser extent than in HUVEC, whereas the increase was inhibited by the anti-TNFRs or nobiletin (Figure 4). It was also shown that expression of VCAM-1 and ICAM-1 in HNDLEC increased with TNF-α in the IHC analysis (Figure 5). Flow cytometry analysis showed the number of HNDLEC expressing VCAM-1 and ICAM-1 on the cell surface increased with TNF-α (Figure 6). In the report for the efficacy of a polymethoxy flavonoid, nobiletin, from Citrus depressa on tumor invasion in vitro, it was demonstrated that nobiletin suppressed the 12-O-tetradecanoylphorbol13-acetate-induced binding activity of activator protein-1 (AP-1), as well as NF-κB activation (Sato et al. 2002; Murakami and Ohigashi 2006). It is thought that the lymphatic endothelium has the TNF-α-induced signaling pathway, which involves at least protein kinase C and p38 MAPK-mediated activation of NF-κB and AP-1, resulting in increased expression of VCAM-1 and ICAM-1 (Ahmad et al. 1998; Ishizuka et al. 1998; Lawson et al. 1999; Roebuck 1999).
On the other hand, PECAM-1 was detected in HNDLEC to a lesser extent than in HUVEC and was detected to a similar extent in HNDLEC not treated with TNF-α and in cells treated with TNF-α (Figure 4). TNF-α treatment leads to a reduction of PECAM-1 at HNDLEC cell-cell borders and to PECAM-1 increase in the cytoplasm (Figure 5). In the flow cytometry analysis, the number of cells expressing PECAM-1 decreased with TNF-α (Figure 6). There have been reports that the disappearance of PECAM-1 from cell-cell borders is accompanied by disruption of cytoskeleton connections in PECAM-1, and that it is implicated in the increase in intercellular permeability (Ferrero et al. 1996; Rival et al. 1996; Stewart et al. 1996). PECAM-1 disappearance from cell-cell borders may contribute to the larger increase in the intercellular permeability of the lymphatic vessels than the blood vessels, resulting in the efficient absorption of extracellular fluid. Increase of ICAM-1-positive cells was greater than that of VCAM-1-positive cells in the flow cytometry analysis on HNDLEC with TNF-α treatment (Figure 6). The lymphatic endothelium may have the ICAM-1 increase-mediated VCAM-1 upregulation system as well as in blood endothelium (Lawson et al. 1999).
Comparison of TNF-α Effects on Leukocyte Adhesion Molecule Expression in HNDLEC and HUVEC
In both HNDLEC and HUVEC, VCAM-1 and ICAM-1 production amounts and membrane expression amounts increased in a TNF-α concentration-dependent manner (Figures 7A and 7B). The increase rates slowed in ~10 ng/ml of a TNF-α dosage, which has been used in previous reports (Burke-Gaffney and Hellewell 1996; Zhou et al. 2006). This suggests that there is little difference in the TNF-α concentration most effective for inducing VCAM-1 and ICAM-1 production and membrane expression between lymphatic endothelium and blood endothelium.
Relationship of TNF-α concentration or reaction time for leukocyte adhesion molecule expression. (
On the other hand, the production amount and membrane expression amount of PECAM-1 in HNDLEC decreased in a TNF-α concentration-dependent manner, although PECAM-1 in HNDLEC with TNF-α was detected to a similar extent in cells without TNF-α in whole cell lysate (Figure 4 and Figures 7A and 7B). It is thought that the PECAM-1 reduction with TNF-α in HNDLEC was not significant, as reflected in the Western blot analysis. The production amount and membrane expression amount of PECAM-1 in HUVEC were constant in a TNF-α concentration-independent manner in comparison with HNDLEC. These may suggest that TNF-α is more effective in lymphatic endothelium than in blood endothelium for PECAM-1 reduction.
Increase of VCAM-1 and ICAM-1 and also the decrease of PECAM-1 on both HNDLEC and HUVEC cell membrane by TNF-α reached a plateau within 12–24 hr, suggesting that the events for induction or reduction of leukocyte adhesion molecule proteins would be completed within 24 hr in lymphatic endothelium, as well as in blood endothelium (Figure 7C). The production amount and membrane expression amount of VCAM-1, ICAM-1, and PECAM-1 in cells with TNF-α were statistically significantly less in HNDLEC than in HUVEC. In the lymphatic vessel, which has no flow such as the bloodstream, even low leukocyte adhesion molecule expression may contribute to the adhesion of lymphocytes to a luminal side, playing a role in host-defense systems.