
Abstract
Trefoil factors (TTFs) are small, compact proteins coexpressed with mucins in the gastrointestinal tract. Three trefoil factors are known in mammals: TFF1, TFF2, and TFF3. They are implicated to play diverse roles in maintenance and repair of the gastrointestinal channel. We compared the expression pattern of the three trefoil factors analyzing mRNA from a panel of 20 human tissues by conventional reverse transcriptase (RT) PCR and, in addition, by real-time PCR. These findings were supported by immunohistochemical analysis of paraffin-embedded human tissues using rabbit polyclonal antibodies raised against these factors. TFF1 showed highest expression in the stomach and colon, whereas TFF2 and TFF3 showed highest expression in stomach and colon, respectively. All three TFFs were found in the ducts of pancreas. Whereas TFF2 was found to be restricted to these two tissues, the structurally more closely related TFF1 and TFF3 showed a more general tissue distribution and were found to colocalize on an array of mucosal surfaces. This is the first thorough parallel description of the tissue distribution of TFFs in normal tissues, and it provides a baseline for similar analysis in diseased tissues.
T
TFFs are predominantly found as secreted molecules in the mucous covering normal epithelium. Mucin-producin cells, or goblet cells, dispersed in epithelia are the predominant site of TFF synthesis. The stomach is the only organ where all three TFFs are expressed, being localized to the superficial gastric mucosal cells. TFF2 is expressed in deeper glands as well (Hanby et al. 1993b; Kouznetsova et al. 2004). Although TFF2 is primarily restricted to the stomach and duodenum/Brunner’ gland (Hanby et al. 1993a), TFF1 and TFF3 are reported to be expressed in the gastrointestinal tract. Both proteins are expressed in human salivary glands, with TFF3 localized to serous cells of the sub-mandibular gland (Jagla et al. 1999) and to goblet cells of the small and large intestine (Wright et al. 1990; Podolsky et al. 1993; Lin et al. 2003; Paulsen et al. 2005). Scattered expression in the epithelial cells lining the pancreatic ducts have been reported, and a similar staining pattern was observed for TTF1 and TTF3 in large bile ducts (Ebert et al. 1999; Sasaki et al. 2003,2004a,b).
TFF1 and TFF3 are also expressed in the airways. In the upper respiratory tract, both proteins are expressed in epithelial cells and submucosal glandular epithelium of the human nasal mucosa glands (Lee et al. 2001). TFF1 is localized to goblet cells and sub-epithelial seromucous glands in the human false vocal folds, whereas TFF3 is found in columnar epithelial cells of the mucosa and in serous cells and excretory duct cells of seromucous glands (Kutta et al. 2004). TFF1 and TFF3 are localized to epithelial ciliated cells, goblet cells, and submucosal cells of bronchi and bronchioles in the lower respiratory airways (Wiede et al. 1999; dos Santos Silva et al. 2000). Both TFF1 and TFF3 colocalized to human conjunctival goblet cells, whereas no colocalization was observed in efferent tear ducts where TFF1 localized to goblet cells, and TFF3 was present in columnar epithelial cells and serous cells of serous glands (Langer et al. 1999; Paulsen et al. 2002). TFF3 is also localized in the surface epithelium of the endocervix and in gland-like structures of the cervical epithelium (Wiede et al. 2001). All three TFFs are also expressed in the brain, although in small amounts (Jagla et al. 2000; Hinz et al. 2004).
In vitro and in vivo data show that the functions of trefoil peptides are involvement in homeostasis and repair of mucosal surfaces, processes called restitution and regeneration (reviewed in Taupin and Podolsky 2003; Hoffmann 2005). Mice deficient for each of the TFFs have been made by gene-targeting disruption. All mice showed a phenotype of decreased ability to regenerate mucosal healing after injury by various noxious agents (Lefebvre et al. 1996; Mashimo et al. 1996; Playford et al. 1996; Farrell et al. 2002; Beck et al. 2004). The decreased ability to regenerate mucosal healing after injury might be due to the anti-apoptotic function of the TFFs (Taupin et al. 2000; Bossenmeyer-Pourie et al. 2002).
To date, localization studies of trefoil peptides have been performed on scattered tissue samples using various antibodies. In the present study we screened 20 human tissues for expression of all three trefoil peptides, using both conventional PCR and quantitative real-time PCR. These results were supported by immunhistochemistry (IHC) of paraffin-embedded normal human tissues using three polyclonal antibodies raised against each of the peptides, respectively.
Materials and Methods
The local ethical committee in Odense approved the use of the tissue section samples (ref. no: VF20050070).
Reverse Transcriptase PCR
Human total RNA from various tissues was purchased from Clontech (Palo Alto, CA). Total RNA from each tissue was in general a pool from different specimens ranging from 1 to 84 specimens/tissue. RNA from human colon was prepared from five specimens frozen in liquid nitrogen by means of Tri Reagent (Sigma-Aldrich; St Louis, MO), according to the manufacturer's instructions. First-strand synthesis was performed with the Thermoscript kit (Invitrogen; Carlsbad, CA) from 1 μg of total RNA from each tissue using oligo-dT priming in a volume of 20 μl at 50C for 50 min. The reaction mixture was then diluted to 100 μl with water and 5 μl used as a template for PCR, as described previously in Madsen et al. (2003). Primer pairs for TFF1, TFF2, and TFF3, respectively, were as described by Wiede et al. (1999). For TFF1 the forward primer TFF1 f1 (5î-TTT GGA GCA GAG AGG AGG-3î) and the reverse primer TFF1 r1 (5î-TTG AGT AGT CAA AGT CAG AGC AG-3î) were used. For TFF2 the forward primer TFF2 f1 (5î-AGT GAG AAA CCC TCC CCC-3î) and the reverse primer TFF2 r1 (5î-AAC ACC CGG TGA GCC AG-3î) and for TFF3 the forward primer TFF3 f1 (5î-GTG CCA GCC AAG GAC AG-3î) and the reverse primer TFF3 r1 (5î-CGT TAA GAC ATC AGG CTC CAG-3î) were used. PCR was performed as follows: 1 min at 94C, 30 or 40 cycles of 94C for 30 sec, 57C for 30 sec, and 72C for 30 sec, followed by 72C for 7 min. PCR products were separated by agarose gel electrophoresis, stained with ethidium bromide, and visualized under ultraviolet light.
The amount of RNA used in the reverse transcriptase (RT)-PCR was visualized using a primer pair for human β-actin as described in Gronlund et al. (2000), except that first-strand synthesis was performed with oligo-dT priming.
Real-time PCR
All reagents used for real-time PCR and analysis were from Applied Biosystems (Foster City, CA). First-strand synthesis was performed as described above except that cDNA samples were diluted 10 times with water before real-time PCR analysis. Transcription of each TFF was detected using TaqMan Gene Expression Assays: TFF1 (Hs00170216_m1), TFF2 (Hs00193719_m1), and TFF3 (Hs00173625_m1) according to manufacturer's instructions. Relative gene expression levels were determined by using the relative standard curve method as outlined in User Bulletin #2 (ABI Prism 7700 sequencing detection system; Applied Biosystems). Briefly, a standard curve for each gene was made of serial dilutions of total RNA from a tissue with high expression of the gene of interest. The curve was then used to calculate relative amounts of target mRNA in the samples. Samples were normalized against the human transferrin receptor (Hs00174609_m1) and human actin (4326315E), respectively, and standardized to the expression level found in the thymus. All R2 values were found to be 0.99 or above. Each sample was run as singleplex in triplicates and performed in at least two independent experiments. Samples were analyzed on an ABI Prism 7000 HT Sequence Detection System (Applied Biosystems).
Production of Rabbit Polyclonal Antibodies Against TFFs
Polyclonal rabbit antisera against TFF1 (2239A), TFF2 (2240A), and TFF3 (2241A), respectively, were produced by immunization of rabbits with recombinant TFFs as described previously (Vestergaard et al. 2002,2004). Antibodies were monospecific and did not cross-react with each other (Vestergaard et al. 2002,2004).
IHC
For the IHC analysis to detect the localization of the three trefoil peptides, antigen retrieval was optimized with either no retrieval, 0.05% protease type XIV (pronase E, cat. #P5147; Sigma-Aldrich) in TBS, pH 7.0, for 15 min at 37C or heat-induced epitope retrieval using three different buffers: 10 mM sodium citrate, pH 6; 10 mM Tris containing 0.5 mM EGTA (ethylene glycol-bis(2-aminoethylether)-N,N,N',Nî-tetraacetic acid), pH 9 (TEG); and Target Retrieval Solution (TRS; Dako, Copenhagen, Denmark) (data not shown). Heat-induced epitope retrieval was performed as follows: three Tissue-Tek containers (Miles Inc.; Elkhart, IN), each with 24 slides in 250 ml buffer, were placed on the edge of a turntable inside a microwave oven. Slides were heated for 11 min at full power (900 W), then for an additional 15 min at 400 W. After heating, slides remained in buffer for 15 min. These pilot experiments revealed that the optimal antigen retrieval for TFF1 and TFF3 was microwave heating in TRS buffer and for TFF2 protease treatment, respectively.
Four-μm-thick sections were cut from non-commercial paraffin-embedded blocks of normal human tissue fixed in neutral-buffered 4% (w/v) formaldehyde. Sections were mounted on ChemMate Capillary Gap Slides (Dako), dried at 60C, deparaffinized, and rehydrated. Antigen retrieval was performed by microwave heating in TRS (Dako) for TFF1 and TFF3 and pronase E treatment for TFF2, respectively, and endogenous biotin blocking was performed as previously described (Madsen et al. 2003). Slides were incubated with the rabbit anti-human TFF antibodies in a dilution of TFF1 (1:2000), TFF2 (1:1000), and TFF3 (1:8000) (stock concentration 1 mg/ml). Immunostaining was performed with the ChemMate horseradish peroxidase/3,3î-diaminobenzidine tetrahydrochloride detection kit (HRP/DAB, K5001; Dako) using automated equipment (TechMate 1000; Dako), followed by brief nuclear counterstaining in Mayer's hematoxylin. Coverslips were mounted with AquaTex (Merck; Darmstadt, Germany).
Results
PCR
Expression of trefoil mRNA was performed by screening 20 human tissues using specific primer pairs for each gene, respectively. For TFF1, a high signal was found in the colon, prostate, and trachea (Figure 1). Intermediate to low levels were observed in the mammary gland, stomach, pancreas, salivary gland, small intestine, and skeletal muscle. For TFF2, a clear signal was found in the stomach and pancreas (Figure 1). The major site of TFF3 mRNA synthesis was the colon, pancreas, and trachea, but expression was also found in the small intestine, salivary gland, mammary gland, and prostate (Figure 1). Low levels were observed in the spleen, liver, uterus, lung, and stomach.
Quantitative Real-time PCR (qRt-PCR)
Two different housekeeping genes, β-actin and the transferrin receptor, respectively, were initially examined to identify the most optimal normalization gene. Comparison of the two genes showed that β-actin was the more consistent and least variable of the two genes and was therefore chosen as the housekeeping gene (results not shown). All 20 tissue samples were normalized to actin and furthermore standardized to thymus, which showed low expression of all three peptides. Expression levels were calculated as arbitrary units.
The colon and the stomach showed the highest levels of TFF1 mRNA expression (Figures 1B and 1C). An expression level more than one order of magnitude lower was observed in the trachea, prostate, thymus, salivary gland, pancreas, and mammary gland. Several other tissues including the small intestine showed low to very low levels of TFF1 mRNA. The stomach was the major site of TFF2 mRNA synthesis with a signal intensity 10 times stronger than other tissues such as the pancreas, colon, and skeletal muscle. Low expression was found in the liver, heart, kidney, lung, trachea, salivary gland, small intestine, mammary gland, and prostate. The colon was identified as the major site of TFF3 mRNA synthesis, whereas several tissues such as the trachea, lung, salivary gland, and small intestine showed intermediate expression (Figures 1B and 1C). Low levels were found in the pancreas, prostate, mammary gland, and almost non-detectable levels in the stomach, adrenal gland, spleen, liver, kidney, and uterus (Figure 1).
IHC
TFF1 and TFF2 showed very strong immunostaining in the gastric mucosa cells of the pyloric part of the stomach. TFF1 staining was most pronounced in the upper gastric mucosal cells, whereas TFF2 staining was observed in all layers of the stomach. Only very faint TFF3 staining was seen in the upper part of the gastric mucosa (Figure 2). TFF1 and TFF3 immunostaining was found in goblet cells for the small and large intestine and rectum, and at these locations TFF2 staining was either very weak or absent (Figure 2). The small submucosal glands in the esophagus showed immunoreactivity for all three TFFs, strongest for TFF1 and TFF3, and weakest for TFF2 (Figure 2). No staining was seen in the stratified squamous epithelium of the esophagus. Several organs associated with the alimentary tract were also examined for localization of the three TFFs. Mucous acini of the sublingual gland showed distinct staining for TFF3 and TFF1 and weak staining for TFF2 (Figure 2), whereas no staining was found in the serous secretory acini of the parotid gland (not shown). Scattered expression of TFF1 and a more general staining for TFF3 was found in epithelial cells of the gallbladder, whereas no staining was observed for TFF2 (Figure 2). Staining for all three trefoil factors was found in the epithelial cells lining the exocrine pancreatic ducts, whereas no staining was observed in the remainder of the pancreas (Figure 2). Faintly scattered staining of TFF3 was found and no staining for TFF1 or TFF2 was found in epithelial cells of the small bile ducts (not shown). Bronchial goblet cells of the pseudostratified epithelia in the respiratory system stained positive for TFF3, weakly for TFF1, and no staining was found for TFF2 (Figure 3). The majority of the submucosal (seromucous) glands of the trachea stained positive for TFF1 and TFF3, but not for TFF2 (Figure 3). No staining of any of the three TFFs was found in the lower airways (not shown). Staining of submucosal glands was also seen in the vagina, which showed strong staining for TFF3, scattered staining for TFF1, and weak or no staining for TFF2 (Figure 3). We also examined several tissue sections of the endometrium in the menstrual phase, the proliferative phase, and in the secretory phase. A few epithelial cells in the endometrial glands stained positive for TFF3, but no staining was seen for either TFF1 or TFF2 (Figure 3). TFF3 was found in the cuboidal epithelial cells surrounding the thyroid follicles in the thyroid gland, whereas no staining was seen for TFF1 or TFF2, respectively (Figure 3). No staining of any of the three trefoil peptides was found in the spleen, tonsils, skin, thymus, parathyroid gland, kidney, bladder, prostate, testis, placenta, or skeletal muscle. No staining was observed either when the antibodies were replaced with an antibody raised against ovalbumin or when no primary antibody was used (data not shown).
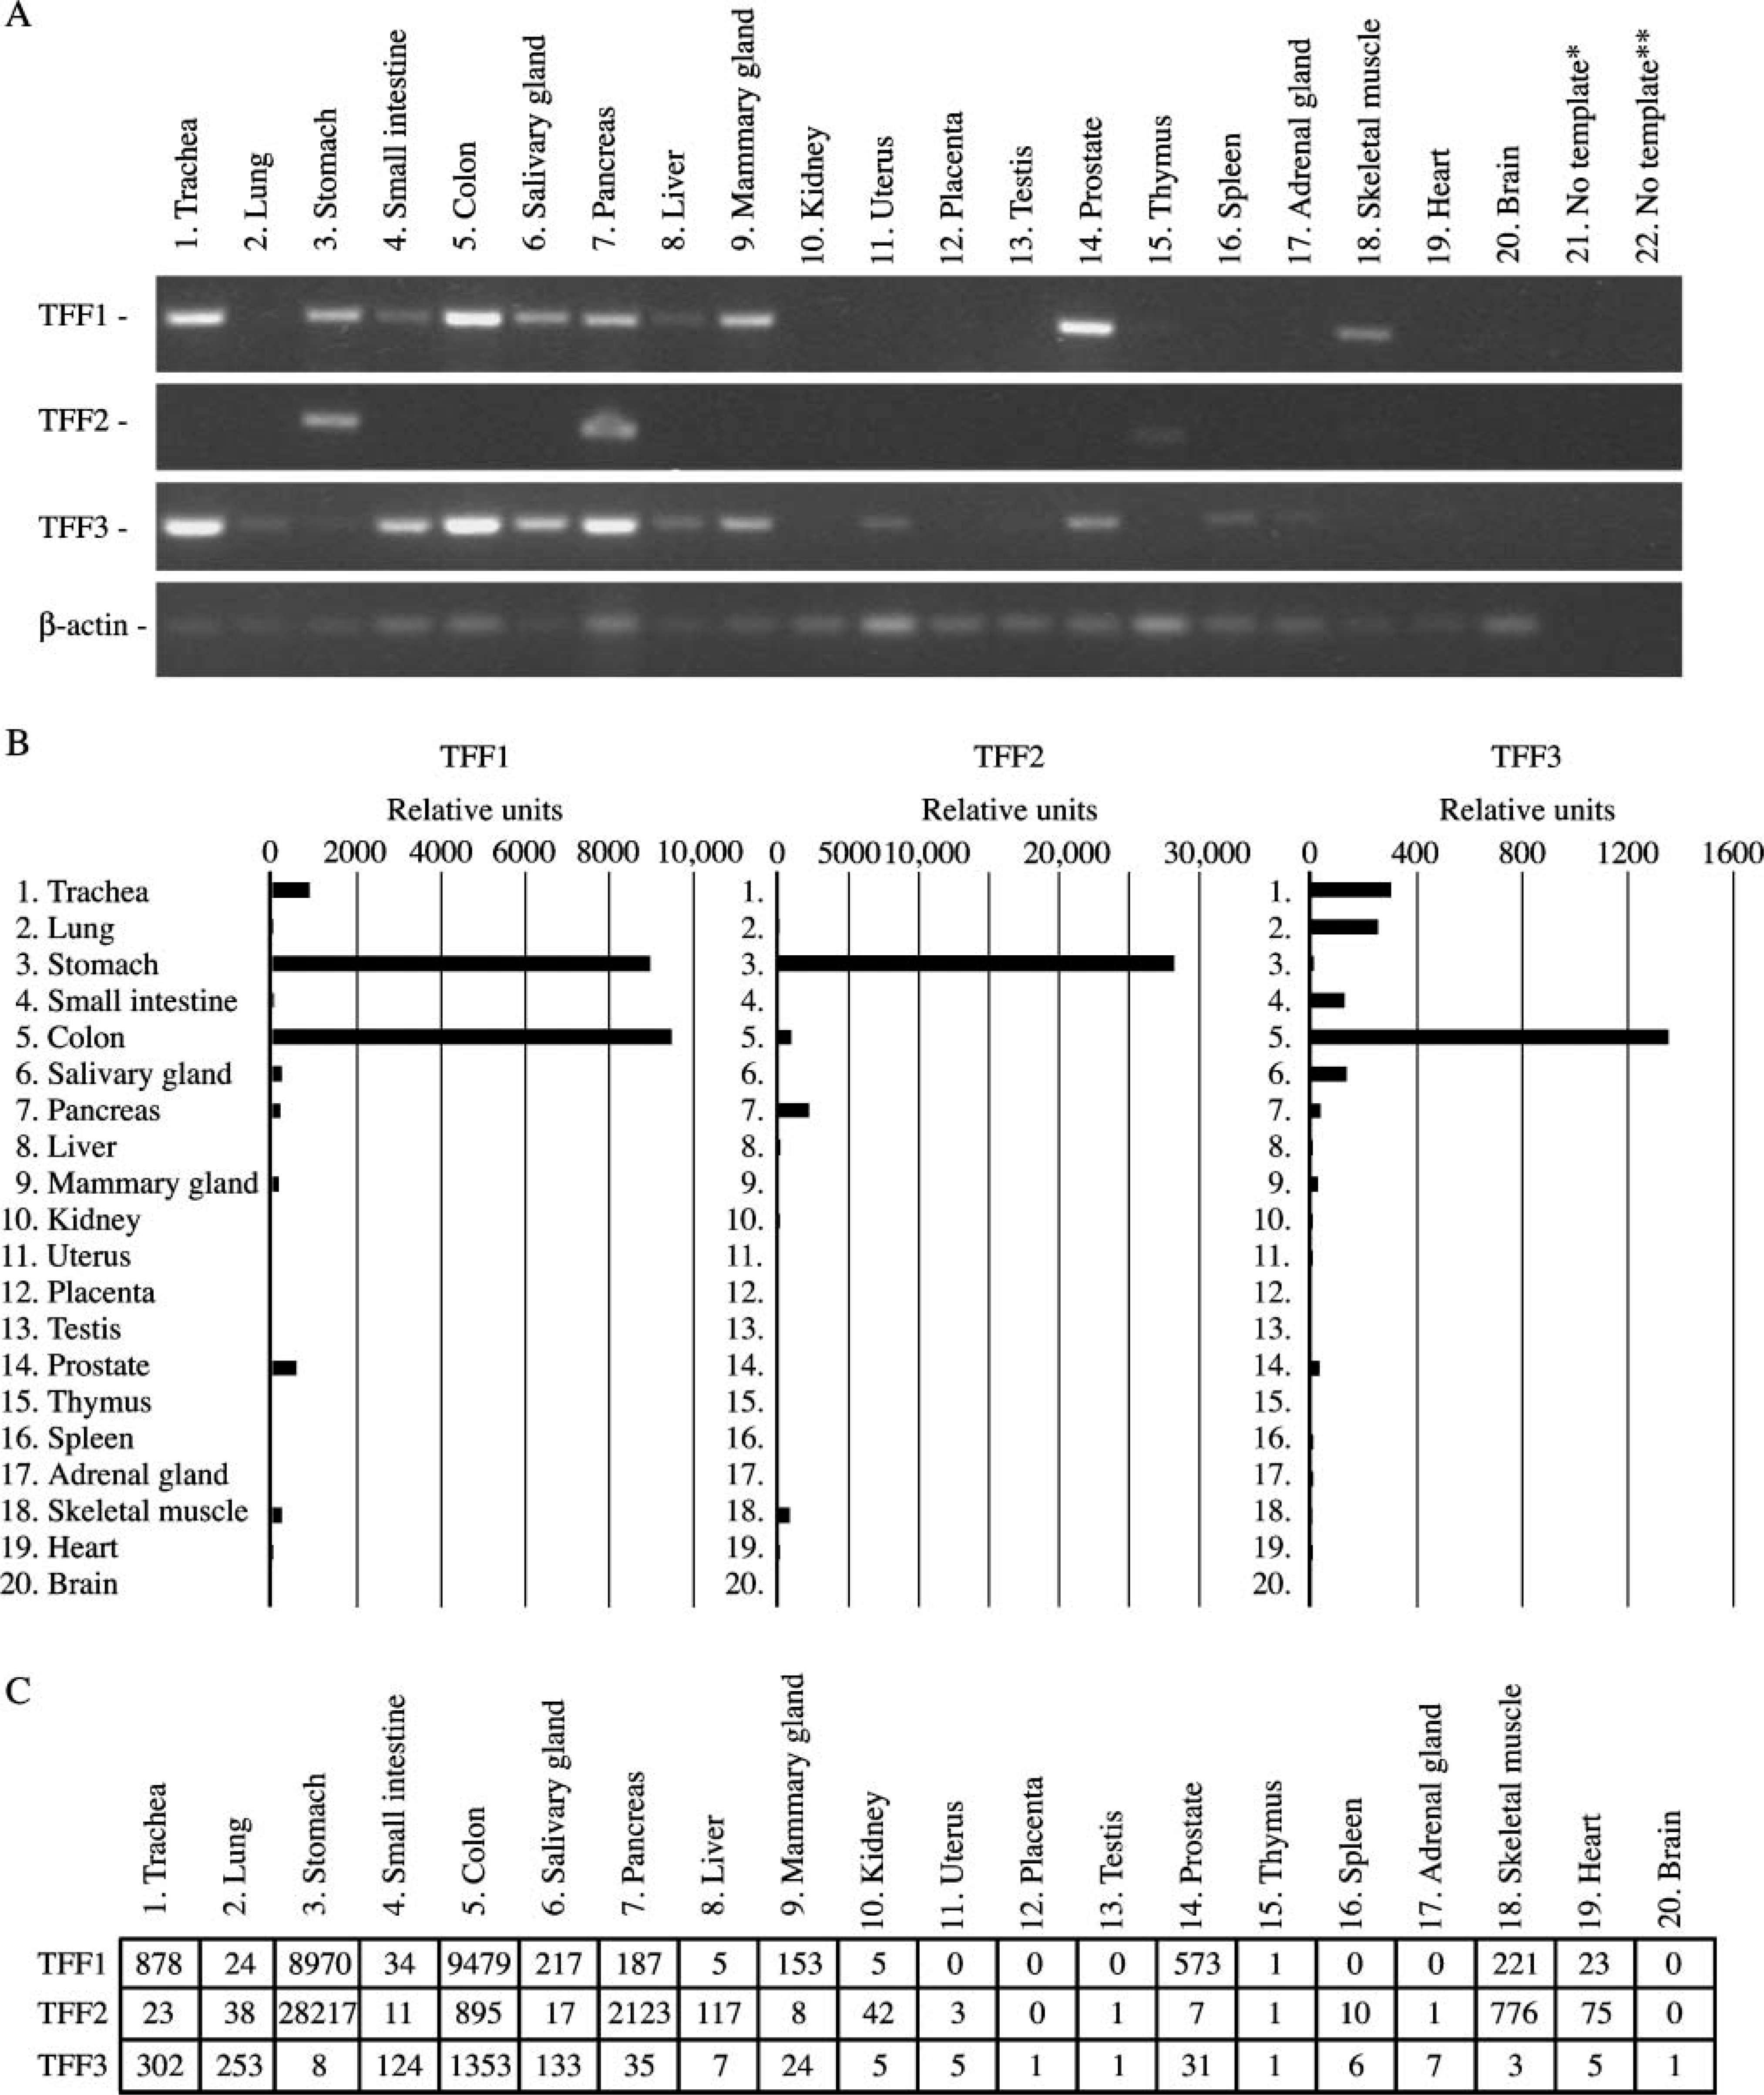
PCR analysis of TFF1, TFF2, and TFF3 expression in 20 normal human tissues. All reactions were performed a minimum of two times. Typical results are shown. Negative controls were samples without template for the first-strand synthesis (∗) or in the PCR (∗∗).
Discussion
In this study we compared levels of expression of three known human TFFs at the mRNA and the protein level by combining real-time PCR with IHC localization using specific polyclonal antibodies. In general, there was good agreement between measurements of mRNA and results obtained by IHC.
Real-time PCR analysis revealed TFF3 to be the most widely expressed peptide of the three TFFs, with the highest levels detected in the colon. The respiratory tract, including the trachea, lung, and the salivary gland, as well as the small intestine, showed intermediate levels of expression of TFF3, and the remainder of the examined tissues showed low to barely detectable levels. TFF2 has previously been described as a stomach-restricted gene. However, results from real-time PCR analysis showed expression in many tissues other than stomach, including the pancreas, which showed the second-highest level of expression, an order of magnitude lower than stomach. A distinct signal was also seen in the colon and skeletal muscle, and lower to no signal was found in the remainder of the examined tissues. The highest TFF1 mRNA levels were observed in the colon and stomach, and expression levels an order of magnitude lower were found in the trachea, prostate, skeletal muscle, salivary gland, pancreas, and mammary gland. Low but distinct expression was seen in the small intestine, lung, and heart, with the remainder of tissues showing low to no expression.
IHC analysis localized the peptides to numerous tissues, with the majority in the alimentary tract or associated organs. All three peptides were localized to the stomach, with TFF2 staining most strongly, followed by TFF1, and only weakly for TFF3. The small and large intestine and rectum showed strong staining for TFF3 and TFF1 and no or scattered staining for TFF2. These results are in accordance with previous studies (Wright et al. 1990; Hanby et al. 1993a,b; Podolsky et al. 1993; Lin et al. 2003; Kouznetsova et al. 2004; Paulsen et al. 2005). One difference of localization between humans and mice was found in the stomach. Karam et al. (2004) found TFF1 and TFF2 in pit and neck cells of the stomach in adult mouse tissue as we did in adult normal human tissue, whereas TFF2 was found in the lower isthmus region. For TFF3, staining was confirmed in the upper part of the stomach, but we did not find any staining in the zymogenic cell region in human tissue as Karam et al. (2004) observed in the mouse. Our findings in humans are in agreement with an earlier report investigating trefoil expression in the human stomach (Kouznetsova et al. 2004). This difference could be due to species-specific expression between mice and humans. Submucosal glands of the esophagus, similar to the stomach, also showed staining of all three peptides. However, staining intensity was the inverse as compared with the stomach, with TFF3 showing the strongest staining and TFF2 only showing weak staining. Expression of TFF3 has been reported in all three human salivary glands, but localization was only observed in the secretory granules of serous cells of submandibular glands and not in mucous cells (Jagla et al. 1999). We have tissue samples from both the parotid and sublingual glands. Like Jagla et al. (1999), we found no localization of any of the three trefoil peptides in the parotid gland. However, in the sublingual gland, we found that TFF3, TFF1 and, to a lesser extent, TFF2 localized to mucous cells and not to serous cells. We have no explanation for this discrepancy between the cellular localization of TFF3 in salivary glands. However, using PCR, Jagla et al. (1999) found a stronger signal for TFF3 and TFF1 in the sublingual gland than in the submandibular gland, supporting our IHC findings of trefoil peptides in the sublingual gland. In general, we found the strongest signal for TFF3 in cells associated with the production of mucus, either in submucosal cells, goblet cells, or epithelial cells. TFF1 showed a similar tissue profile, but the staining was either weaker or seen in fewer cells. Even though IHC is not a quantitative method and therefore not possible to compare results between different TFFs, the pancreas was the only tissue showing similar staining intensity for all three peptides using the dilutions described here. Staining was localized to epithelial ductus cells of the exocrine pancreas for all three TFFs, whereas no staining was observed in the endocrine pancreas. This is the first study showing strong and clear staining for all three trefoil peptides in the pancreas, where only faint and scattered staining for TFF1 has been previously reported in humans and mice (Ebert et al. 1999; Terris et al. 2002). Only faint staining was found for TFF3 in small bile ducts and no staining was found for TFF1 or TFF2, respectively (data not shown). These results are in agreement with previous results where weak and scattered localization has been reported for TFF1 and TFF3 in larger bile ducts in ∼30% of normal liver samples (Sasaki et al. 2004a). These results were also supported by our PCR analysis, which showed low levels of all three peptides in the liver. Epithelial cells of the gallbladder stained positively for TFF1 and TFF3, respectively, whereas no staining was seen for TFF2. This is in contrast to findings by Longman et al. (2000), which showed by elegant colocalization studies of trefoil peptides and mucins that TFF2 localized to the gallbladder epithelium. However, this study was not performed on normal human tissue and, therefore, the difference between this study and the latter report seems to depend on the presence or absence of background pathological difference.
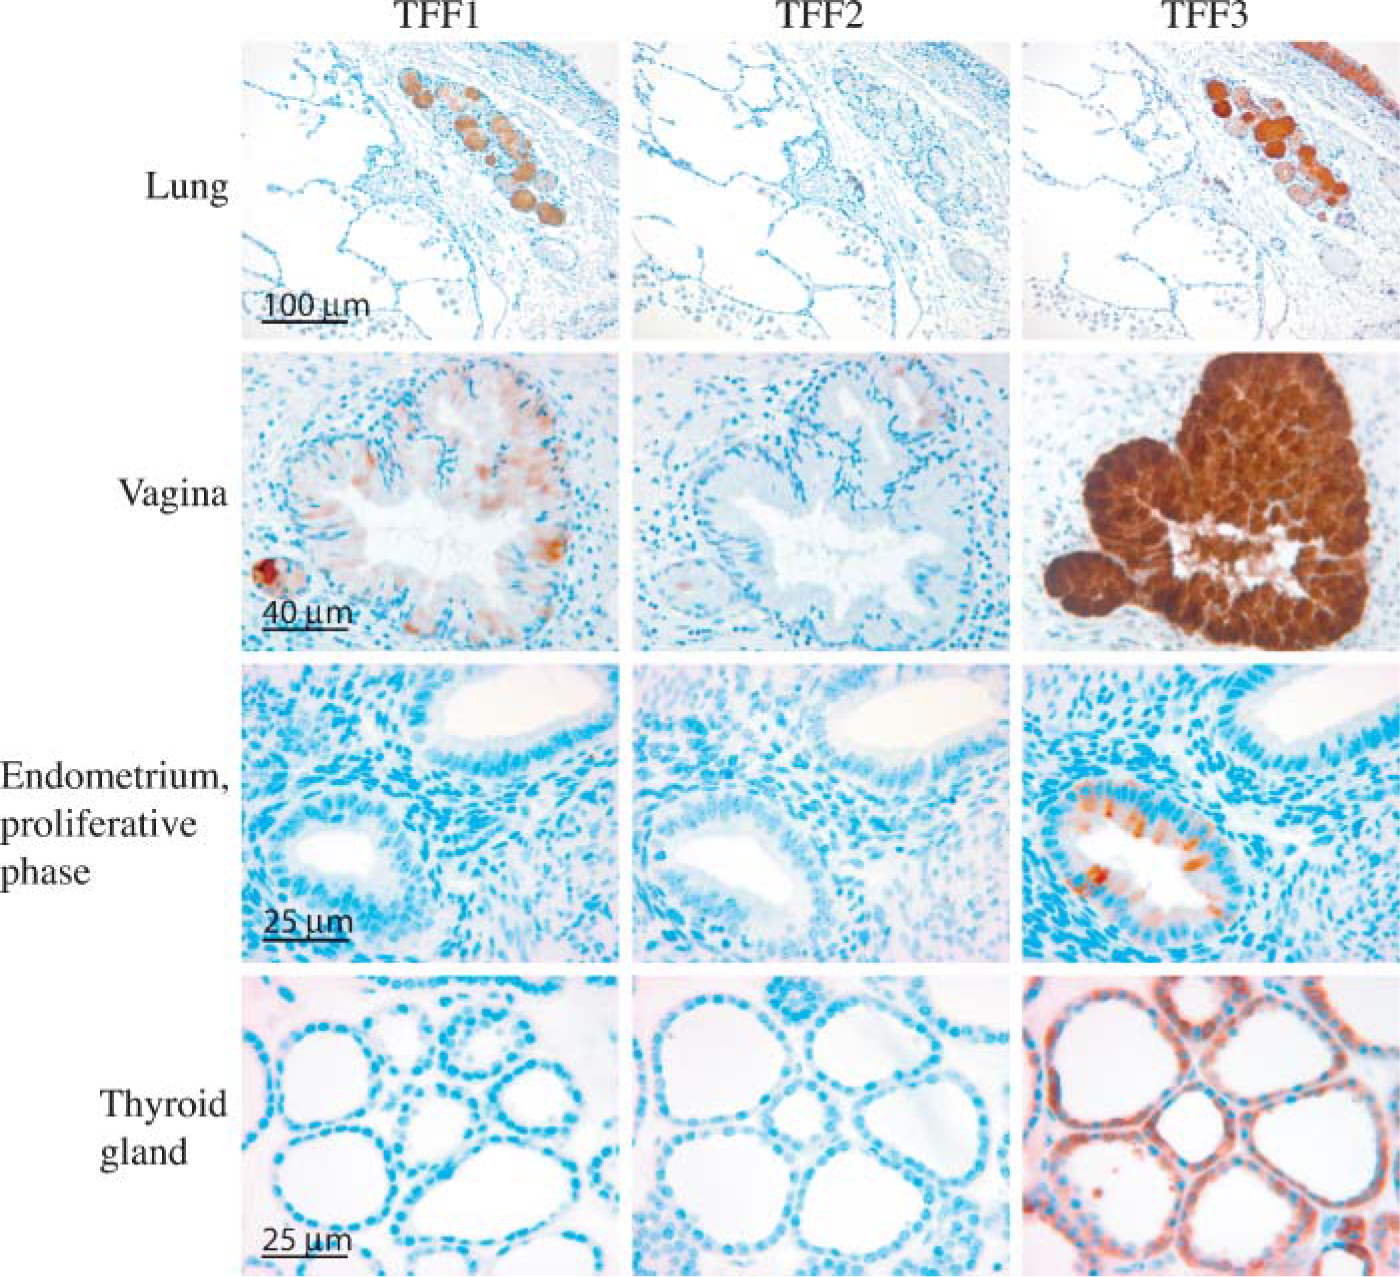
Tissue localization of TTF1, TFF2, and TFF3 in the human non-gastrointestinal channel organs. A positive signal is indicated by a brown color.
Real-time PCR analysis revealed that of the 20 tissues analyzed, the second-highest expression level of TFF3 was found in the trachea and, in accordance with this, IHC analysis localized the peptide to the submucosal glands and the pseudostratified epithelium in the bronchus. TFF1 was also seen in the submucosal glands, but not in the pseudostratified epithelium in the bronchus. No staining was found in the bronchus for TFF2. In the alveolar compartment of the respiratory tract, no localization was found for any of the three peptides, corresponding to the absence of goblet cells in alveoli. These results are in accordance with previously published results (Wiede et al. 1999; dos Santos Silva et al. 2000).
Expression of trefoil peptides was also found in the vagina where TFF3 showed clear localization to mucosal glands. TFF1 showed less intense staining and, occasionally, staining for TFF2 was observed in a few mucosal cells. A single previous report has looked at the female genitalia and found localization of TFF3 in the surface epithelium of the endocervix and in gland-like structures in the cervical epithelium (Wiede et al. 2001). This report found expression of mainly TFF3, but also of TFF1 and TFF2, in the endocervix. We could not detect any expression of TFF1 by real-time PCR and only low expression of TFF2 and TFF3 in the uterus. This is consistent with the results obtained by IHC of the endometrium at different stages of the menstrual cycle, where only a few epithelial cells stained positive for TFF3 in the proliferative phase. However, expression of the trefoil peptides has been reported to vary in accordance with the menstrual cycle. TFF3 was identified as the gene showing the highest degree of down-regulation (50-fold) in the human endometrium during the window of implantation (Kao et al. 2002). The reason for these conflicting results is not known. However, Wiede et al. (2001) found in their study using conventional RT-PCR a low message for TFF3 in both proliferative and secretory phases of the endometrium, which supports our results.
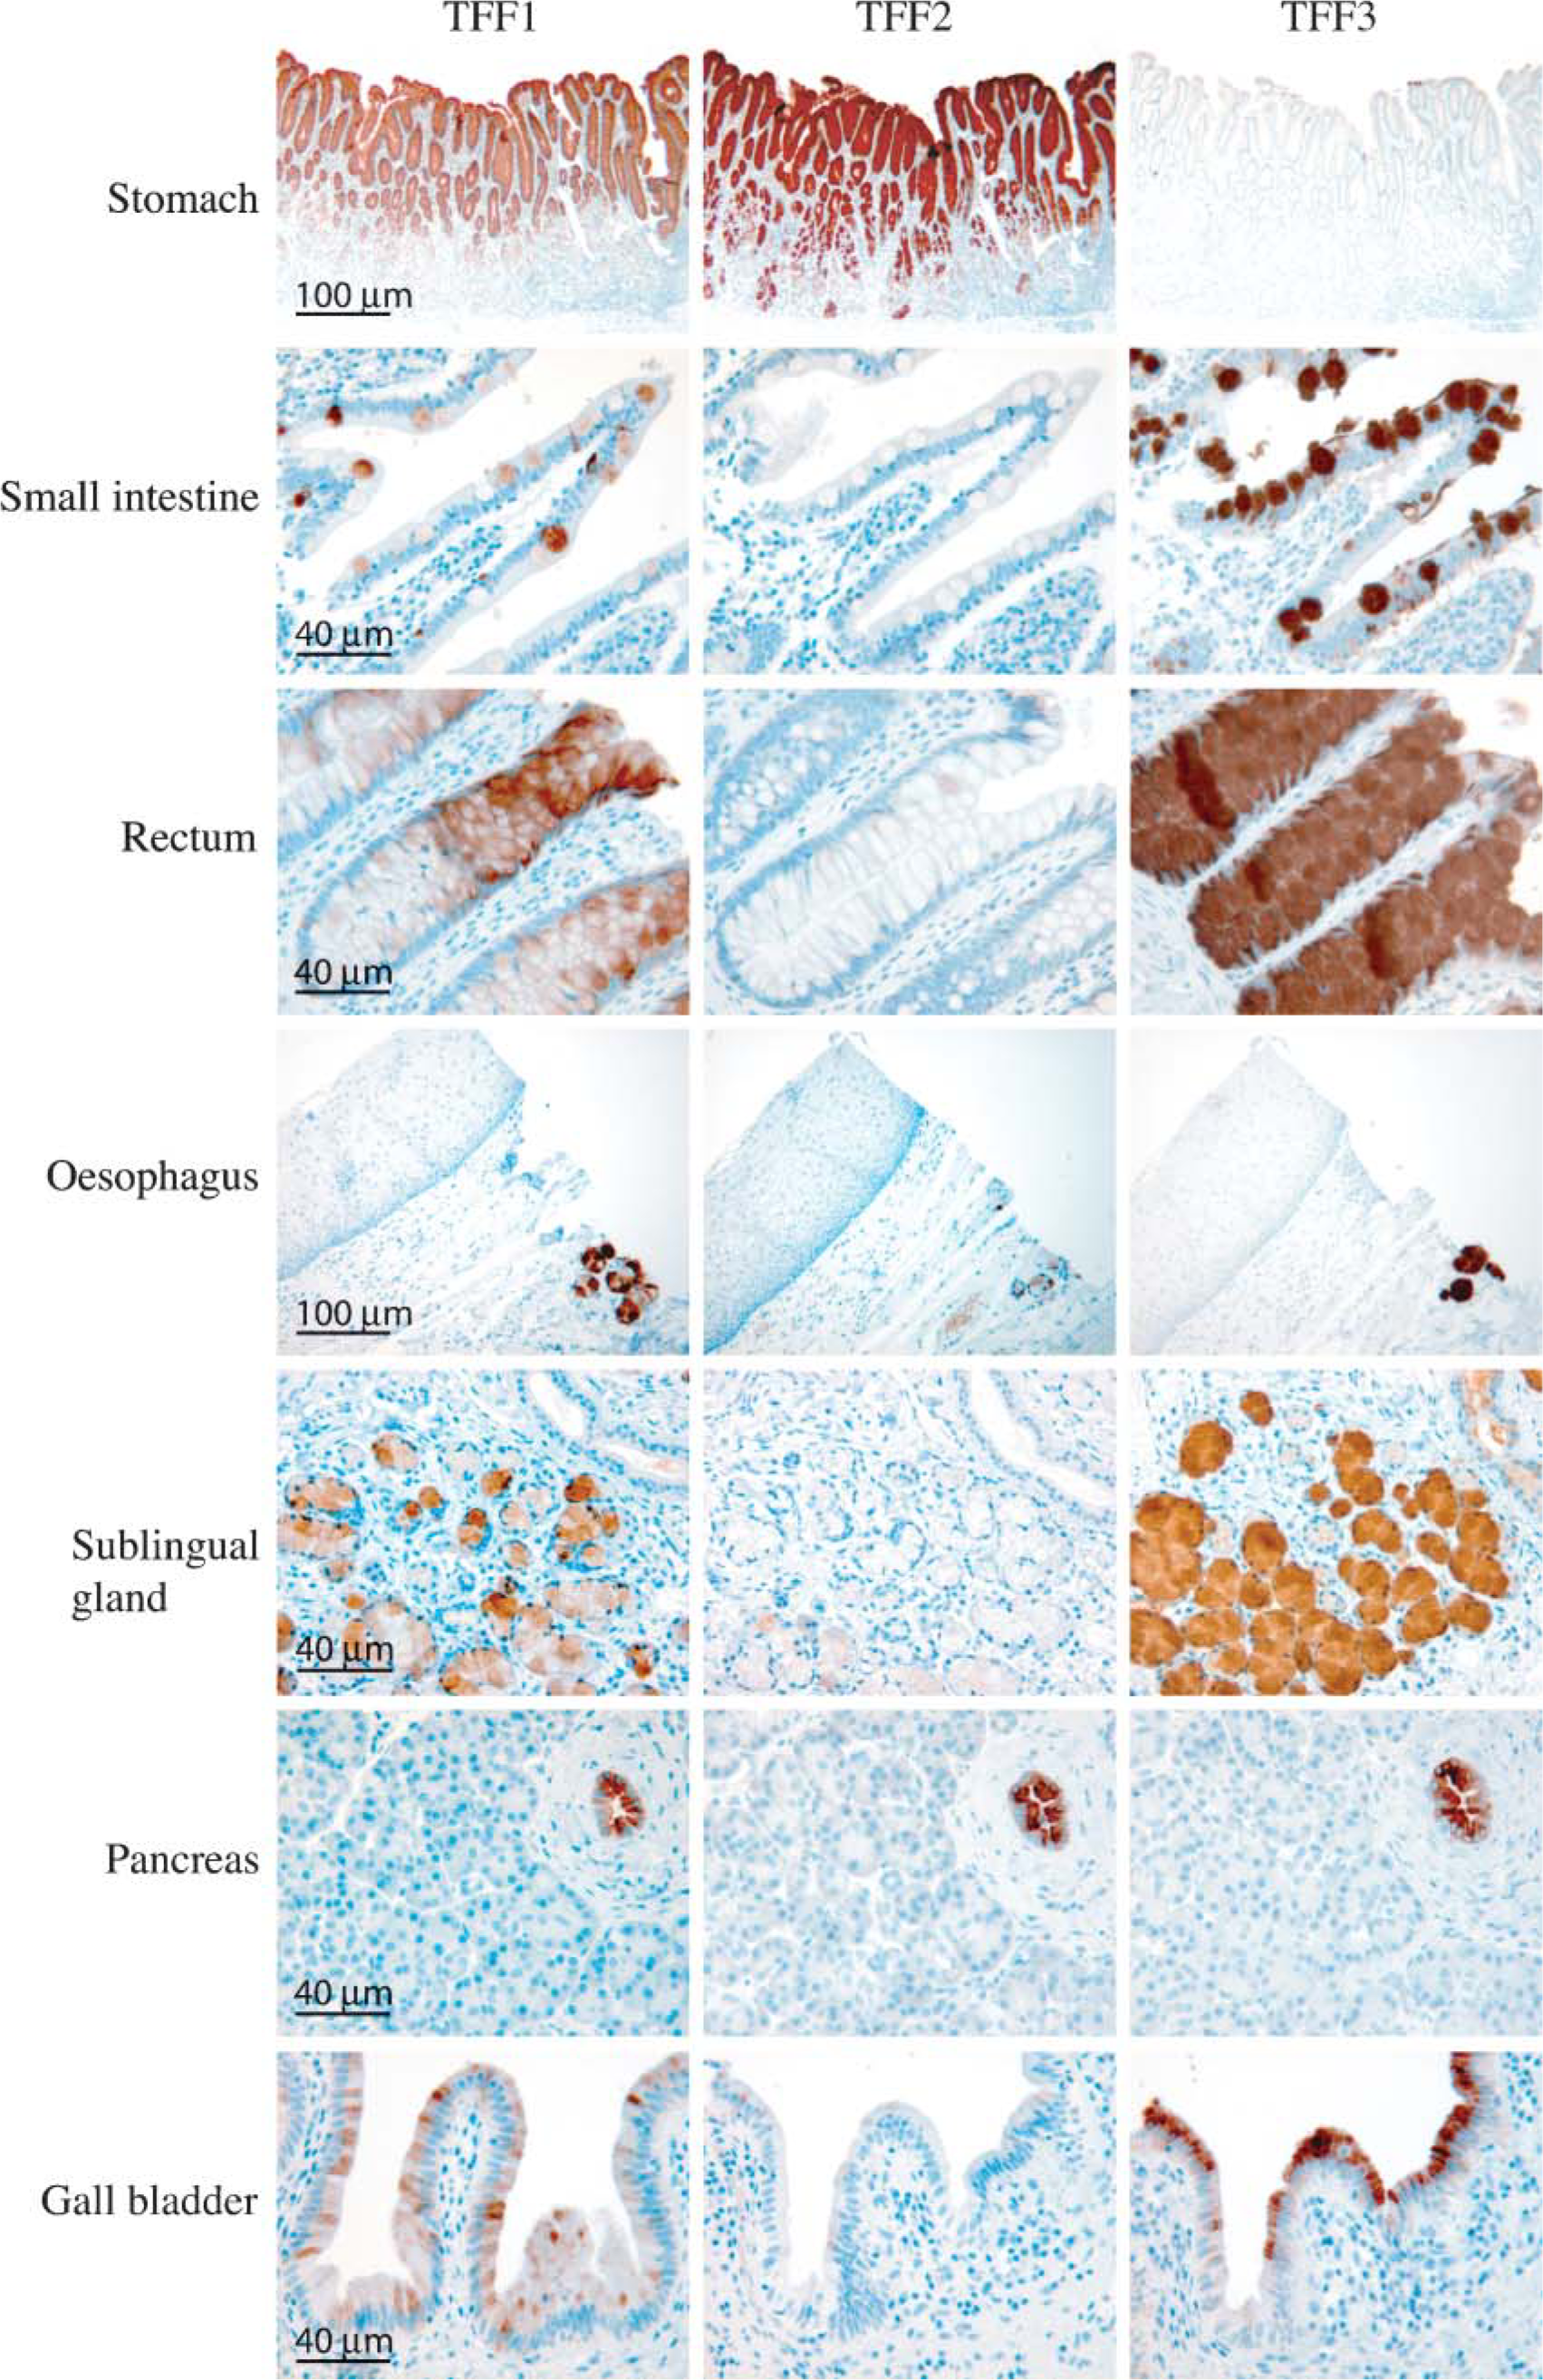
Tissue localization of TTF1, TFF2, and TFF3 in the human gastrointestinal tract and associated organs. A positive signal is indicated by a brown color.
TFF3 was also found in the cuboidal epithelial cells of the thyroid gland, whereas no staining was observed for TFF1 or TFF2. This is the first report showing protein localization of TFF3 in the thyroid gland. A few reports have previously shown expression of TFF3 in normal thyroid gland tissue, including in situ hybridization analysis that showed expression in cuboidal epithelial cells (Huang et al. 2001; Takano et al. 2004). This supports the results obtained here by IHC.
Trefoil peptides are known to be upregulated in connection with ulceration or other types of mucosal damage including inflammatory bowel disease, diseased intrahepatic bile ducts, Barrett's esophagus, and numerous gastrointestinal cancers (Rio et al. 1991; Poulsom et al. 1993; Wright et al. 1993; Ohshio et al. 2000; Lee et al. 2003; Van De Bovenkamp et al. 2003; Sasaki et al. 2004b). The present localization study of the three TFFs allows us to compare the expression pattern of the TFFs in different disease states.
Footnotes
Acknowledgements
This work was supported by The Danish Medical Research Council (to UH), The Fifth (EC) Framework Programme (contract no. QLK2000-00325 to UH), and The Benzon Foundation (to JM).