
Abstract
Glucose-6-phosphate dehydrogenase (G6PD; EC 1.1.1.49) is the key regulatory enzyme of the pentose phosphate pathway and produces NADPH and riboses. In this study, the kinetic properties of G6PD activity were determined in situ in chemically induced hepatocellular carcinomas, and extralesional and control parenchyma in rat livers and were directly compared with those of the second NADPH-producing enzyme of the pentose phosphate pathway, phosphogluconate dehydrogenase (PGD). Distribution patterns of G6PD activity, protein, and mRNA levels were also compared to establish the regulation mechanisms of G6PD activity. In (pre)neoplastic lesions, the Vmax of G6PD was 150-fold higher and the Km for G6P was 10-fold higher than in control liver parenchyma, whereas in extralesional parenchyma, the Vmax was similar to that in normal parenchyma but the Km was fivefold lower. This means that virtual fluxes at physiological substrate concentrations are 20-fold higher in lesions and twofold higher in extralesional parenchyma than in normal parenchyma. The Vmax of PGD was fivefold higher in lesions than in normal and extralesional liver parenchyma, whereas the Km was not affected. Amounts of G6PD protein and mRNA were similar in lesions and in extralesional liver parenchyma. These results demonstrate that G6PD is strongly activated post-translationally in (pre)neoplastic lesions to produce NADPH.
Keywords
G
Materials and Methods
Induction of Neoplasms in Liver
(Pre)neoplastic lesions were induced in livers of five male Wistar rats weighing 250–300 g by administration of 0.01% diethylnitrosamine (DENA; Sigma, St Louis, MO) via drinking water for 9 weeks (Wu et al. 1996; De Jong et al. 2001). Five male Wistar rats of a similar weight were used as controls. Animals were sacrificed with an overdose of barbiturates. Livers were immediately removed and dissected in pieces of 0.5 cm3. Liver fragments were frozen in liquid nitrogen and stored at −80C until used. Cryostat sections 8 μm thick were cut at −25C on a motor-driven Bright cryostat (Huntington, UK) fitted with a rotary retracting microtome, picked up on clean glass slides, and stored at −25C until used (Van Noorden and Frederiks 1992).
Localization of G6PD and PGD Activity
Cryostat sections were allowed to dry at room temperature (RT) for 5 min and were then incubated for the demonstration of G6PD and PGD activity according to Van Noorden and Frederiks (1992). Incubation medium contained 18% polyvinyl alcohol (PVA; weight average Mr 70,000–100,000; Sigma) in 0.1 M phosphate buffer (pH 7.4), 10 mM glucose-6-phosphate (G6P; Boehringer, Mannheim, Germany) or 10 mM 6-phosphogluconate (6PG; Boehringer), 0.8 mM NADP+ (Boehringer), 0.4 mM 1-methoxyphenazine methosulfate (Serva; Heidelberg, Germany), 5 mM MgCl2, 5 mM sodium azide, and 5 mM nitro-BT (Sigma). The media were freshly prepared just before incubation and nitro-BT was added after being dissolved in a heated mixture of dimethylformamide and ethanol (final dilution of each solvent in the medium was 2% v/v). Sections of control liver were incubated for 30 min at RT, whereas serial sections of livers of DENA-treated rats were incubated for 1 or 30 min at RT to allow analysis of G6PD activity in (pre)neoplastic lesions and extralesional parenchyma, respectively. Then the sections were rinsed with hot phosphate buffer (0.1 M, pH 5.3, 60C) to remove the incubation medium and to stop the reaction immediately, and were mounted in glycerin-gelatin. Control reactions were performed in the absence of G6P and NADP for G6PD and in the absence of 6PG for PGD (Butcher and Van Noorden 1985). Km and Vmax towards G6P and 6PG of G6PD and PGD, respectively, were determined by incubating sections in the presence of 0–10 mM G6P or 6PG, respectively (Jonges et al. 1995; Van Noorden et al. 1997). Furthermore, a non-competitive inhibitor of G6PD, dehydroepiandrosterone (DHEA 10 mM; Sigma) was used for control studies as well (Biagiotti et al. 2000). For this purpose, DHEA was dissolved in dimethylformamide, resulting in an extra 1% of the solvent in the incubation medium.
To test whether PGD activity was involved in the assay for the demonstration of G6PD activity, sections were incubated in the presence of both 10 mM G6P and 10 mM PG. The test minus control reaction of the latter assay was diminished with the test minus control reaction of PGD and was taken as a measure for the actual G6PD activity (Lawrence et al. 1988).
Immunohistochemistry of G6PD Protein
Rat G6PD protein was demonstrated in livers of control rats and DENA-treated rats using a polyclonal rabbit anti-yeast G6PD antibody (Sigma; dilution 1:200) according to Straatsburg and Frederiks (1997). Cryostat sections were air-dried (1 hr or overnight), fixed in cold acetone (10 min, −20C), and dried again for 10 min. Antigens were exposed for 30 min by using a solution of 10 mM Tris, 5 mM EDTA, 150 mM NaCl, 0.25% gelatin, and 0.5% Tween-20 (Sigma) at pH 8.0. Between all further incubation steps, sections were thoroughly rinsed in PBS. The antibody was diluted in PBS containing 0.2% (w/v) bovine serum albumin and 1% (v/v) normal rat serum to block nonspecific staining. Sections were incubated for 60 min at RT. After rinsing, sections were incubated for 90 min at RT with horseradish peroxidase-labeled goat anti-rabbit IgG (DAKO, Glostrup, Denmark; dilution 1:100). Peroxidase activity was detected by incubating the sections for 10 min in a medium containing 0.5 mg/ml diaminobenzidine (Fluka; Buchs, Switzerland), 3 mM H2O2, and 50 mM Tris-HCl buffer (pH 7.6). Control incubations were performed in the absence of primary antibody.
In Situ Hybridization of G6PD mRNA
The procedure to localize G6PD mRNA was performed as described by Biagiotti et al. (2000). Cryostat sections of livers of control rats and DENA-treated rats were air-dried and then fixed with 4% paraformaldehyde in PBS for 20 min at RT. After thorough rinsing, sections were treated with 10 μg proteinase k (Sigma) per ml PBS for 15 min at RT. After rinsing and acetylation, sections were dried thoroughly and incubated overnight with double digoxygenin-labeled RNA probe (Amersham Pharmacia Biotech; Roosendaal, The Netherlands) in hybridization buffer. The G6PD mRNA probe was the antisense sequence of the one that codes for the amino acid sequence tgt tgt gct gct ggg tca ccc gga tga atg. The sequence was derived from the human genome as described by Kanno et al. (1989). As control, sections were incubated with 10 μg per ml RNase for 30 min at RT before hybridization. After rinsing, sections were incubated with anti-digoxygenin-Fab conjugated with alkaline phosphatase (Boehringer; diluted 1:400) for 3 hr at RT. Alkaline phosphatase activity was detected by incubating in 18% PVA in 0.1 M Tris-HCl buffer (pH 9.0) containing 5 mM nitro-BT, 0.7 mM 5-bromo-4-chloro-3-indolyl phosphate (Boehringer), and 10 mM levamisole for 10 min at 37°C (Van Noorden and Frederiks 1992).
Image Analysis and Image Processing
Serial sections of control liver and livers of DENA-treated rats were used to determine Vmax and Km values of G6PD and PGD using image analysis. In each section (three sections per enzyme and per animal), three areas were selected. In each selected area, three measurements were made and mean gray values were calculated. Gray values were converted into absorbance values by using a set of neutral density filters (Kodak, Rochester, NY; Jonker et al. 1997). Values of control reactions were subtracted from test values to obtain specific enzyme activity (Butcher and Van Noorden 1985; Geerts et al. 1996). Enzyme activity was expressed as μmoles substrate converted per cm3 tissue by conversion of absorbance values by recourse to the molar absorbance coefficient (k) of nitro-BT-formazan (k = 16,000 liter moL−1 cm−1 at 585 nm; Van Noorden and Frederiks 1992). A Vanox-T photomicroscope (Olympus; Tokyo, Japan) with a X2 objective (NA 0.08) was used. Cryostat sections were illuminated with white light from a stabilized power supply after filtering with infrared blocking filters (Chieco et al. 1994,2001; Jonker et al. 1997) and a monochromatic filter of the isobestic wavelength of NBT-formazan (585 nm; Van Noorden and Frederiks 1992) was used for activity measurements. Images of the sections were captured by using a Cohu 4913 CCD camera (Cohu; San Diego, CA) and an 8-bit monochromo frame grabber (LG-3; Scion, Frederick, MD). Data analysis of captured images was performed on a Power Macintosh 8100/110 computer (Apple; Cupertino, CA) using the public domain NIH Imaging software program (written by Wayne Rasband, United States National Institutes of Health) and available via Internet from http://rsb.info.nih.gov/.
Statistics
Vmax and Km values were expressed as mean ± SD. Student's t-tests were employed for statistical analysis; differences were tested at the 0.05 level of significance. The Vmax and Km values were calculated from plots of substrate concentrations vs the ratio of substrate concentration and reaction velocity according to Wilkinson (1961). Regression analysis of the plots was performed when appropriate. The equation of the resulting linear relationship is
in which 1/a is the Vmax value and b/a is the Km value. Flux rates (ø) of G6PD and PGD with their respective substrates were calculated with the formula
with an assumed substrate concentration of 100 μM as was calculated for rat liver by Teutsch (1978).
Results
Localization of G6PD Activity
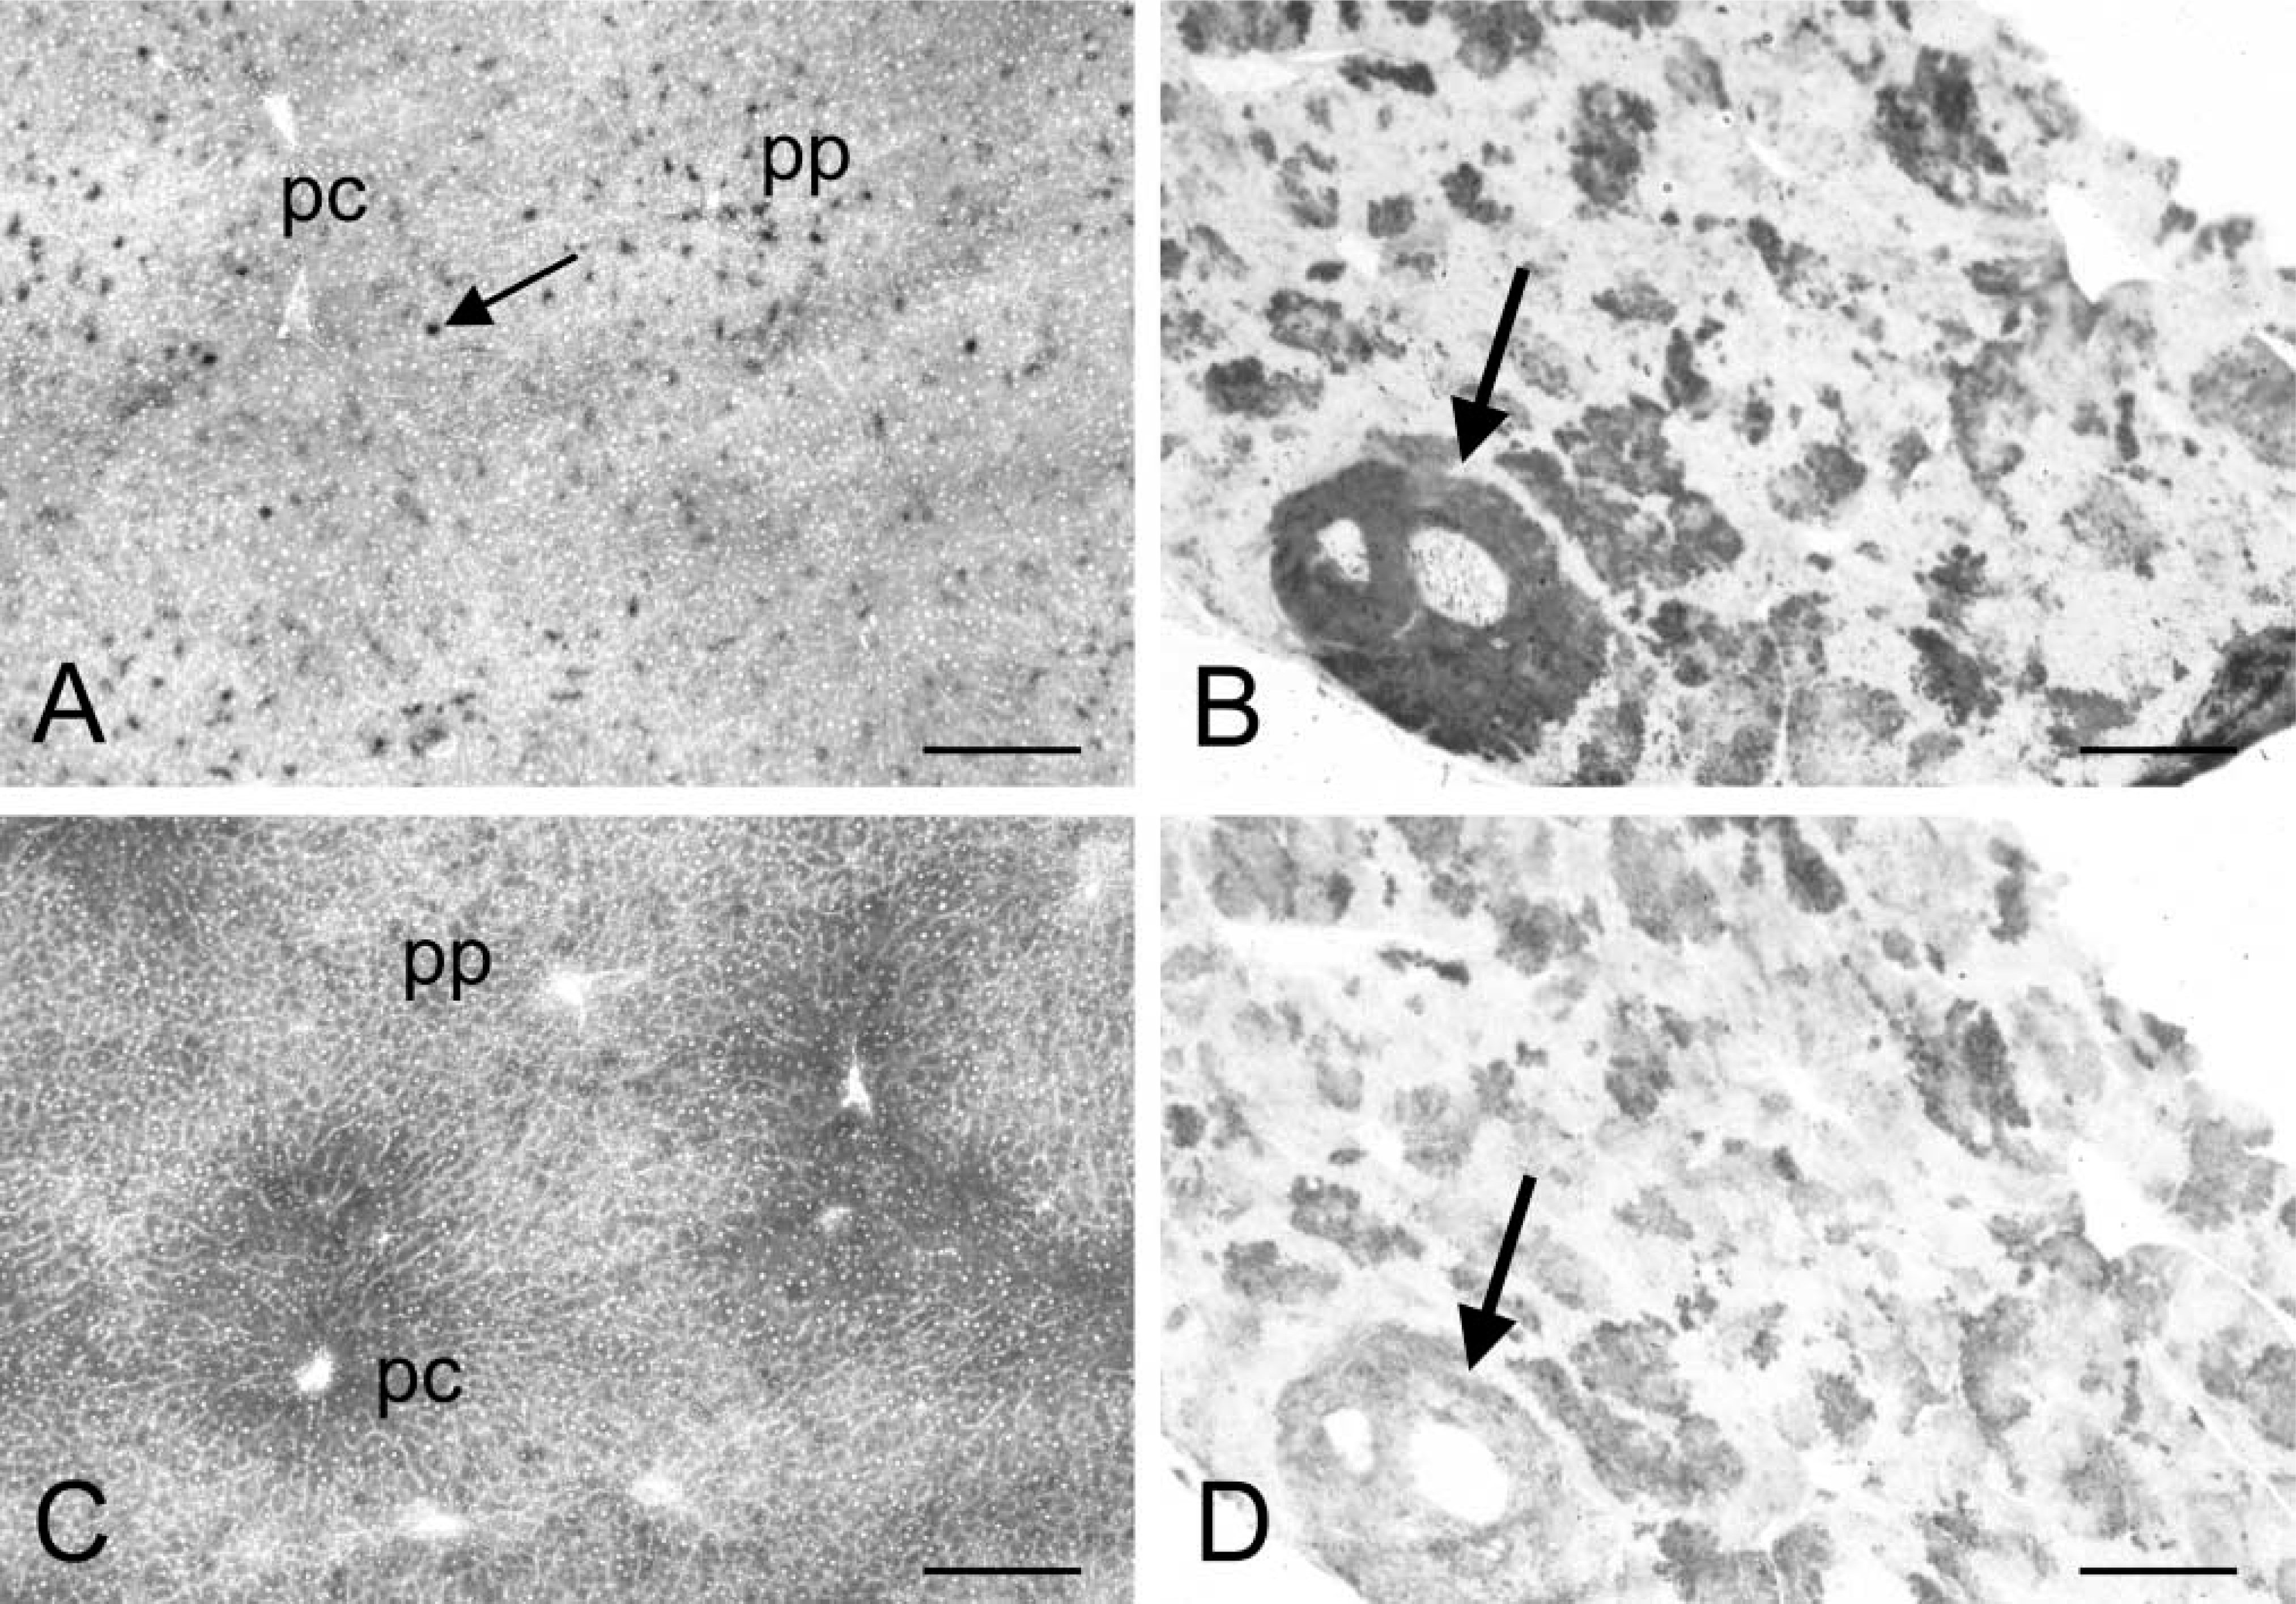
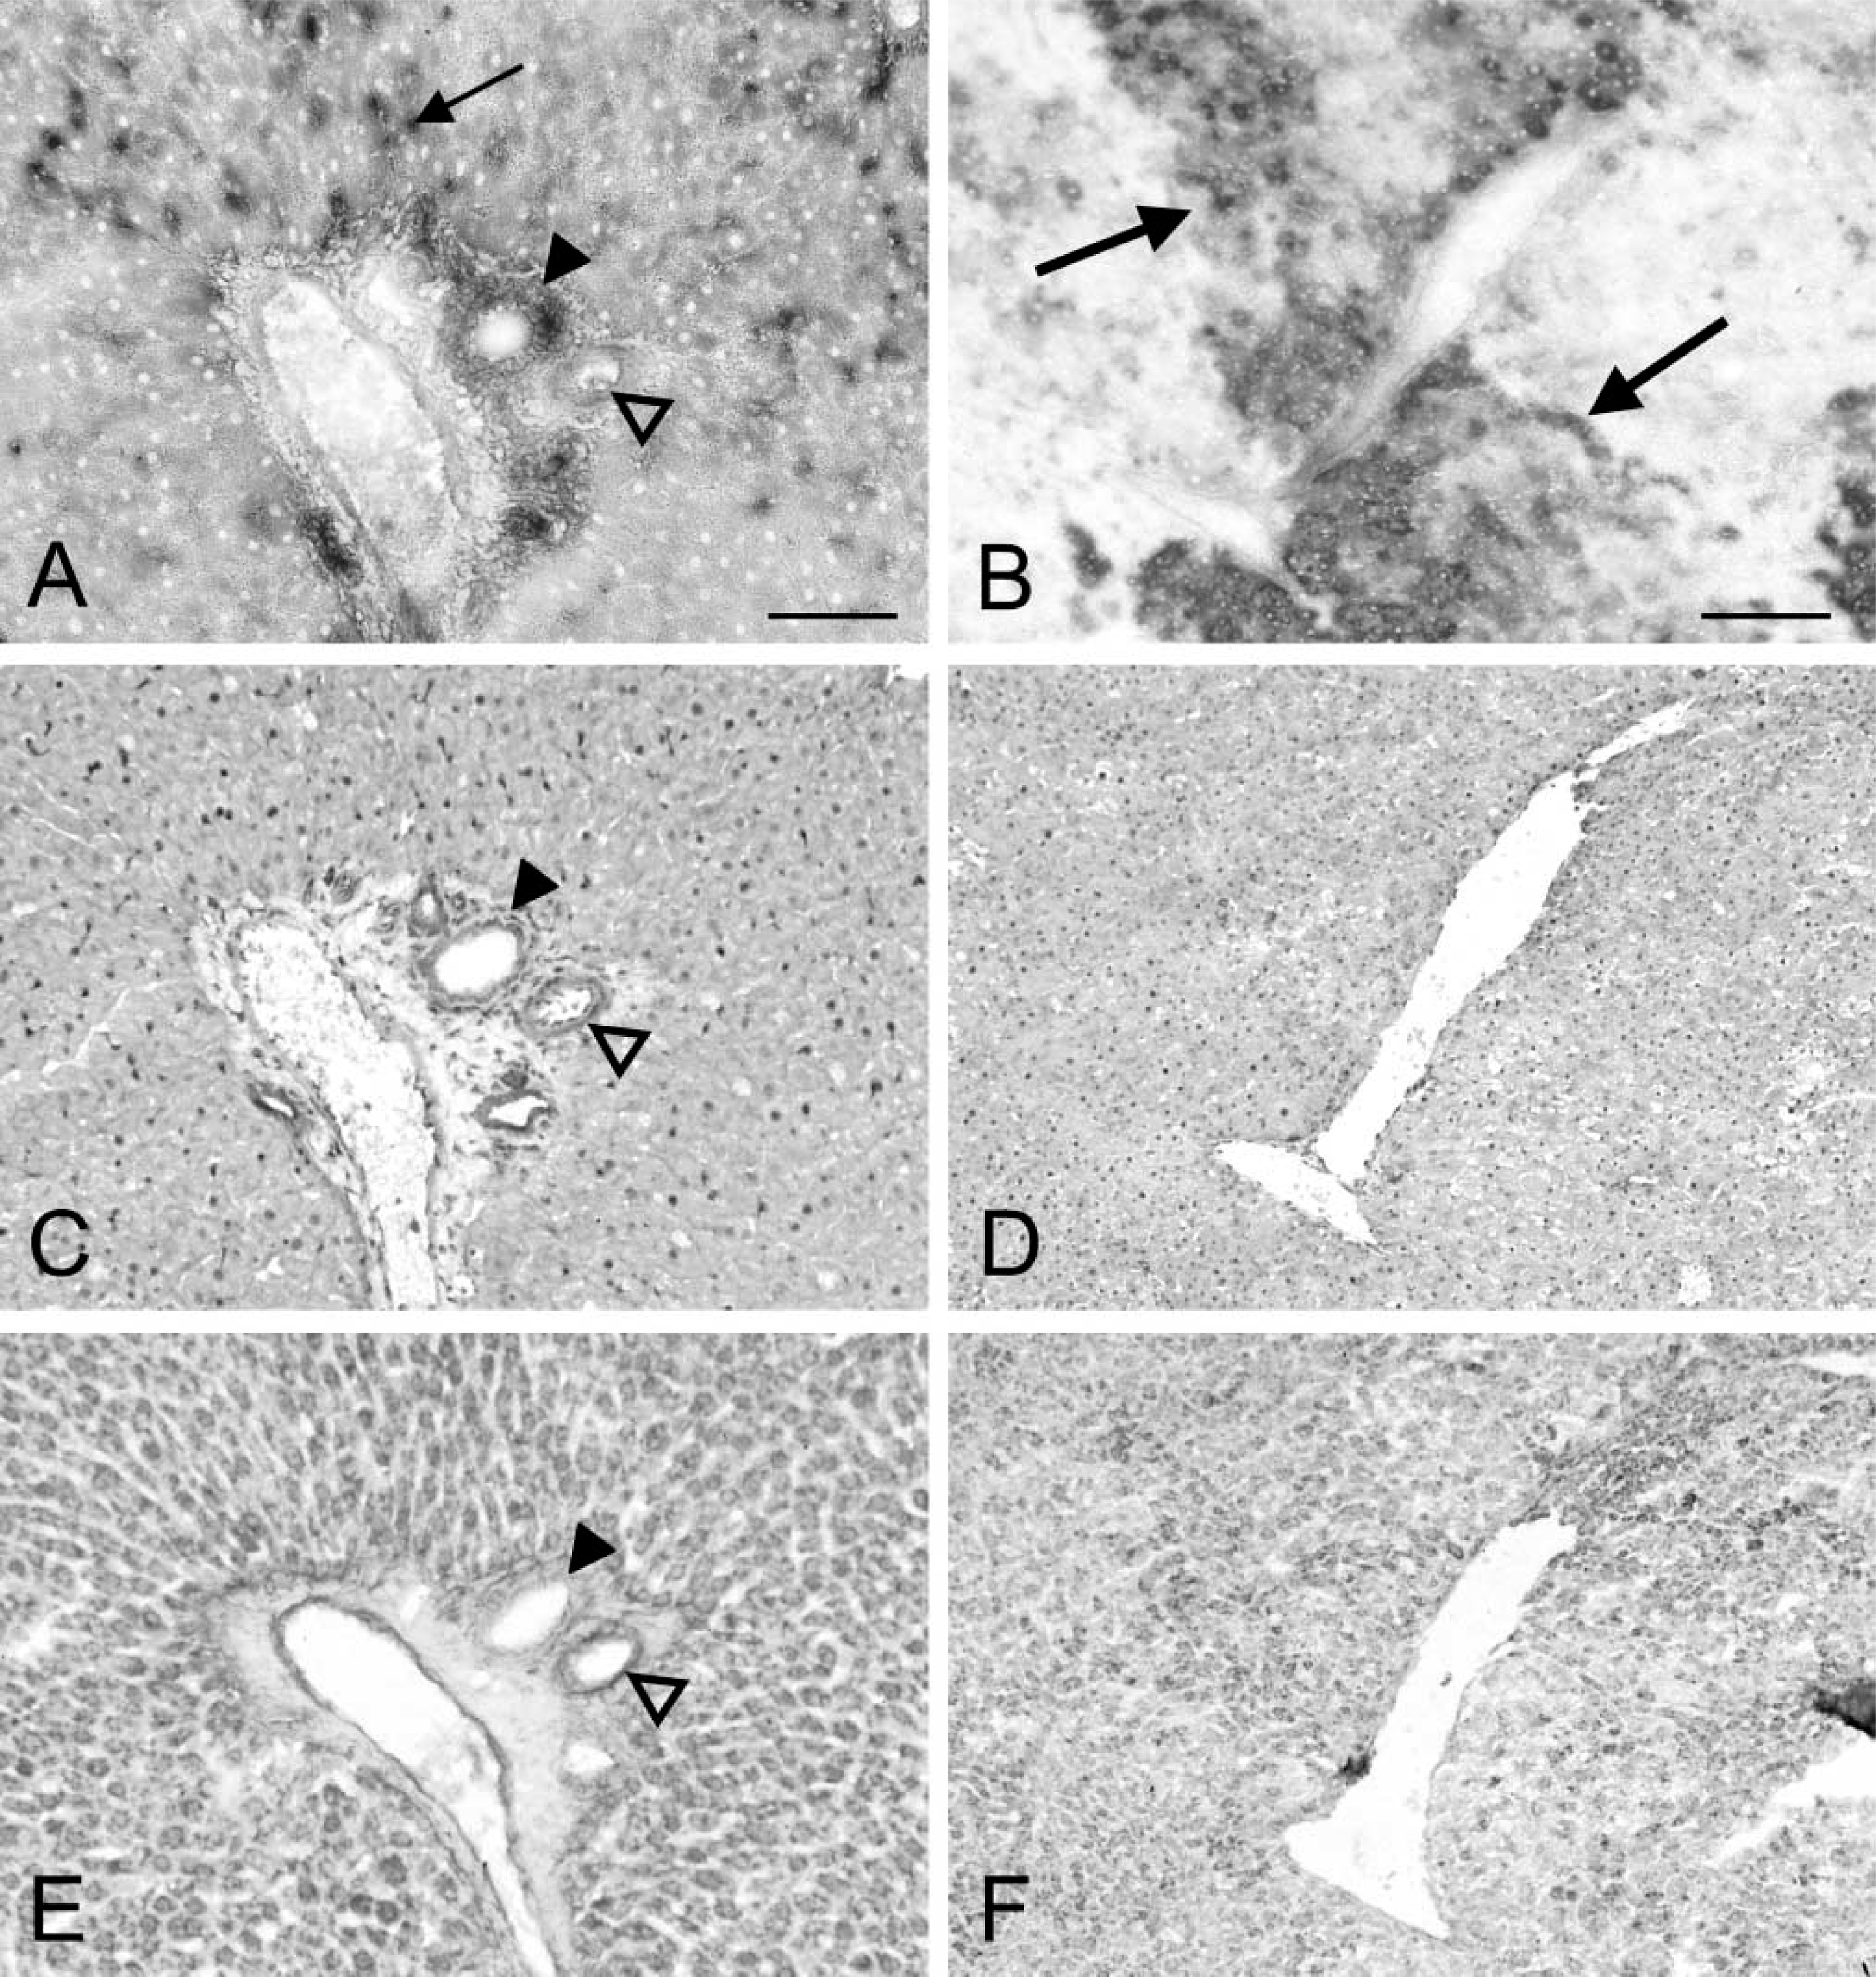
Figure 1A shows the localization of G6PD activity in control rat liver. Low activity was found in liver parenchymal cells. Highest activity was observed in pericentral and midzonal areas. Very high amounts of final reaction product were found in sinusoidal cells in periportal areas, which are Kupffer cells (Teutsch and Rieder 1979; Knook et al. 1980). Moreover, G6PD activity was high in epithelial cells of bile ducts and smooth muscle cells of arteries in portal tracts (Figure 2A). In livers of DENA-treated rats, very high G6PD activity was observed in (pre)neoplastic lesions (Figures 1B and 2B). Lower activity was found in extralesional liver parenchyma. Because a very short incubation time (1 min in Figures 1B and 2B vs 30 min in Figures 1A and 2A) had to be used to detect the high G6PD activity validly in (pre)neoplastic lesions, extralesional parenchyma and sinusoidal cells are devoid of staining in Figures 1B and 2B. However, when sections of livers containing (pre)neoplastic lesions were also incubated for 30 min, extralesional parenchyma stained similarly to control tissue. G6PD activity in epithelial cells of bile ducts and smooth muscle cells in the walls of blood vessels was similar in livers of control rats and DENA-treated rats as well. Control reactions performed in the absence of substrate and coenzyme did result in some precipitation of final reaction product in sections of both control livers and livers of DENA-treated rats. This formazan production was considered as nonspecific and was subtracted from test values for the calculation of specific G6PD activity. Dehydroepiandrosterone reduced specific G6PD activity in control liver parenchyma, (pre)neoplastic lesions, and extralesional parenchyma by 60%.
Localization of PGD Activity
PGD activity was exclusively localized in liver parenchymal cells in control rat liver, with a higher activity in pericentral and midzonal areas (Figure 1C). In livers of DENA-treated rats, PGD activity was distinctly higher in (pre)neoplastic lesions than in extralesional parenchyma (Figure 1D).
Distribution patterns of activity of glucose-6-phosphate dehydrogenase (G6PD;
Kinetic Parameters of G6PD and PGD
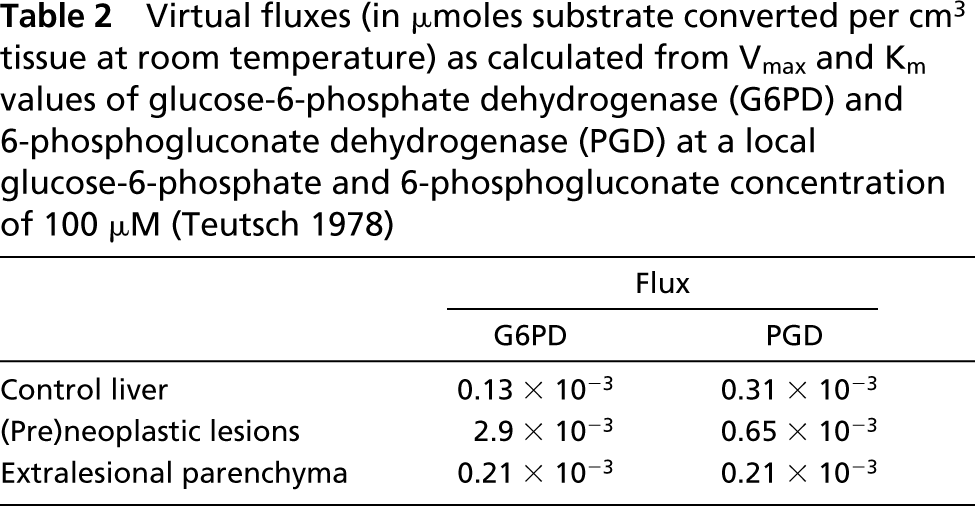
We found that amounts of formazan produced in the presence of both G6P and PG were similar to the sum of the amounts of formazan produced in the presence of G6P alone and PG alone. This means that PG produced in the G6PD reaction was hardly converted by PGD and that, in the presence of G6P, only G6PD was active. This is in agreement with previous findings of Jonges and Van Noorden (1989). Vmax values of G6PD and PGD determined in control rat livers and livers of DENA-treated rats are shown in Table 1. In (pre)neoplastic lesions in livers of rats treated with DENA, Vmax values of G6PD were 150-fold and of PGD fivefold higher than in control rat liver or extralesional parenchyma. Km values of G6PD in (pre)neoplastic lesions were 10 times higher and in extralesional parenchyma five times lower than in control liver parenchyma, whereas Km values of PGD were similar in all three liver tissue compartments. When virtual fluxes were calculated, assuming a substrate concentration of G6P and 6PG of 100 μM (Teutsch 1978), a 20-fold increased virtual flux through G6PD was observed in (pre)neoplastic lesions compared with control parenchyma, whereas the flux rate through PGD was increased only twofold (Table 2). The flux rate through G6PD in extralesional parenchyma was twofold higher than in normal liver parenchyma.
Immunohistochemical Localization of G6PD Protein
Distribution patterns of G6PD protein in control liver are shown in Figure 2C. A homogeneous distribution pattern of G6PD protein was found in liver parenchyma. Higher amounts of G6PD protein were observed in epithelial cells of bile ducts and blood vessel walls in portal tracts. Non-parenchymal sinusoidal cells could not be discriminated from liver parenchymal cells on the basis of G6PD protein content. Figure 2D shows that G6PD protein is homogeneously distributed in livers of DENA-treated rats with similar amounts in (pre)neoplastic lesions and extralesional liver parenchyma. Control incubations resulted in absence of staining in control livers and livers of DENA-treated rats.
Distribution patterns of glucose-6-phosphate dehydrogenase (G6PD) activity (
Vmax and Km values against glucose-6-phosphate and 6-phosphogluconate of glucose-6-phosphate dehydrogenase (G6PD) and phosphogluconate dehydrogenase (PGD), respectively, in control rat liver, (pre)neoplastic lesions, and extralesional parenchyma of livers of rats treated with diethylnitrosamine a
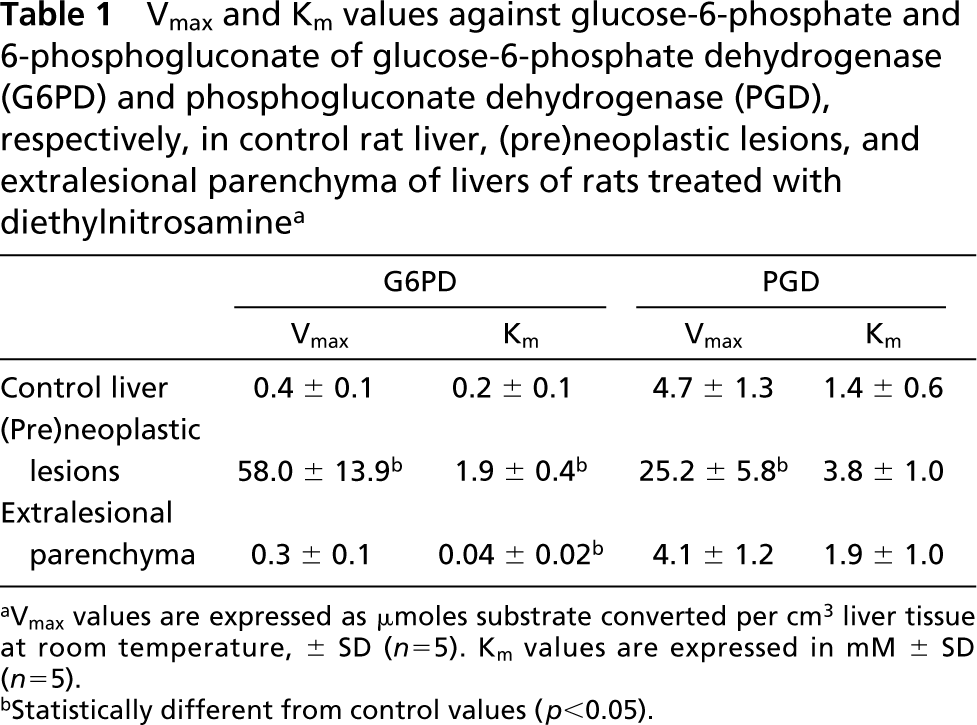
aVmax values are expressed as μmoles substrate converted per cm3 liver tissue at room temperature, ± SD (n=5). Km values are expressed in mM ± SD (n=5).
bStatistically different from control values (p<0.05).
In Situ Hybridization of G6PD mRNA
Figure 2E shows the localization of G6PD mRNA in control liver. mRNA levels were similar in all zones of liver parenchyma. G6PD mRNA was also present in epithelial cells of bile ducts and blood vessel walls in portal tracts. Again, non-parenchymal sinusoidal cells could not be discriminated from liver parenchyma on the basis of G6PD mRNA levels. In livers of DENA-treated rats, the distribution pattern of G6PD mRNA was similar to that of G6PD protein: differences between mRNA levels in (pre)neoplastic lesions or extralesional parenchyma were not observed (Figure 2F). Pretreatment of the sections with RNase completely abolished generation of final reaction product.
Virtual fluxes (in μmoles substrate converted per cm3 tissue at room temperature) as calculated from Vmax and Km values of glucose-6-phosphate dehydrogenase (G6PD) and 6-phosphogluconate dehydrogenase (PGD) at a local glucose-6-phosphate and 6-phosphogluconate concentration of 100 μM (Teutsch 1978)
Discussion
The major findings of the present study are that activity of G6PD and, to a lesser extent, of PGD in (pre)neoplastic lesions in rat livers after chemical induction by the carcinogen DENA was strongly upregulated. G6PD was activated at the post-translational level because G6PD protein and G6PD mRNA levels were similar in (pre)neoplastic lesions, extralesional liver parenchyma, and normal parenchyma. Thus far, induction of G6PD activity was demonstrated at the gene level, e.g., as a consequence of hormone treatment (Lombardi et al. 2000), oxidative stress (Díez-Fernández et al. 1996; Ursini et al. 1997; Tian et al. 1998,1999; Salvemini et al. 1999), treatment with NAD+ precursors (Yan et al. 1999), and in liver cirrhosis (Sanz et al. 1997), whereas post-transcriptional regulation was described to be caused by nutrition (Stabile et al. 1996,1998; Hodge and Salati 1997; Amir-Ahmady and Salati 2001). Rapid upregulation of G6PD activity at the post-translational level was demonstrated after treatment of animals or cells with hormones (Lombardi et al. 2000), GSH-depleting agents (Salvemini et al. 1999), and growth factors (Stanton et al. 1991). In our model, DENA was administered to rats to induce (pre)neoplasms in livers, and it has been established that an early effect of DENA is depletion of reduced glutathione (Mompon et al. 1987). A direct consequence of increased G6PD activity is regeneration of reduced glutathione. Therefore, it has been assumed that cells with increased G6PD activity are less sensitive to reactive oxygen species generated during oxidative burst induced by external stimuli (Martini and Ursini 1996; Salvemini et al. 1999; Tuttle et al. 2000). Recently, we demonstrated that (pre)neoplastic lesions induced by DENA contain large amounts of reduced glutathione based on staining with mercury orange (De Jong et al. 2001). Therefore, we conclude that treatment of rats with DENA upregulates activity of G6PD and, to a lesser extent, of PGD in (pre)neoplastic lesions in liver to provide reducing power for regeneration of reduced glutathione and other detoxification processes.
The role of G6PD in proliferation has been shown in studies using the non-competitive G6PD inhibitor dehydroepiandrosterone. Proliferation of cancer cells was slowed down by the G6PD inhibitor (Pascale et al. 1995; Melvin et al. 1997; Raïs et al. 1999). Moreover, it was demonstrated that the majority of ribose recovered from the nucleic acids of tumor cells arrives directly or indirectly through the non-oxidative part of the pentose phosphate pathway controlled by transketolase activity (Raïs et al. 1999). Therefore, it seems unlikely that G6PD is important for the supply of riboses for proliferation of (pre)neoplastic cells. Again, the formation of NADPH may induce tumor growth by the influence of the redox state on transcription factors as proposed by Kuo et al. (2000).
Furthermore, we have shown in the present study that the higher G6PD activity in epithelial cells of bile ducts and blood vessel walls than in liver parenchyma was regulated at the pretranslational level because activity, protein, and mRNA of G6PD were all elevated in a similar way in these cells in comparison with liver parenchyma (Figure 2). In contrast, the high G6PD activity in Kupffer cells was not accompanied by higher levels of protein and mRNA of G6PD, suggesting upregulation of G6PD activity at the post-translational level (see also Griffini et al. 1996).
Post-translational regulation of G6PD activity in (pre)neoplastic lesions in livers of DENA-treated rats involved both Vmax and Km values (Table 1). Upregulation of G6PD activity, but not of PGD activity, by changes in its kinetic parameters has been found previously in livers of methylcholantrene- and phenobarbital-treated rats (Jonges et al. 1995) and in hepatocellular carcinoma of flatfish flounder caught in polluted areas (Van Noorden et al. 1997). High Km values of G6PD have been found by Swezey and Epel (1986) in unfertilized oocytes of sea urchin eggs due to tight binding of the enzyme to structural elements, whereas detachment of G6PD from structural elements on fertilization induced an immediate and significant lowering of the Km and an elevated Vmax. Recently, we demonstrated that G6PD activity is localized at ribosomes of granular endoplasmic reticulum, in the cytoplasm, and in peroxisomes of liver parenchymal cells (Frederiks and Vreeling-Sindelárová 2001). It can be hypothesized that binding of G6PD to structural elements in (pre)neoplastic cells has diminished. Electron microscopic localization of G6PD activity in (pre)neoplastic lesions and extralesional parenchyma in livers of DENA-treated rats is now under investigation. Another possible explanation for post-translational regulation of G6PD activity is the finding of Ozols (1993) that the enzyme is synthetized in a glycosylated form, which is less active, and that the enzyme becomes activated by removal of oligosaccharide groups. This hypothesis also needs further study.
In conclusion, the consequences of the distinct post-translational upregulation of G6PD and slightly increased activity of PGD in (pre)neoplastic lesions in livers of DENA-treated rats are mainly increased production of NADPH as a reductive power in the cytoplasm.
Footnotes
Acknowledgements
We are grateful to Dr C.-G. Wu for providing the rat specimens, Mr J. Peeterse for photographic work, and Ms T.M.S. Pierik for preparation of the manuscript.