
Abstract
Semiconductor nanocrystals (Quantum dots, Qdots) have recently been used in biological research, because they do not fade on exposure to light, and they enable us to obtain multicolor imaging because of a narrow emission peak that can be excited via a single wavelength of light. There have been no reports of simultaneous localization of mRNA and protein using Qdots. We successfully applied these advantages of Qdot and confocal laser scanning microscopy (CLSM) to three-dimensional images of the intracellular localization of growth hormone and prolactin and to their mRNA. In situ hybridization and immunohistochemistry using Qdots combined with CLSM can optimally illustrate the relationship between protein and mRNA simultaneously in three dimensions. Such an approach enables us to visualize functional images of proteins in relation with mRNA synthesis and localization.
Keywords
E
Confocal laser scanning microscopy (CLSM) can facilitate the intracellular identification of subcellular organelles, mRNA, and protein (Itoh et al. 1997) by using nonfluorescent signals, such as horseradish peroxidase (HRP) and diaminobenzidine (DAB) (Robinson and Batten 1989; Itoh et al. 1992b). CLSM combined with computed imaging analysis enables us to observe these structures three-dimensionally in routinely processed light microscopic specimens (Arndt-Jovin et al. 1985, 1990; White et al. 1987; Takamatsu and Fujita 1988; Tao et al. 1988; Hozak et al. 1989; Robinson and Batten 1989; Bauman et al. 1990; Michel and Parsons 1990; Itoh et al. 1992a, b, 1997, 2001).
Meanwhile, semiconductor nanocrystals (Quantum dots, Qdots) have been developed that do not fade on exposure to light and enable us to obtain multicolor images because of a narrow emission peak that can be excited via a single wavelength of light (Bruchez et al. 1998; Wang et al. 2001). Qdots have recently been used in biological research. They have been shown to detect immunohistochemical signals and signals of fluorescence in situ hybridization (Han et al. 2001; Pathak et al. 2001; Chan et al. 2002; Gao et al. 2002; Gao and Nie 2003; Xiao and Barker 2004). However, there have been no reports of the localization of mRNA and protein simultaneously using Qdots. We successfully applied the previously mentioned advantages of Qdots and CLSM to obtain three-dimensional images of the intracellular localization of mRNA and protein. In this article, we describe our new technique of three-dimensional imaging and discuss the advantages of this method as compared with the EM-ISH method and the combined EM-ISH and IHC method.
Materials and Methods
Tissue Preparation
Male and female Wistar-Imamichi rats (8 weeks from birth, body weight ranging from 240 to 330 g, purchased from Charles River Japan Inc.; Yokohama, Japan) were studied. Male rats were used to study the intracellular localization of GH mRNA and GH protein. Female rats were treated intramuscularly with 5 mg estradiol dipropionate (E2 depot: Ovahormon Depot; Teikoku Zoki Co. Ltd., Tokyo, Japan), and, after 4 weeks, were again injected with 5 mg estradiol dipropionate. Three weeks after the second injection, the female rats were sacrificed and used to study the intracellular localization of PRL mRNA and PRL protein. The pituitary glands were removed, and the anterior lobes were immediately fixed overnight at 4C in 4% paraformaldehyde dissolved in 0.01 M phosphate buffered saline (PBS), pH 7.4. After immersion in graded concentrations of sucrose dissolved in PBS at 4C (10% for 1 hr, 15% for 2 hr, 20% for 4 hr), the tissues were embedded in Optimal Cutting Temperature compound (Tissue-Tek; Miles Laboratories Inc, Elkhart, IN).
RNase-free solutions treated with 0.02% diethylpyrocarbonate were used routinely, and gloves were used when handling all the tissue specimens and glass slides.
Biotinylation of Synthesized Oligonucleotide Probes for ISH
The sequence of the oligonucleotide probe for rat GH mRNA is 5′-dATC GCT GCG CAT GTT GGC GTC; sequence of the oligonucleotide probe for rat PRL mRNA is 5′-dGGC TTG CTC CTT GTC TTC AGG (Lloyd et al. 1991). The antisense, sense, and scramble oligonucleotide probes were synthesized with a DNA synthesizer (Applied Biosystems model 392; Applied Biosystems, Foster City, CA) and biotinylated by 3′-end labeling method using ENZO's terminal labeling kit (ENZO Diagnostics Inc; Farmingdale, NY), according to the manufacturer's protocol. The specificities of the biotinylated probes for both hormone mRNAs were confirmed by Northern blot hybridization using total RNA extracted from normal male Wistar-Imamichi rat pituitary glands (Matsuno et al. 1994a, b).
Combined ISH and IHC Using HRP-DAB for the Detection of mRNA and Qdot for the Detection of Protein
Six-μm-thick tissue specimens were mounted on 3-amino-propylmethoxysilane-coated slides. After air drying for 1 hr, tissue sections were washed with PBS for 15 min. Subsequently, they were treated with 0.1 μ/ml proteinase K at 37C for 30 min, followed by treatment for 10 min with 0.25% acetic anhydride in 0.1 M triethanolamine. After this, the slides were washed in 2x sodium chloride sodium citrate (SSC) at room temperature for 3 min and then prehybridized at 37C for 30 min. The prehybridization solution consists of 10% dextran sulfate, 3x SSC, 1x Denhardt's solution (0.02% Ficoll/0.02% bovine serum albumin (BSA)/0.02% polyvinylpyrrolidone), 100 μg/ml salmon sperm DNA, 125 μg/ml yeast tRNA, 10 μg/ml polyadenylic-cytidylic acid, 1 mg/ml sodium pyrophosphate pH 7.4, and 50% formamide. The biotinylated probe for rat GH or PRL mRNA with the concentration of 0.1 ng/μl was diluted with this solution, and hybridization was carried out overnight at 37C. After hybridization, the slides were washed at room temperature with 2x SSC, 1x SSC, and then 0.5x SSC for 15 min each. The hybridization signals were detected with streptavidinbiotin-horseradish peroxidase (ABC-HRP) for 30 min, using Vectastain's ABC kit (Vector Laboratories Inc.; Burlingame, CA), and thereafter developed with DAB and 0.017% H2O2 for 5 min. The slides were washed in PBS, and immunohistochemical staining for rat GH or PRL was carried out for 1 hr at room temperature. The antibodies used were anti-rat GH antibody (rabbit, polyclonal, 1:400 diluted in BSA-PBS, from Biogenesis, Ltd., Poole, Dorset, UK), or anti-rat PRL antibody (rabbit, polyclonal, diluted 1:100 with PBS, supplied by the National Institute of Diabetes and Digestive and Kidney Diseases, Bethesda, MD). The slides were washed in PBS, and Qdot 655 conjugated with anti-rabbit IgG (Quantum Dot Corp.; Hayward, CA) was applied as the second antibody for 30 min at room temperature. The slides were washed in PBS, and nuclear staining was carried out with methyl green.
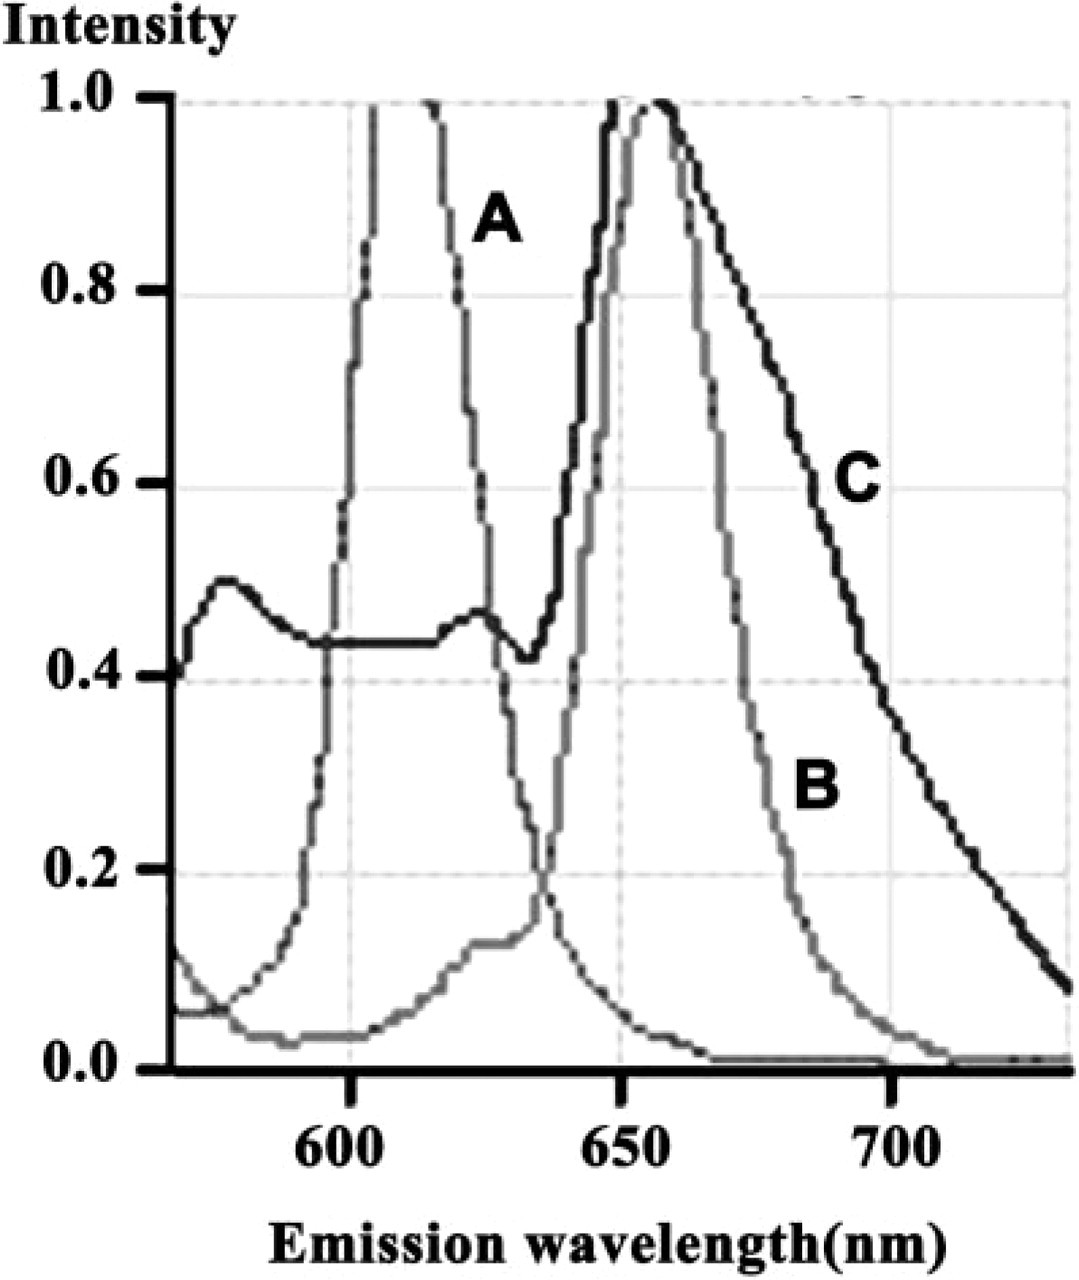
An excitation light of 488 nm evoked a specific emission curve for Qdot 605 (
The negative control experiments for ISH included hybridization studies with probes of sense or scramble sequence, as well as studies without probes. The negative control experiments for IHC involved the substitution of normal rabbit immunoglobulin fraction (DAKO; Carpinteria, CA) for primary antibodies.
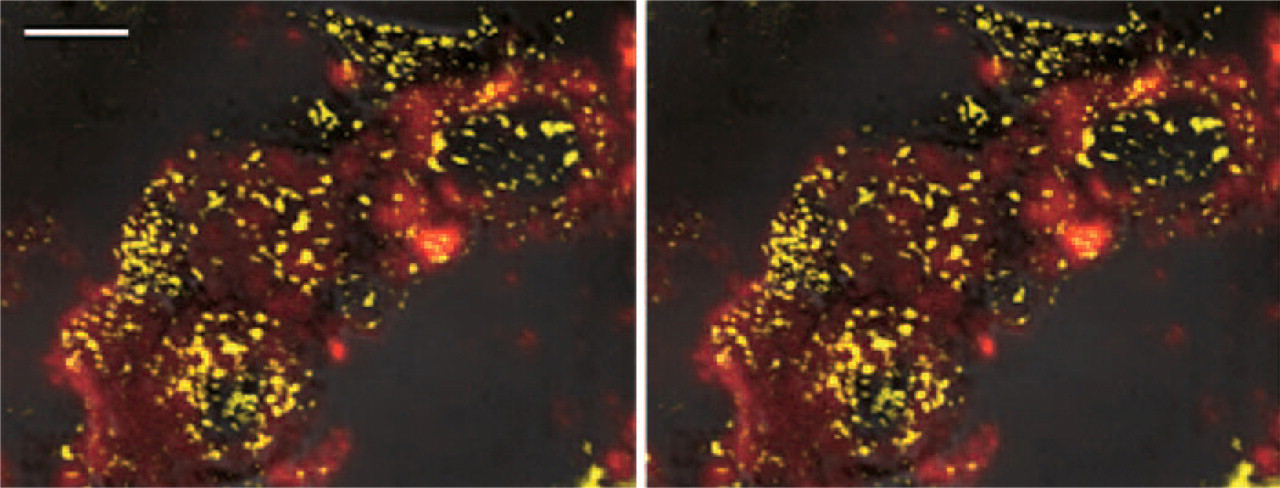
With the CLSM reflection mode, GH mRNA was observed as a DAB signal (yellow); with the confocal mode, GH protein was observed as a 655-nm emission signal using Qdot 655 (red). Stereo images; bar = 5 μm.
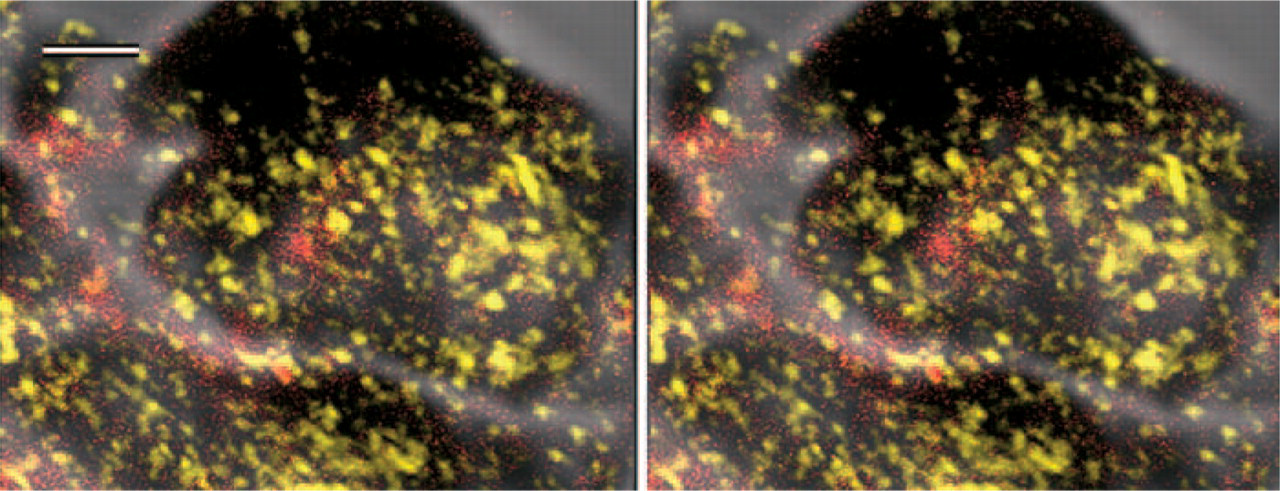
With the CLSM reflection mode, PRL mRNA was observed as a DAB signal (yellow); with the confocal mode, PRL protein was observed as a 655-nm emission signal using Qdot 655 (red). Stereo images; bar = 2 μm.
Combined ISH and IHC Using Qdots for the Detection of mRNA and Protein
Six-μm-thick tissue specimens were mounted on 3-amino-propylmethoxysilane-coated slides. After air drying for 1 hr, tissue sections were washed with PBS for 15 min. Subsequently, they were treated with 0.1 μg/ml proteinase K at 37C for 30 min, followed by treatment with 0.25% acetic anhydride in 0.1 M triethanolamine for 10 min. The slides were washed in 2x SSC at room temperature for 3 min and then prehybridized at 37°C for 30 min. The biotinylated probe for rat GH or PRL mRNA with the concentration of 0.1 ng/μl was diluted with the prehybridization solution and hybridization was carried out overnight at 37C. After hybridization, the slides were washed with 2x SSC, 1x SSC, and then 0.5x SSC for 15 min each at room temperature. Then the slides were washed in PBS, and immunohistochemical staining for rat GH or PRL was carried out for 1 hr at room temperature. The antibodies used were anti-rat GH antibody or anti-rat PRL antibody, as described in the previous section. The slides were washed in PBS, and Qdot 655 conjugated with anti-rabbit IgG and Qdot 605 conjugated with streptavidin (Quantum Dot Corp.; Hayward, CA) were applied for 30 min at room temperature. Qdot 655 conjugated with anti-rabbit IgG was used for the detection of GH or PRL protein, and Qdot 605 conjugated with streptavidin was used for the detection of GH or PRL mRNA. The slides were washed in PBS, and nuclear staining was carried out with methyl green.
The negative control experiments for ISH included hybridization studies with probes of sense or scramble sequence, as well as studies without probes. The negative control experiments for IHC involved the substitution of normal rabbit immunoglobulin fraction for primary antibodies.
Detection of Emission Signals of Qdot 605 and 655
An excitation light of 488 nm evoked a specific emission curve for Qdot 605, Qdot 655, and methyl green (Figure 1). Signals that had emission curves equal to these standards were detected under CLSM and were displayed in the same image.
Results
Combined ISH and IHC Using HRP-DAB for the Detection of mRNA and Qdot for the Detection of Protein
Hybridization signals for rat GH mRNA were demonstrated with light microscopy using ABC-HRP. With the CLSM reflection mode, GH mRNA was observed as a DAB signal, and with the confocal mode, GH protein was observed as a 655-nm emission signal (Figure 2). When GH mRNA and protein were located in the same or adjacent places, their signals were detected in the mixed color image (Figure 2).
Similarly, hybridization signals for rat PRL mRNA were demonstrated with light microscopy using ABC-HRP. With the CLSM reflection mode, PRL mRNA was observed as a DAB signal, and with the confocal mode, PRL protein was observed as a 655-nm emission signal (Figure 3). When PRL mRNA and protein were located in the same or adjacent places, their signals were detected in the mixed color image (Figure 3).
Compared with IHC using conventional fluorophores, such as fluorescein isothiocyanate (FITC) and Texas Red, for the detection of proteins, Qdots had no fading on exposure to light.
Combined ISH and IHC Using Qdots for the Detection of mRNA and Protein
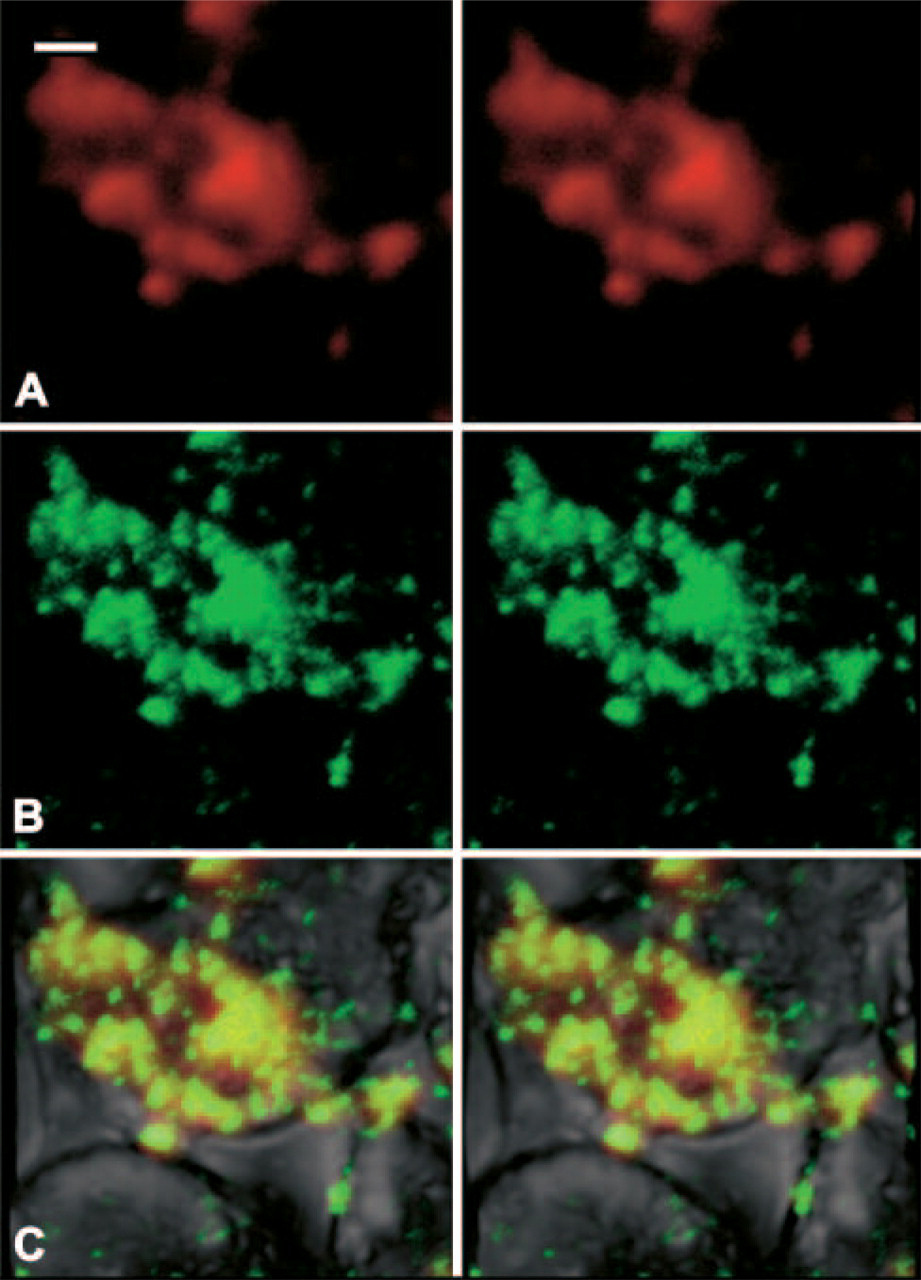
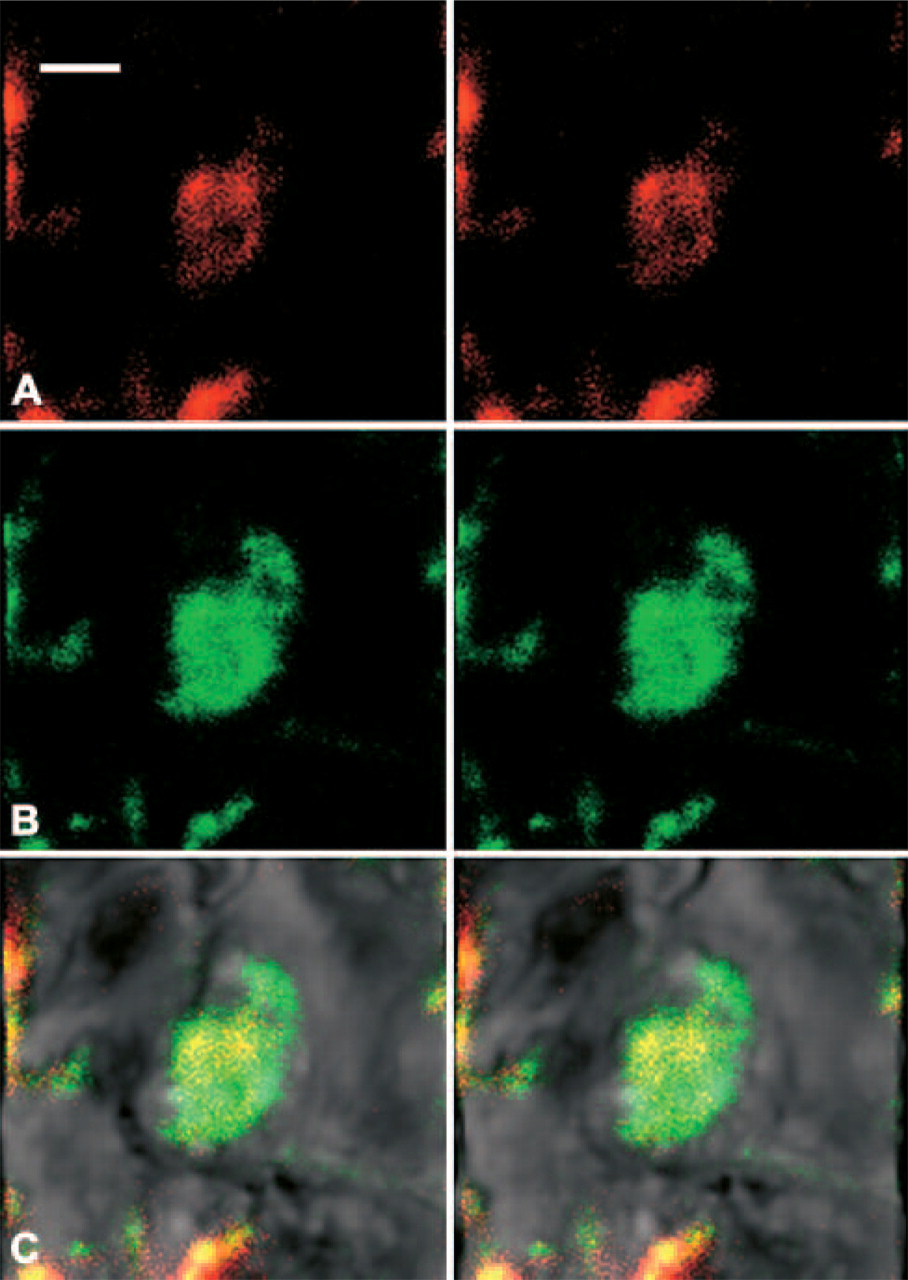
With the confocal mode, GH protein was observed as a 655-nm emission signal using Qdot 655 (Figure 4A), and GH mRNA was observed as a 605-nm emission signal using Qdot 605 (Figure 4B). Merged images of both signals revealed that GH mRNA and protein were located either in the same or adjacent places. Their signals were detected in the mixed color image (Figure 4B).
With the confocal mode, PRL protein was observed as a 655-nm emission signal using Qdot 655 (Figure 5A), and PRL mRNA was observed as a 605-nm emission signal using Qdot 605 (Figure 5B). Merged images of both signals revealed that when PRL mRNA and protein were located either in the same or adjacent places, their signals were detected in the mixed color image (Figure 5C).
With the confocal mode, GH protein was observed as a 655-nm emission signal using Qdot 655 (
Negative control experiments, namely ISH with sense probe and IHC with substitution of normal rabbit immunoglobulin fraction for primary antibody, showed only signals for methyl green (Figure 6).
The GH signals were more abundant than those of PRL. GH was localized in the vicinity of GH mRNA, and thus abundant combined signals were noted. On the other hand, PRL, whose intracellular signals were more sparse than those of GH, had less of an association with PRL mRNA. These findings were more prominently shown in the combined ISH and IHC method using Qdots for the detection of mRNA and protein than in the combined ISH and IHC method using HRP-DAB for the detection of mRNA and Qdot for the detection of protein.
With the confocal mode, PRL protein was observed as a 655-nm emission signal using Qdot 655 (
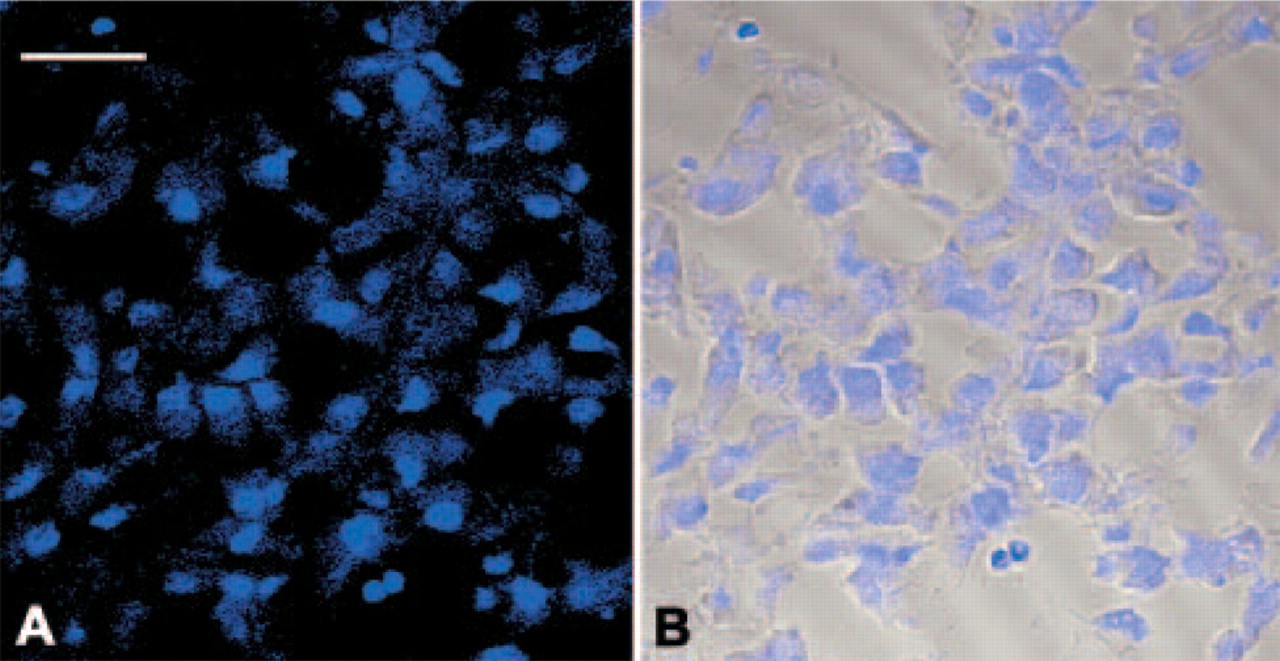
Negative control experiments, namely ISH with sense probe and IHC with substitution of normal rabbit immunoglobulin fraction for primary antibody, showed only signals for methyl green. (Left: confocal image; right: combined image of transmittance and confocal images; bar = 20 μm.)
Discussion
Qdots are nanometer-scale particles that absorb light, then quickly reemit the light in a different color. Although other organic and inorganic materials exhibit this phenomenon as fluorescence, Qdots are bright and non-photobleaching. Also, Qdots have narrow, symmetric emission spectra with multiple resolvable colors that can be excited simultaneously using a single excitation wavelength. The most striking property is that the color of Qdots can be tuned to any chosen wavelength by simply changing their size. This property enables multiple labeling of subcellular molecules. Even though they may be larger molecules than conventional fluorophores, such as FITC and Texas Red, Qdots have more stable signals and do not fade on exposure to light. Xiao and Barker (2004) stated that significantly less signal loss was observed for Qdot probes than for FITC or Texas Red probes). Furthermore, they found that Qdot signals were more than 11-fold stronger than those of fluorescein. Photostability and prominent signal intensity give Qdots a very useful advantage over conventional fluorophores in histochemical studies of intracellular molecules.
Using these Qdot properties, we successfully visualized the intracellular localization of pituitary hormones (GH and PRL) and their mRNA by using different sized Qdots with CLSM. This analysis has several merits in that it can be used with light microscopic specimens, it can be observed in any chosen cells and any chosen depth of the section, and it can reconstruct three-dimensional images. Immunohistochemical studies using multicolored images of Qdots have been demonstrated by the manufacturer; however, there have been no reports that have applied Qdot imaging to the detection of mRNA ISH signals. Thus this is the first description of three-dimensional imaging of the intracellular localization of GH and PRL and their mRNA using Qdots with CLSM.
As we reported previously, EM-ISH is essential for the visualization of the intracellular distribution, which then leads to an understanding of its role in protein synthesis. The EM-ISH method, which includes the combined use of IHC and the nonradioisotopic preembedding ISH method, is very useful in the study of the spatial relationship between mRNA and the encoded protein. The EM-ISH method can provide higher resolution images of subcellular organelles than the ISH and IHC using Qdots. However, EM-ISH and IHC has some limitations: it can be used only with EM specimens, it can observe only a small number of cells, and it provides only a two-dimensional image of the mRNA and protein.
However, intracellular organelles, such as the rough endoplasmic reticulum and secretory granule, have a three-dimensional structure and localization. Three-dimensional images of the intracellular localization of the mRNA and the encoded protein can be obtained by using combined ISH and IHC with Qdots for the detection of the mRNA and protein. These images may therefore enhance our three-dimensional understanding of the localization of the mRNA and the secreted protein. In our study, GH was more abundant than PRL, and GH was localized in the vicinity of GH mRNA, whereas PRL had less of an association with PRL mRNA. These findings could suggest that PRL is being transported to the plasma membrane and secreted more rapidly than GH. These observations were more prominently shown using the combined ISH and IHC with Qdots to detect the mRNA and protein than using the combined ISH and IHC with HRP-DAB to detect the mRNA and Qdot to detect the protein.
By using the ISH and IHC with Qdots and CLSM, one can optimize the visualization of the relationship between the protein and the mRNA simultaneously and three dimensionally. It may enable us to visualize functional images of proteins as they relate to mRNA synthesis and localization.