
Abstract
There has been considerable interest in the relationship between hormone-secreting endocrine cells and their microvessels in human pituitary gland. However, microcirculatory networks have rarely been studied in three dimensions (3D). This study was designed to visualize and to reveal the relationship between hormone-secreting endocrine cells and their microvessel environment in 3D, using rat pituitary glands under various (hyper/hypo) experimental conditions by confocal laser scanning microscopy (CLSM). Female adult Wistar rats were used after bilateral adrenalectomy or ACTH administration for 2 weeks. Clear 3D reconstructed images of ACTH cells, the microvessel network and counterstained nuclei were obtained at a maximal focus depth of 1 mm by CLSM without any background noise. In the hyperfunctional state, slender cytoplasmic processes of hypertrophic stellate ACTH cells frequently extended to the microvessels. In the hypofunctional state, ACTH cells appeared atrophic and round with scanty cytoplasm, and cytoplasmic adhesions to microvessel network patterns were inconspicuous. Therefore, 3D reconstructed imaging by CLSM is a useful technique with which to investigate the microvessel environment of hormone-secreting cells and has the potential to reveal dynamic hormone-secreting pathways.
Keywords
Much research has focused on the relation between hormone-secreting endocrine cells and their microvessels (Lakkakorpi et al. 1994; Rummelt et al. 1994). However, hormone-secretory pathways of endocrine cells and related microvessels have conventionally been analyzed in two dimensions. This study was designed to visualize the relationship between hormone secretion and microcirculatory patterns in 3D using rat pituitary glands under various (hyper/hypo) experimental conditions by confocal laser scanning microscopy (CLSM).
This study is particularly important in the endocrine system because small amounts of hormones must be secreted very efficiently into the vascular circulation, which is usually very rich in hormone-secreting organs. Previously, hormone-secreting endocrine cells and vasculature have been studied individually in light or electron microscopic thin sections.
For angiogenic analysis, several techniques for identifying the vasculature have been reported. These include vascular cast methods involving the intravascular injection of pigments (Strong 1964; Conradi et al. 1980; Elias and Weiner 1984; Kimura et al. 1990) or resin (Yoshida and Ikuta 1984), the methacrylate corrosion cast method (Nakamura and Masuda 1981; Bonner-Weir and Orci 1982), and staining methods utilizing tissue-specific reactions or markers of blood vessels, e.g., silver staining (Marin-Padilla 1985), enzyme histochemistry (Novikoff and Goldfischer 1961; Bell and Scarrow 1984), Ulex europaeus 1 (UEA-1) lectin staining (Holthöfer et al. 1982; Volker et al. 1994), three horseradish peroxidase-conjugated lectins (Minamikawa et al. 1987), and immunohistochemistry using antibodies specific to certain elements of the vascular endothelium (Hoyer et al. 1973; Jaffe et al. 1973; Stemerman et al. 1976; Ghandour et al. 1980; Auerbach et al. 1982) or to the basement membrane (Barsky et al. 1983).
However, these methods have various problems and limitations. Vascular cast methods can demonstrate the localization of lumina but not that of the vasculature itself, and the injection pressure usually must be higher than the physiological level. Therefore, such procedures are not suitable for accurate analysis of the distribution of minute amounts of blood vessels. The resin injection method necessitates dissolving all of the tissues surrounding the injection to allow the structure of the vascular cast to be visualized, thus making it impossible to observe the relationship between casts and tissues. The three horseradish peroxidase-conjugated lectin methods can identify the relationship between casts and tissues only two-dimensionally. The methacrylate corrosion cast method can reconstruct the relation in three dimensions using serial sections. Unfortunately, this method is troublesome in the making of serial sections and in serial observation and detection, and in the course of making these cast preparations the tissue containing the vessels is destroyed. To study the microvascular environment of the endocrine cells, three-dimensional (3D) analysis using thick sections is necessary, although few such analyses have been conducted. In theory, if it is possible to reconstruct the microcirculation in 3D by CLSM, it should also be possible to study the relationship between hormone-secreting endocrine cells and the microvessel environment.
The confocal laser scanning microscope is an exciting new apparatus that offers more powerful resolution than conventional light microscopes and high-performance in 3D optical sectioning without destruction of the tissue containing the vessels. CLSM can be used to fill the gap between light and electron microscopy (Nakane et al. 1994). Since CLSM combined with computed image analysis was introduced, its applications have been expanding at an astonishing rate. CLSM has enabled us to observe subcellular organelles of routinely processed light microscopic specimens not only two-dimensionally but also three-dimensionally by reconstruction (Itoh et al. 1992a,b, 1997). Compared with standard epifluorescence microscopy, CLSM optical sectioning minimizes flaring and optimizes the fluorescence signals. Images taken by CLSM can be digitized and made available for image analysis manipulation and computerassisted three-dimensional (3D) reconstruction (Takamatsu and Fujita 1988; Dirnagl et al. 1991; Turner et al. 1991; Wright and Schatten 1991; Murray 1992; Neri et al. 1992; Nakane et al. 1994; Volker et al. 1994; Itoh et al. 1997).
The current investigation disclosed clear-cut 3D images and a functional relationship between hormone-secreting endocrine cells and the microvessel environment in the hyper/hypo state and in normal control rat pituitary glands. Here we describe techniques to visualize the functional relations between hormone-secreting endocrine cells and the microvessel environment simultaneously in 3D by CLSM using the FITC-conjugated gelatin injection method and immunofluorescence-labeled antibody.
Materials and Methods
Injection of FITC-Gelatin Conjugate
The use of fluorescent dye conjugated-polypeptide was introduced by Strottmann et al. (1983) on acrylamide slab gels. The high molecular weight fluorescein-labeled dextran methods were first introduced by D'Amato et al (1993). We combined and modified these methods.
Fluorescein 5-isothiocyanate (FITC) was obtained from Dojindo (Kumamoto, Japan) and gelatin from Sigma Chemical (St Louis, MO). FITC was conjugated to gelatin by a brief reaction at 37C and pH.11. Typically, 10–50 mg of FITC was dissolved in 1 ml dimethylsulfoxide (DMSO; Sigma), pH.11. A 20% gelatin solution made with distilled water, pH 11, and DMSO containing FITC were mixed for conjugation at 37C overnight. Then FITC-conjugated gelatin was dialyzed in 0.01 M PBS, pH 7.4, at 37C in the dark for 1 week. Aliquots of the dialyzed FITC-conjugated gelatin in a total volume of 200 ml were injected into rats.
Tissue Preparation
Female adult Wistar rats were used after bilateral adrenalectomy or ACTH administration (0.5 mg IM /rat/day) for 2 weeks. Non-treated rats served as a control.
The abdominal and chest walls of the animals were opened under diethyl ether inhalation anesthesia. To demonstrate microvessels, 200 ml of dialyzed FITC (30 mg/ml)-conjugated gelatin solution was injected into the left ventricle of the heart, cutting off the right atrium (Figure 1). After complete perfusion over approximately 3–5 min, the animals were fixed in cold 4% paraformaldehyde (PFA; Wako Pure Chemical, Osaka, Japan) added to 15% picric acid (Wako) solution (0C) over approximately 25–30 min. Then wet pituitary glands were resected and immediately fixed overnight in graded cold PFA (0.5–8%) containing 15% picric acid overnight (4C).
For simultaneous visualization of microvessel networks and immunohistochemical localization of ACTH and growth hormone (GH), the pituitary tissues were cut into 2–3-mm-thick blocks, placed on 50 × 70-mm coverslips (Matsunami Glass INO; Osaka, Japan), and mounted in 0.05 M Tris-HCl buffer, 1,4-diazabicyclo[2,2,2]octane (DABCO; Wako). The pituitary tissue specimens were used for frozen sections. These frozen sections were obtained from tissues that had been fixed overnight in 4% PFA dissolved in 0.01 M PBS, pH 7.4, immersed in graded concentrations of sucrose in PBS (10% for 1 hr, 15% for 2 hr, and 20% for 4 hr), embedded in OCT compound (Tissue-Tek; Miles Laboratories, Elkhart, IN), and stored at −80C until use. Thirty-μm-thick frozen sections were mounted on 3-amino-propylmethoxyilane-coated slides.
(
Immunohistochemistry
An immunohistochemical analysis of hormone-secreting endothelial cells was performed by the use of indirect immunofluorescent and an immunoperoxidase labeled antibody, as described by Nakane (1975).
The first antibody employed was a rabbit polyclonal anti-ACTH antibody (1:200; DAKO, Santa Barbara, CA) or a rabbit polyclonal anti-GH antibody (1:200; DAKO). The second antibody employed was tetramethylrhodamine isothiocyanate (TRITC) conjugated to swine anti-rabbit immunoglobulins (1:10; DAKO) or horseradish peroxidase (HRP) conjugated to sheep anti-mouse IgG (1:50; Amersham, Poole, UK). The peroxidase coloring reaction was performed with 3–3′ diaminobenzidine (DAB; Dojindo). The nuclei were then counterstained with 5% methyl green (MG) buffered by 0.1 mol/liter Veronal acetate at pH.4.0. (Chroma; Köngen, Norway).
Confocal Laser Scanning Microscopy System
CLSM (LSM-410; Carl Zeiss, Jena, Germany) was employed on thick sections (1–2 mm) to elucidate the relationship between hormone-secreting endothelial cells and the microvessel network by stereo pair, colored depth focus, projection, and 3D cutting at reconstruction modes. The system included a 488-nm Argon laser (for FITC) and/or a 543-nm helium-neon laser (for TRITC and DAB). Optical fluorescence signals of microvessel network patterns labeled by FITC were observed using a dichroic beam splitter (NT 80/20/543; Carl Zeiss) and emission filter (BP510-525; Carl Zeiss). Optical fluorescence signals of ACTH-secreting cells labeled with TRITC were observed using a dichroic beam splitter (NT 80/20/543; Carl Zeiss) and emission filter (LP570; Carl Zeiss). Optical reflectance signals of GH cells labeled by HRP were observed using a dichroic beam splitter (NT 80/20/543; Carl Zeiss) and no emission filter. Double- or triple-labeled volumetric data sets of these images taken with confocal laser scanning microscopy can be digitized and made susceptible to image analysis manipulation and computer-assisted 3D reconstructions using LSM software version 3.98 (Carl Zeiss).
The optical tomographic imaging (Z-images) for 3D reconstruction of the hormone-secreting endocrine cells and their microvessels was done with a plan-apochromat (X63, oil immersion, NA 1.4; Carl Zeiss) and a plan-neofluar (X10, NA 0.30; X20, NA 0.50; Carl Zeiss) objective lens. Z-directional movement for the optical sectioning of entire specimens was controlled by a stepping motor unit for axial scanning at 0.5–20-μm focus steps. The image resolution was 512 × 512 and/or 1024 × 1024 pixels (8 bits, 256 gray levels).
After computer-assisted 3D imaging of the hormone-secreting endocrine cells and their microvessels using the LSM systems, the images were stored on hard disk and/or magnetic optical disk EDM-230C (SONY; Tokyo, Japan) and printed with a Pictrostat digital 400 (Fuji Film; Tokyo, Japan).
Results
We were able to demonstrate the distribution of ACTH, GH (only in control rats), and microvessels in the hyper/hypo state in thick block specimens using a confocal laser scanning microscope in the fluorescent confocal mode. We used PFA- and picric acid-fixed wet block tissues and frozen sections to study the 3D relationships between hormone-secreting endocrine cells and the microcirculation because it was not possible to cut wet sections that were sufficiently thick to obtain a satisfactory 3D view of the microvessels.
Distribution of 2D ACTH Cells as Determined by Conventional Light Microscopy
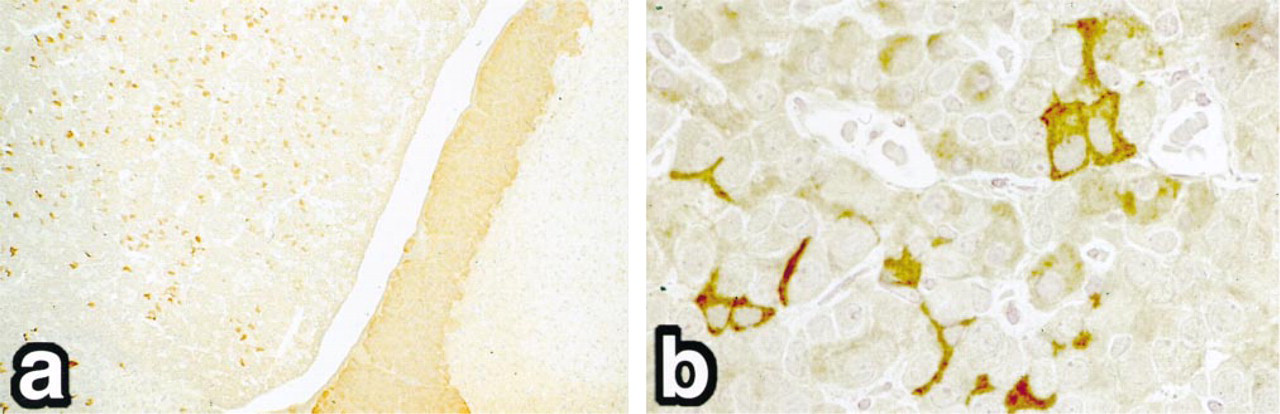
In non-treated control rat anterior pituitary gland, many stellate cells were positive for ACTH (Figures 1a and 1b). The intermediate lobe was diffusely positive for the peptide. No reaction was observed in the posterior lobe. Many cells in the anterior pituitary gland were positive for ACTH and were closely associated with capillaries in 2D observations.
Distribution of 3D Microvessels as Determined by Fluorescent CLSM
By CLSM, FITC fluorescence-conjugated to gelatin injected into the left ventricle of the heart was seen to enter the capillaries of the control rat pituitary glands (Figures 2a-2c). Clear, strong signals in microvessels were observed at sites similar to those seen at higher power by conventional epifluorescence microscopy (not shown).
The CLSM images obtained in the fluorescence confocal mode for which there were volumetric data sets for the microvessel network were analyzed. Straight vessels, arcs, branches, and loops were identifiable in three dimensions. Three-dimensional imaging demonstrated well-developed networks of capillaries in the anterior pituitary gland.
Immunohistochemical Localization of ACTH and GH in Non-treated Control Rats by CLSM
Figure 3 shows the results of a double labeling experiment on wet thick block specimens. This figure also shows, by double 3D imaging with the visualization of hormone-producing cells by TRITC- and/or HRPlabeled antibodies, the shape of ACTH and GH cells and their relationship to the surrounding capillaries (Figures 3a-3d). The lumina of the capillaries were labeled a yellowish green by FITC. ACTH (Figures 3a and 3b) and GH cells (Figures 3c and 3d) fluoresced red. Many stellate cells were positive for ACTH, and microvessels were clearly visible in the pituitary glands. In ACTH cells, cells were frequently attached to the capillaries and long cytoplasmic processes terminated at the capillaries (Figure 3a). A high-power view of the image in Figure 3a reveals more clearly the relationship between microvessel networks and ACTH-positive cells. The terminals of the ACTH processes and the capillary lumina are separated by approximately 600 nm. This suggests endothelial cells and basement membranes. The reaction products of ACTH appeared granular (Figure 3b). In contrast, GH cells were generally rounded and frequently lay in free spaces among the FITC fluorescence-labeled capillaries (Figure 3c). GH also appeared granular in the cytoplasm (Figure 3d).
DAB (osmium black) also gave reflectance signals at a wavelength of 543 nm. DAB labeling for GH was applied to the double 3D imaging with FITC fluorescence. The confocal laser scanning microscope detected fluorescence of FITC at a depth of focus of 2000 μm (Figure 2a) and fluorescence of TRITC and reflectance signals for DAB at 300 μm (Figures 3a and 3c).
Immunohistochemically stained thick microscopic tissue preparations were examined simultaneously for microvessel networks by CLSM. Then individual signals from the same dimension were detected by fluorescent CLSM.
Immunohistochemical Localization of ACTH in Adrenalectomy and ACTH Administration Rat Anterior Pituitary Gland by CLSM
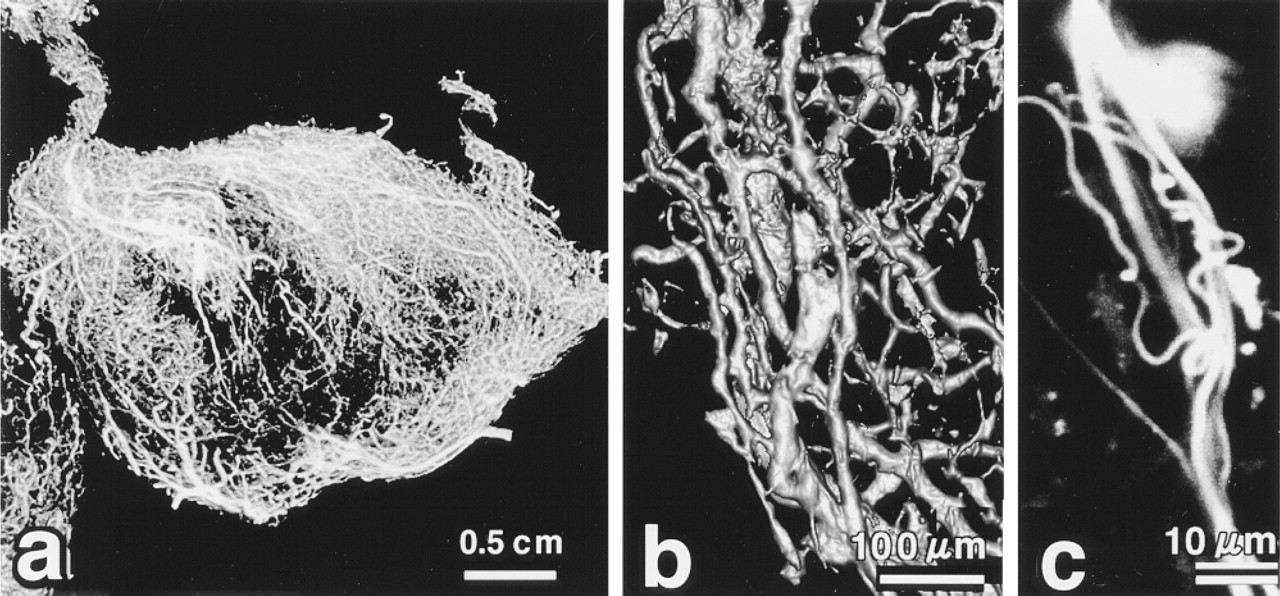
Three-dimensional depth projection reconstructed image of microvessels in normal pituitary glands. The microvessel networks are clearly visible at the maximal focus depth of 2000 μm. (
In the adrenalectomized rats, the anterior pituitary gland showed markedly increased numbers of ACTH-immunoreactive cells (Figure 4a). The positive cells revealed that ACTH immunoreactivity is closely associated with the microvasculature. At high power, the ACTH-positive cells appeared stellate and showed frequent slender cytoplasmic processes (Figure 4b). On the other hand, if the rats were given ACTH daily for 2 weeks, the ACTH-immunoreactive cells decreased in number and became atrophic (Figures 4c and 4d).
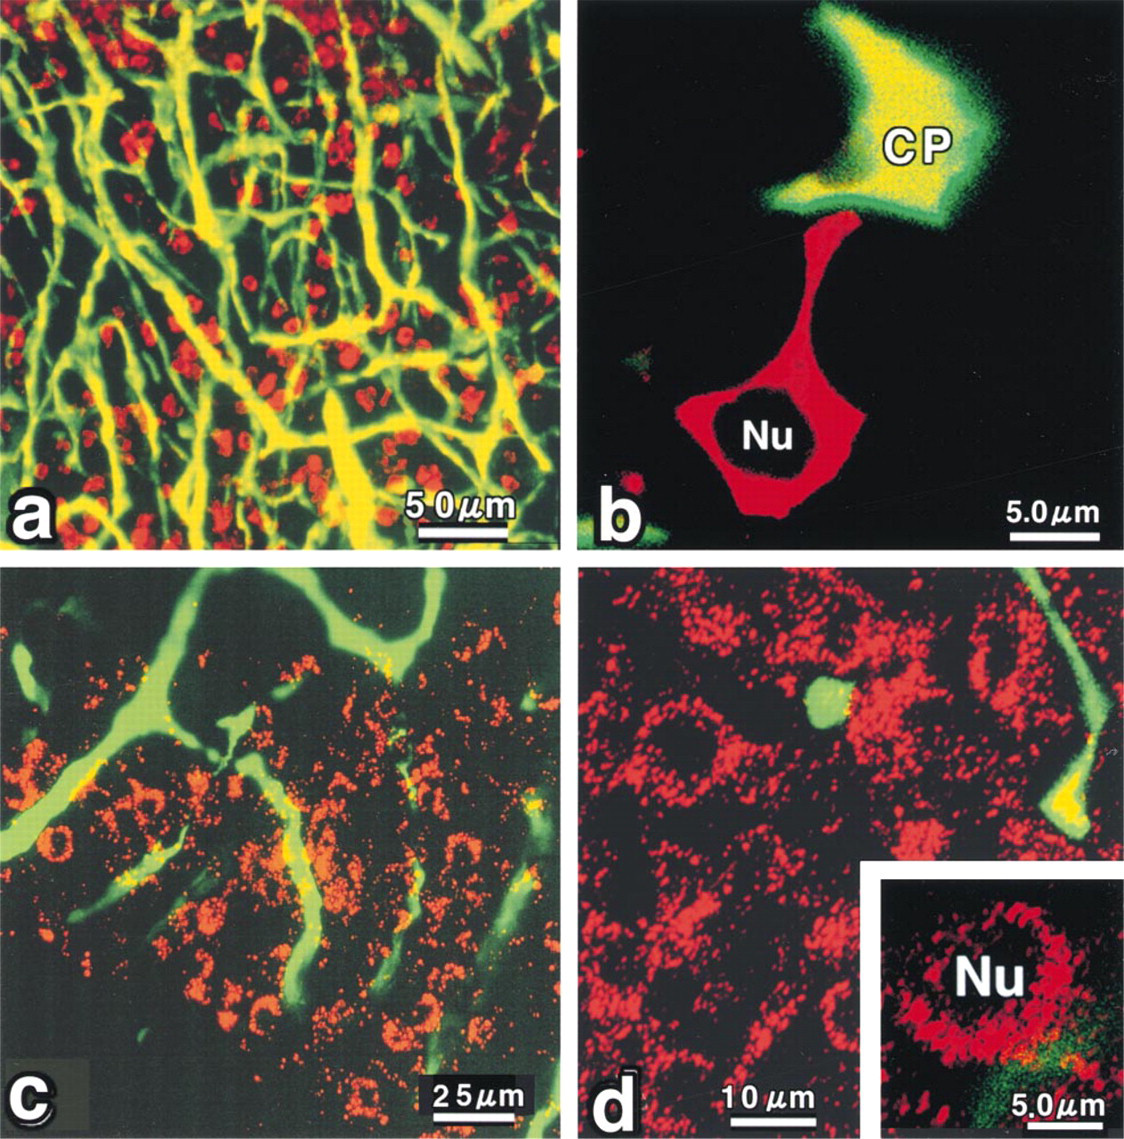
Three dimensional projection image of ACTH cells and combined signals of fluorescent (FITC) and non-fluorescent (DAB) probe in normal pituitary glands. Red: ACTH cells (α-ACTH-TRITC), fluorescence mode (
Discussion
Recently, there has been considerable interest in the relationship between the density of tumor blood vessels, as measured two-dimensionally from conventional glass microslide preparations, and the prognosis for several human cancers, including carcinoma of the breast, small-cell carcinoma of the lung, and prostate carcinoma. Although the density of tumor vascularization has been associated with the prognosis for human primary tumors, the density of tumor angiogenesis is not associated with the prognosis for human tumors in 2D.
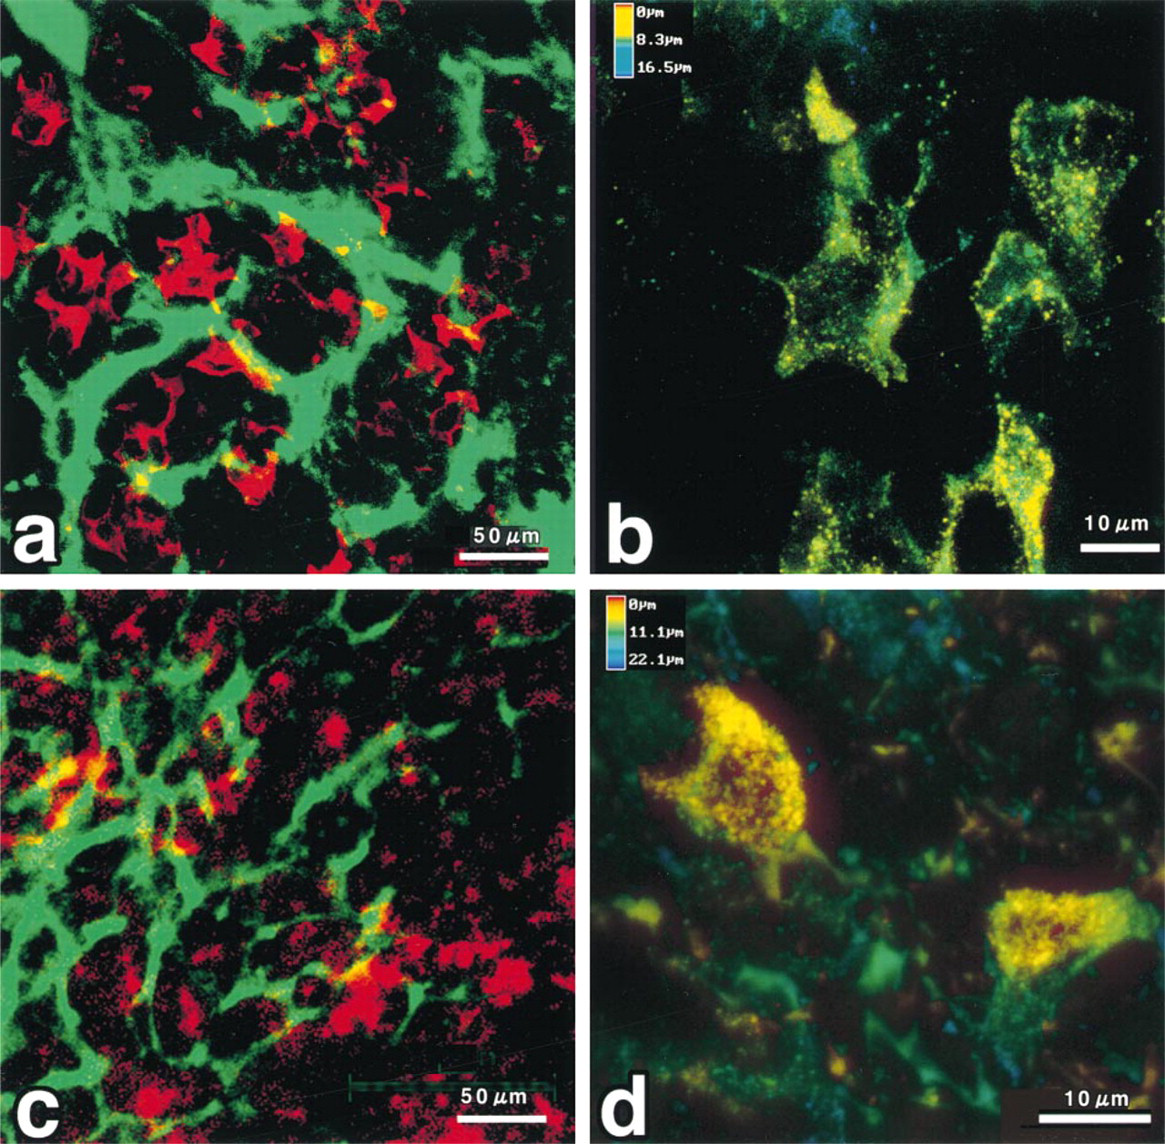
Three-dimensional reconstructed images for bilateral adrenalectomized and ACTH administered pituitary glans. (
Three-dimensional imaging by CLSM has clearly demonstrated well-developed capillary networks and a relationship with the hormone-secreting endocrine cells. In addition to normal pituitary vessels that form distinctive morphological patterns, straight vessels that parallel each other, parallel vessels that crosslink, arcs (incompletely closed loops), arcs with branching, closed loops, and networks of closed loops (Figures 2a and 2b) have been identified. The presence of networks of closed loops has been found to have the strongest association with hormone-secreting endocrine cells of any parameter, including cell shape, cell size, and cell type. The presence of parallel vessels with crosslinking is also strongly associated with the development or processing of hormone-secreting endocrine cells (Figure 3).
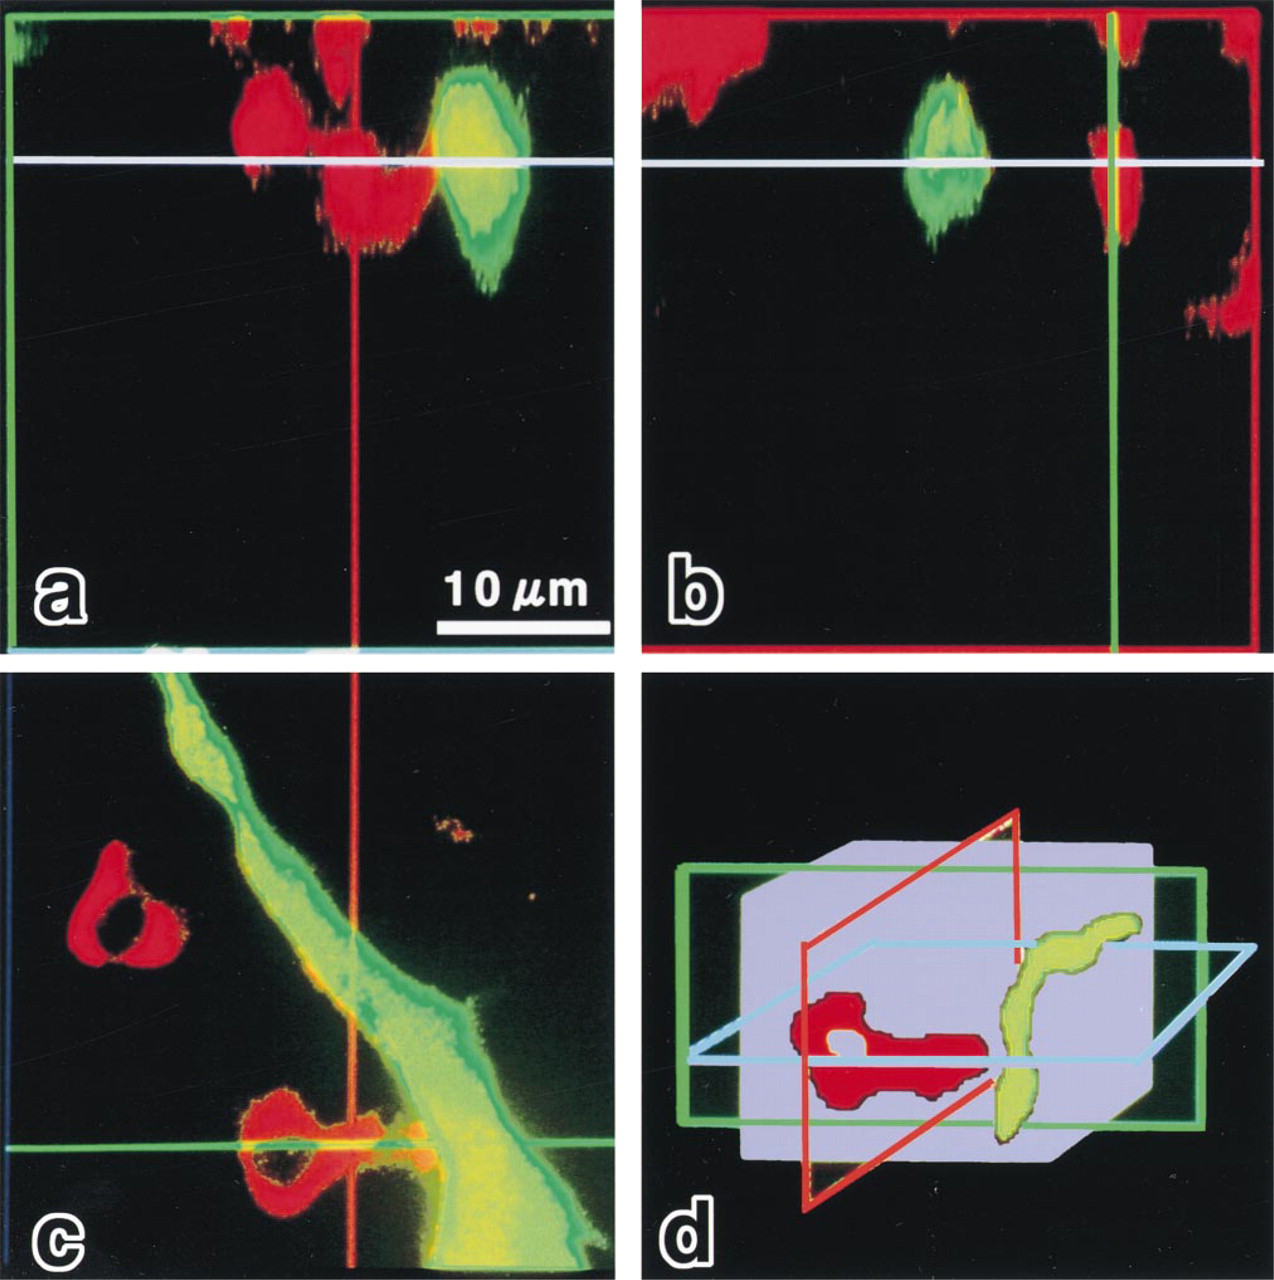
Orthogonal image of ACTH cells and the microvessel network in normal pituitary glands in 3D. (
The anterior pituitary cells showed dynamic alterations in immunoreactivity for ACTH. After adrenalectomy, the immunoreactive anterior pituitary cells markedly increased in number and were hypertrophic (Figures 4a and 4b). In contrast, after ACTH administration, the ACTH-immunoreactive cells decreased in number and were atrophic (Figures 4c and 4d).
This technique was introduced by Hashimoto and Kusakabe (1996) in the rat small intestine, liver, pituitary gland, and brain. The technique described here was designed to visualize the microcirculatory patterns in three dimensions and to provide a simultaneous 3D visualization of the microcirculation and hormone-secreting endocrine cells processing ACTH or GH by an FITC-conjugated gelatin injection method. ACTH and GH were used as the second antibodies in this study because these hormone-secreting pathways have been well defined by light and electron microscopy level in rat pituitary gland.
With this technique, the critical points for the demonstration of the capillaries seemed to lie in (a) warming of the FITC fluorescence-conjugated gelatin and (b) peristaltic infusion of the solution to prevent thrombotic occlusion of the capillaries. For demonstration of ACTH and GH, effusion fixation by picric acid paraformaldehyde solution (Zamboni) preserved antigenicity as well as cell shape and cytoplasmic structures.
The technique of combined double immunolabeling and/or histochemical labeling, CLSM, and computerassisted 3D-reconstructed analysis does have advantages. First, as mentioned above, each of the labels used was detectable to deep levels and was able to reveal the relationship between vessels and tissues in the pituitary gland. Second, unlike scanning electron microscopy by cast corrosion methods that make it impossible to observe the relationship between casts and tissues, this technique permits the 3D study of samples from low- to high-power magnification. The technique described in this report is most suitable for study of small lateral areas. To create a 3D-reconstructed image, one must overlap data not only along the X- and Y-axes but also along the Z-axis, a procedure that is tedious and requires extensive computer resources (Figure 5).
This is the first report on the technical aspects of 3D visualization of hormone-secreting endocrine cells and their capillary networks. By this 3D method, ACTH cells were clearly depicted as polygonal cells with long cytoplasmic processes, which terminate on the capillaries. This shape of ACTH cells has frequently been described as unique and characteristic. GH cells were round and were located among the capillaries. It should be emphasized that this method not only elucidates the shape and relationship to the capillaries but also depicts a granular localization on CLSM, suggestive of secretory granules.
It was also demonstrated that DAB (osmium black) (Itoh et al. 1997) has reflectance and is suitable for this 3D visualization. DAB is relatively small and so can reveal finer subcellular structures.
This technique has applicability to research on the endocrine-vascular environment and angiogenesis. Its application to tumor angiogenesis is under investigation (Itoh et al. in press).
Our experimental study to simultaneously visualize the immunohistochemical localization of ACTH and GH and the microvessel network using CLSM with the fluorescence probes FITC, TRITC, and DAB revealed a clear characteristic intracellular localization of ACTH and GH in the rat anterior pituitary glands on thick specimens. These images showed both the immunohistochemical localization of ACTH and GH and the pattern of the microvessel network.
With this technique, FITC injection combined with immunohistochemistry simultaneously revealed differences in the localization or distribution. Furthermore, this method fills the gap between image diagnosis (e.g., MRI), and light microscopy. Permanently preserved sections enable repeated or retrospective examinations and enable observation of organs in vivo.
This method clearly showed the relationship between the microvasculature and hormone-secreting endocrine cells on thick light microscopic specimens. It also permitted the recognition of subcellular sites of the microvasculature and hormone-secreting endocrine cells, obviating most of the cumbersome procedures associated with pathological diagnosis in tissues containing tumor microvessels.