
Abstract
Articular cartilage is a heterogeneous tissue, with cell density and organization varying with depth from the surface. The objectives of the present study were to establish a method for localizing individual cells in three-dimensional (3D) images of cartilage and quantifying depth-associated variation in cellularity and cell organization at different stages of growth. Accuracy of nucleus localization was high, with 99% sensitivity relative to manual localization. Cellularity (million cells per cm3) decreased from 290, 310, and 150 near the articular surface in fetal, calf, and adult samples, respectively, to 120, 110, and 50 at a depth of 1.0 mm. The distance/angle to the nearest neighboring cell was 7.9 μm/31°, 7.1 μm/31°, and 9.1 μm/31° for cells at the articular surface of fetal, calf, and adult samples, respectively, and increased/decreased to 11.6 μm/31°, 12.0 μm/30°, and 19.2 μm/25° at a depth of 0.7 mm. The methodologies described here may be useful for analyzing the 3D cellular organization of cartilage during growth, maturation, aging, degeneration, and regeneration.
Keywords
M
During growth and maturation, the density and organization of chondrocytes are also likely to be important and, in particular, underlie the changes in cell fate processes and matrix metabolism that result in expansion of cartilage tissue. The high density of cells in immature cartilage tissue, especially in the superficial zone, may contribute to a net anabolic state, leading to tissue growth. Cell organization in immature cartilage is relatively homogeneous (Hunziker 1992; Williamson et al. 2001,2003), without a region with the structural characteristics of the deep zone of mature cartilage. The characterization of cell density and organization in articular cartilage in the context of growth would be a step toward understanding the role of such features in governing growth dynamics at the tissue level.
Determination of cell density provides a first level of characterization of cell populations within tissue. One approach to estimating cell number in a given volume of tissue is to biochemically analyze DNA content (Kim et al. 1988). This method has been used to determine the cellularity in small volumes of tissue sections, such as from the superficial, middle, and deep zones of mature articular cartilage (Temple et al. 2003) and across maturational stage (fetal, calf, and adult) (Williamson et al. 2001,2003). Another approach is to use stereological methods to analyze two-dimensional (2D) sections, which allows for unbiased estimation of cell number per tissue volume (Paukkonen et al. 1984; Eggli et al. 1988, Wong et al. 1996; Hunziker et al. 2002). On the other hand, with both biochemical and histological methods, it is difficult to evaluate higher levels of cell organization. Biochemical methods may not have sufficient sensitivity to characterize increasingly small tissue volumes, whereas analysis of 2D histological sections requires sufficient sampling to obtain information about three-dimensional (3D) structures.
A next level of characterization of cell populations is by assessment of spatial organization. This has usually been done qualitatively, with 2D microscopy of vertical sections of cartilage. Examination of histological sections by light microscopy, or by fluorescence microscopy after labeling with fluorescent (e.g., DNA binding) dyes, depicts arrangement of cells or cell nuclei in cross-sections. Vertical sections providing side profile views have revealed the columnar organization of cells of the deep zone (Stockwell and Meachim 1979; Hunziker 1992; Hunziker et al. 2002) of articular cartilage. En face sections providing tangential views have revealed horizontal clusters in the superficial zone (Stockwell and Meachim 1979; Schumacher et al. 2002). The distinct arrangement of chondrocytes in the various regions of cartilage obtained with views at various planes suggests a need to examine cellular organization in 3D.
Three-dimensional imaging and image processing of articular cartilage allows for direct assessment of cell organization in tissue volumes of various sizes and geometries (Figure 1). With confocal microscopy, successive thin z-sections are obtained by axial motion of the sample stage, allowing for capture of registered serial sections. However, even with laser-based multi-photon systems, imaging depth into the tissue is limited by diffusion and scattering of light, typically ≃100 μm in cartilage (Figure 1A) (Wong et al. 2001). A relatively new technique, digital volumetric imaging (DVI), overcomes this limitation via surface imaging microscopy, wherein volumes are obtained by physical sectioning and imaging the surface of fluorescently stained tissue embedded in an opaque polymer (Ewald et al. 2002). With this method, a large tissue volume, with depths effectively unlimited and practically up to several millimeters, can be imaged at high resolution (Figure 1B). With 3D data from such methods, 3D image-processing methods could be used to identify tissue features (e.g., cells) and quantify their organization. Automation and standardization of such methods would be useful to analyze samples quickly and repeatably.
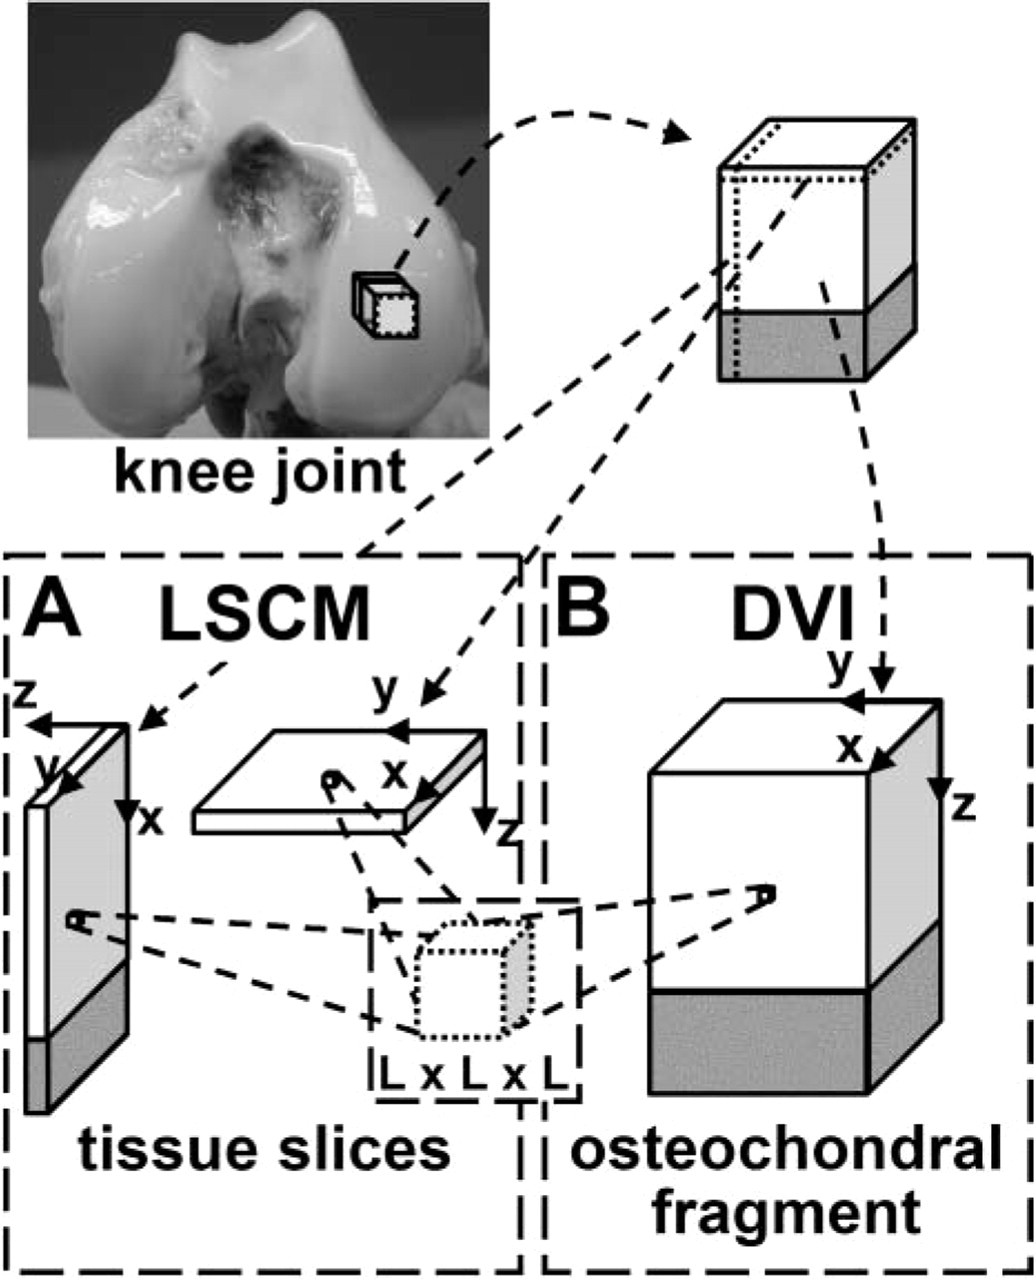
Difference in volume of osteochondral tissue acquired by (
Thus, the overall objective of this study was to develop and validate a new method of quantifying cellularity and cell organization in fetal, calf, and adult bovine articular cartilage by using DVI to obtain tissue images and by testing semi-automated image-processing routines to localize cell nuclei.
Materials and Methods
Osteochondral blocks were harvested from bovine stifle joints at three stages of growth, fluorescently stained, and imaged in 3D. A total of three 1-cm3 blocks were used, one each from the patellofemoral groove of fetal (3rd trimester), calf (1–3 weeks), and adult (1 year) animals. Samples were fixed in 4% paraformaldehyde in PBS at pH 7.4 and 4C for 3 days. The cartilage was then rinsed three times in PBS. The blocks were cut on a sledge microtome to form histological sample blocks with an area of ≃0.5 X 3.5 mm2 (x–y) including the intact articular surface and a depth (z) extending to ≃1.5 mm (partial thickness) for the fetal and calf samples, and ≃1.2 mm to bone (full thickness) for the adult sample. The x and z dimensions were measured using a contact sensing micrometer. Samples were sent to Resolution Sciences Corporation, Inc. (Corte Madera, CA) where they were processed as described (Ewald et al. 2002) by staining with Resolution Standard Stain (Acridine Orange and Eosin Y), except with articular cartilage blocks as samples instead of whole chick embryos. Samples were dehydrated using stepwise treatments with ethanol, embedded in Spur resin with Sudan Black opacifier for X10 magnification, and imaged with a Nikon (Tokyo, Japan) E600 fluorescence microscope with a 310 Plan Apochromat objective (NA 0.45). Three-dimensional image data sets made up of dual color channel voxels were visualized using RESView 3.0 software (Resolution Sciences Corporation). Cell nuclei were stained red, and matrix components appeared green, whereas cell cytoplasm was dark (unstained). Measurements of tissue dimensions in images at high resolution (10 μm) before and after fixation, staining, and dehydration confirmed a slight shrinkage, with the original cut dimensions being decreased both parallel and perpendicular to the articular surface (-1.4 ± 0.8% and -2.2 ± 0.1%, respectively, mean ± SD, n=3) and the volume being decreased (-5.0 ± 1.5%). Because these changes were small, dimensions are presented without any corrections for shrinkage. Three-dimensional renderings and 2D cross-sections of image data were exported as high-resolution bitmaps for qualitative viewing, and 3D image subsets were exported for processing with Matlab 6.1 software (The Mathworks Inc.; Natick, MA).
Because the color intensities of cell nuclei and matrix varied with depth and across samples, the red intensity data was normalized to allow for standardization of the subsequent image-processing step of image segmentation by intensity thresholding (Figure 2). For 3D image subsets of 0.2 X 0.2 X 1.0 mm3 (113 X 113 X 600 voxels), the 3D 8-bit red channel intensities were reconstructed in Matlab 6.1 (The Mathworks Inc.). Line profiles through cell nuclei and extracellular matrix in 2D x–y cross-sections were taken at various z locations to obtain measures of the heterogeneity in image intensity. Using data from successive 2D sections through the depth (z-direction) of tissue, the raw sample depth-varying intensity was tabulated for nuclei and extracellular matrix. The characteristic matrix value at each depth was estimated as the location of the peak in the voxel intensity histogram for each depth. The value for nuclei was approximated as the upper percentile in the histogram corresponding to half of the estimated nuclei volume fraction in cartilage from previous work, or ≃1% (Paukkonen et al. 1984). Profiles of depth-varying intensity for nuclei and for matrix were then computed using a piecewise linear fit (eight pieces of sizes of 5%, 5%, 10%, 10%, 10%, 20%, 20%, and 20% of the total depth). The data were then shifted and scaled linearly, so that fits (as a function of depth) of nuclei and matrix had values of 160 and 80, respectively, well within the 0–255 values of 8-bit data.
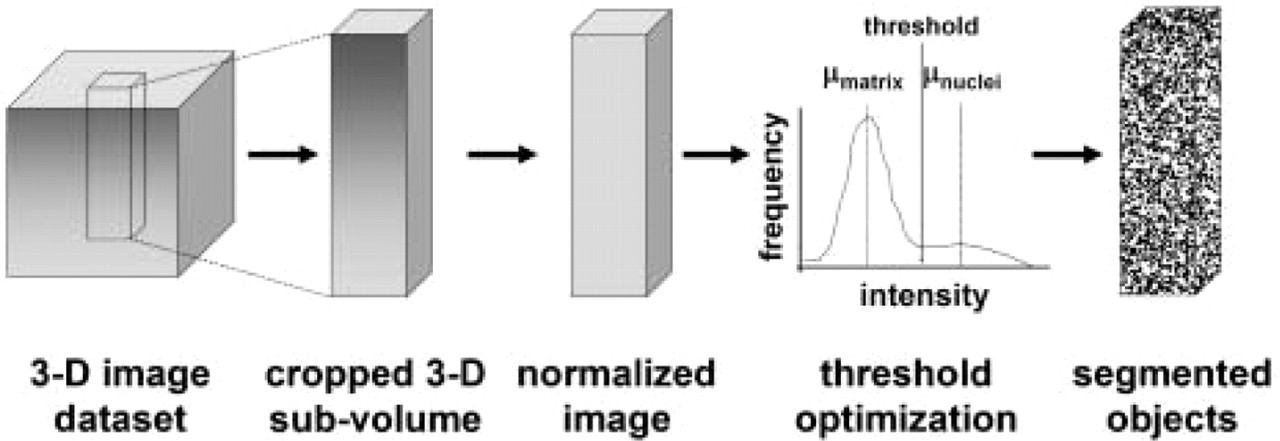
Flow diagram summarizing the image-processing routine for localizing cell nuclei as segmented objects from a three-dimensional (3D) image data set.
An estimate for optimal threshold level to segment the normalized data sets was then determined and applied. The threshold value was based on calculations assuming two Gaussian intensity distributions, one for matrix voxels and another for nuclei voxels. A red-intensity histogram of the constituent voxels for each subset was constructed to show the distributions of matrix and nuclei voxels, as well as those sampling the transition between these regions. Normalized red-channel histograms revealed a large matrix peak at an intensity of 80. The peak at 80 was fit with a Gaussian distribution and subtracted, leaving nuclei and intermediate voxels. Intermediate voxels were then successively removed by best-fit Gaussian curves of remaining transition and nuclei voxels, until the percentage of voxels remaining in the nuclei population out of the total data set size was approximately equal to the expected volume percentage of nuclei (1%), based on previous studies (Paukkonen et al. 1984). An optimal threshold value for each data set was calculated to minimize error due to nuclei characterized inappropriately as matrix (false negative) and matrix characterized inappropriately as nuclei (false positive). Using this analysis, for all data sets the minimum total error coincided with a threshold of 130.
Next, image data were processed to make null the regions of high-intensity matrix staining. To do so, the green-color channel data were segmented into cytoplasm (low intensity), matrix (medium to high intensity), and nuclei (high intensity). A ‘seed’ was then planted in the medium to high-intensity matrix region, and all voxels connected to the propagating seed group in the matrix intensity range were removed. Cell nuclei were not removed using this routine because of the low green intensity (unstained) cell cytoplasm that isolated nuclei from the extracted matrix (no connectivity to propagating seed).
In the final image-processing step, images were segmented based on intensity to isolate cell nuclei and then determine nuclei locations. The theoretical intensity threshold calculated above (130) was applied to separate background from nuclei voxels. Interconnected voxels were then grouped to identify individual cell nuclei objects, and the 3D centroid positions were determined as each object's center of intensity.
The validity of the automated image processing was assessed as sensitivity and specificity measures in distinct depth regions using manual methods of cell identification as a gold standard. Nuclei centroid positions were determined manually in parts of image subsets for comparison with the image-processing results. Cell nuclei 3D positions were estimated by manual inspection of a stack of 2D images. Small volumes (35 μm in the y direction and 100–250 μm in each of the x and z directions) of the superficial, middle, and deep regions of mature articular cartilage and corresponding depth (z) regions in fetal and calf tissue were cropped in each of the sample growth stages of surface area sufficient to count 50–100 cell nuclei. Objects were identified in these samples using the approach of the dissector method. Once identified, cell nuclei centroids were estimated in 3D as the 2D centroid of the nucleus in the mid-section of the stack containing the nucleus.
Cell nuclei localization by automated and manual methods was compared to determine the dependence of the results on intensity threshold value. Cell nuclei positions found using the two methods were overlaid, showing inconsistencies (greater than 2 voxels away in x, y, and z directions) in localization by the automated routine. Results were tabulated as follows:
True positive: cell nuclei locations identified manually and automatically
False positive: cell nuclei locations identified automatically only
False negative: cell nuclei locations identified manually only
The overall sensitivity of the automated method was assessed as the number of correctly identified objects divided by the number of actual objects identified manually. The specificity was determined as the number of correctly identified objects divided by the total number of identified objects.
The image-processing routine was then applied to assess the depth-associated variation in cell density. Object centroids in the RESView 3.0 coordinate system (x,y,z) were transformed to a new coordinate system (X,Y,Z) to indicate depth from the articular surface plane (Z = 0). The surface plane was determined by first defining the centroids of four surface nuclei as being the most superficial in four corners (50 X 50-μm2 cross-sectional areas). The surface normal to the plane was then found (as the cross product of two vectors formed from the most superficial point to the two adjacent points). Object centroids were counted in 0.1-mm deep (Z) sections and 0.2 X 0.2-mm2 cross-sectional area (X,Y), excluding 5 μm at each X–Y surface to eliminate edge effects. Voxels that were devoid of cartilage tissue, for example, due to blood vessels, were also omitted from the depth bin when cell number per tissue volume was calculated. The automated process was repeated for four distinct sub-volumes at locations ≃600 μm apart within each of the samples. These repeated measures were averaged and compared across growth stage with depth to provide a measure of variability within 3D data sets.
Cell nuclei locations in small regions of the superficial, middle, and deep depth regions were analyzed to quantify tissue proximity and angle to cell nuclei in a particular region. Coordinate locations in volumes 50-μm deep starting at the articular surface and at 0.25 mm and 1 mm in depth were isolated. The 3D Euclidean Distance Transform (Russ 1999) was then tabulated, giving the position of the nearest cell nucleus centroid. From this, the proximity and magnitude of the angle to the nearest centroid in the Z-direction with respect to the X–Y plane were calculated, discarding data within 5 μm of the centroid (representing mostly intracellular locations). The cumulative distribution function of distance values was plotted at 5-, 10-, 15-, and 20-μm proximities, and the average angle to the nearest object was calculated for each depth region and growth stage. Again, each data point was expressed as the mean ± SD of four repeated measures.
Results
Three-dimensional renderings of image data portrayed qualitative differences in the density and organization of chondrocytes at different stages of growth, from immature tissue to mature articular cartilage (Figure 3 and Figure 4). Chondrocytes of the superficial region appeared flattened from a side profile view (Figures 3A–3C) and discoid from an en face view in all growth stages (Figures 3D–3F), and the nucleus of each cell had a similar shape, being smaller in size and located in the center of the cell cytoplasm region. Cells with such characteristics were present from the articular surface down to a depth of ≃50 μm in adult tissue and localized closer to the surface in fetal and calf cartilage. Below this region (Figures 3G–3I), cells appeared rounded, with some cell nuclei arranged in pairs, especially in immature tissue. Cells of the deeper region (Figures 3J–3L) of mature cartilage were in the form of columns, whereas those of immature cartilage did not exhibit such an organization and did not appear different from cells in the middle region to the depth surveyed in this study.
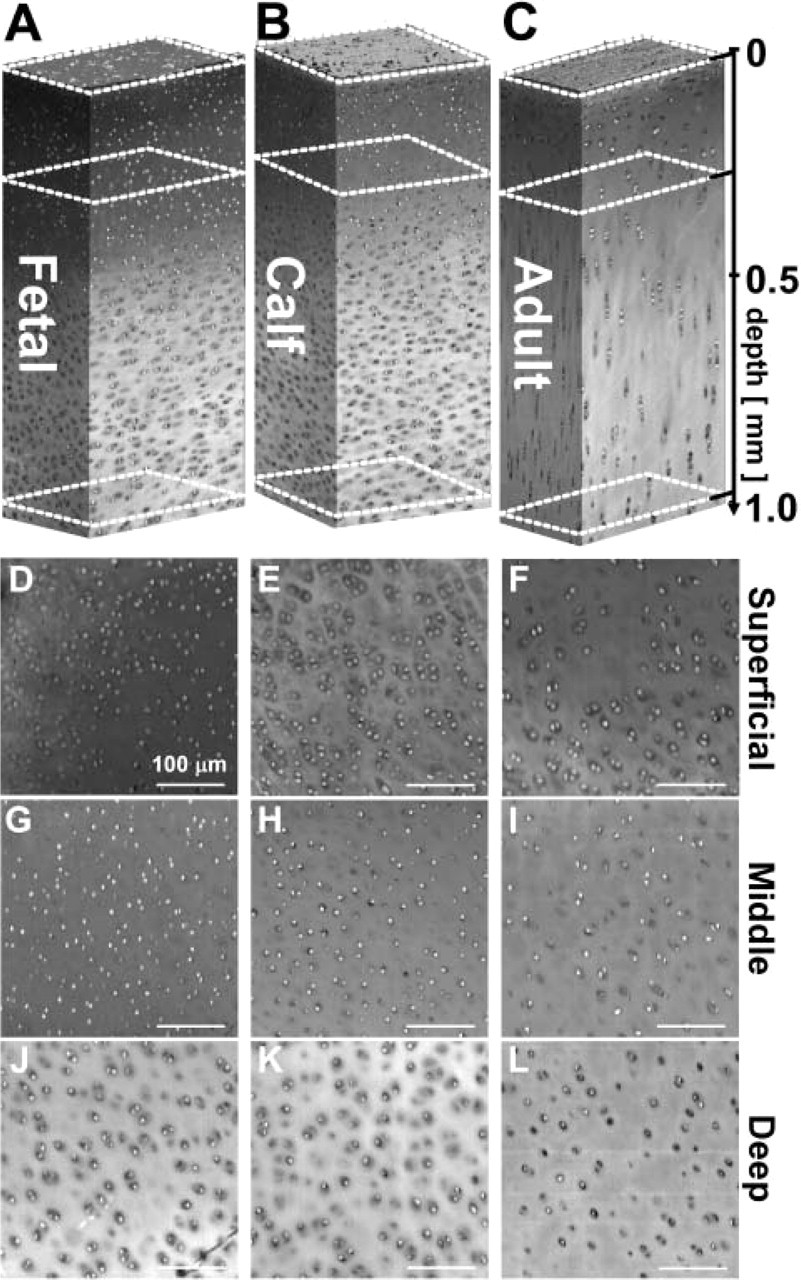
Depth-varying cell organization of bovine articular cartilage at different stages of growth. Three-dimensional rendering of fetal (
A high contrast in red intensity was present between cell nuclei and the surrounding cytoplasm and matrix background. The variation in color intensity with depth within a sample and between samples of different ages was observed in the full 3D depth views as well as in the regional 2D cross-sections (Figure 3). The intensity of the nuclei increased from the superficial region to the middle and deep regions and then diminished in the deep region of the adult sample. Upon normalization, 2D cross-sections exhibited approximately uniform intensity, with line profiles of normalized data confirming that baseline matrix and nuclei intensity peaks were similar for all regions and samples (Figure 5). Representative color values of matrix and nuclei further confirmed the uniform color scheme of the data sets and the achieved target intensities of 80 and 160 for matrix and nuclei, respectively (Figure 6).
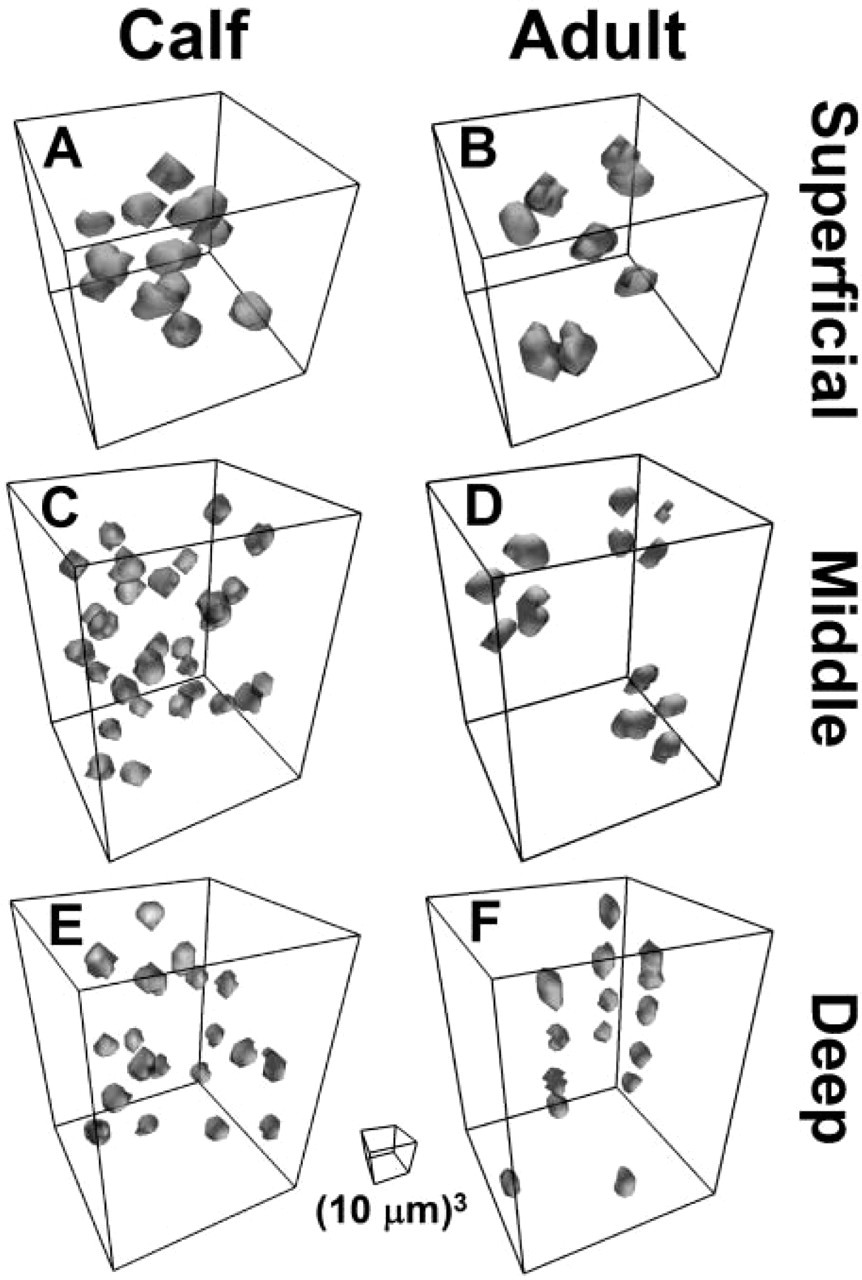
Organization of cell nuclei in 3D in small sub-sections of calf and adult tissue in portions of three classical depth zones are shown (50 X 50 X 50 μm3 for superficial, 50 X 50 X 70 μm3 for middle and deep). Image datasets were color segmented and rendered in 3D with a perspective view. Box indicates 10 X 10 X 10 μm3 image scale.
Analysis of the location of cell nuclei using the automated image processing routine had a high accuracy, relative to the manually determined location of cells. The threshold level for image segmentation had a relatively small effect on the fidelity of cell nucleus identification. Total errors reached minima in each of the subsets at a threshold level that was in between the intensities of matrix and nuclei values (Figure 7) and typically near the threshold intensity value (130) obtained theoretically from analysis of intensity distribution. Using a threshold of 130, errors in each of the superficial, middle, and deep regions were determined (Table 1). Along with 610 true positive cells, a total of 7 false negative and 10 false positive errors were noted, yielding an overall sensitivity (true positives relative to true positives and false negatives) of 99%, and a specificity of 98%. Sources of false negative error included low-intensity nuclei and non-delineated nuclei due to nuclei arranged in clusters. The sole source of false positive error was high-intensity matrix staining. Error of each type (false negative and false positive) did not exceed 4% in any region. Because the accuracy was high, automatically determined cell nuclei locations were used (without corrections) for subsequent analysis.
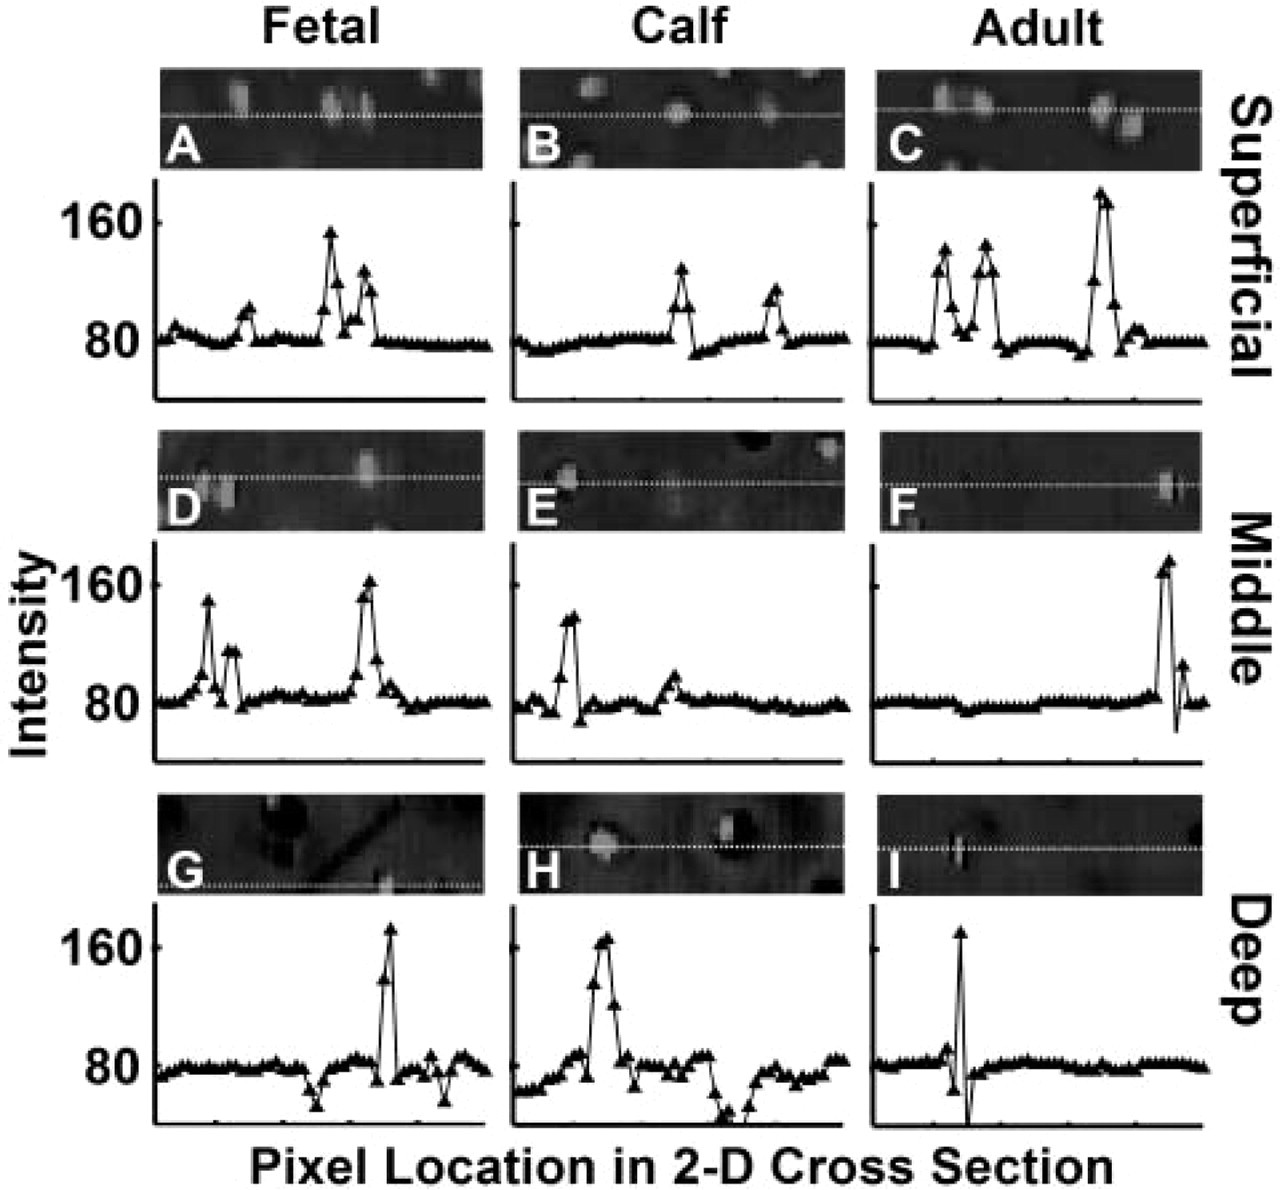
Characteristic differences in intensity between cell nuclei and extracellular matrix in normalized data sets. Profile of intensity along lines through nuclei from superficial (
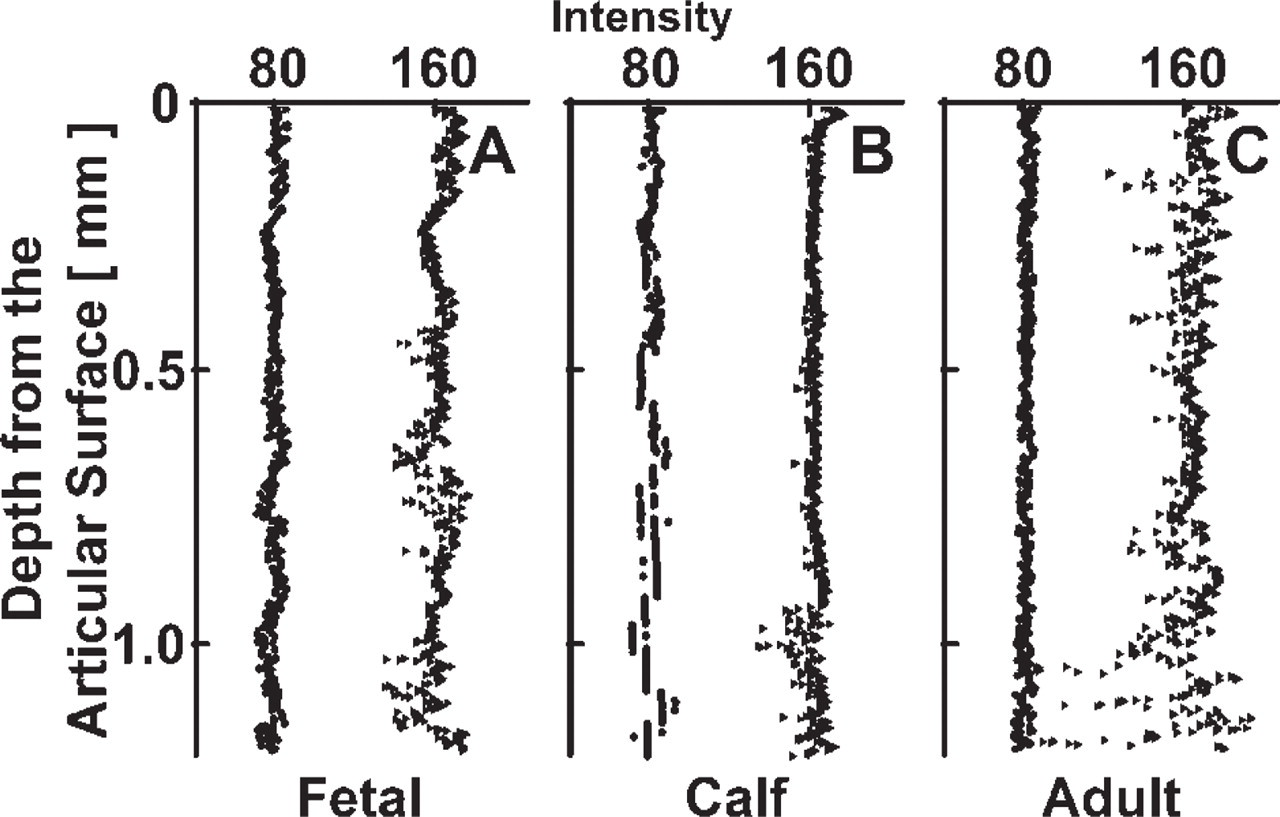
Characteristic depth-associated variations in intensity after normalization of nuclei (closed triangle) and extracellular matrix (closed circle) for fetal (
Overall, cellularity decreased with maturation and with depth from the articular surface down to a depth of 1.0 mm in the samples analyzed. Cellularity dropped with depth from the articular surface, decreasing from 290 to 120, 310 to 110, and 150 to 50 million cells per cm3 for fetal, calf, and adult samples, respectively (Figure 8). Most of the depth-associated decrease in cellularity was in the superficial ≃500 μm of tissue in immature samples and ≃100 μm of tissue in mature samples. At each depth, articular cartilage exhibited cellularity that was lower (40–50%) in adult cartilage than immature cartilage samples. However, data from samples from different animals would be needed to generalize this conclusion for populations of bovine animals.
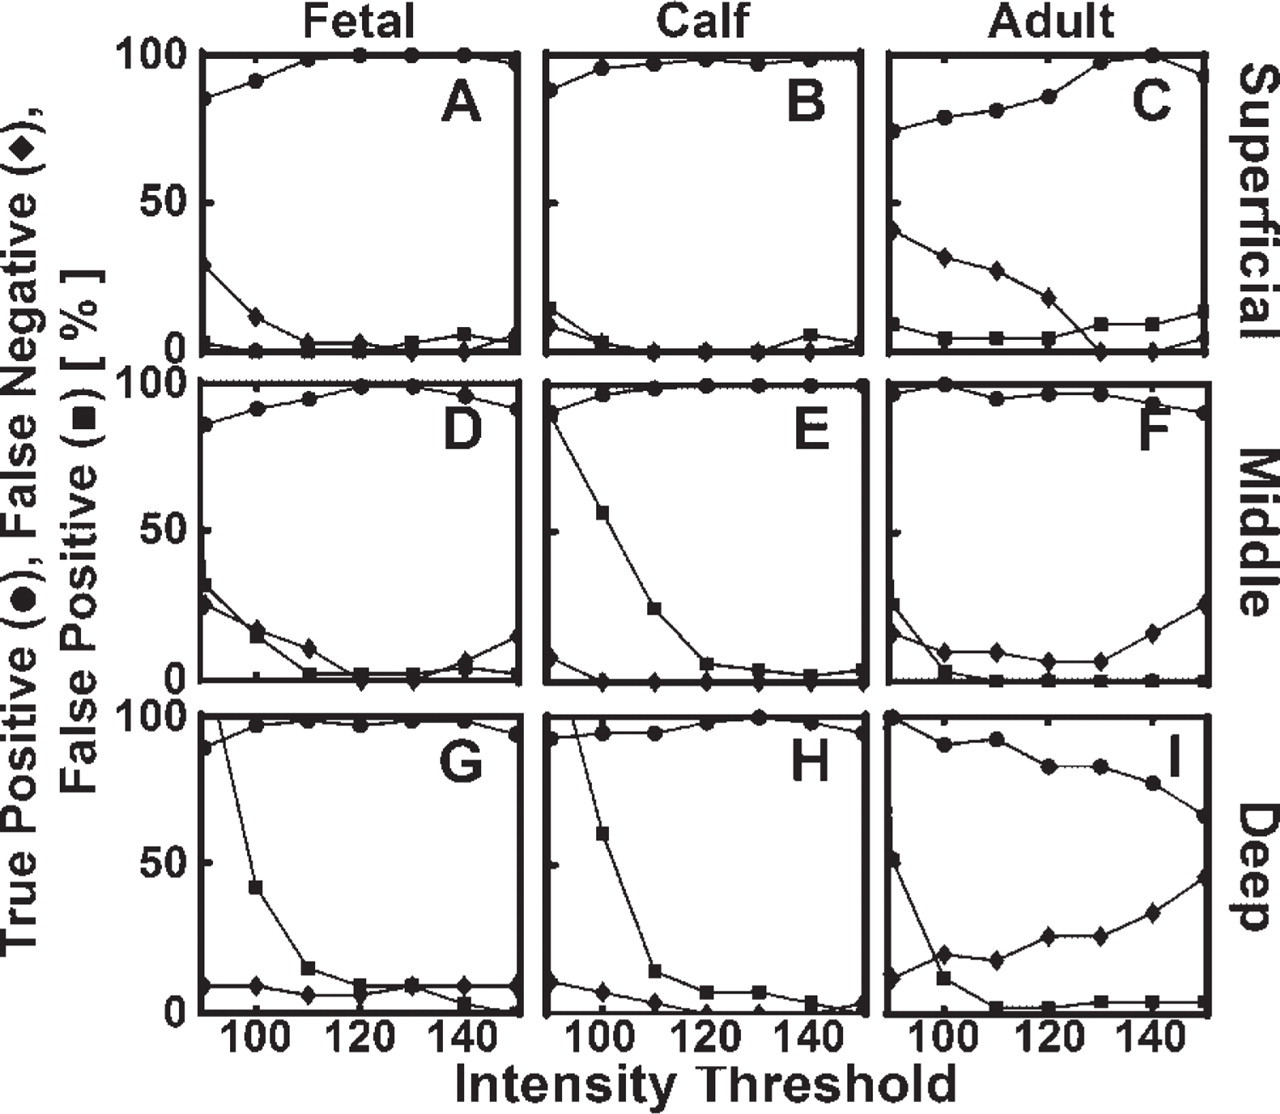
Effect of threshold intensity level on accuracy of automated routine to identify and localize nuclei. Automatically localized nuclei were compared with those from manual inspection of fetal, calf, and adult sub-samples with ≃40–100 cell nuclei in superficial (
Error analysis of automated image processing routine for cell nucleia
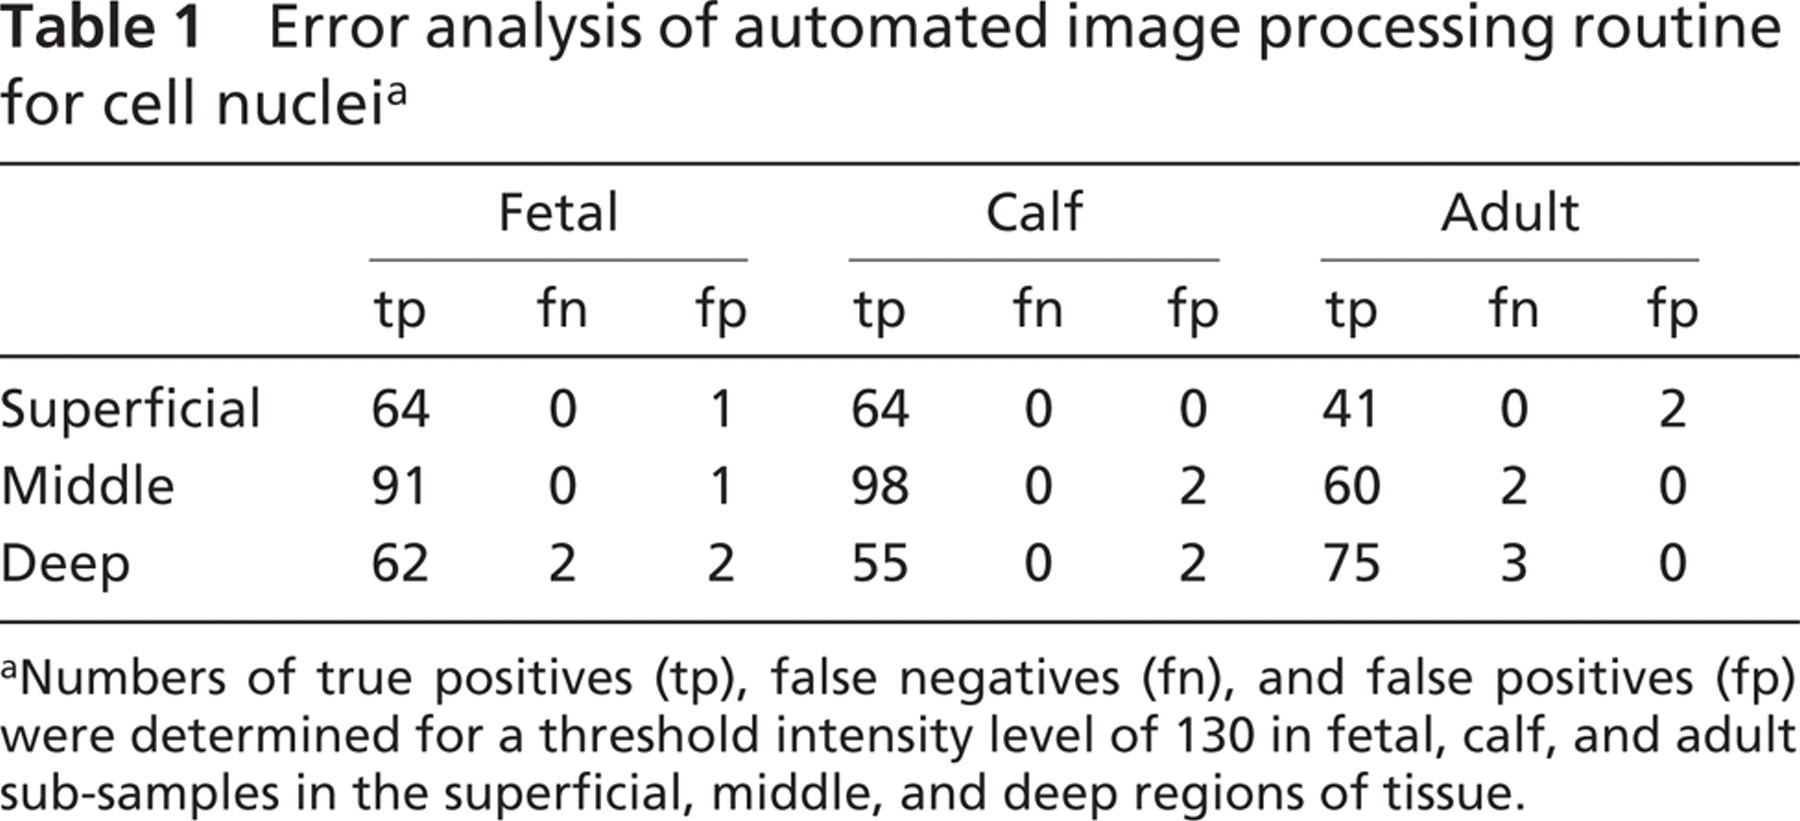
Numbers of true positives (tp), false negatives (fn), and false positives (fp) were determined for a threshold intensity level of 130 in fetal, calf, and adult sub-samples in the superficial, middle, and deep regions of tissue.
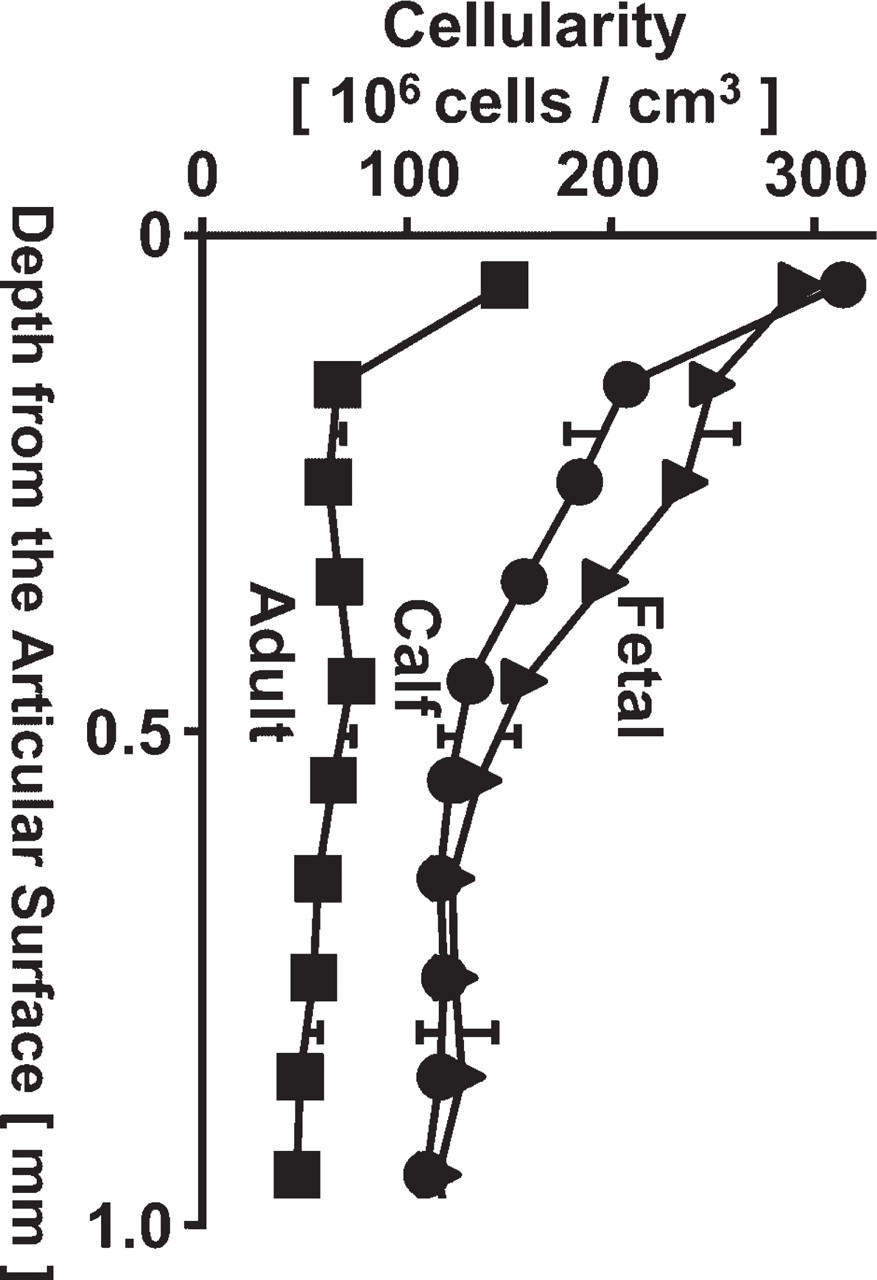
Variation in cellularity with depth in fetal (closed triangle), calf (closed circle), and adult (closed square) samples. Cellularity is present in 0.1-mm depth bins from the articular surface to 1.0 mm in depth. Data are expressed as mean ± SD of repeated measures at four equally spaced volumes, each with a cross-sectional area of 200 X 200 μm2.
Between the sub-volumes analyzed from each sample's 3D image dataset, there was relatively little variation. Estimation of cellularity from the automated method within the tissue samples at each growth stage yielded a coefficient of variation of 7%, 6%, and 7% for fetal, calf, and adult samples, respectively, among the four 0.2 X 0.2 X 1.0-mm3 locations spaced 600-μm apart in the x direction. The corresponding average standard deviation of cellularity was 8, 8, and 3 million cells per cm3 through the full depth for fetal, calf, and adult samples, respectively.
The distance from voxels to the nearest cell increased with depth from the articular surface and with increasing stage of maturation (Figure 9). In immature fetal and calf tissue, much of the tissue is close to a cell centroid location, as indicated by a high percentage of low-intensity pixels in the distance transform maps of tissue cross-sections at depths of Z = 0, 200, and 700 μm. In mature adult tissue, a high percentage (30–50%) of pixels in the maps were of high intensity, representing tissue that was not associated closely with (within 20 μm of) a cell, especially in the middle and deep regions. In contrast, in immature tissue, the majority of the tissue volume (≃60%) was within 10 μm (Figure 10). Further, in the superficial and middle regions of immature tissue, only small volumes (<5%) of tissue were outside of 15 μm from a cell nucleus centroid.
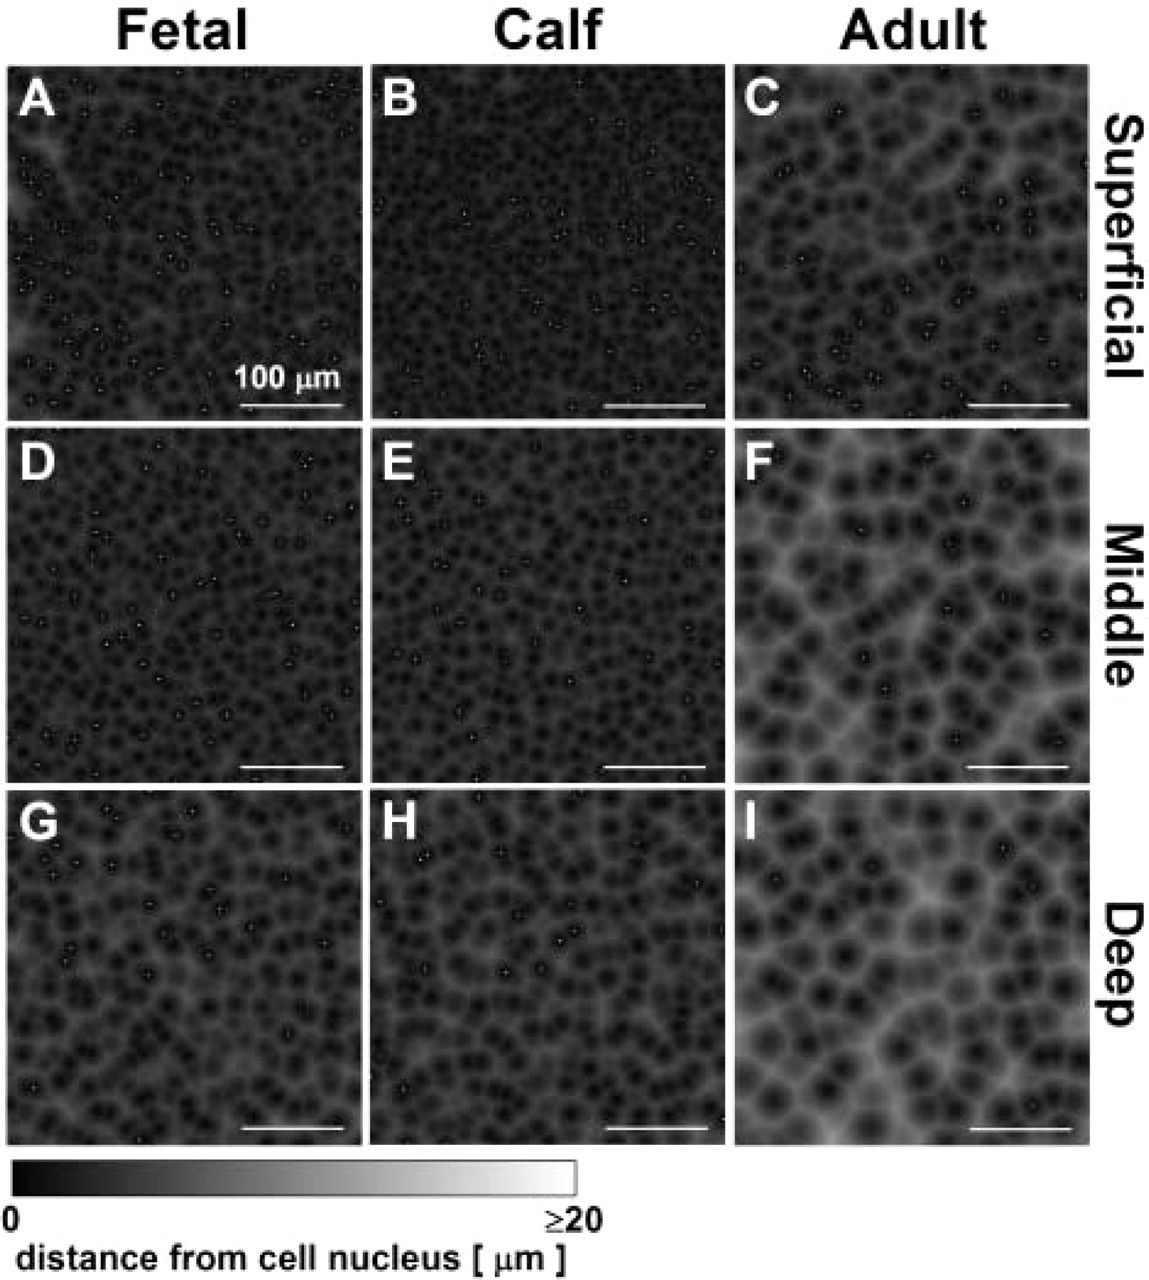
Proximity maps illustrating distance from each location to the nearest cell nucleus. Image data of Figure 3 were analyzed by distance transforms of superficial (
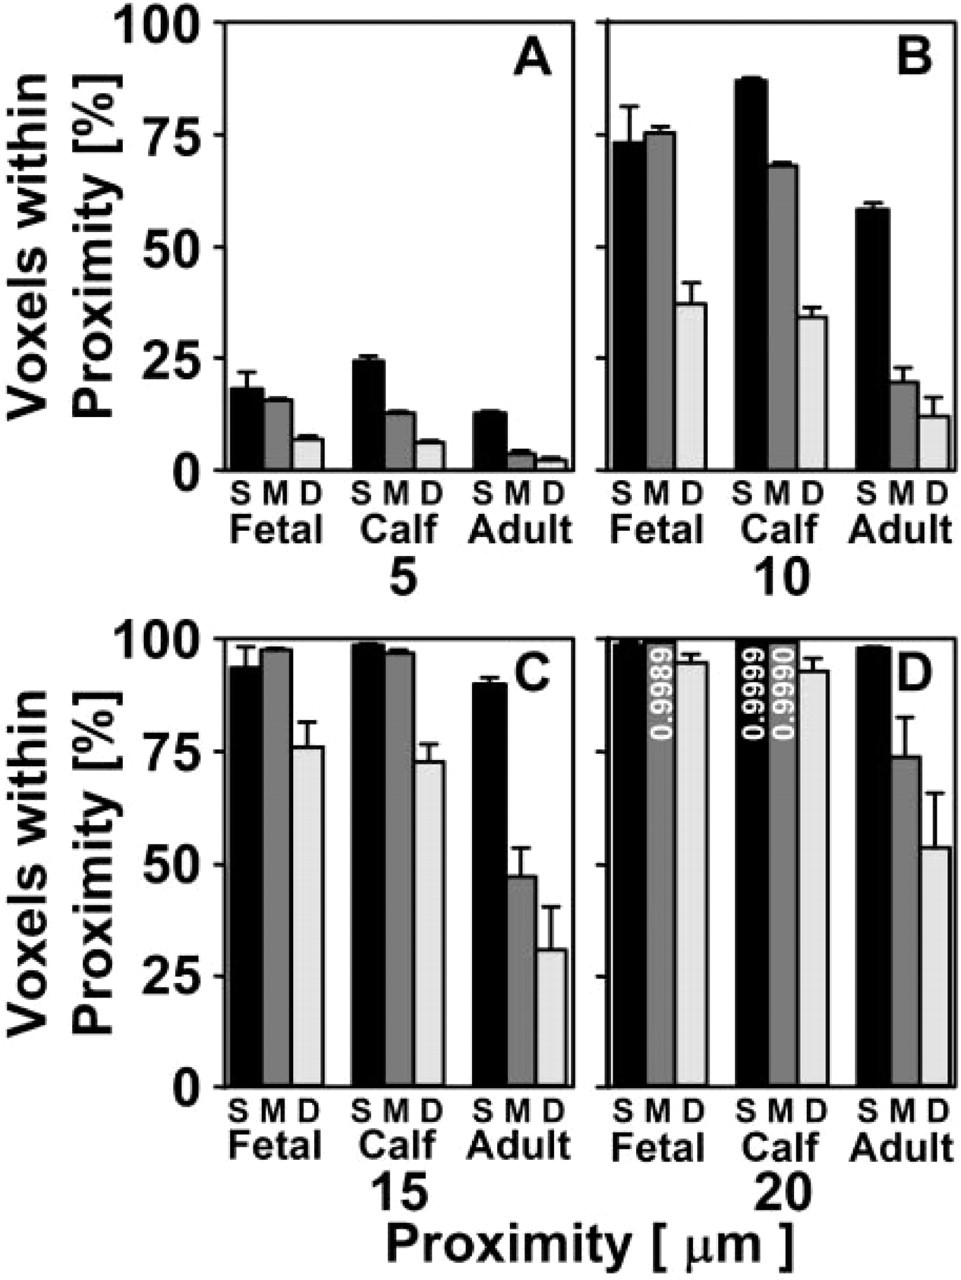
Depth- and growth-associated variations in tissue proximity to chondrocytes in articular cartilage. The percentage of voxels within the indicated proximity (
The angle at which tissue was situated relative to the nearest cell changed with depth from the articular surface in mature tissue but not in immature cartilage (Figure 11). The average magnitude of the angle from tissue voxels to the nearest cell nucleus centroid, measured relative to the X–Y plane, was 30–31° for immature fetal and calf tissue and in the superficial region of adult cartilage. In mature cartilage, this angle decreased to 25° in the deep region, reflecting cell organization in this region.
Discussion
This study developed a methodology to characterize cell density and 3D cell organization in articular cartilage at different stages of growth. Surface imaging microscopy was applied to obtain 3D images of articular cartilage through superficial, middle, and deep zones of mature bovine articular cartilage and corresponding depths in fetal and calf tissue (Figure 3). Using a semi-automated method for determining the 3D location of cells in cartilage samples, cellularity (Figure 8) and tissue proximity to the nearest cell nucleus (Figure 9 and Figure 10) decreased with depth from the articular surface, as well as during growth and maturation. Renderings of groups of individual cell nuclei illustrated the tight packing of cells in calf tissue (Figures 4A, 4C, and 4E) relative to adult tissue (Figures 4B, 4D, and 4F). Further, the views of adult tissue confirmed the presence of horizontal pairs of cells in the superficial region (Figure 4A) and columns of cells in the deep region (Figure 4C), as well as oblique clusters of cells in the middle region (Figure 4B) that were not evident in 2D sections. Application of this methodology may provide the information needed to assess how the 3D organization of populations of cells in articular cartilage contributes to the structural evolution of cartilage during growth.
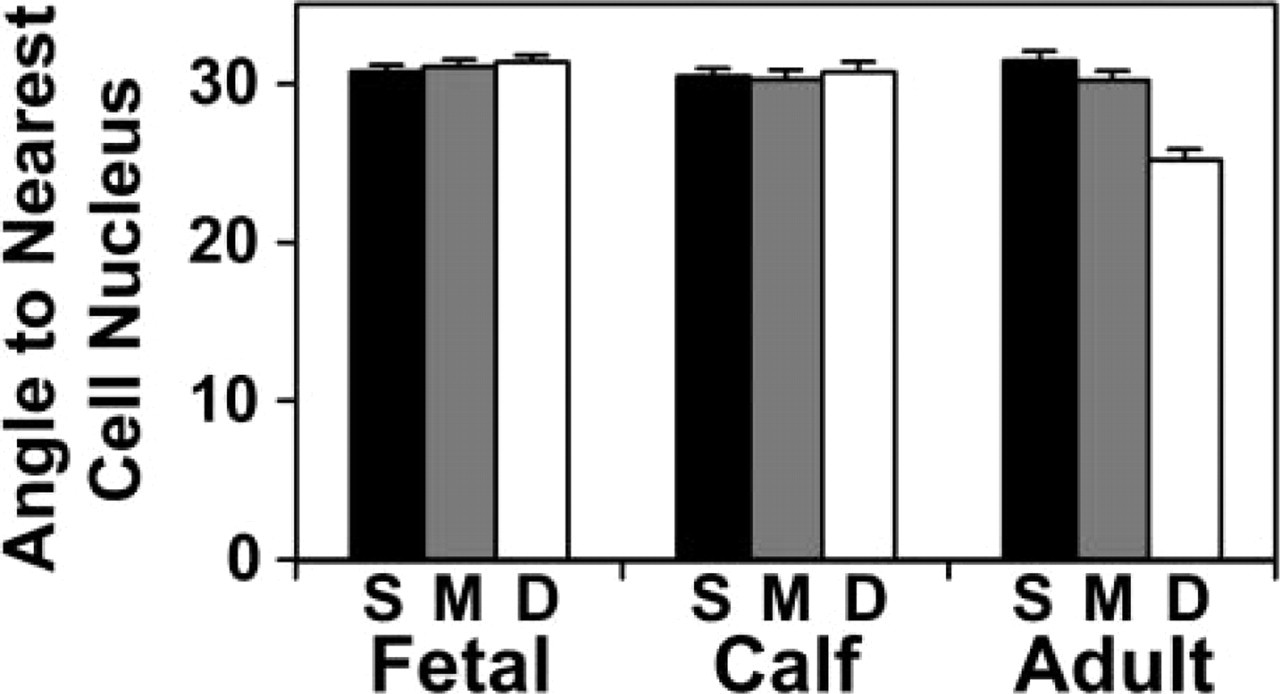
Depth- and growth-associated variation in tissue angle to chondrocytes in articular cartilage. The angle of each tissue voxel to the nearest cell nucleus centroid in the Z direction vs the X–Y plane was found for 50-μm-thick sections in the superficial, middle, and deep (S,M,D) regions of fetal, calf, and adult bovine articular cartilage. Mean ± SD of repeated measures at four locations per sample.
Samples were prepared in such a way to preserve in situ bulk geometry and local cell organization. Large (1 cm3) blocks of tissue were fixed fresh after harvest to prevent the swelling that occurs when bovine calf and adult tissue is cut into smaller portions (Myers et al. 1984; Sah and Grodzinsky 1989). Preservation of in situ bulk geometry with little shrinkage through the imaging procedure (fixation, staining, and dehydration) was verified by comparing bulk tissue dimensions of the sample at these various stages using high-resolution microscopy. Fixation was done at 4C to minimize enzyme-mediated degradative changes that might alter cellular morphology and spatial organization and also cell fate processes such as division and death. Other studies have utilized sample preparation methods to minimize macroscopic sample shrinkage. These studies have maintained cartilage attached to underlying bone, used chemical fixation for long periods of time, and stored samples in 70% ethanol at 4C (Hunziker et al. 2002). Other studies have imaged samples while maintained in isotonic buffer solutions without fixation (Guilak et al. 1995; Errington et al. 1997).
Although overall dimensions were only slightly affected by sample preparation, it is also possible that more subtle features of the tissue were affected (Hunziker 1990). The estimation of the position of each cell, based on the centroid location of each nucleus, may be affected by the relative location of the nucleus within a cell, as well as effects of fixation. The fixation method used here may have resulted in a slight change in the microstructure of the tissue. Other studies (Hunziker et al. 1984; Studer et al. 1995) have utilized alternative sample preparation methods to minimize fixation effects on cell and extracellular matrix structure and the cell-matrix interface. On the other hand, at the resolution of images obtained here, no gap was evident between the cell membrane and the pericellular matrix, a hallmark of shrinkage that occurs with traditional fixation and paraffin embedding. Thus, the chemical fixation and use of plastic embedding appears to have minimized distortion. It is possible that methodologies may be further refined, in conjunction with appropriate cellular stains, to assess other features such as the volume fraction of cells or nuclei. In addition, views of 2D surfaces of cartilage samples, both in vertical and tangential (en face) images, were consistent with previous studies. For example, images of the superficial zone showed a cell organization similar to that described for human tissue (Schumacher et al. 2002), with cells at a high density and in a clustered arrangement.
The image-processing method involved segmenting and identifying cell nuclei. Although cells were generally identified with a high sensitivity and specificity, some inaccuracies were apparent. These resulted from variability in fluorescence from nuclei and inaccurate boundary delineation between cells. Several additions to the procedure used may improve the accuracy of cell nuclei localization. These include imaging at a resolution giving a voxel length <1.77 μm and application of additional image analysis methods and algorithms.
Although the resolution of the voxels was 1.77 μm in the x-y-z directions, the determination of cell nucleus position as the calculated centroid location is likely to yield an estimate of the position of the nucleus with sub-voxel precision. Typically, the calculation of centroid position, involving spatial variation in gray-scale levels, gives a 10-fold (Kubitscheck 2000) enhancement of resolution relative to the voxel resolution for high signal to noise ratio images. This concept also applies to object boundaries, which can be interpolated from gray-scale pixel data to yield sub-pixel resolution (Russ 1995), from which object shapes and volumes can be accurately estimated.
Normalization of data sets with respect to nuclei and background allowed automated intensity segmentation of data sets at a threshold determined from histogram analysis. The optimal threshold found from this analysis was consistent in the different depth regions and growth stages, suggesting that the normalization routine was independent of absolute sample intensity and cell content. Whether the threshold found here is valid in additional samples, however, may be scrutinized in future studies, because only one sample of fetal, calf, and adult tissue was processed and analyzed here.
The time required for analyzing samples with the current methodology is highly dependent on the time of sample preparation and, to a lesser extent, on analysis of images; thus, the overall analysis time is highly dependent on the statistical design and requirements of a particular experiment. The duration of the sample preparation period is ≃14 days. The image-acquisition method requires ≃6 hr for making and imaging 1000 slices at 1024 X 1024, ≃2 hr for fully automated preprocessing of data, and another ≃1 hr for the data reduction to obtain the metrics described herein. If the sample volume is relatively large compared to the overall specimen, the metrics obtained from the overall image, or portions therein, may be representative of the specimen and thus effectively minimize manual preparation of multiple sections from a specimen. On the other hand, if the sample volume is small compared to that of the specimen, then multiple DVI samples would be needed.
Estimates of the trends in cellularity in bovine articular cartilage obtained using the 3D imaging methodology were in general agreement with those found previously. Similar to the results of the present study, cellularity was found to decrease with depth from the articular surface and with normal growth, using biochemical quantification of DNA content (Williamson et al. 2001,2003). Absolute estimates using these biochemical assays on the first 1 mm in depth from the articular surface in fetal, calf, and adult tissue (Li et al. 2001) are in general agreement with those obtained using the current 3D imaging methodology. Depth-varying bovine articular cartilage cellularity determined using DVI and automated image processing also is consistent with cell density trends previously determined for other experimental animals using stereological methods of image processing (Paukkonen et al. 1984; Eggli et al. 1988; Wong et al. 1996; Hunziker et al. 2002). The rapid drop in cell density with depth past the superficial zone (first ≃10% of tissue depth) observed in this study was not observed in mature rabbit articular cartilage (Paukkonen et al. 1984; Eggli et al. 1988) but is present in larger mammals, such as in the adult bovine animal (Wong et al. 1996) and adult human (Hunziker et al. 2002). Previous estimates of cell density in bovine animals using stereological estimates yielded a lower number of cells per unit tissue volume (Wong et al. 1996). However, this study analyzed cartilage from the humeral head, so that differences are likely to reflect differences between that site and the less-weight-bearing patellofemoral groove in the current work. The cellularity of weight-bearing regions has been found to be significantly lower than that of less-weight-bearing regions in adult rabbits, on the order of up to one-half (Eggli et al. 1988). To compare precisely the absolute values found using the technique developed here with those found with other methods, analysis of more samples would be needed.
Previous studies have quantified morphology of cell nuclei in articular cartilage using both 2D and 3D image acquisition and analysis methods (Paukkonen et al. 1984; Eggli et al. 1988; Guilak et al. 1995; Hunziker et al. 2002). In the current study, images were acquired at a somewhat lower resolution than in those of previous studies to sample large image volumes; thus, image resolution was not sufficient to precisely localize the boundaries of cell nuclei. Also, cell boundaries were not assessed in the current study, as the stains used were not optimized to provide contrast at this region. Thus, it was not possible to compare the current findings with those analyses of cell volume fraction in cartilage. Other stains, higher-resolution imaging, and further image-processing methods to delineate cell and nuclei boundaries may allow such a comparison in the future.
Acquisition of large 3D structural bioinformatics data sets for articular cartilage at different stages of growth illustrates the potential for examining the organization of large groups of cells in growing tissues. The complex arrangements (columns, pairs, clusters; Figure 3 and Figure 4) of chondrocytes may reflect their physiological roles during growth and, ultimately, homeostasis and also functional interactions throughout the tissue depth. A means for quantitative assessment of the 3D spatial arrangement of cell populations is a significant step toward understanding the roles of such cell organization in tissue dynamics.
The high proximity to the nearest cell nucleus observed in immature cartilage compared with mature cartilage may help to explain this tissue's ability to effectively heal partial or full-thickness defects (Namba et al. 1998) and the general lack of successful repair in adult cartilage. Diffusion of molecules in cartilage matrix is typically hindered, especially as molecular size increases (Maroudas 1979). Pulse-chase labeling of proteoglycans has revealed that much of the deposition and turnover of these molecules in bovine cartilage occurs within 8 μm of the cell membrane (Quinn et al. 1999) or ≃13 μm from the cell center for a cell with a 10-μm diameter. Because a majority of the tissue space in mature bovine cartilage is outside of this proximity to the cell (Figure 10), effective healing may be impaired by insufficient matrix turnover. In contrast, in immature tissue ≃85% of the tissue volume in the superficial and middle zones is included in this region of high-matrix turnover.
The average angle at which tissue is situated with respect to the nearest cell describes one feature of the higher-order 3D arrangement of cells in the tissue (Figure 11). By comparison, for 2D sheets of cells, this angle approaches 90° (relative to the X–Y plane) where the closest cell to any point in the tissue is almost purely in the Z-direction. For cell columns, on the other hand, the average angle is near zero, with most of the tissue positioned in the transverse direction from cells. Intermediate average angles are typical for cells in an organization in between these extremes; for example, for cells arranged in an isotropic cubic lattice structure, the average angle is 33°. The results from the current study showing little difference in angle with depth in immature tissue reflect the lack of the classical organization of cells that is apparent in adult cartilage. In mature tissue, however, the columnar arrangement of cells in the deep zone is evident and consistent with a decrease in an average angle of tissue to the nearest cell to 25°. The appearance of groups of sheet-like horizontal clusters in the superficial zone did not result in an angle approaching that of the ideal case, likely because of the tight vertical packing of these cell groups made possible by their flattened shape.
The image-processing methods used here could also be applied to 3D images of cartilage obtained by other methods, such as confocal microscopy of cartilage or chondrocyte-laden materials with fluorescently labeled cell nuclei (Guilak et al. 1995; Durrant et al. 1999; Lee et al. 2000; Hunziker et al. 2002; Knight et al. 2002).
The methods developed in this study may be applicable to a variety of tissues, in which cell organization over the length scale of ≃1 mm are of interest. In addition, although the fluorescence signal from the tissue in the present study was derived by staining with exogenous dyes, it may also be possible to analyze fluorescent signals intrinsic to, or genetically engineered into, cells and tissues.
Footnotes
Acknowledgements
This work was supported by the National Aeronautics and Space Administration (NASA), National Institutes of Health (NIH), and the National Science Foundation (NSF).