
Abstract
We have developed a wholemount immunofluorescence protocol for the simultaneous detection of up to three proteins in mouse and chicken embryos. Combined with Murray's clearing reagent (BABB) and microscope objectives with long working ranges and high numerical apertures mounted on a confocal microscope, cellular resolution can be obtained in depths offering the possibility of examining expression patterns in entire organs or embryos. Three-dimensional projections of the optical confocal sections can be computed with computer software allowing rotation around any axis. The protocol is robust and we find that most antibodies working on tissue sections also work with this protocol. This manuscript contains online supplemental material at http://www.jhc.org. Please visit this article online to view these materials.
S
Confocal laser microscopy is widely used to detect fluorescent signals in small transparent embryos and organs such as the fruit fly, zebrafish, early-stage avian embryos, and mouse inner ears [for recent examples see Denkers et al. (2004); Brooker et al. (2006); and Dong et al. (2007)], but larger or more opaque specimens have been considered difficult to analyze with this technique (Sharpe et al. 2002). Optical projection tomography is a recently developed method (Sharpe et al. 2002) and can be used to generate three-dimensional (3D) images in high resolution of both fluorescent and non-fluorescent specimens in the size of adult mouse organs (Alanentalo et al. 2007). This method is very useful for the study of global expression patterns and morphometric analysis but does not provide cellular resolution.
Here we report a detailed stepwise protocol for immunofluorescent detection of up to three proteins in wholemount preparations that, after clearing in Murray's clearing reagent, can be used to examine global expression patterns in mouse embryos up to embryonic day 10.5 (e10.5), chicken embryos up to e4, and whole dissected organs at later stages of development with cellular resolution using a standard confocal microscope with standard optics.
Materials and Methods
Reagents
The following reagents were used: dimethyl sulfoxide (DMSO, cat. #52,796-3; Sigma-Aldrich, Brondby, Denmark), methanol (MeOH, cat. #34,860; Sigma-Aldrich), hydrogen peroxide (H2O2, cat. #UN2014; Merck, Glostrup, Denmark), benzyl benzoate (cat. #B6630; Sigma-Aldrich), benzyl alcohol (cat. #10,800-6; Sigma-Aldrich), Cy3 TSA kit (cat. #NEL704A, includes the TNB blocking reagent; PerkinElmer, Hvidovre, Denmark), Histostain kit (cat. #95-6143B, includes ready-to-use PO-streptavidin; Zymed, Aarhus, Denmark), Dulbecco's PBS without Ca2+/Mg2+ (cat. #14,190; Invitrogen, Taastrup, Denmark), and Lilly's fixative (cat. #LAB00220.1000; Bie and Berntsen, Rodovre, Denmark).
Wholemount Immunofluorescence
See supplemental Figure 1 for a flowchart of the method.
To fix embryos or tissue, we used Lilly's fixative (4% phosphate-buffered formaldehyde, pH 7.2; see list of reagents) or 4% PFA in PBS overnight at 4C. Transfer embryos or tissues to absolute MeOH and let equilibrate for 1 hr on ice. Embryos or tissues can be stored in MeOH for extended periods at −20C. The following steps are done: (1) Incubate tissue in Dent's bleach (MeOH: DMSO: H2O2, 4:1:1) (Dent et al. 1989) for 2 hr at room temperature. This is a critical step that promotes antibody penetration and quenches auto-fluorescence (Alanentalo et al. 2007). (2) Put the tissue back in absolute MeOH. (3) Equilibrate to PBS through a series of descending MeOH concentrations in PBS (75%, 50%, 25%), 10 min each. The tissue will become sticky during this procedure so take care not to suck it into pipettes, etc. (4) Block in 0.5% TNB for 2 hr (a proprietary TSA-block supplied by Perkin-Elmer; see list of reagents). (5) Dilute the primary antibodies in 0.5% TNB and incubate overnight at 4C with gentle rocking. (6) Wash five times for 1 hr each with PBS. (7) Apply the secondary antibodies diluted 1:500 in TNB overnight at 4C with gentle rocking. (8) Wash three times for 20 min each with PBS. (9) Transfer to 100% MeOH. The tissue can be stored for weeks or months at 4C without loss of fluorescence intensity.
Tyramide Signal Amplification (TSA)
TSA amplification involves the same basic protocol. A biotinylated secondary antibody raised in donkey against rabbit IgG was applied in a mixture with the other secondary antibodies, and three extra steps were included (after step 7 and a 2-hr washing step): (1) Tissues were incubated with peroxidase-conjugated streptavidin (Zymed histostain kit; see list of reagents), 2 hr for small specimens, otherwise overnight at 4C. (2) Wash five times for 20 min each with PBS. (3) Develop signal by a 20-min incubation with Cy3-TSA substrate (1:100) or FITC-TSA substrate (1:50) in amplification diluent (PerkinElmer; see list of equipment). (4) Go to step 8.
All animal experiments were performed according to Danish National Research Council guidelines.
General Considerations on Antibodies
Multilabeling experiments require the availability of primary antibodies derived from different hosts and secondary antibodies specifically reacting to immunoglobulins from these. Preferably, secondary antibodies should be derived from the same host to minimize the chance of cross-reactivity, and they can never be from the species from which the primary antibodies are derived. Furthermore, it is a requirement that the fluorophore conjugates are well resolved to allow specific detection on the microscope. Cross-reactivity can be a result of the primary antibodies reacting to related pep-tides (such as the primary antibody against GLP1 used in this study, which reacts with GLP1 and glucagon) or a result of the secondary antibodies reacting with, e.g., IgGs from several species.
We have used the highly cross-absorbed series of secondary antibodies from Jackson ImmunoResearch Laboratories (Suffolk, UK) to detect primary antibodies raised in the following species: mouse, rabbit, goat, rat, and guinea pig in various combinations (this study and data not shown). We find that primary antibodies from all these hosts can be mixed and specifically recognized without cross-reactivity. However, proper controls should always be carried out testing each primary antibody followed by a mixture of the secondary antibodies to secure that the primary antibody in question is detected only by the corresponding secondary antibody. Uncharacterized antibodies can be tested for specificity by standard preabsorption studies.
Primary Antibodies
Primary antibodies used were as follows: goat anti-Pdx1 (kind gift from Chris Wright), diluted 1:15,000; rabbit anti-Neurog3, generated by immunization of rabbits with a NGN3-GST fusion protein as in Schwitzgebel et al. (2000), diluted 1:16,000 with TSA; rat anti-CD31/Pecam1 (cat. #550274; BD Biosciences, Erembodegem, Belgium) diluted 1:500; mouse anti-E-cadherin (cat. #610181; BD Biosciences) diluted 1:1000; mouse anti-glucagon (GLU001; Novonordisk A/S, Bagsvaerd, Denmark) diluted 1:500; mouse anti-insulin (HUI018; Novonordisk A/S) diluted 1:500; rabbit anti-amylase (cat. #A8273; Sigma-Aldrich) diluted 1:5000; rabbit anti-GLP1 (kind gift from Jens Juul Holst) diluted 1:2000; rabbit anti-Nkx6-1 (Jensen et al. 1996) diluted 1:1000; mouse anti-Nkx6-1 (F55A10; Developmental Studies Hybridoma Bank/BCBC, The University of Iowa, Iowa City, IA) diluted 1:1000; rabbit anti-Hlxb9 (kind gift from Thomas Jessell) (Arber et al. 1999) diluted 1:10000; goat anti-Foxa2 (cat. #sc6554; Santa Cruz Biotechnology, Santa Cruz, CA) diluted 1:1000; and mouse anti-MPM-2 (cat. #M3514; Dako A/S, Glostrup, Denmark) diluted 1:1600.
Secondary Antibodies
We used whole IgG biotin anti-rabbit (cat. #711-065-152; for TSA amplification), Cy2-anti-goat (cat. #705-225-147), Cy3-anti-rabbit (cat. #711-165-152), Cy5-anti-mouse (cat. #715-175-151), and Cy5 anti-rat (cat. #712-175-153) secondary antibodies from Jackson ImmunoResearch Laboratories raised in donkey (1:500) in 0.5% TNB. Secondary antibodies were always applied as a mixture.
Clearing With BABB and Mounting
It is critical that the tissue is completely equilibrated to 100% MeOH. Any residual water will cause precipitation in the tissue, making it opaque.
Immerse the tissue in BABB in a glass dish and let it equilibrate for 10 min (BABB is a 1:2 mixture of benzyl alcohol to benzyl benzoate). Mount the specimen in BABB in a concavity slide with appropriate thickness (cat. #71,878; Electron Microscopy Sciences, Hatfield, PA) and cover with a coverslip.
Imaging
All images were obtained using the listed Zeiss objectives mounted on a Zeiss LSM510 META Axio Imager or AxioVert 200M META microscope connected to a LSM 510 laser module with the following lasers: Ar laser (488 nm; 50% laser power), He/Ne laser (543 nm), and He/Ne laser (633 nm) (Carl Zeiss; Göttingen, Germany). Laser output was set to 100% for all three lasers. Pinholes for each channel were adjusted so that the optical section depths in each channel were even (pinhole ∼120 μm). Emitted fluorescence was detected with line scans in multitrack mode using BP505 530-nm (Cy2) and LP 560-nm filters (Cy3). Cy5 was recorded with the LSM510 META module set to 636-753 nm. Fluorescence was recorded as square 8-bit images (1024 × 1024 pixels) and stored as separate image stacks for each channel. Pixel time varied between the images but generally a pixel time of 3.20 μsec was used, giving a scan speed of ∼23 sec per section (using average of 2). Z-sections were recorded at intervals even to the optical section depth. This gives lower resolution than the optimum 0.5 times optical slice thickness but was chosen to shorten the total scan time to avoid bleaching during scanning. Z-stacks were pseudocolored and projected to 3D using Zeiss LSM software. Alignment of images to produce composite images was done manually with Adobe Photoshop (Adobe; Palo Alto, CA).
List of Objectives
The list of objectives is as follows: Plan-Neofluar 2.5×/0.07; Plan-Apochromat 10×/0.45, working distance (WD) 2 mm; Plan-Neofluar 10×/0.3, WD 5.5 mm; LD Plan-Neofluar 20×/0.4, WD 7.9 mm; Achroplan 20×/0.5 W Ph2, WD 1.9 mm; and Achroplan 40×/0.8 W, WD 3.6 mm. The Plan-Neofluar 2.5×/0.07 objective does not have confocal properties but allows a global view of the specimen.
Results
We have tested a range of objectives for the purpose of laser-scanning confocal microscopy of specimens immunofluorescently labeled in wholemount. We find that optics with long working ranges and high numerical apertures perform well and, for higher magnification (×20 and ×40), water-immersion objectives perform better than dry objectives with similar working ranges and numerical apertures. In our setting, most antibodies working on sections also work in the wholemount procedure. Due to improved sensitivity we generally dilute the primary antibodies 2- to 5-fold more than the dilutions used on sections. All projections were done using unfiltered optical confocal sections, and the only image manipulation done was brightness/contrast enhancement.
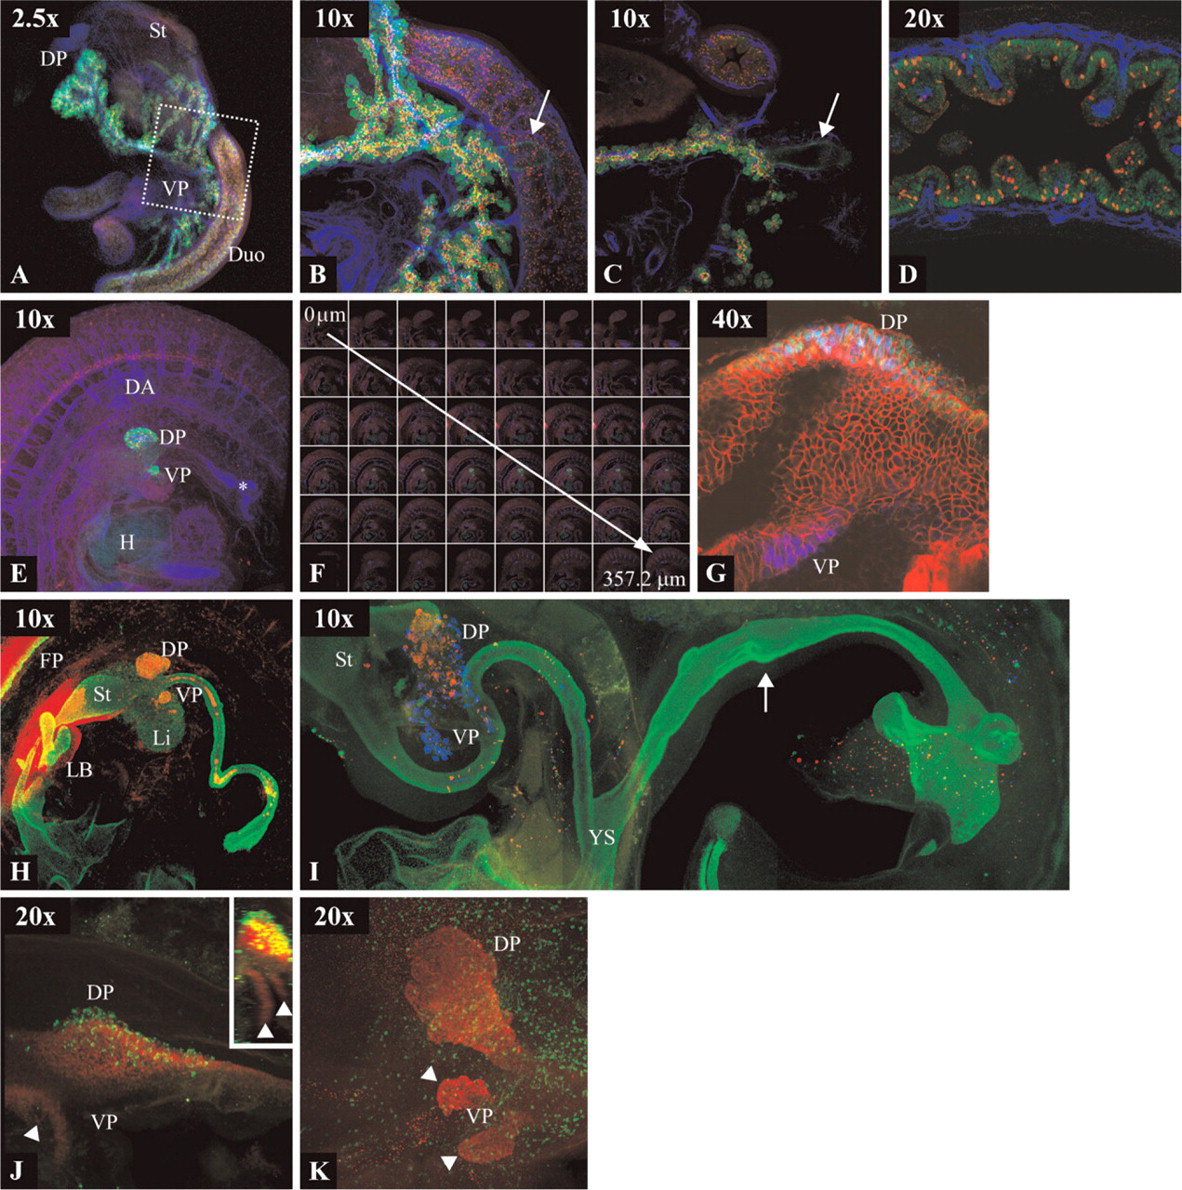
The developing pancreas was used as an example of what the method can be used for. Figure 1 illustrates the performance of the protocol and the optics. Briefly, the pancreas develops from dorsal and ventral anlagen in the endodermal epithelium, which during development fuse (between e11.5 and e12.5 in the mouse) and form the adult organ. One of the earliest pancreas markers known is Pdx1, the expression of which is initiated at e8.5 in the mouse embryo and labels progenitor cells of all the epithelial lineages of the mature organ (Gu et al. 2003). Once the pancreas is defined, Nkx6-1 is turned on in the pancreas primordia (Sander et al. 2000). The majority of the adult organ is constituted by the exocrine compartment, which produces digestive enzymes such as amylase secreted to the duodenum through the pancreatic ducts (Slack 1995). The five endocrine cell types of the pancreas are organized in the islets of Langerhans and produce peptide hormones important for glucose homeostasis. The peptide hormones are glucagon, insulin, somatostatin, pancreatic polypeptide, and ghrelin produced by the α, β, δ, PP, and ∊ cells, respectively (Heller et al. 2005). The formation of pancreatic and enteroendocrine cells depends on the bHLH transcription factor Neurog3, which is transiently expressed in all endocrine progenitors (Gradwohl et al. 2000; Gu et al. 2002; Jenny et al. 2002).
Figure 1 shows a selected set of immunofluorescent stainings that illustrate aspects of pancreas development. An e15.5 dissected mouse stomach with proximal duodenum and pancreas stained with antibodies specific for Pdx1 in green, CD31/Pecam1 in blue, and Neurog3 in red (Cy3 TSA amplified) is shown in Figures 1A-1D. Pdx1 labels the entire pancreatic and duodenal epithelium, whereas CD31/Pecam1 marks endothelial cells of the vasculature, and Neurog3 the endocrine progenitor cells. At low magnification, it is easily seen how the dorsal pancreas lies adjacent to the stomach and the ventral pancreas in the duodenal loop (Figure 1A; Plan-Neofluar 2.5×/0.07). 3D imaging can be obtained at higher magnification (Figure 1B) by collapsing individual optical sections exemplified in Figure 1C (Plan-Apochromat 10×/0.45). At this level, it is possible to observe how the Neurog3-positive cells lie in the central part of the pancreas epithelium, and the common bile duct that connects the pancreas to the duodenum is also visible (arrows in Figures 1B and 1C). Optical sections at 20× provide single-cell resolution (Figure 1D; LD Plan-Neofluar 20×/0.4). Scattered Neurog3-positive nuclei lie within the Pdx1-positive epithelium, and it is seen how blood vessels project into the mesenchymal part of the intestinal villi.
For intact embryos, this method allows reconstruction of 3D expression patterns in mouse embryos until e10.5 (Figures 1E, 1F, and 1H and Supplemental Movies 1 and 2; Plan-Apochromat 10×/0.45) and e4 in chicken embryos (Figure 1K; Achroplan 20×/0.5 W Ph2). In e10.5 mouse embryos, Pdx1 (green) labels the dorsal and ventral pancreas buds as well as the lateral intestinal epithelium between the buds at lower levels. Neurog3 immunoreactivity (red) is seen in the dorsal pancreas bud and in the ventral spinal cord. CD31/ Pecam1 (blue) highlights the vasculature and the dorsal aorta, and its projection along the neural tube is readily seen (Figures 1E and 1F and Supplemental Movies 1 and 2). A common problem we observe using monoclonal antibodies derived from mouse and rat is unspecific staining in the lumen of the gut (asterisk in Figure 1E) of mouse embryos. The image shown in Figure 1E was obtained by projecting the 48 optical sections spanning 357.2 μm shown in Figure 1F. A 360° rotation on the y-axis of the projection can be seen as Supplemental Movie 1 and the individual sections can be seen in high resolution in Supplemental Movie 2.
(
For single-cell resolution and coexpression studies, very thin optical sections can be obtained using a 40× objective as exemplified in Figure 1G (Achroplan 40×/0.8 W). Here an e8.75 mouse embryo stained for Pdx1 (blue), E-cadherin (red), and Hlxb9 (green) is shown. Pdx1 is expressed in the dorsal and ventral pancreas anlagen, Hlxb9 is only expressed in the dorsal endoderm, and E-cadherin is present in the membrane of all epithelial cells of the endoderm.
Foxa2 labels the entire endodermal epithelium and the floor plate of the spinal cord (Figures 1H and 1I; Plan-Neofluar 10×/0.3). Whereas the entire gut of an e10.5 mouse embryo can be contained within the field of view of the 10× objective (Figure 1H), the gut of an e5 chicken embryo is too large. The image in Figure 1I was therefore generated by joining three projections in a composite image. The flanks of the embryo and the liver were dissected away prior to staining.
Figures 1J and 1K (Achroplan 20×/0.5 W Ph2) show the development of the chicken pancreas marked by Nkx6-1 expression from HH stage 15 to e4 (HH stage 21) (Hamburger and Hamilton 1951). Rotation of the projected 3D image reveals how the two ventral pancreas buds develop from two ventrolateral Nkx6-1 domains (Figure 1J, inset).
Discussion
Our results demonstrate how confocal laser-scanning microscopy can be used to generate detailed expression data in high resolution from any desired depth of organogenic stage mouse and chicken embryos. Larger tissues such as e15.5 dissected mouse gut preparations can also be effectively immunolabeled with this protocol and, although large specimens exceed the field of view in optics with confocal properties, overlapping z-stacks and derived 3D projections can be used to generate composite images showing entire organs or embryos. Rotation of 3D projections can give additional information with the limitation that any angle deviating from the plane of the optical section will become progressively blurred until 90° from the original plane of section. This is in contrast to 3D tomographic reconstructions calculated using back-projection algorithms from parallel projection datasets such as optical projection tomography, which have equal resolution in any given angle (Sharpe et al. 2002).
Analysis of intact mouse and chicken embryos and isolated organs in combination with the high resolution offered by this technique facilitates accurate morphometric measurements. Consequently, the method described here provides a powerful tool for analyzing global gene expression as well as phenotypes resulting from perturbations of the normal development.
Footnotes
Acknowledgements
O.D.M. and P.S. were supported by NIH Grants 5U19 DK-42502-15 and 1U19 DK-61244-4 through the Beta Cell Biology Consortium and by the EU 6th framework program.
We thank Malene Jørgensen, Hanne Duus Laustsen, and Karsten Skole Marckstrøm for technical support. We are grateful to Mike S. German, Chris V. E. Wright, Jens Juul Holst, and Thomas Jessell for providing reagents.