
Abstract
We have selected a conserved immunogenic region from several actin genes of
A
Different actin isoforms occurring in many organisms may serve specific functions in the respective cells (Pollard et al. 2000; Wagner et al. 2002). For localization, antibodies (ABs) may be used at the light microscope (LM) and electron microscope (EM) levels, as well as for Western blots. Bicyclic peptide toxins, phalloidin or jasplakinolide, can bind rather specifically to F-actin, thus allowing fluorescence labeling (Wieland and Faulstich 1978; Bubb et al. 2000). This or the alternative approach, F-actin disruption by toxins of the type cytochalasin B and D or latrunculin A, is also widely used for functional analyses also with ciliates (see below).
In previous times, mainly before molecular biology approaches could be undertaken, biochemical, functional, and immunolocalization studies were tried to probe the potential function of F-actin in ciliates such as
Our present analysis also addresses some special subcellular structures in
Materials and Methods
Stocks and Cultures
The wild-type strain of
Expression of Paramecium Actin-specific Peptides in Escherichia coli
For heterologous expression of actin-specific peptides we selected the amino acid sequence of actin 1-1 (accession number AJ537442). After changing all deviant
Purification of Recombinant Actin 1-1 Peptides
Recombinant actin 1-1 peptides, actin 1-1E57-P243 and actin 1-1L251-G366 were purified by affinity chromatography on Ni2+-nitrilotriacetate agarose under native conditions, as recommended by the manufacturer (Novagen). The recombinant peptides were eluted with a step gradient, 100 to 1000 mM imidazole in 50 mM sodium phosphate (pH 6.0) with 300 mM NaCl added. The fractions collected were analyzed on SDS polyacrylamide gels, and those containing the recombinant peptides were pooled and dialyzed in phosphate-buffered saline (PBS).
Antibodies Used
ABs against the two recombinant actin peptides, actin 1-1E57-P243 and actin 1-1L251-G366, were raised either in rabbits or mice. After several boosts, positive sera were taken at day 60 and purified by two subsequent chromatography steps, a first step on a His-tag peptide column (24-amino acid peptide, to remove His tag-specific ABs), followed by an affinity step on the corresponding actin 1-1 peptide. One of these ABs recognizes the N-terminal and the other the C-terminal region of actin 1-1, yet results achieved in this study were indistinguishable with either type of ABs. Therefore, no further distinction is made, unless indicated. We used the sequence of
Mouse polyclonal ABs against
Cell Fractionation
Cells were deciliated by a Mn2+-shock (for details, see below) and cilia were purified by differential centrifugation (Nelson 1995). Whole-cell homogenates were prepared in phase buffer (20 mM Tris-maleate, 20 mM NaOH, 20 mM NaCl, 250 mM sucrose, pH 7.0) by ~100 hand strokes in a glass homogenizer equipped with a Teflon pestle. Soluble and particulate fractions were separated by centrifugation at 100,000 × g for 60 min at 4C. Cell surface complexes (“cortices”) were prepared according to Lumpert et al. (1990), and trichocysts were isolated by the method of Glas-Albrecht and Plattner (1990). A protease-inhibitor cocktail containing 15 μM pepstatin A, 100 mU/ml aprotinin, 100 μM leupeptin, 0.26 mM TAME, 28 μM E64, and 0.2 mM Pefabloc SC was used throughout.
Electrophoretic Techniques and Western Blot Analysis
Protein samples were denatured by boiling for 3 min in sample buffer (0.4 M Tris-HCl, 1% SDS, 0.5% DTT, 20% glycerol, pH 8.0) and subjected to electrophoresis on linear gradient (5–20%) SDS polyacrylamide gels using the discontinuous buffer system of Laemmli (1970). Before electrophoresis, samples were alkylated for 30 min at 20C by 2% iodoacetamide. Protein standards were used in accordance with manufacturer directions. Gels were either stained with Coomassie blue R250 or prepared for electrophoretic protein transfer onto nitrocellulose membranes. Protein blotting was performed at 2 mA/cm2 for 1 hr according to the technique of Kyhse-Andersen (1989) using the semidry blotter from BioRad (Munich, Germany). ABs were diluted 1:1000 in 0.25% (w/v) non-fat dry milk and Tris-buffered saline, pH 7.5, and applied overnight at 4C. AB binding was visualized by a second AB coupled to alkaline phosphatase (Sigma: Taufkirchen, Germany) using 5-bromo-4-chloro-3-indolyl phosphate and Nitro Blue tetrazolium as substrates.
Immunofluorescence Labeling
Deciliated cells were fixed in 8% (w/v) freshly depolymerized formaldehyde with 0.5% digitonin, 1 mM ATP, 10 mM MgCl2, and 10 mM KCl added, for 20 min on ice in Pipes buffer, pH 7.0. After fixation, cells were washed twice in PBS, 2 × 10 min in PBS with 50 mM glycine added and 30 min in this solution with 1% BSA added. The mouse anti-actin AB was applied in a dilution of 1:50 in PBS (+1% BSA) for 90 min at room temperature. After 4 × 15 min washes in the same solvent, FITC-conjugated anti-mouse ABs, diluted 1:50, were applied for 90 min, followed by 4 × 15 min washes in PBS. A second labeling with anti-centrin ABs from rabbits was performed as described above, using Texas Red-conjugated anti-rabbit ABs. Anti-rabbit and anti-mouse fluorescent AB conjugates were from Sigma-Aldrich (St Louis, MO) and Serva (Heidelberg), respectively.
Fixation and Embedding for Postembedding EM Analysis
Using a quenched-flow apparatus (Knoll et al. 1991),
Immunogold Labeling and EM Analysis
Samples were washed in PBS/BSA-c (0.3%) three times, 10 min each, and treated for 1 hr with gold conjugates. We used goat anti-rabbit IgGs coupled to gold of 5 nm (Au5) provided by Sigma, diluted 1:30.
Results
Actin-specific ABs, Cell Fractionation, and Western Blot Analysis
Molecular cloning from a pilot sequencing project (Dessen et al. 2001; Sperling et al. 2002) as well as from the ongoing
Western blots from homogenates display a strong band of 43 kD and a weak one of 40 kD (Figure 2). Such bands also occur in the 100,000 × g pellet, while the 43 kD band is much weaker in the 100,000 × g supernatant. The 43 kD band is typical of actin, while the 40 kD band may represent one of the shorter isoforms of the actin or actin-related gene products of
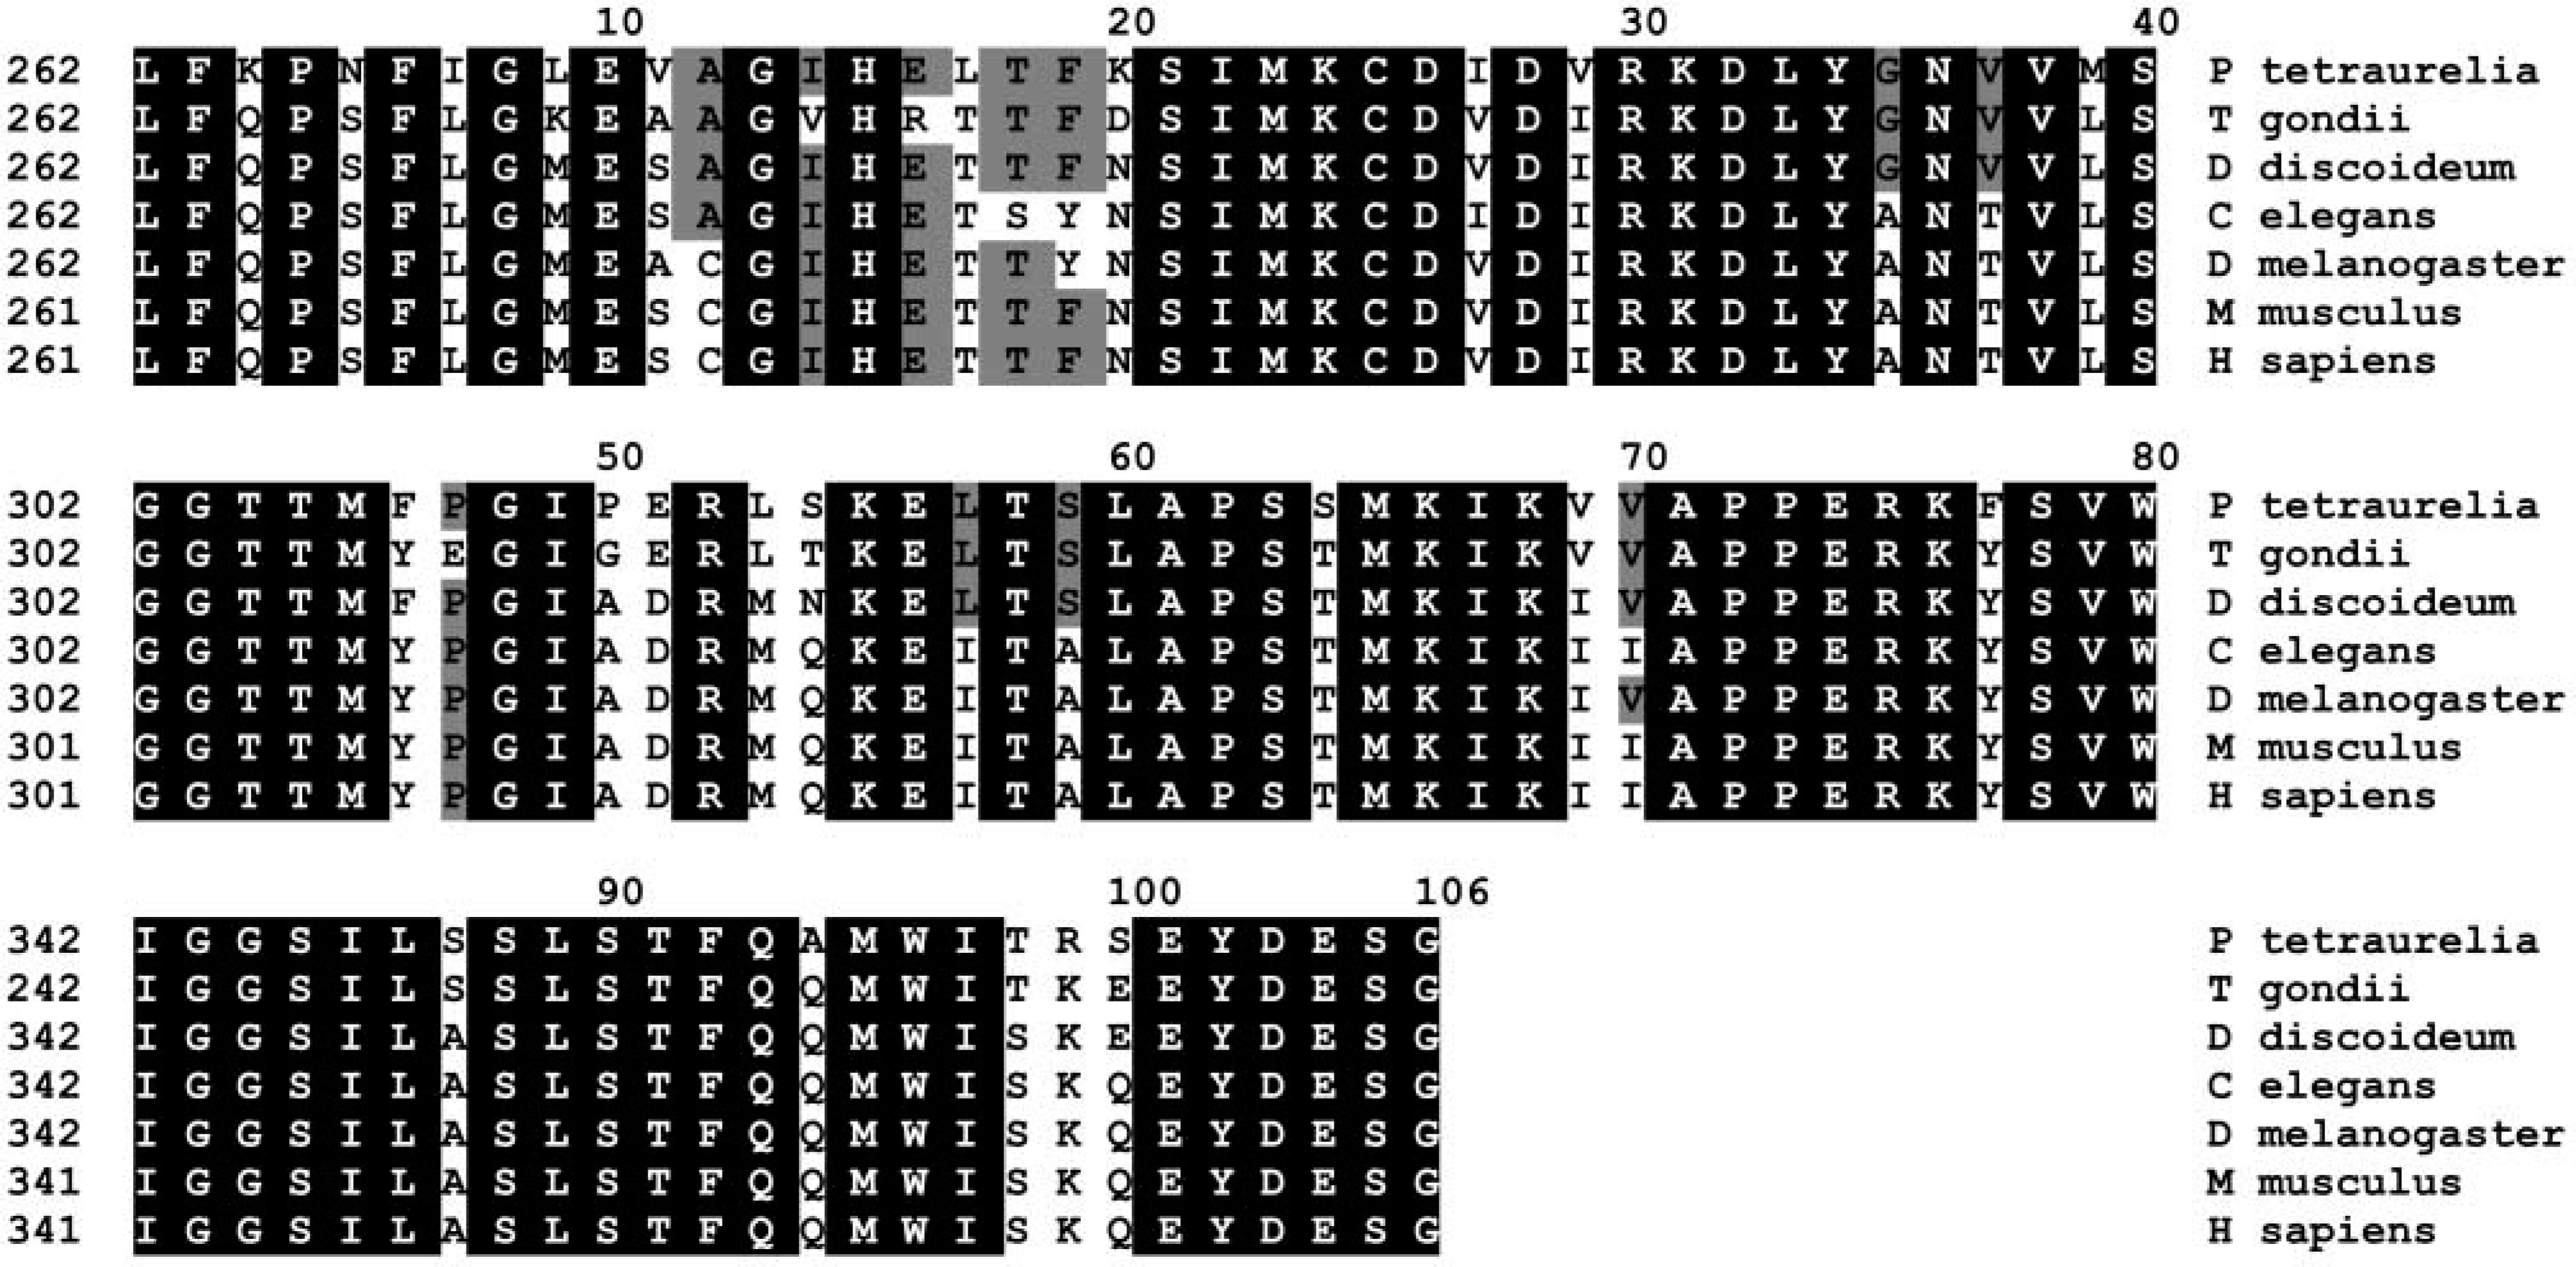
Multiple alignment of the C-terminal region of
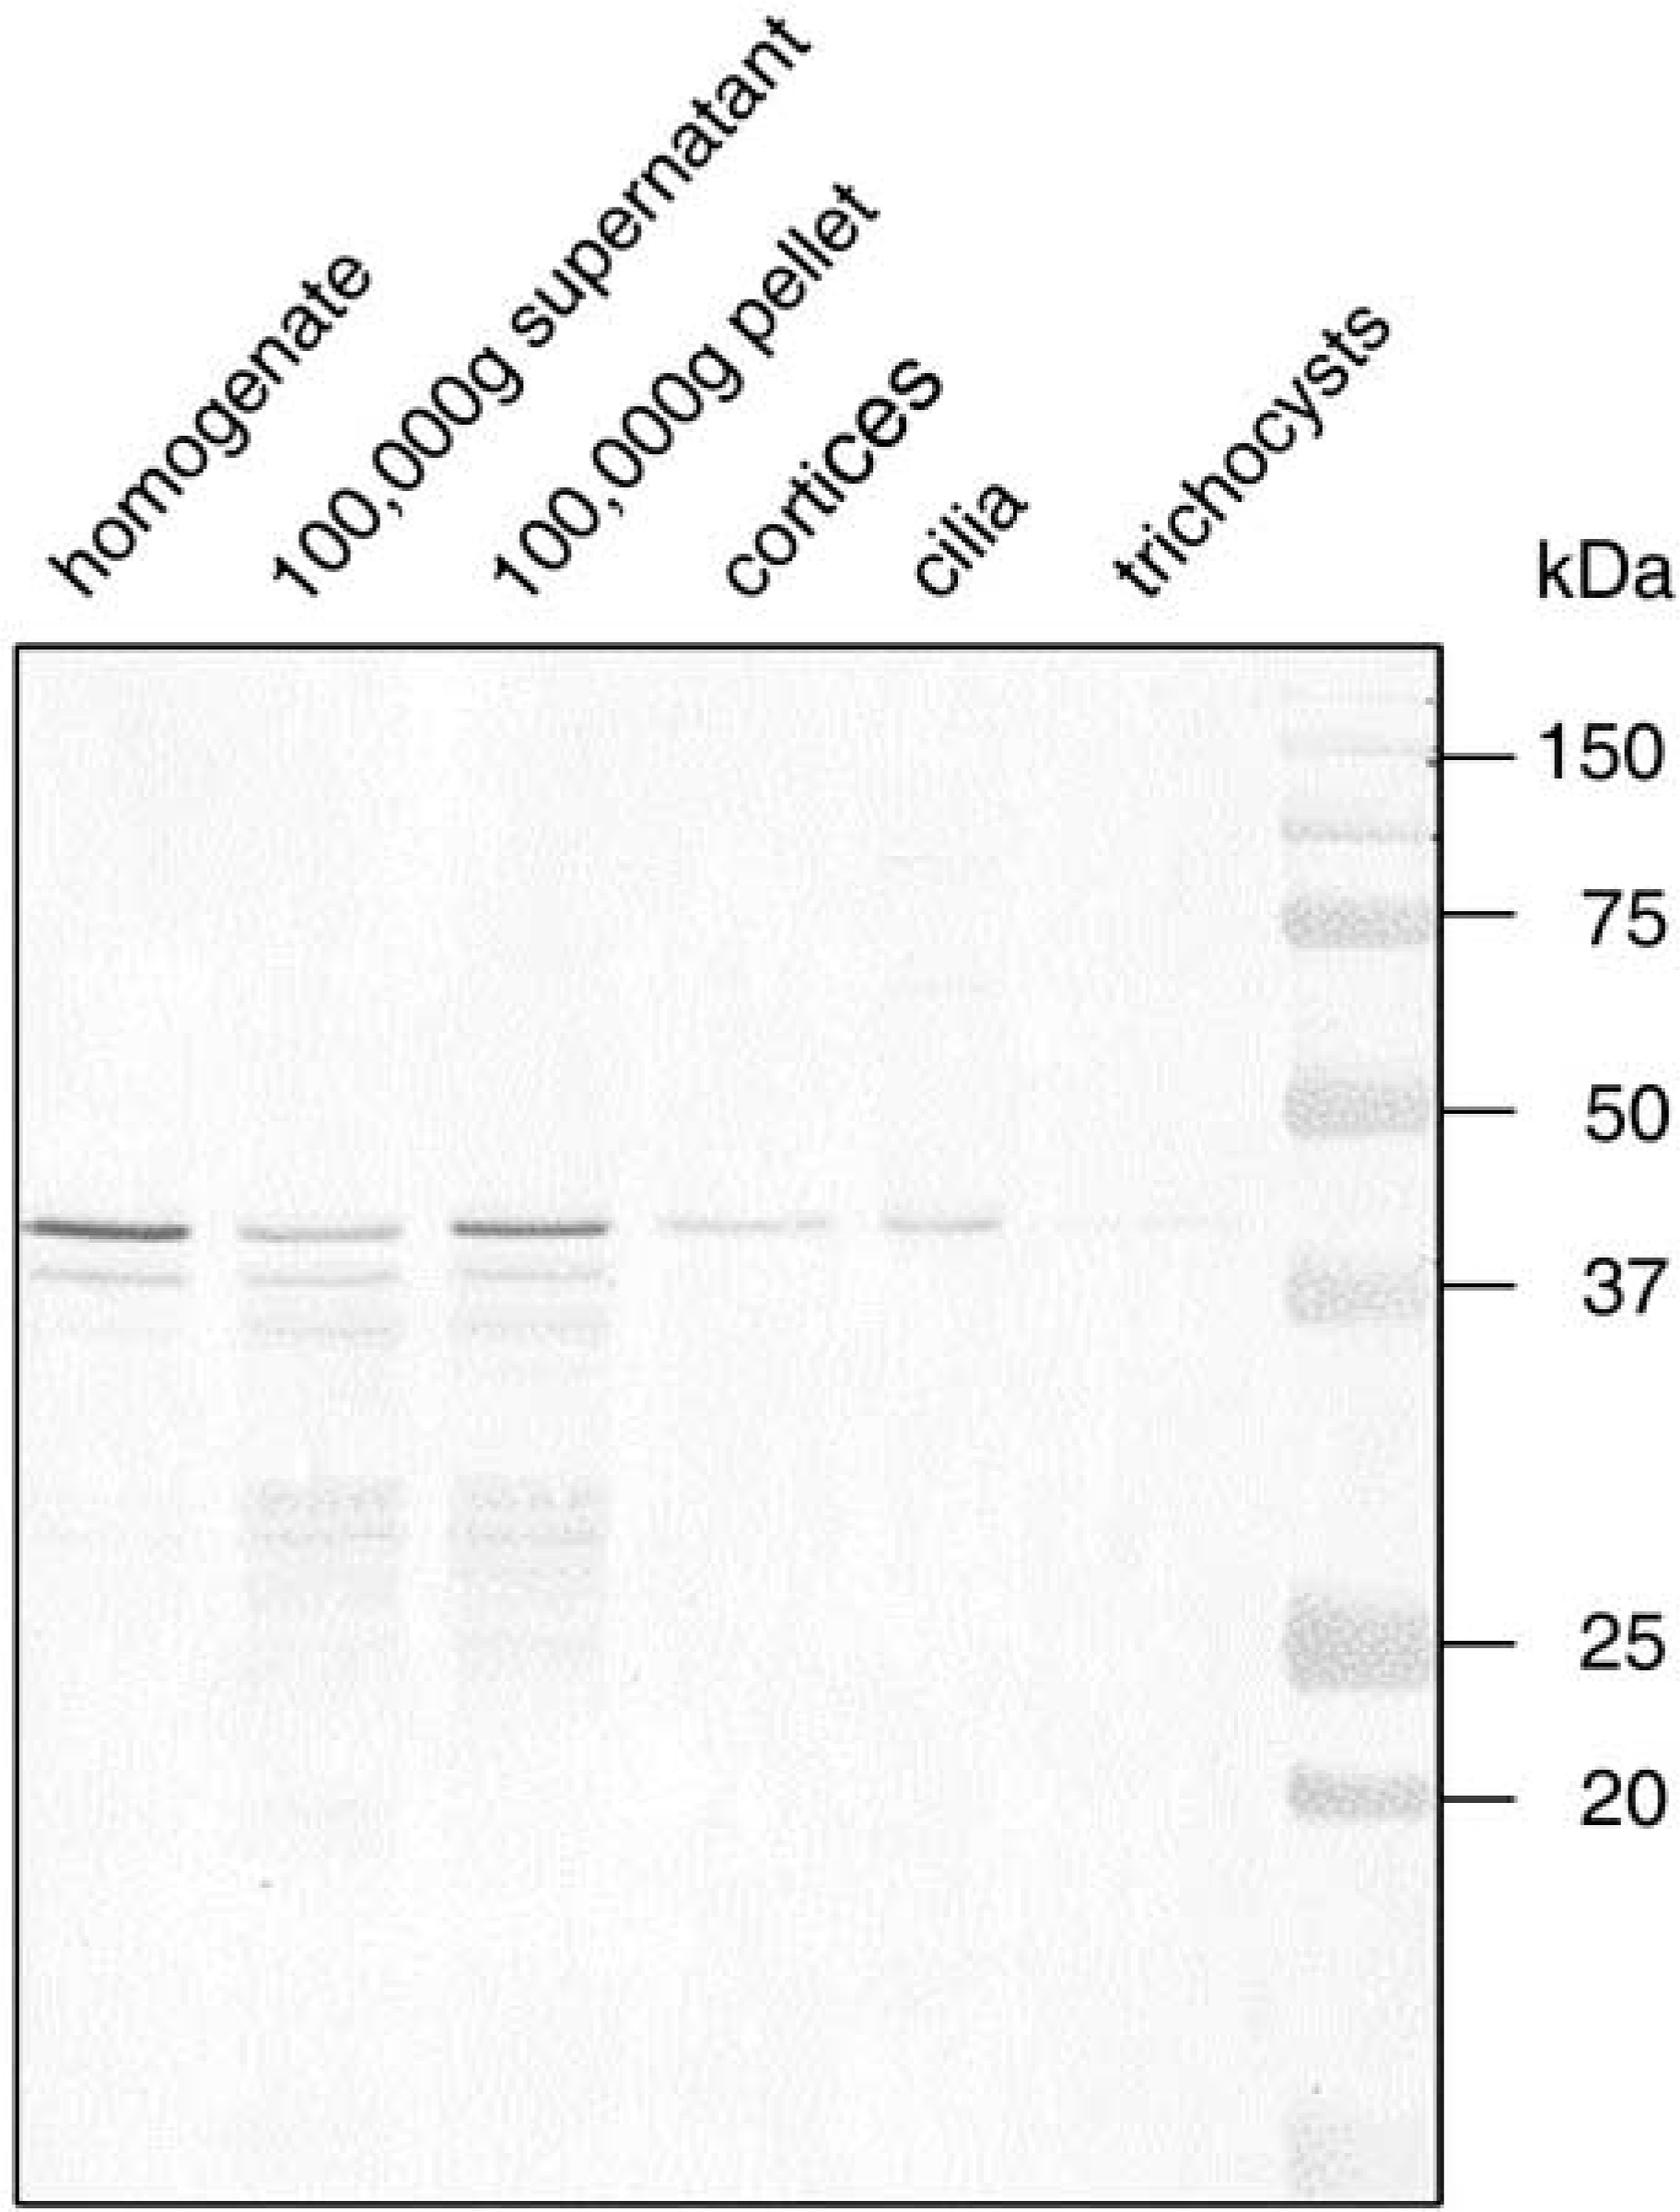
Western blot using affinity-purified anti-actin (
Immunofluorescence Labeling
To account for some variability in the immunofluorescence staining, we present typical extremes of CLSM images from double labeling experiments (Figures 3A-3D), with mouse anti-actin FITC-ABs and rabbit anticentrin Texas Red-ABs, the latter specific for the centrosome in
Figure 3B shows the occurrence of actin around vesicles and vacuoles of various sizes, whereas the position of the red-labeled structures may suggest coincidence with elements of the osmoregulatory system—aspects that have not been followed in any more detail. Figure 3D documents more clearly a cortical actin layer and actin filaments throughout the cytoplasm, frequently in a radial arrangement, and sometimes with local concentration.
We used conventional LM analysis to analyze immuno-FITC labeling of cilia with anti-actin ABs (Figure 4), thus taking advantage of a thicker optical section layer. While intracellular details are largely blurred, ciliary basal bodies and cilia on the outer cell surface are clearly labeled. This may also apply to cilia in the oral cavity, although this is not resolved in Figure 4.
Comparative Analysis of CLSM and Immunogold EM Labeling
For most results achieved by CLSM analysis, we find equivalents in the immunogold EM analyses (Figures 5 to 11), as specified below and summarized in Table 1. Off-cell background is low [2.15 gold grains per μm2 ± 0.85 (SEM)], as it is on irrelevant structures, such as mitochondria, trichocyst contents, and alveolar sacs (2.2, 1.4, and 0.3 gold grains per μm2, respectively).
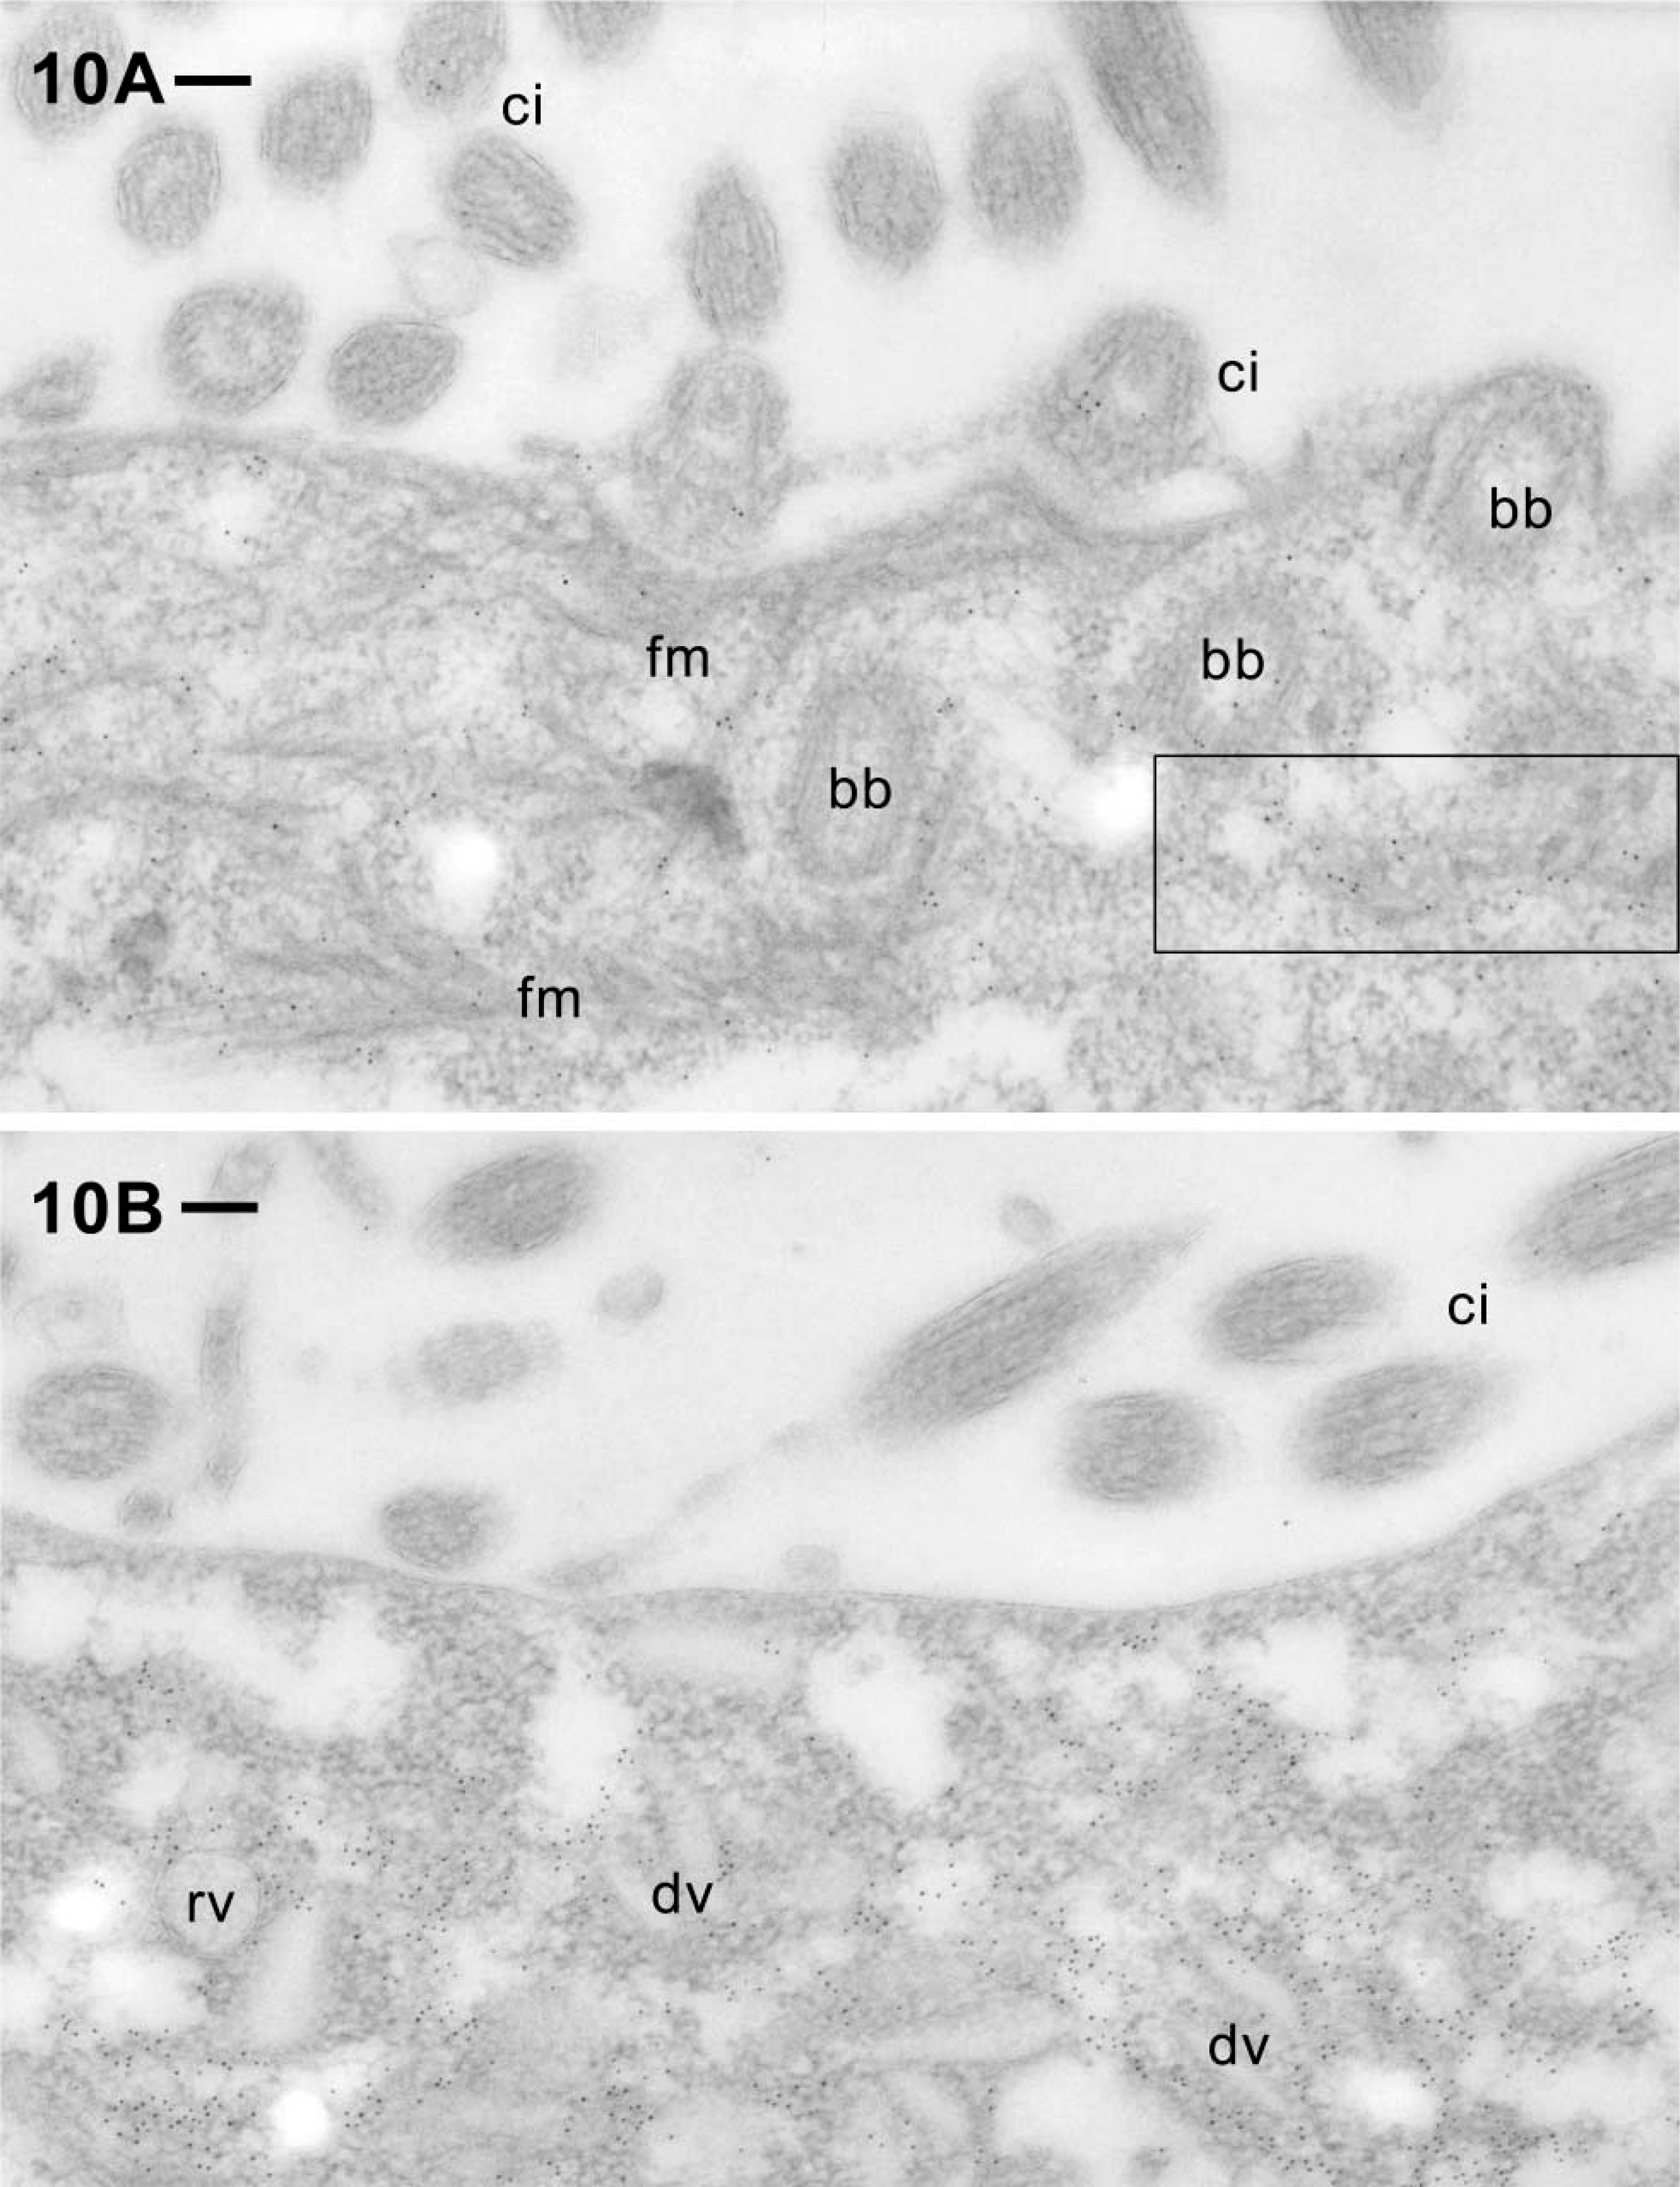
After postembedding labeling, gold granules are scattered, yet with specific concentration zones over the cytosolic compartment. This holds for the cell cortex (Figures 6 to 8) with its ciliary basal bodies, as well as for regions adjacent to the oral cavity, including a zone enriched in ciliary basal bodies (Figure 10A) and a zone enriched in recycling vesicles (discoidal vesicles) dedicated to phagosome formation (Figure 10B). It also holds for regions deeper inside the cytoplasm where elements of vesicle trafficking are enriched (Figure 11). Cilia are also labeled at the EM level (Figures 5 and 10, Table 1), just as with the other methods used (Figures 2 and 4). In sum, there is good agreement between LM and EM labeling. Because the cytoproct shows up rarely, we were unable to analyze it at the EM level.
Figure 9 represents experiments with digitonin-permeabilized cells, showing AB-gold labeling in the narrow subplasmalemmal space between the plasmalemma and the outer side of alveolar sacs, while there is only spurious label occasionally seen after mere section labeling (Figures 5 and 7). Apart from this aspect, little label only is seen in the cell cortex with permeabilized cells (Figure 9). While digitonin permeabilization may be more appropriate than section labeling to show the presence of some actin in the very narrow outermost cytosolic space, particularly when enhanced by additional postembedding labeling (Figure 9), it may cause a serious overall loss of antigen. The abundance of cortical label after postembedding labeling justifies reliance in this study mainly on the postembedding procedure for further evaluation. Concomitantly, all figures presented with the exception of Figure 9 were obtained by this method.
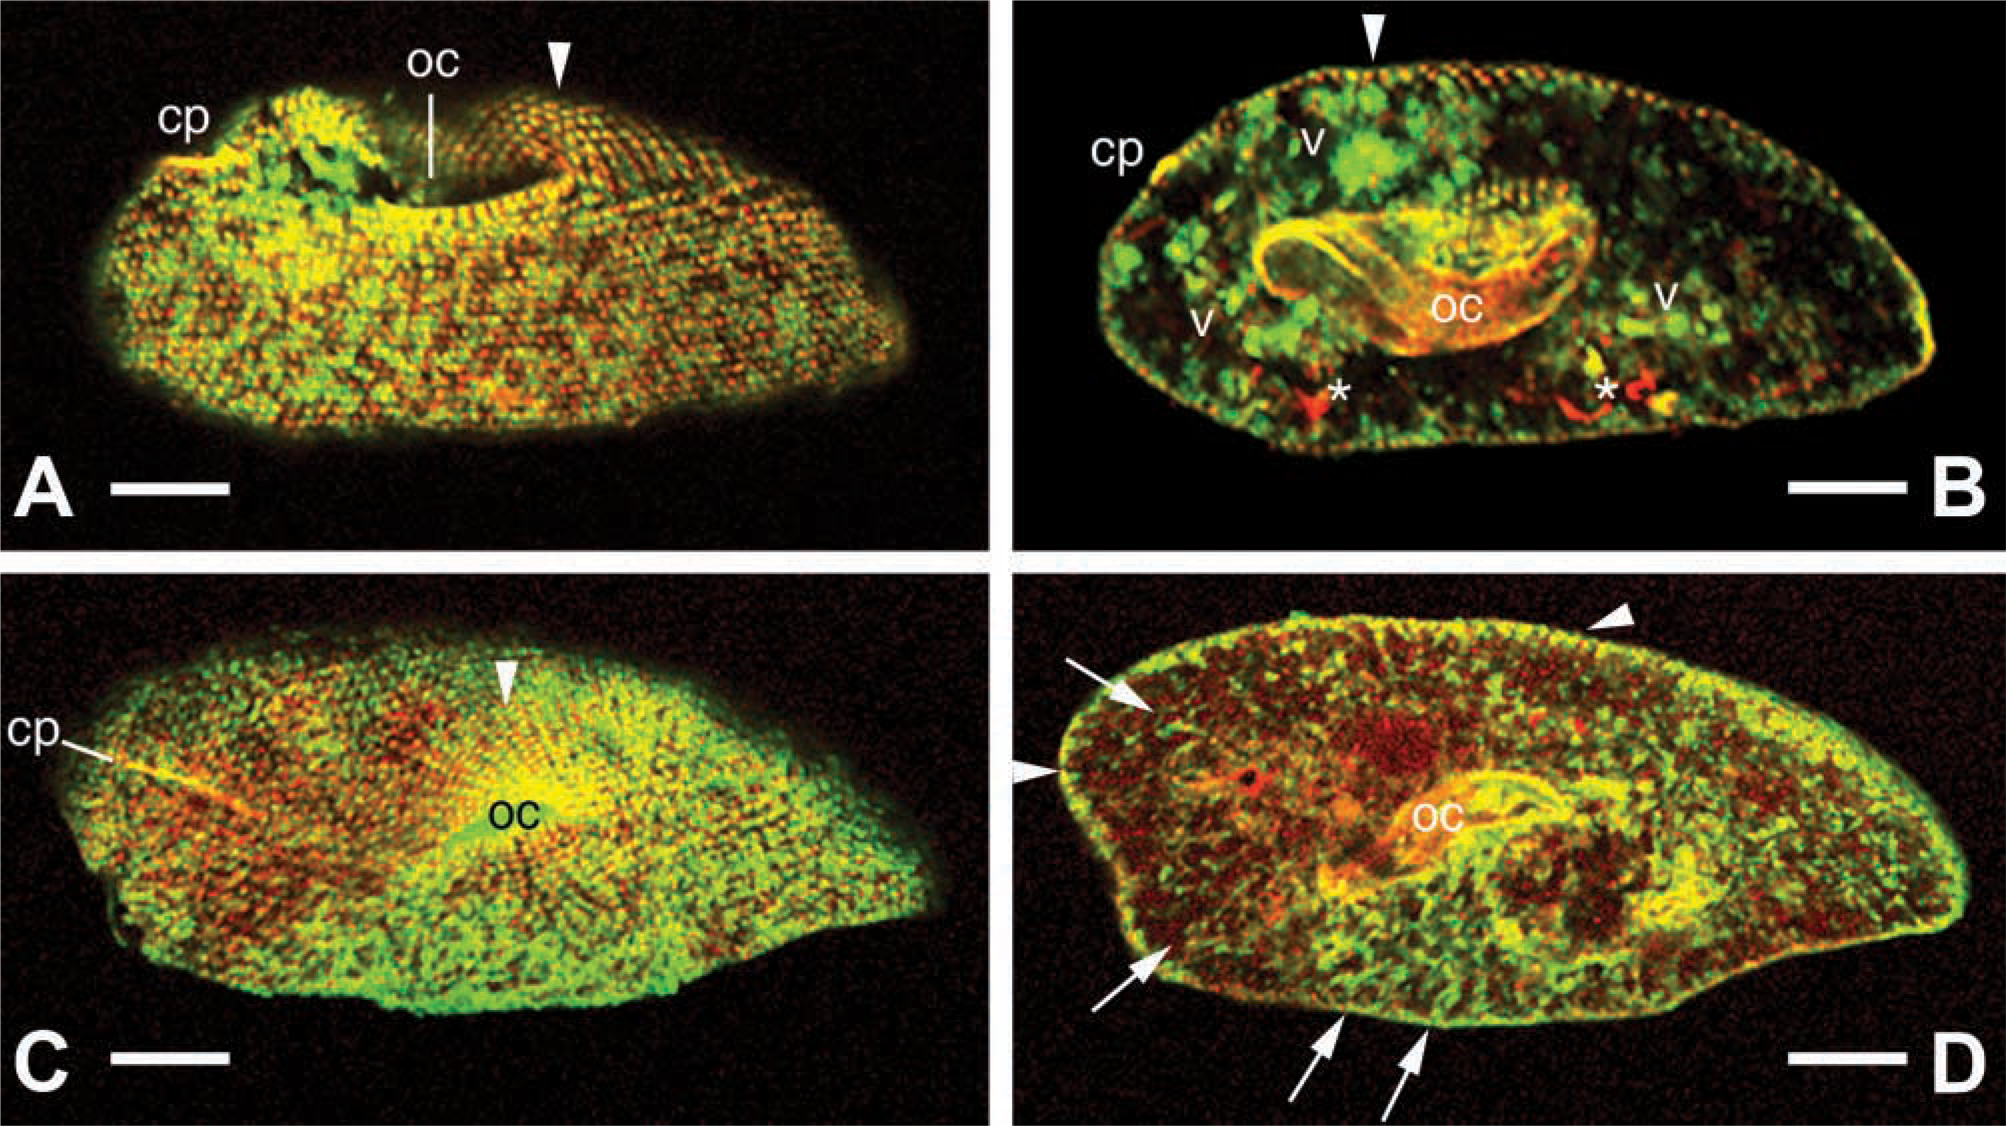
Colocalization of actin and centrin (yellow) by CLSM using mouse ABs against actin (green) and rabbit ABs against centrin (red). Two deciliated cells (
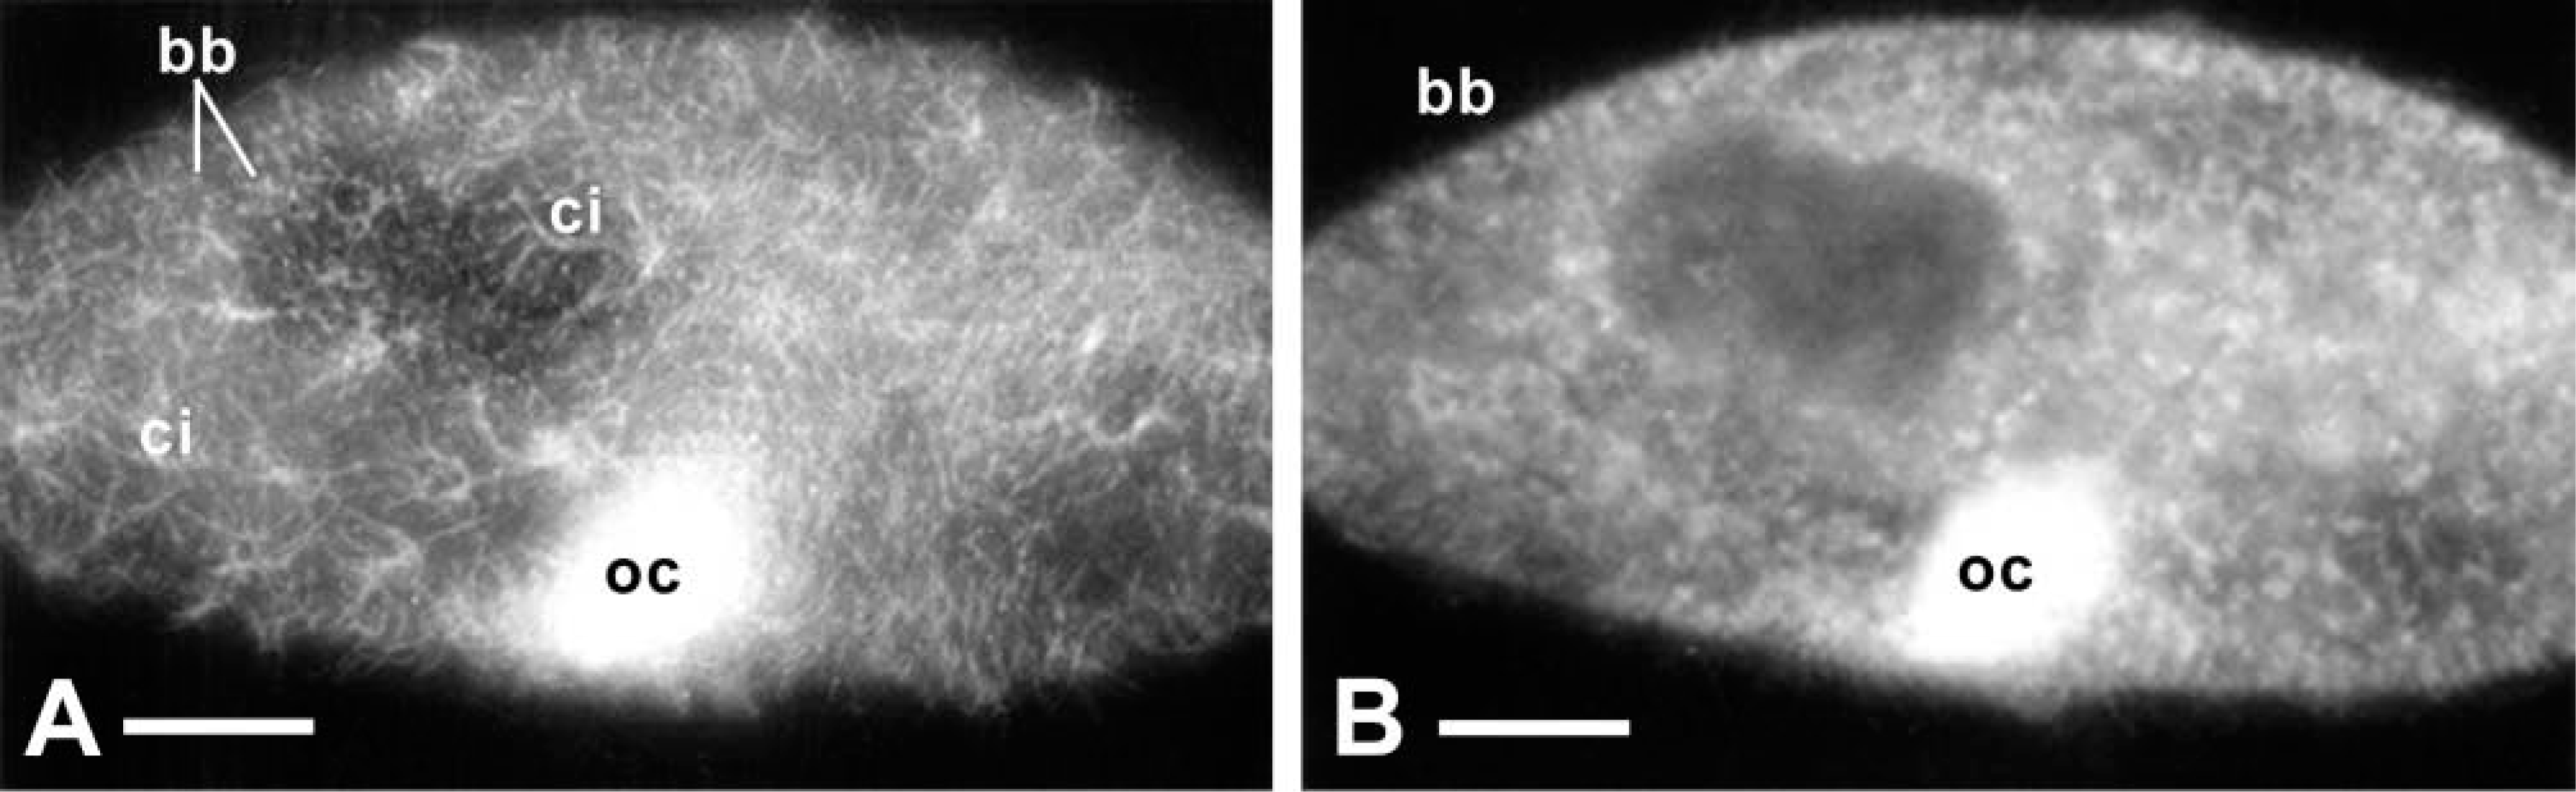
Conventional anti-actin AB-fluorescence image of a cell permeabilized under conditions preserving cilia. (
Specification of Results Obtained with Postembedding Labeling
Beyond the general labeling of the cytosolic compartment of the cell cortex (Figures 5 to 8), we recognize that gold granules are enriched to a variable extent in a variety of structures.
The cytoplasm of cell surface ridges, typical of ciliated protozoa, are labeled (Figures 5 and 6). This also holds for the cytoplasm surrounding the tips of the elongate trichocyst organelles, as shown in cross-section (Figures 5 and 6) and in longitudinal section (Figure 7). The gold label associated with cortical basal bodies is somewhat variable and may in part sit inside this structure, as shown particularly in Figure 8B, where it shows up below the basal plate (Figure 8A). Gold label also occurs adjacent to cortical basal bodies, e.g., in the filamentous mass in Figure 6. This material is associated with the origin of a kinodesmal fiber emanating from a basal body from where the infraciliary lattice also emanates. From there, these filament bundles pass near adjacent trichocyst tips (Figure 5), as established by Allen (1971, 1988). Although the bulk of the latter filament system is made of centrin (Beisson et al. 2001), some actin clearly appears to be associated with it. Gold label also surrounds ghosts from discharged trichocysts (Figure 6).
Table 1 summarizes labeling densities on a quantitative level (gold grains per μm2). These are, in decreasing magnitude, as follows: 301.0 Au/μm2 for cytoplasmic regions around oral cavity and around food vacuoles, 141.5 for cell surface ridges, 111.9 for immediate surroundings of trichocysts, between 89.5 and 95.6 for infraciliary lattice, ciliary basal bodies, and cilia, followed by cortical cytoplasm (37.8) and the complex formed by the plasma membrane and the outer alveolar sacs membrane (25.9 Au/μm2). For statistics, see Table 1.
While the abundant filament bundles located in the cytoplasm around the oral cavity are made of materials other than actin (see “Discussion”), the distinct labeling in between such bundles (Figure 10A) again indicates association with actin. As in the cell cortex, some label may be associated with ciliary basal bodies around the oral cavity. Furthermore, we find intense labeling of cytosolic regions enriched in vesicles accumulated near the cytopharynx (Figure 10B). Many are oblong and thus represent discoidal vesicles known to serve membrane recycling from the cytoproct, i.e., formation of new phagocytic vacuoles (Fok and Allen 1988; Allen and Fok 2000). In these domains of the cell, less labeling is seen immediately below the cell membrane than between the adjacent round and discoidal vesicles.
Deeper inside the cell, small vesicles of different diameters are embedded in considerably labeled cytosol, frequently in close association with a large vacuole (Figures 11A and 11B). This arrangement suggests their identity either as lysosomes or as acidosomes in typical arrangement with phagosomes. These interpretations are suggested by the work of Allen and Fok (2000); e.g., considering the flat shape of the large vacuole indicating an early biogenetic stage of a food vacuole. Figure 11B shows association of actin label with parallel microtubular aggregates, the gold label unilaterally concentrated at sites where microtubules enter the section plane. Also in Figure 11B, a heavily labeled “trail” is in direct extension of the adjacent microtubular bundle. This indicates involvement of actin in phago-lysosomal vesicle trafficking, although after the preparation protocol required for immunogold analysis, distinct filaments are difficult to recognize. However, some of these gold aggregates may be the equivalent of the fluorescent strands visualized by anti-actin ABs in Figure 3.
Discussion
Background from Previous Work
Occurrence of most actin in
Previous attempts to localize actin in
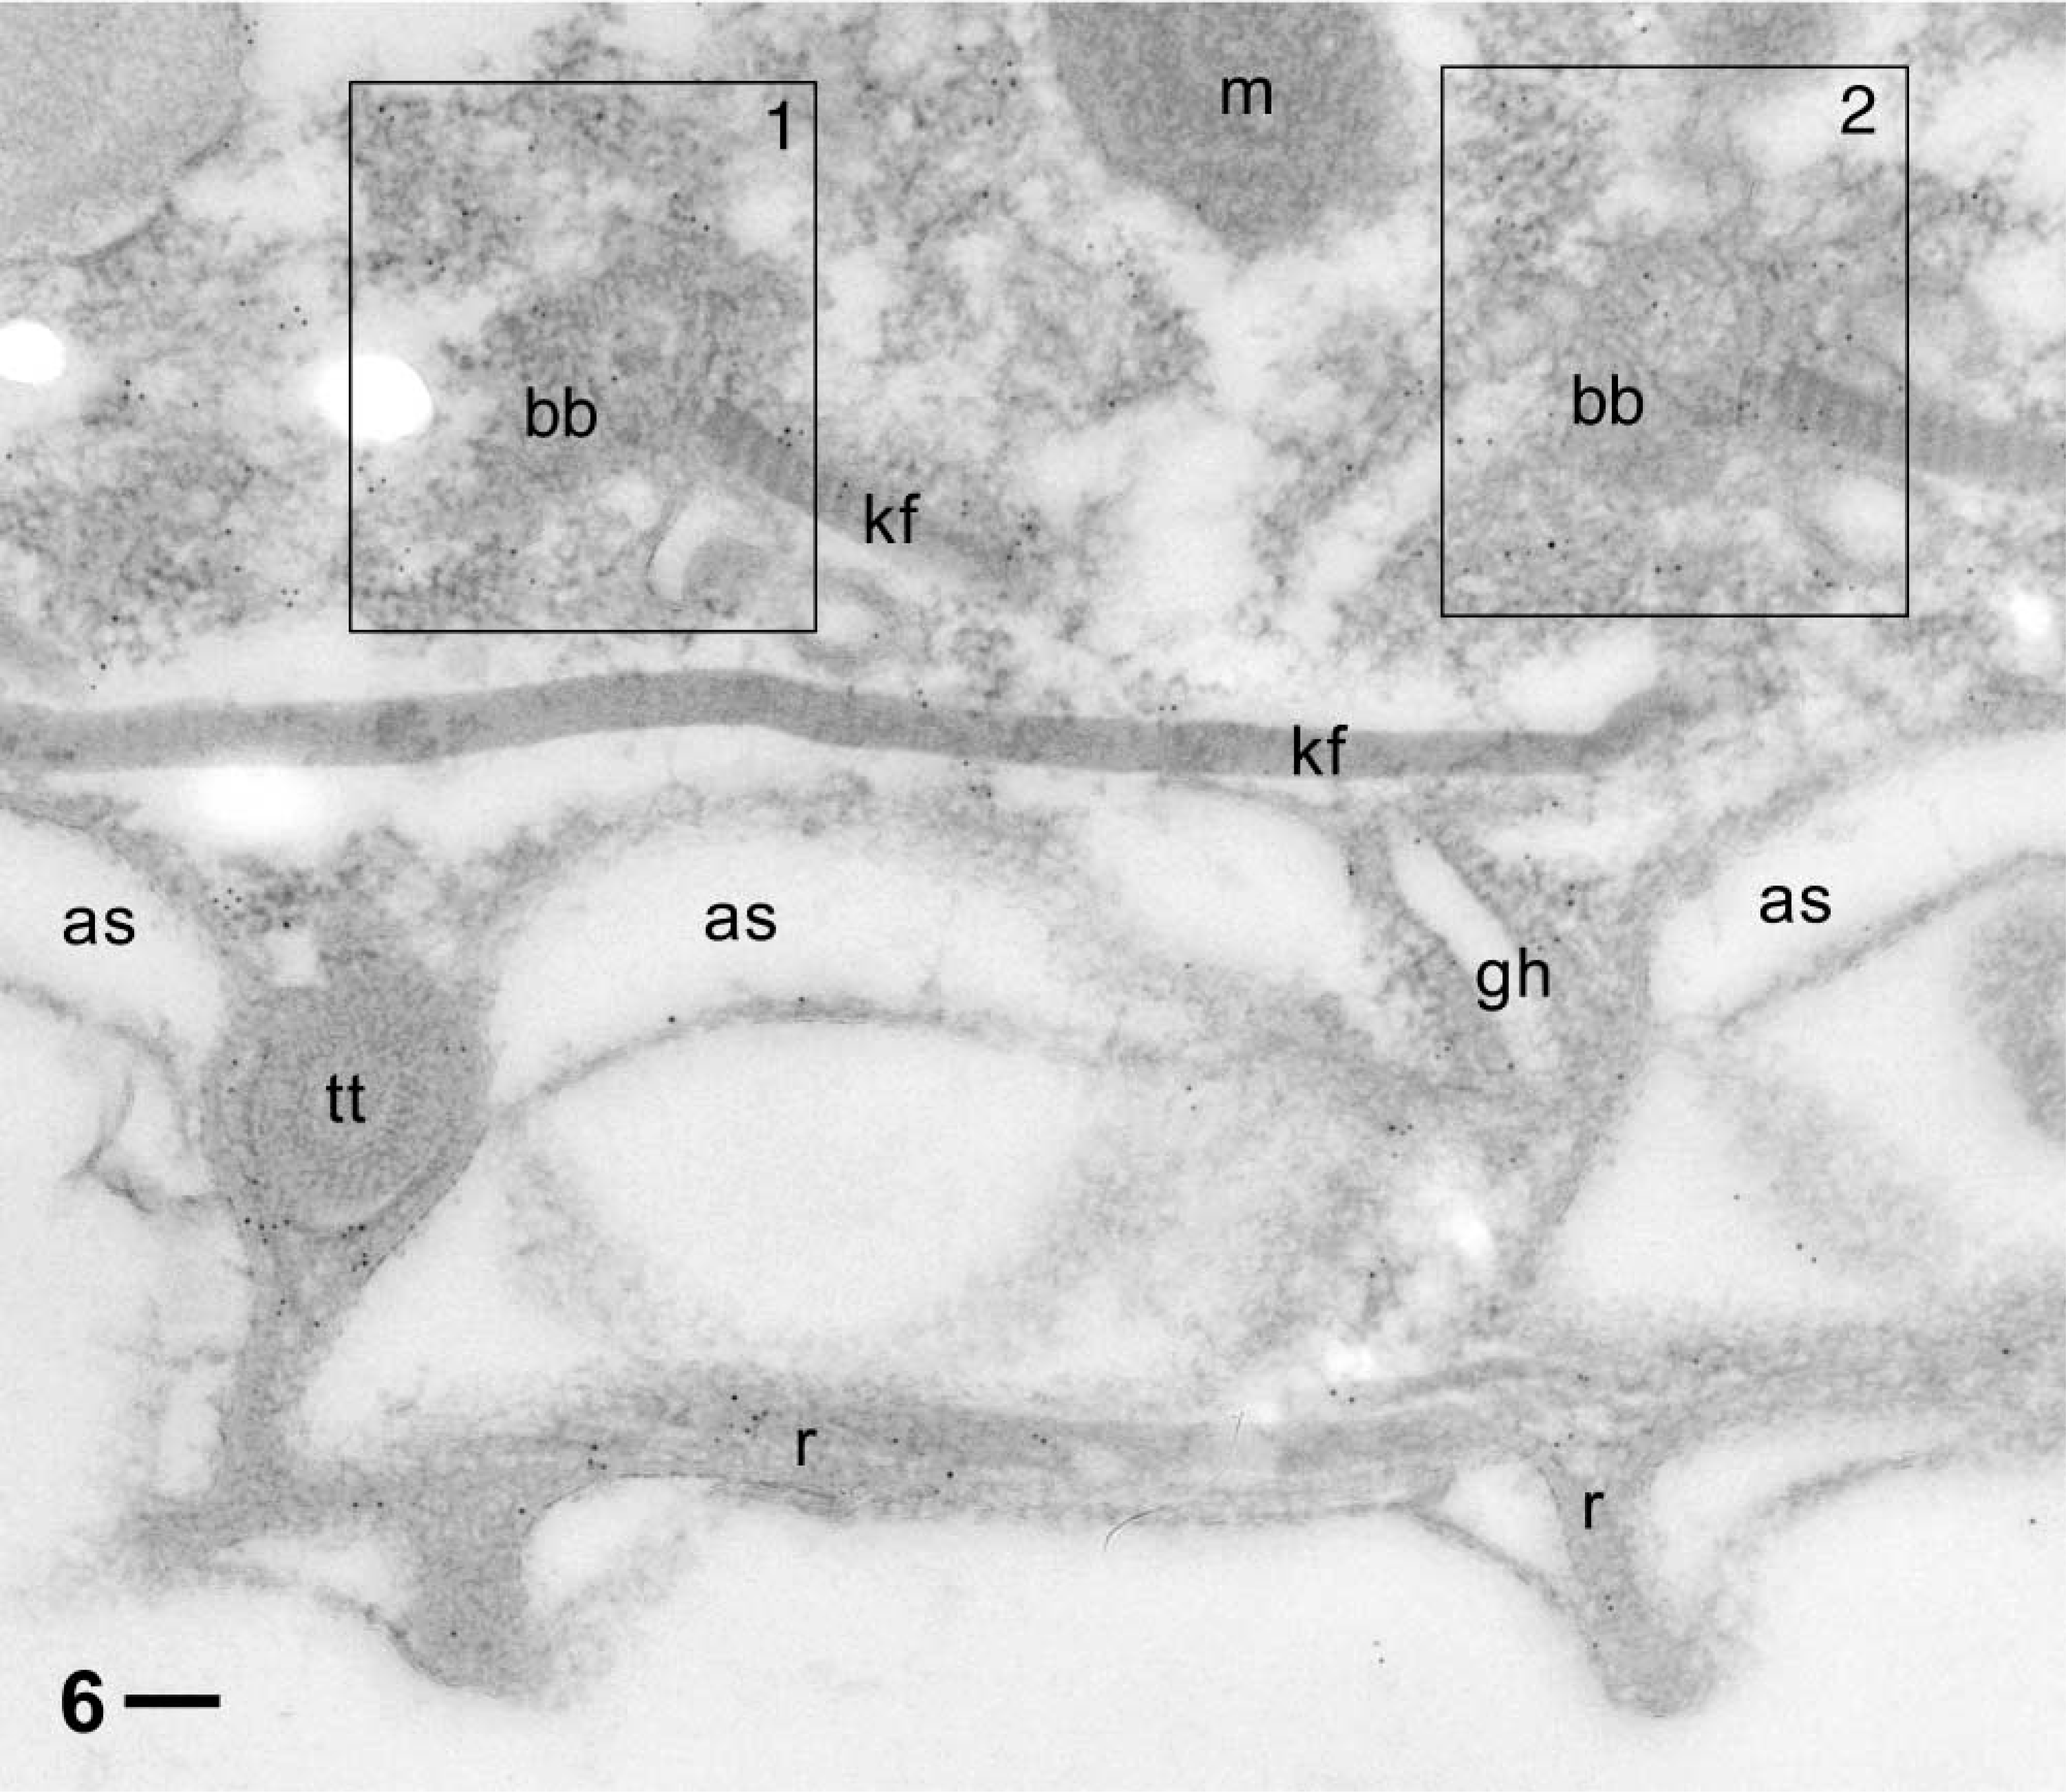
Similar situation as in Figure 5, but in addition with more distinct label around a trichocyst tip (tt) and a ghost (gh) from a released trichocyst, and much less in diffuse association (frames 1, 2) with two basal bodies (bb) from which typically kinodesmal fibers (kf) originate. Cell surface ridges (r) are also labeled. Note almost absence of label outside the cell or inside alveolar sacs (as), the trichocyst tip and ghost, as well as in a mitochondrion (m). Bar = 0.1 μm.
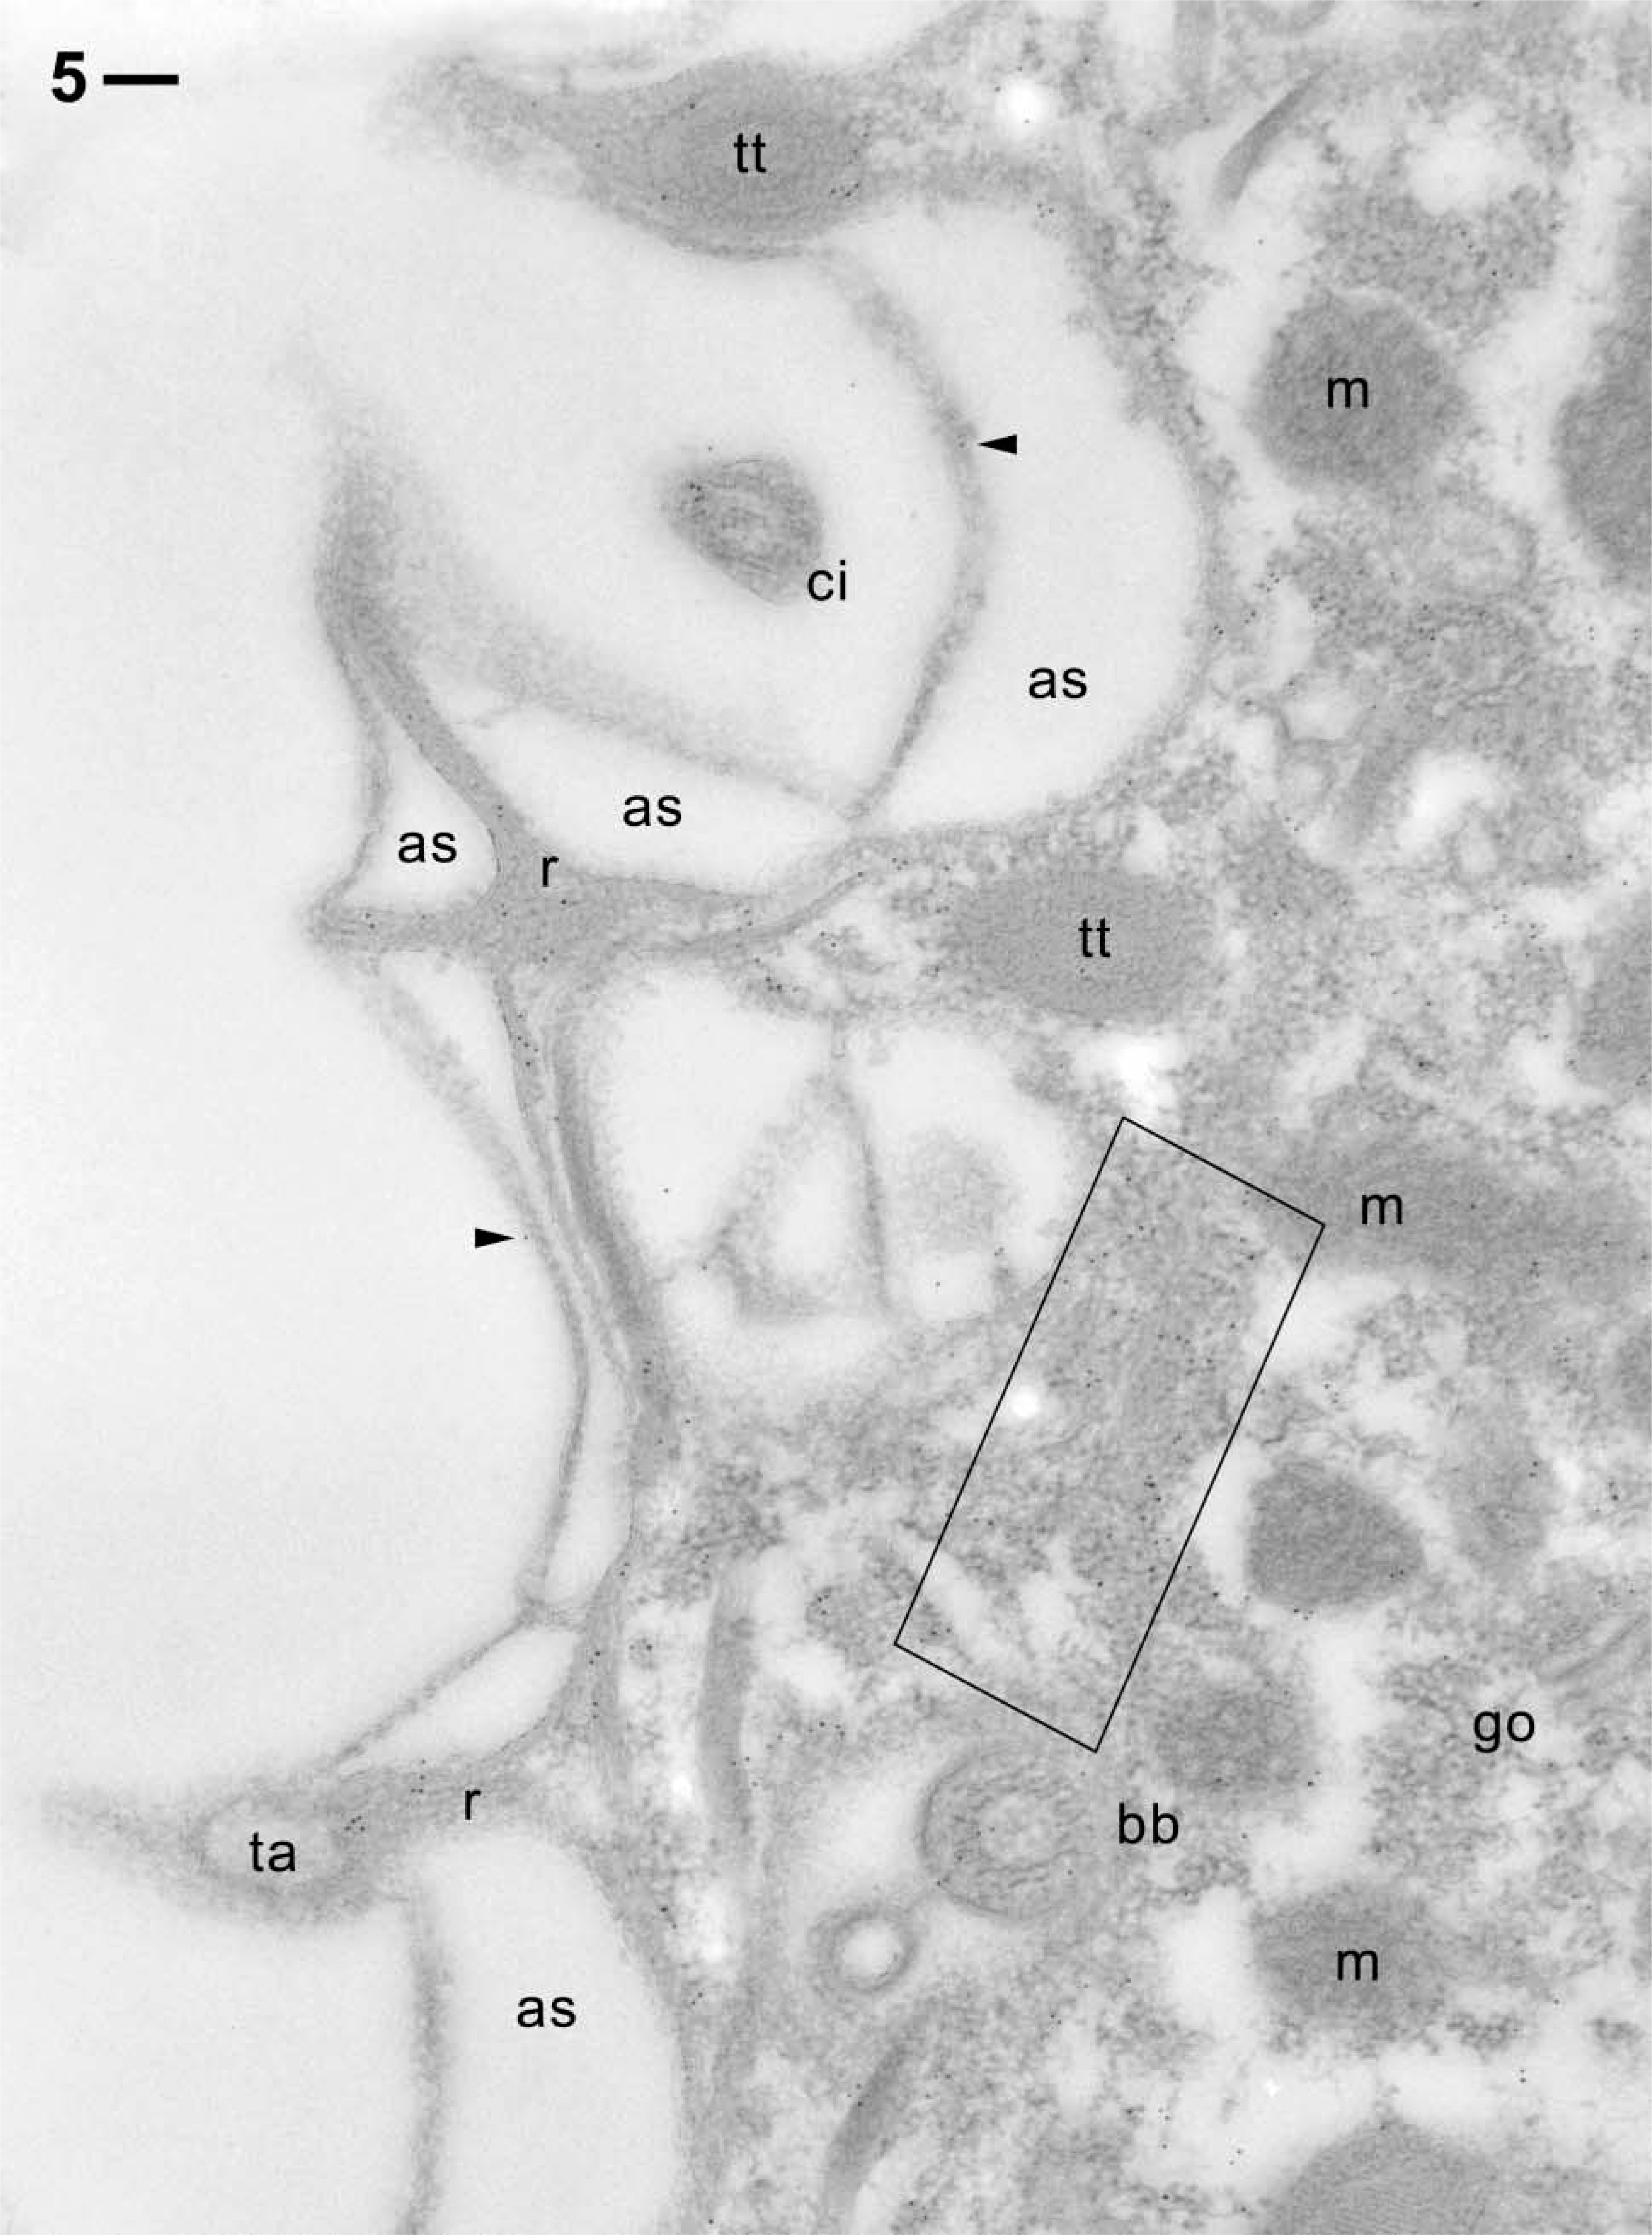
Postembedding immunogold labeling in the cell cortex. Note almost absence of background outside the cell and within membrane-bound organelles such as alveolar sacs (as), trichocyst tips (tt), mitochondria (m), and a Golgi field (go). This is in contrast to the occurrence of clear, though scattered, labeling of cytoplasmic ridges (r) typical of the
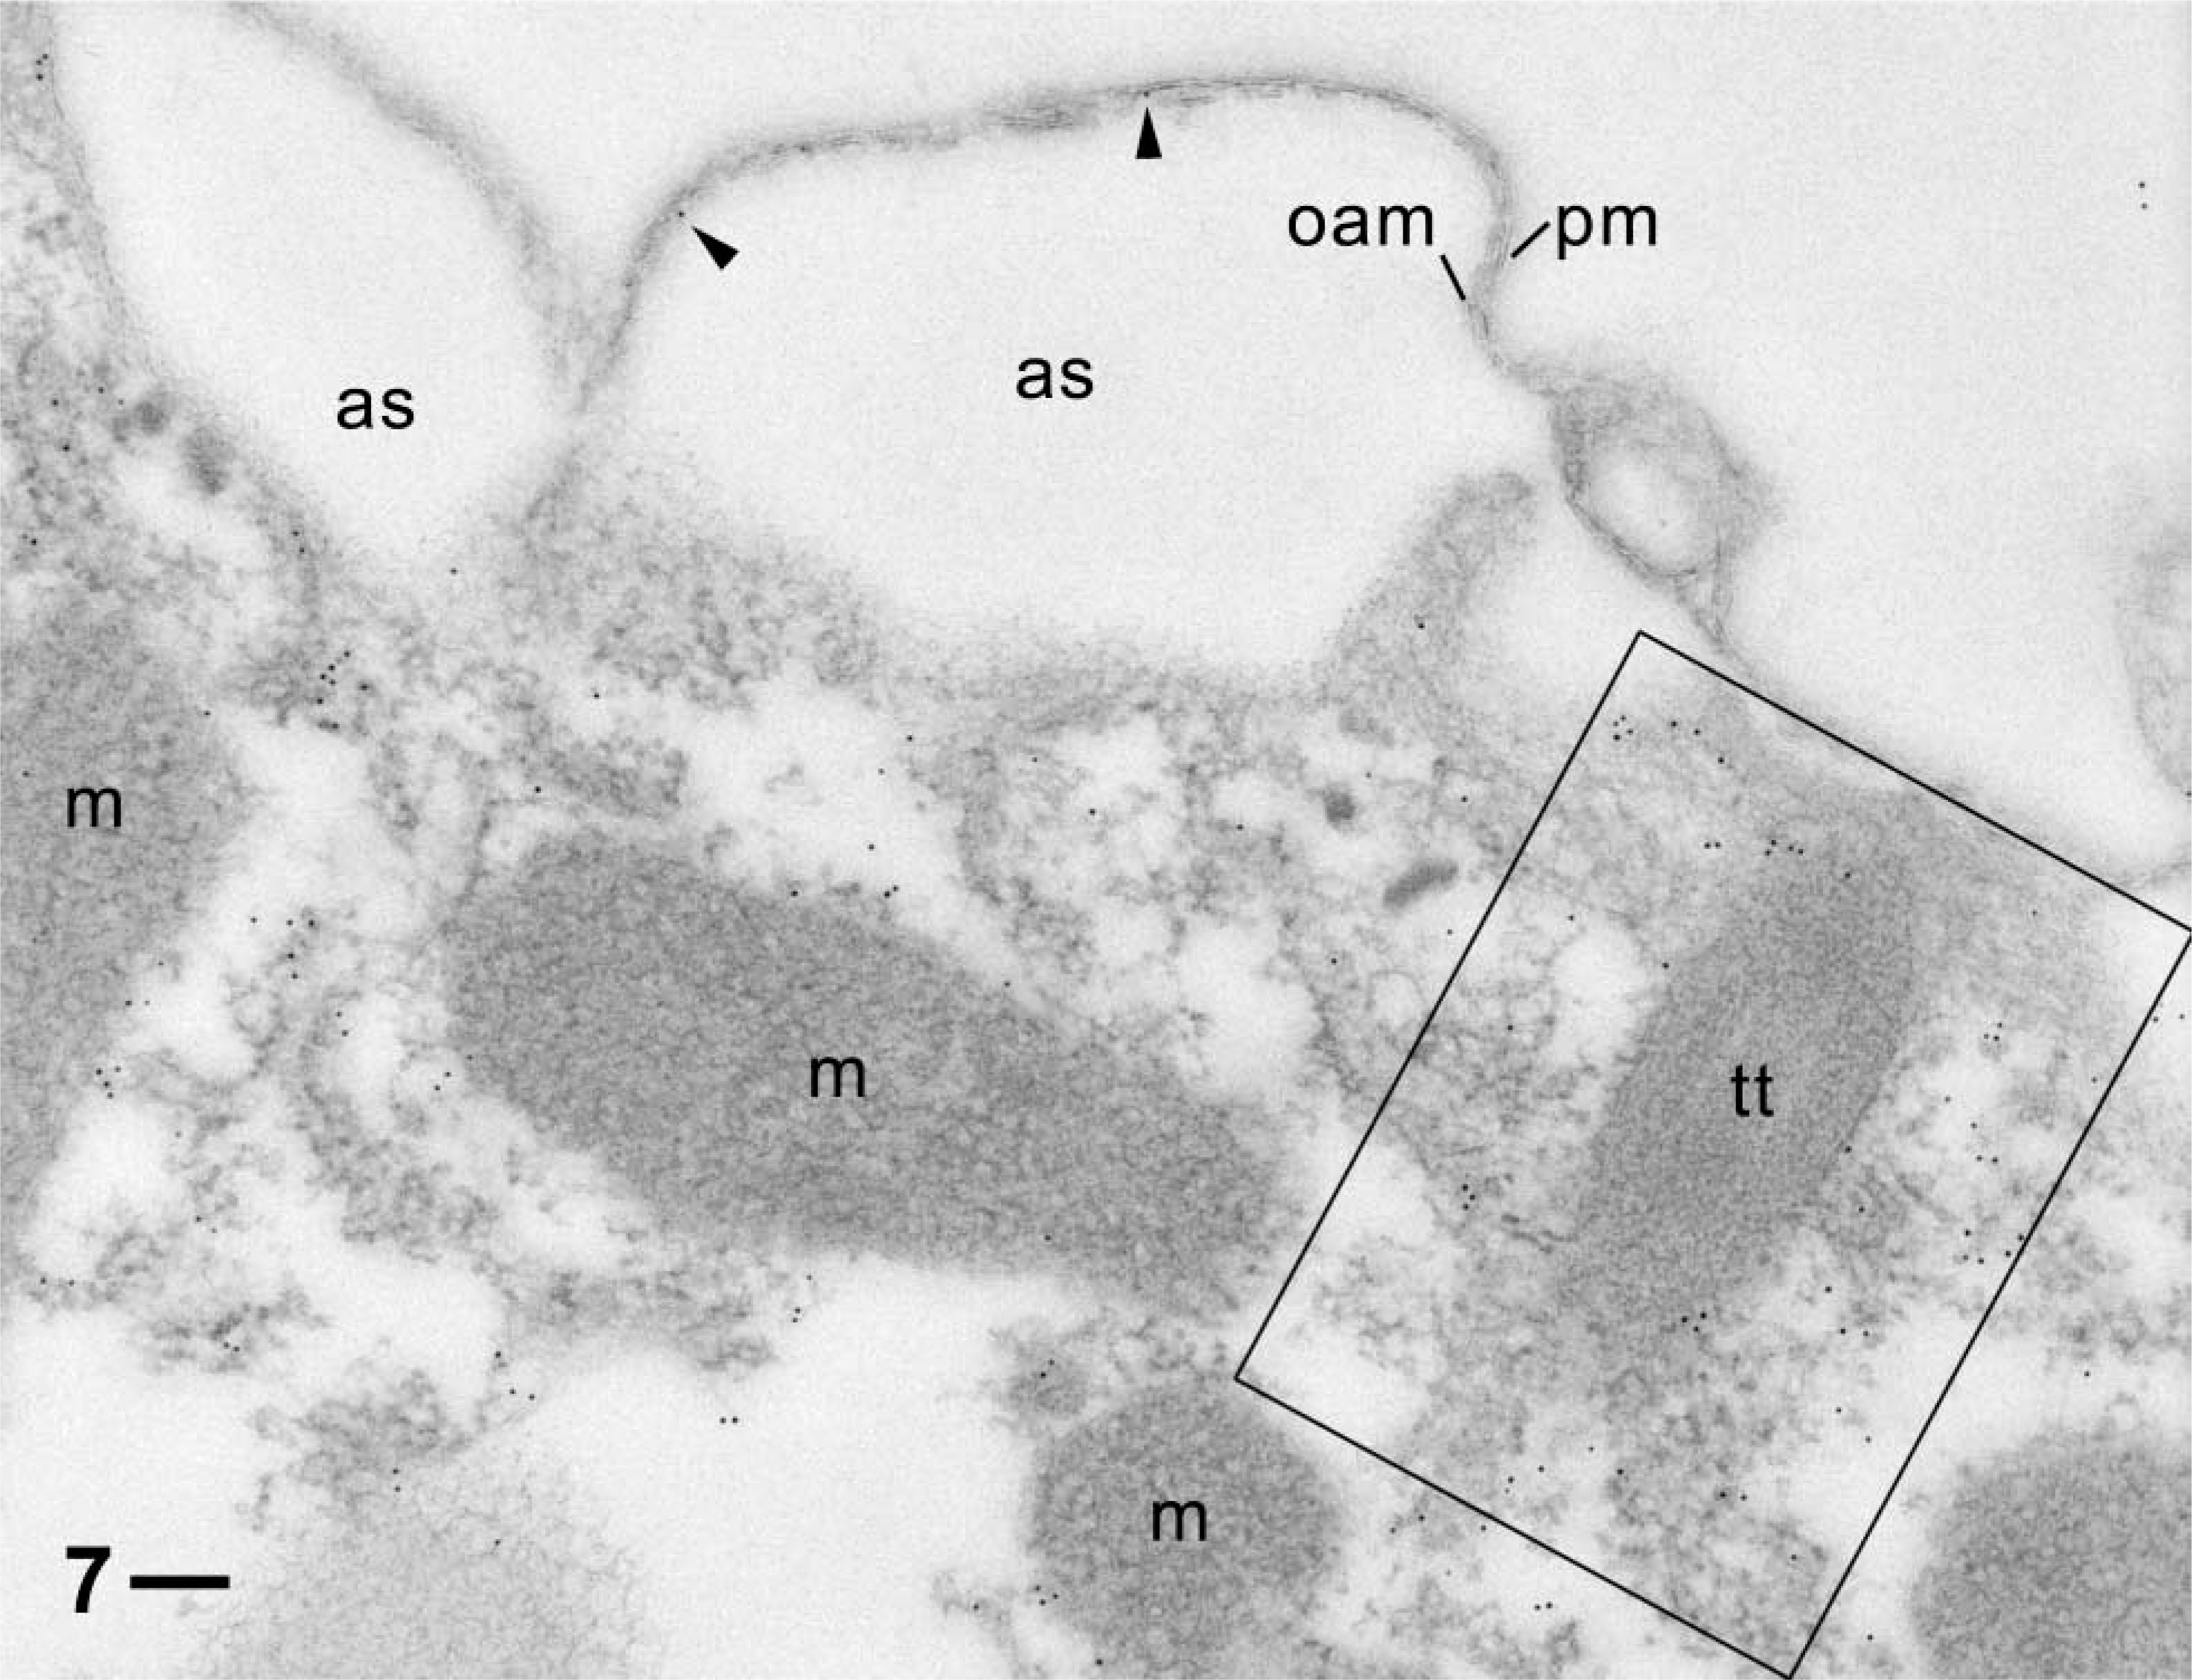
Similar situation as in Figures 5 and 6, but with more clearly visible label (rectangle) particularly surrounding a longitudinally cut trichocyst tip (tt) and occasional label (arrowheads) in the very narrow subplasmalemmal space between the plasma membrane (pm) and the outer alveolar sacs membrane (oam). Note absence of label from the off-cell region, alveolar sacs (as), and mitochondria (m). Bar = 0.1 μm.
Additional Functional Aspects Derived from This Study
Cortical F-actin is generally required for cyclosis—an actomyosin-based process (Shimmen and Yokota 2004). This is a permanent ongoing process also in
Our present EM analysis verifies that in the
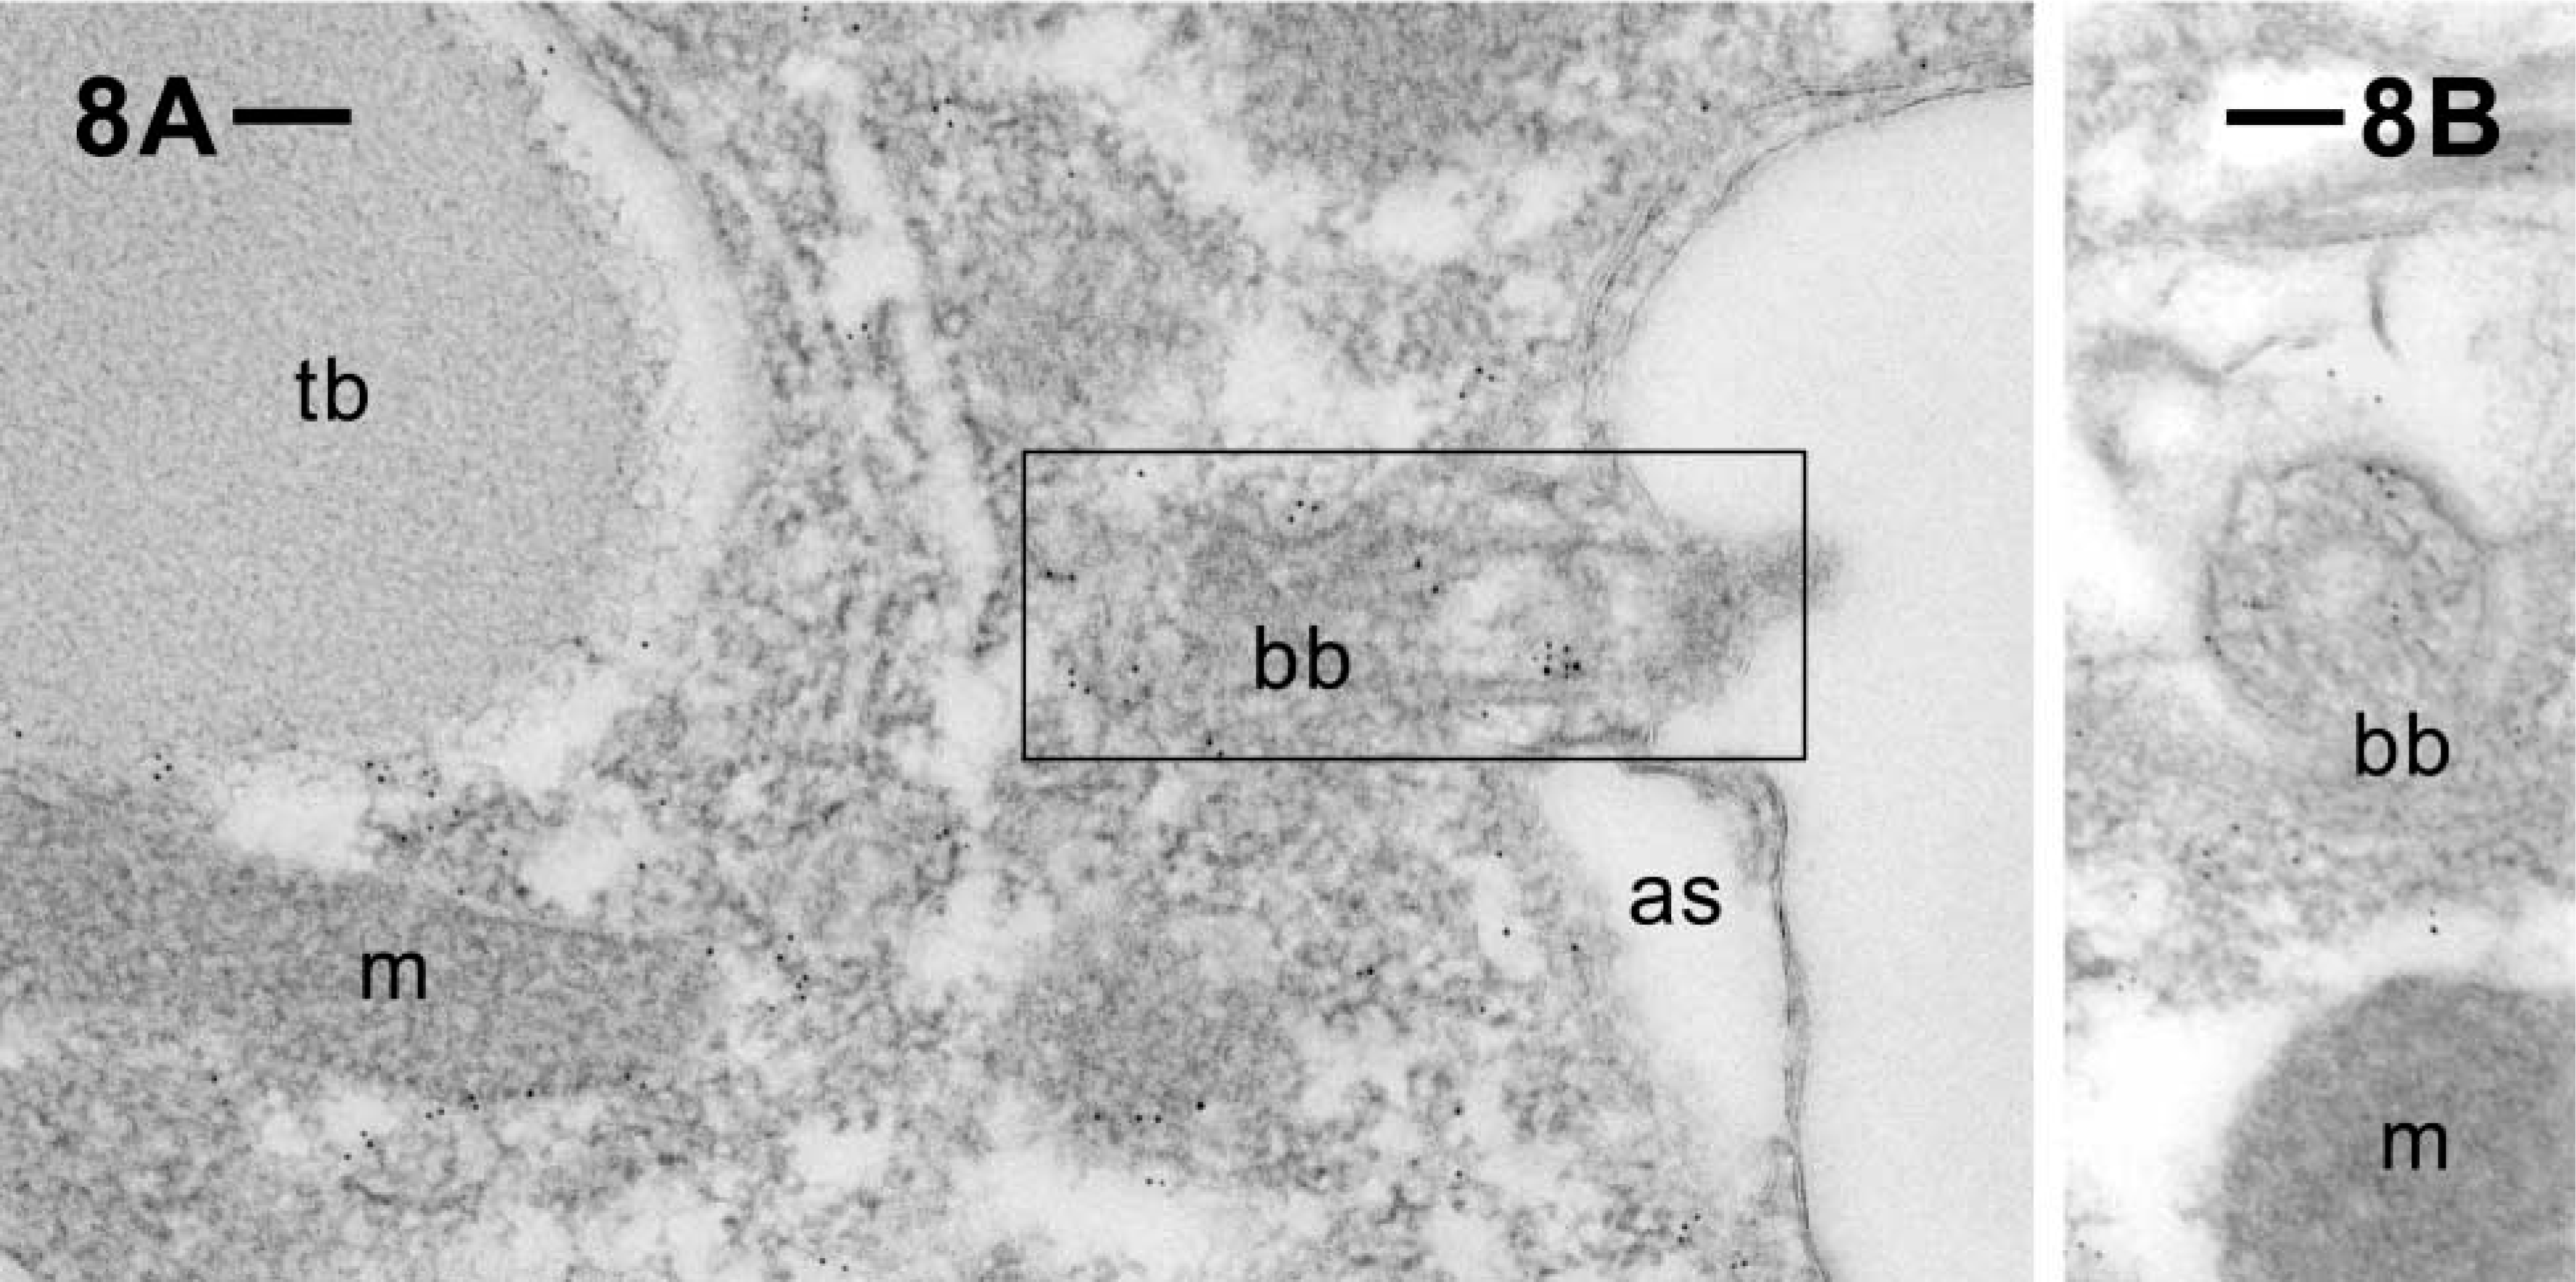
Postembedding immunogold labeling of ciliary basal bodies (bb) located on the outer cell surface, in longitudinal (
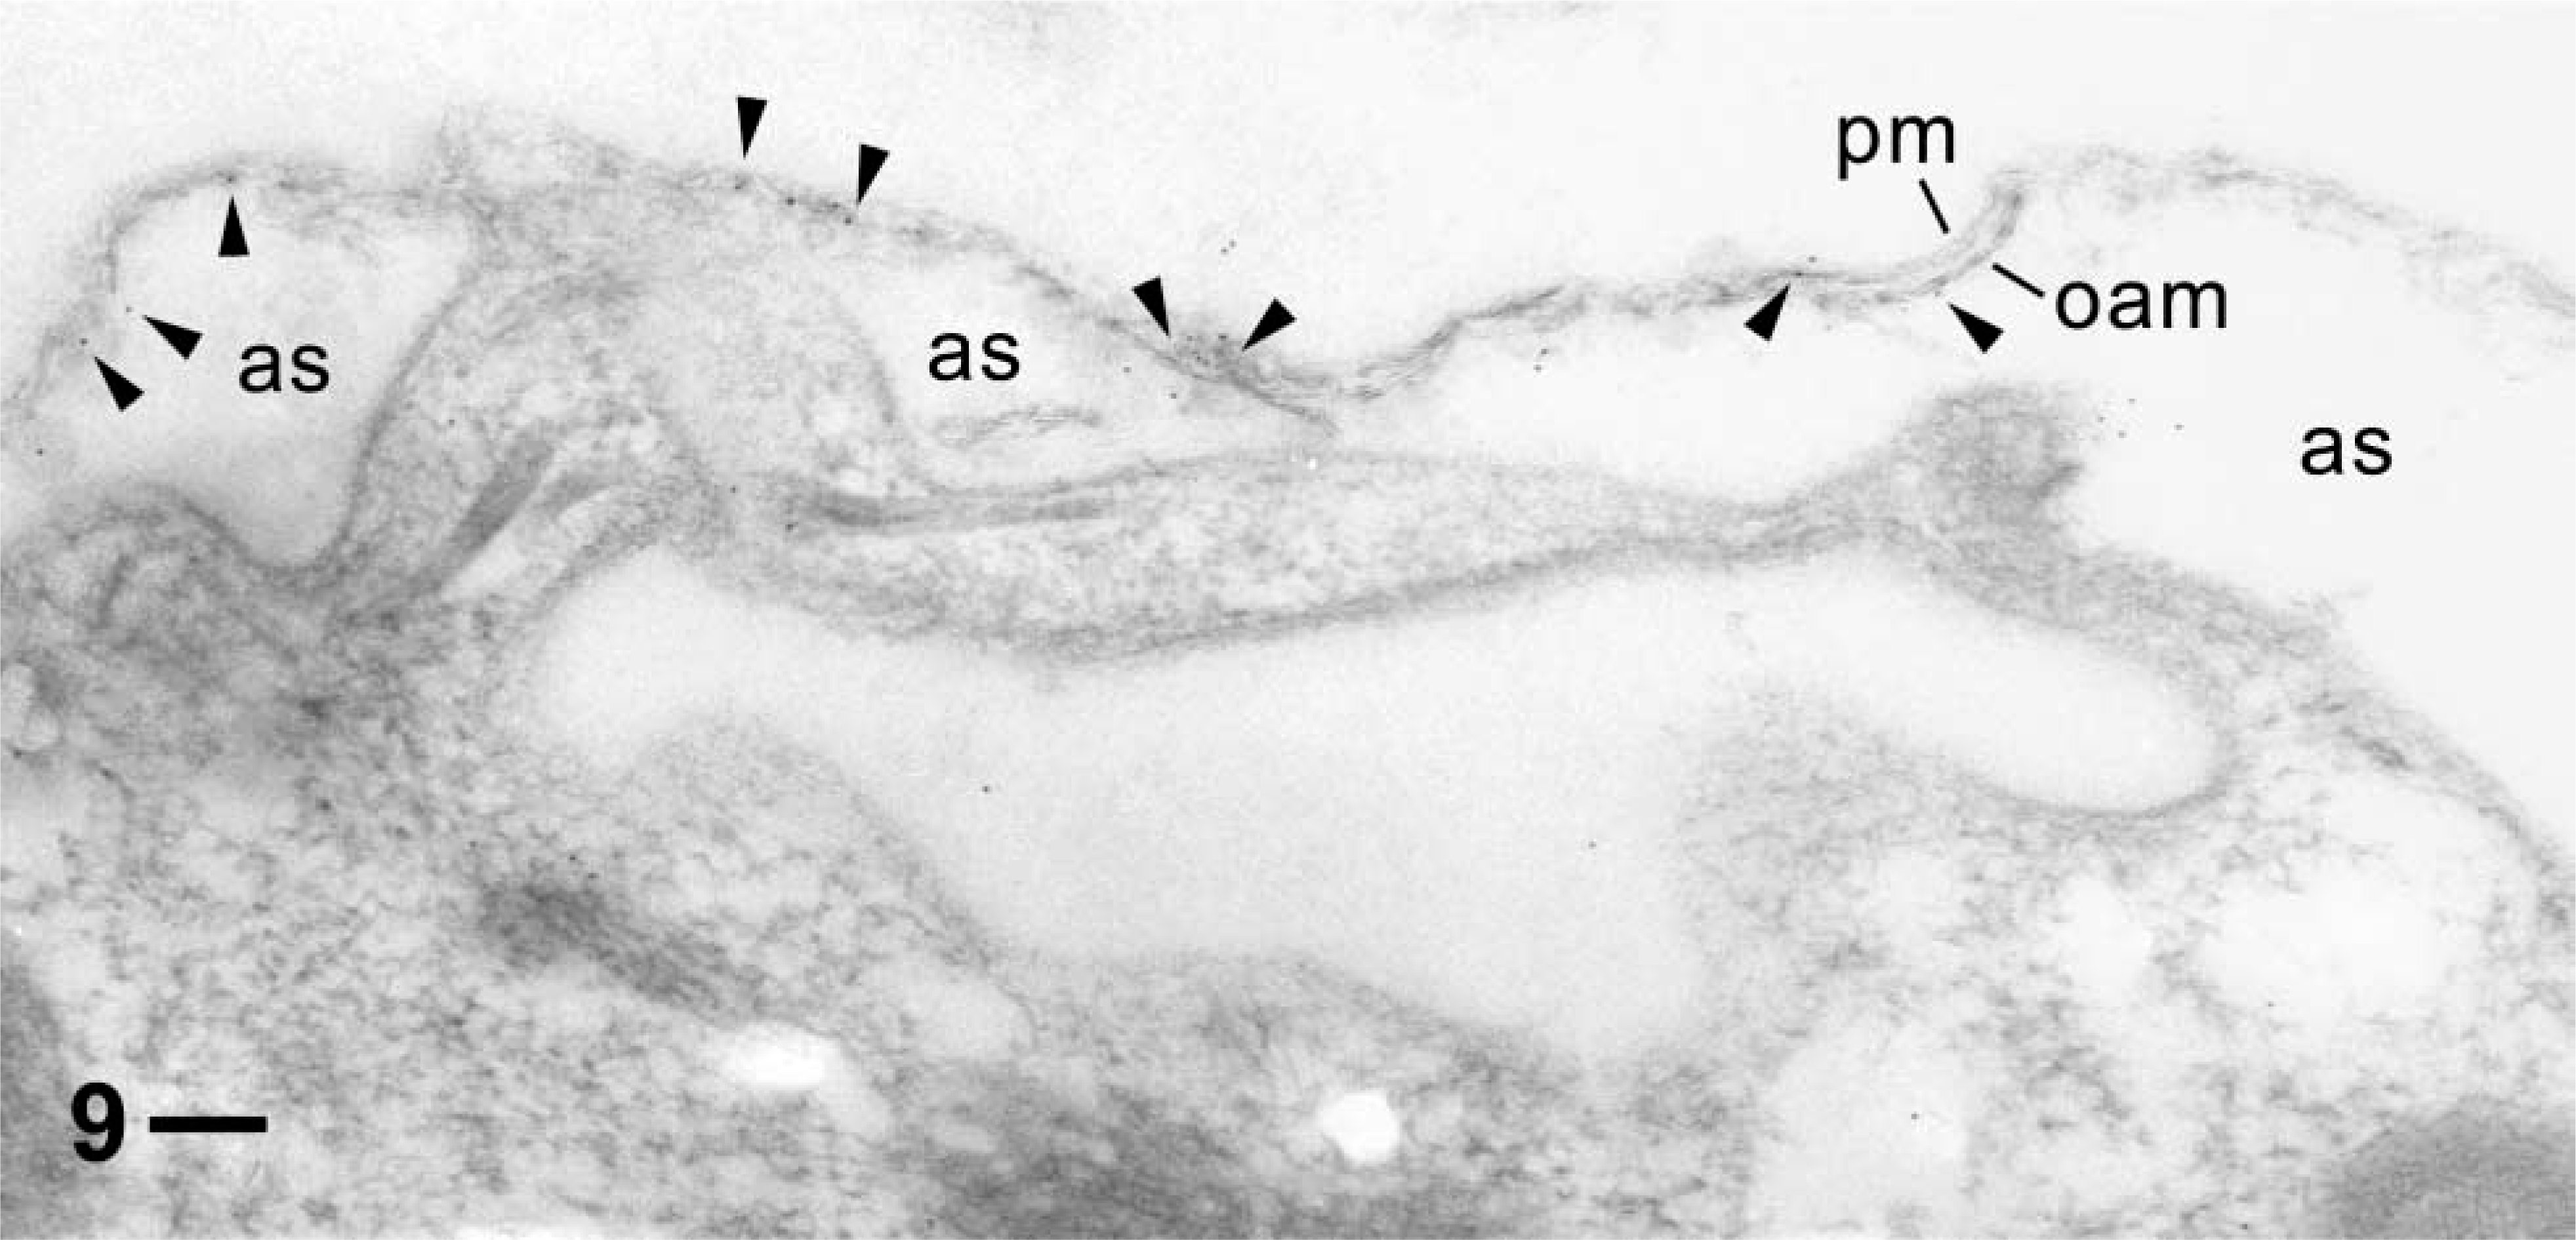
Combination of pre- and postembedding immunolabeling shows label in the narrow subplasmalemmal space (at/between arrowheads) between the plasma membrane (pm) and the outer alveolar sacs (as) membrane (oam), with little background on irrelevant structures outside the cytosolic compartment. Note deformation of the cell surface membrane complex (pm/oam), with some label attached particularly in regions with a “grazing” section plane, due to the permeabilization applied. This cell has been digitonized during aldehyde fixation for impregnation with primary AB and IgG-Au5 and embedded for incubation with the same ABs in sequence. Bar = 0.1 μm.
Assembly of F-actin around nascent phagosomes is well established, not only in mammalian cells but also in
At the EM level, we see that the cytosolic compartment around large and small vacuoles is frequently heavily labeled (even when filaments are difficult to discern due to faint contrast resulting from preparation for immuno-EM analysis). This holds, e.g., for domains with clearly visible microtubule bundles deep inside the cell and for regions with discoidal vesicles approaching the cytopharynx. The latter are delivered along microtubule rails, using dynein as a motor (Schroeder et al. 1990). Therefore, actin at these sites may serve not as a motor, but rather as a kind of scaffold. In sum, apart from association with non-actin filaments (see below), we see that actin is also associated with the second cytoskeletal element, the microtubules. This agrees with functional data obtained by combined drug application (Fok et al. 1985).
Label also occurs around the oral cavity outside the site of phagosome formation in the cytopharynx. Such filaments are known not to represent actin, either in
Vesicles deeper inside the cytoplasm, often close to a large phagosome, are also surrounded by gold label. All this reflects that actin is present throughout the cell in LM analyses, frequently as strands. Actin may thus participate directly or indirectly in vesicle trafficking, including cyclosis.
Not only ciliary basal bodies, but also the ciliary shaft, are labeled by anti-actin ABs. Labeling of cilia has been reported previously based on peroxidase-based preembedding immunostaining in
Another poorly understood aspect concerns coupling of cortical calcium stores to the cell membrane. With mammalian cells, one of the molecules considered to establish such connections, particularly for store-operated Ca2+-influx, is actin (Patterson et al. 1999; Rosado and Sage 2000; Kunzelmann-Marche et al. 2001; Wang et al. 2002). Interestingly, we find gold label that may be associated with the narrow subplasmalemmal space not only using a variation of the general labeling procedure that faciliates access of ABs (Figure 9), but also, though to a lesser extent, using postembedding labeling (Figures 5 and 7). This becomes evident particularly after statistical evaluation (Table 1). Although cytochalasin B application did not change concomittant Ca2+ signals (Mohamed et al. 2003), we keep this question open because the different actin isoforms found in
Label around the oral cavity, in a region enriched in ciliary basal bodies (bb) in (
Labeling density (gold grains/μm2) achieved with anti-actin AB/gold conjugate over different structural components, background [2.15 ± 0.85 (SEM),
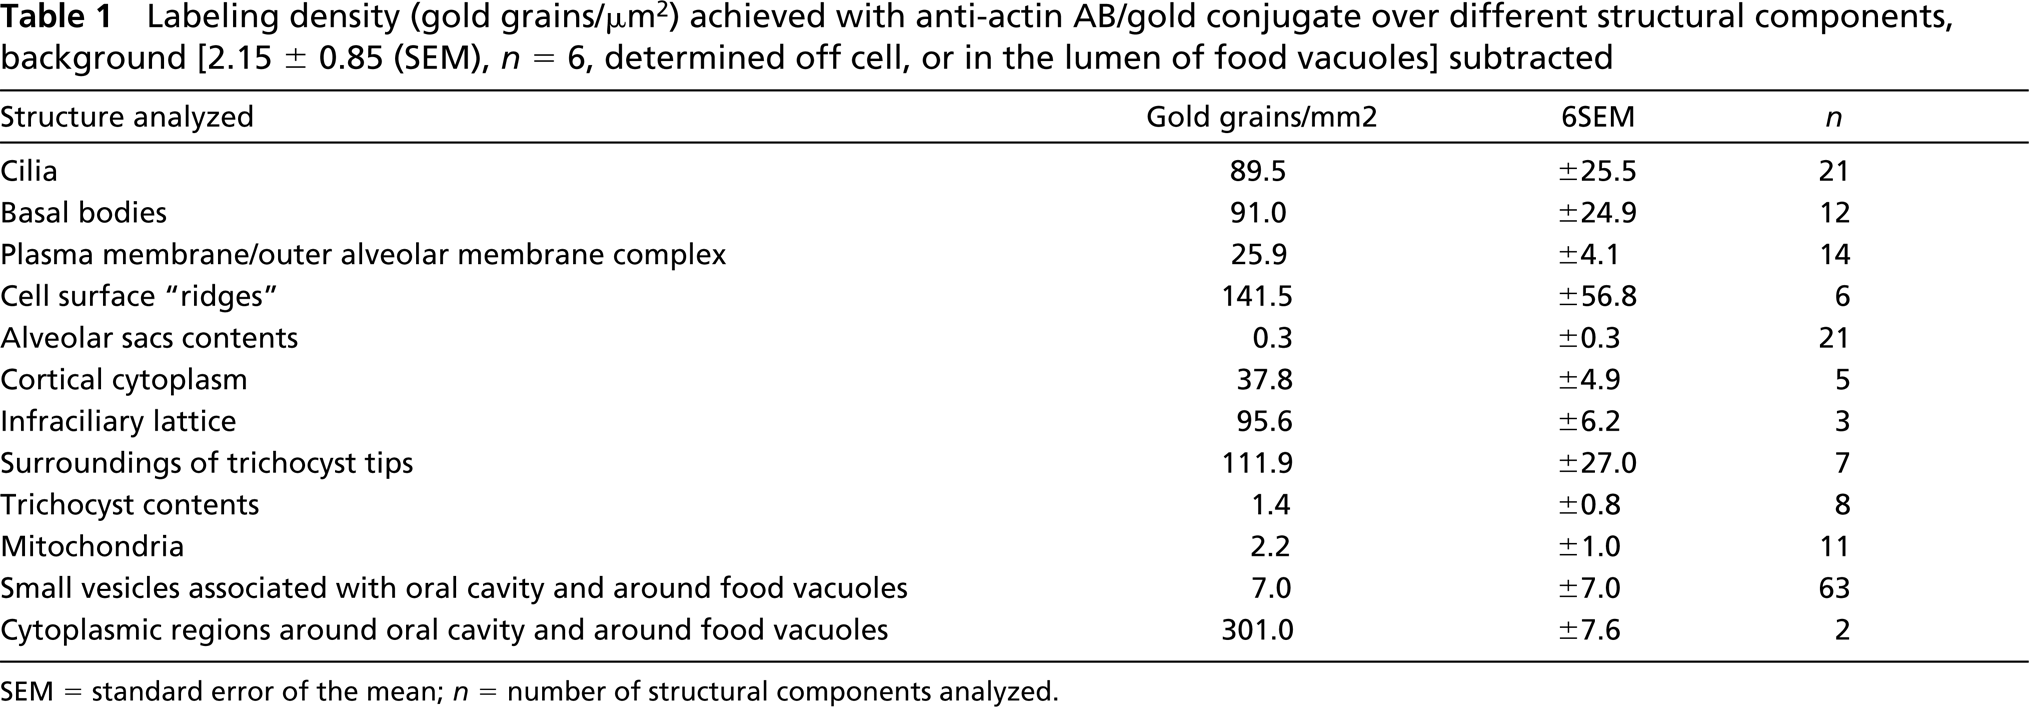
SEM = standard error of the mean;
Our present immunogold EM analysis largely depends on the preparation schedule used, whereas we obtained no such clear-cut labeling pattern with other approaches (data not shown). The current approach implied rapid injection (spraying) of cells in 0C aldehyde fixative, containing high formaldehyde and very low glutaraldehyde concentrations, followed by low temperature embedding and UV polymerization at −35C. This can considerably restrict diffusion of macromolecules and, even more, of filamentous aggregates. Therefore, we consider the current approach, elaborated on a (semi-)quantitative basis, more reliable than some previous attempts to localize actin in such cells.
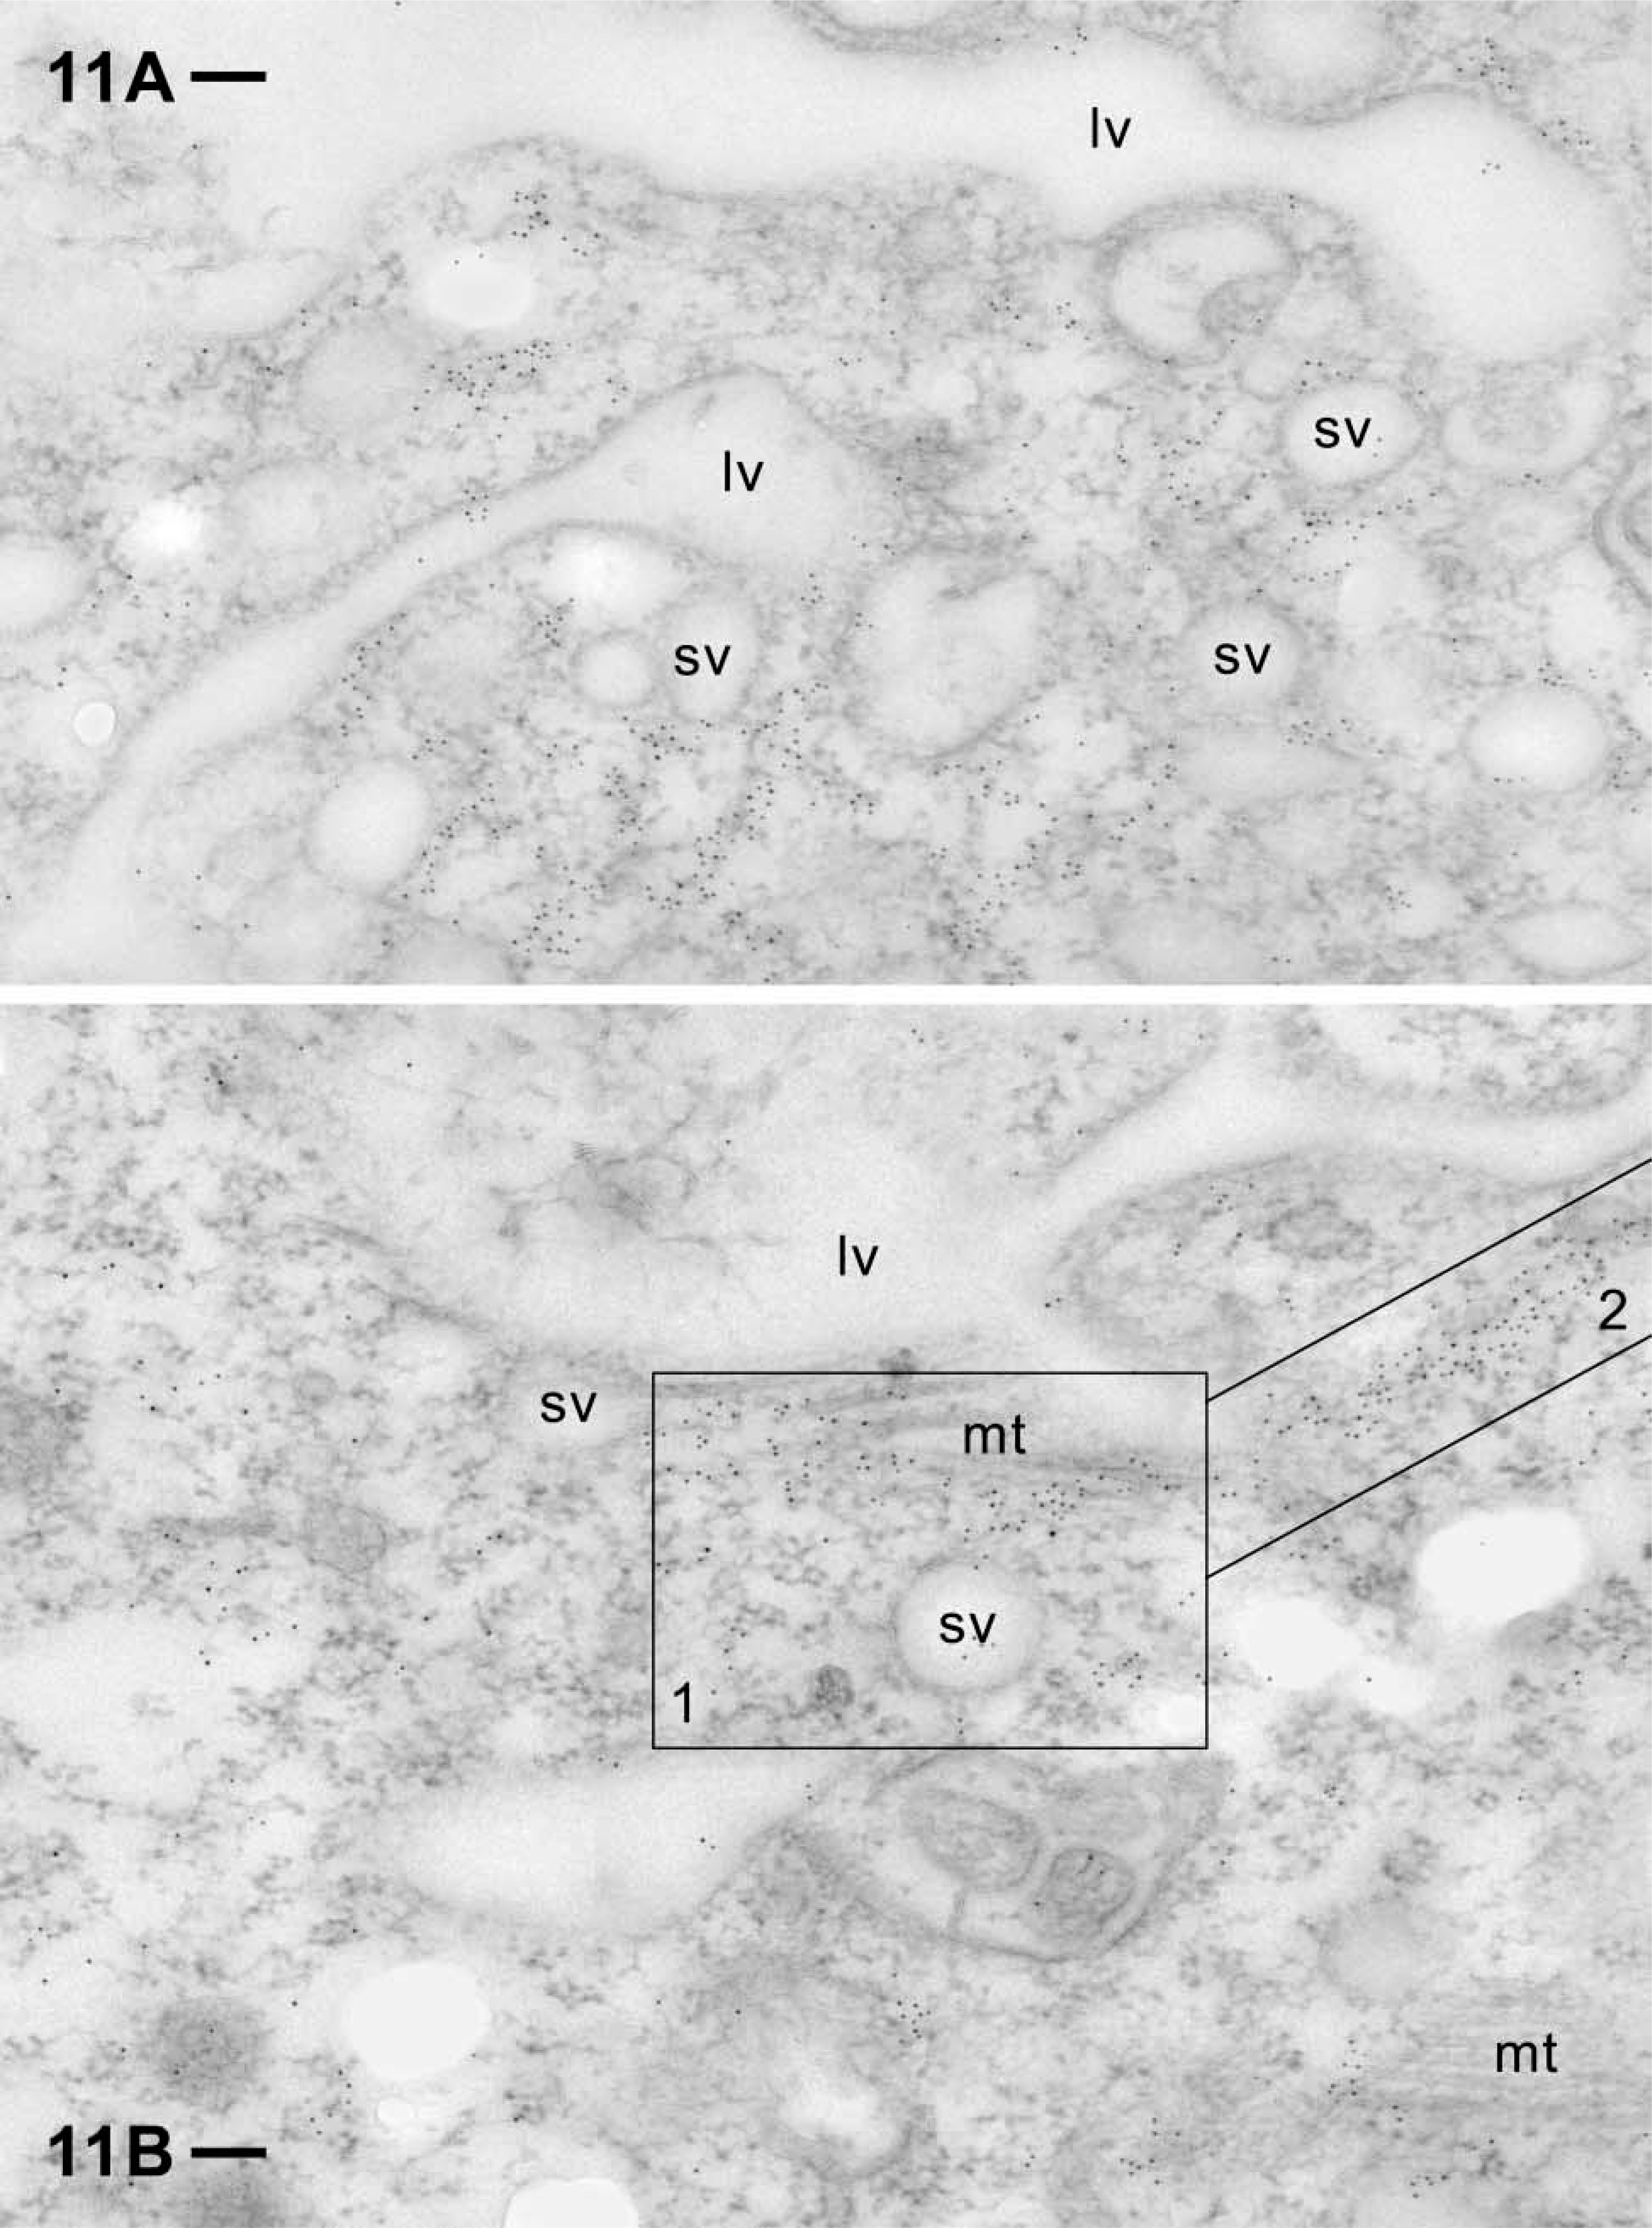
Label of the cytosolic compartment around small vacuoles (sv), probably acidosomes, approaching a large one (lv), probably a nascent food vacuole (see text). Particularly labeled domains are highlighted (boxes 1,2). Some of this label is associated with microtubule bundles (mt), e.g., in (
Footnotes
Acknowledgements
We gratefully acknowledge the kind help of Dr R. Gräf (University of Munich) for a gift of anti-centrin ABs, as well as the help of our group members, of Dr Joachim Hentschel with the quenched-flow preparations, and the skillful technical assistance of Ms Lauretta Schade in the EM documentation. We thank Dr Claudia Stuermer for access to the CLSM and Ms Sylvia Hannbeck von Hanwehr for technical help in the CLSM analysis, as well as Ms Doris Bliestle for electronic image processing. Supported by grants from the Deutsche Forschungsgemeinschaft to HP.