
Abstract
An important aspect of the image analysis of immunocytochemical preparations is the evaluation of colocalization of different molecules. The aim of the present study is to introduce image analysis methods to identify double-labeled locations exhibiting the highest association of two fluorophores and to characterize their pattern of distribution. These methods will be applied to the analysis of the cotrafficking of adenosine A2A and dopamine D2 receptors belonging to the G protein–coupled receptor family and visualized by means of fluorescence immunocytochemistry in Chinese hamster ovary cells after agonist treatment. The present procedures for colocalization have the great advantage that they are, to a large extent, insensitive to the need for a balanced staining with the two fluorophores. Thus, these procedures involve image processing, visualization, and analysis of colocalized events, using a covariance method and a multiply method and the evaluation of the identified colocalization patterns. Moreover, the covariance method offers the possibility of detecting and quantitatively characterizing anticorrelated patterns of intensities, whereas the immediate detection of colocalized clusters with a high concentration of labeling is a possibility offered by the multiply method. The present methods offer a new and sensitive approach to detecting and quantitatively characterizing strongly associated fluorescence events, such as those generated by receptor–receptor interaction, and their distribution patterns in dual-color confocal laser microscopy.
U
In dual-channel fluorescence laser microscopy, the term colocalization is commonly used to indicate the simultaneous presence of signals from both channels at the same image location, hence that the two fluorophores are localized in one and the same pixel of the image. Several methods have been explored to reveal spatially coincident immunofluorescence labeling (Arndt-Jovin et al. 1990; Fox et al. 1991; Humbert et al. 1993; Dutartre et al. 1996). However, because the size of a labeled molecule is approximately one order of magnitude smaller than the resolution of the laser microscope, dual-labeled picture locations will usually show different combinations of the involved fluorochromes, and a measure of the association between the two patterns of intensities has to be provided to obtain a quantitative description of their level of colocalization.
In this respect, it should be observed that when colocalization occurs between two channels, the two fluorescence distributions tend to vary spatially in the same way. This concept can be well visualized by plotting each intensity pair on a two-dimensional graph (fluorogram), whose horizontal and vertical axes represent the intensity scale of the two signals (Demandolx and Davoust, 1996). Perfect colocalization (identity) would result in a diagonal line in the plot, while partial similarity would be seen as an oblique band with slope depending on the ratio of the two channel intensities. On this basis, the analysis of the correlation between the two patterns of fluorescence was explored to quantitatively assess the level of association between the two signals, and methods based on the estimation of global (Manders et al. 1992,1993) and local (Demandolx and Davoust, 1996) correlation coefficients were proven to be particularly useful for the analysis of the degree of correspondence between the related fluorescence images.
The aim of the present study is to further develop this approach by introducing objective criteria and image analysis methods, allowing the identification, among the variety of fluorescence combinations characterizing double-labeled image locations, of the clusters of pixels expressing the highest level of association between the two fluorochromes. These new procedures for colocalization have the great advantage over commonly employed procedures that they are, to a large extent, insensitive to the need for a balanced staining with the two fluorophores.
These procedures can provide a useful tool for the study of strongly associated structures, such as those generated when receptor–receptor interaction occurs (Agnati et al. 1982,2003,2005). In this respect, recent findings based on coimmunoprecipitation experiments, bioluminescence resonance energy transfer and fluorescence resonance energy transfer (FRET) have demonstrated the existence of specific A2A-D2 heteromeric receptor complexes in various cell lines (Hillion et al. 2002; Canals et al. 2003; Kamiya et al. 2003). Furthermore, in previous work (Torvinen et al. 2005), we showed that an activation of either A2A or D2 receptors will cause receptor cointernalization in cultured Chinese hamster ovary (CHO) cells stably transfected with A2A and D2 receptors.
Therefore, as an example, the image analysis techniques described here will be tested in the same experimental protocol to detect the effect of CGS-21680 (an A2A agonist) or quinpirole (a D2 agonist) on the trafficking of the adenosine A2A and dopamine D2 receptors in a cotransfected CHO cell line.
Materials and Methods
Artificial Test Images
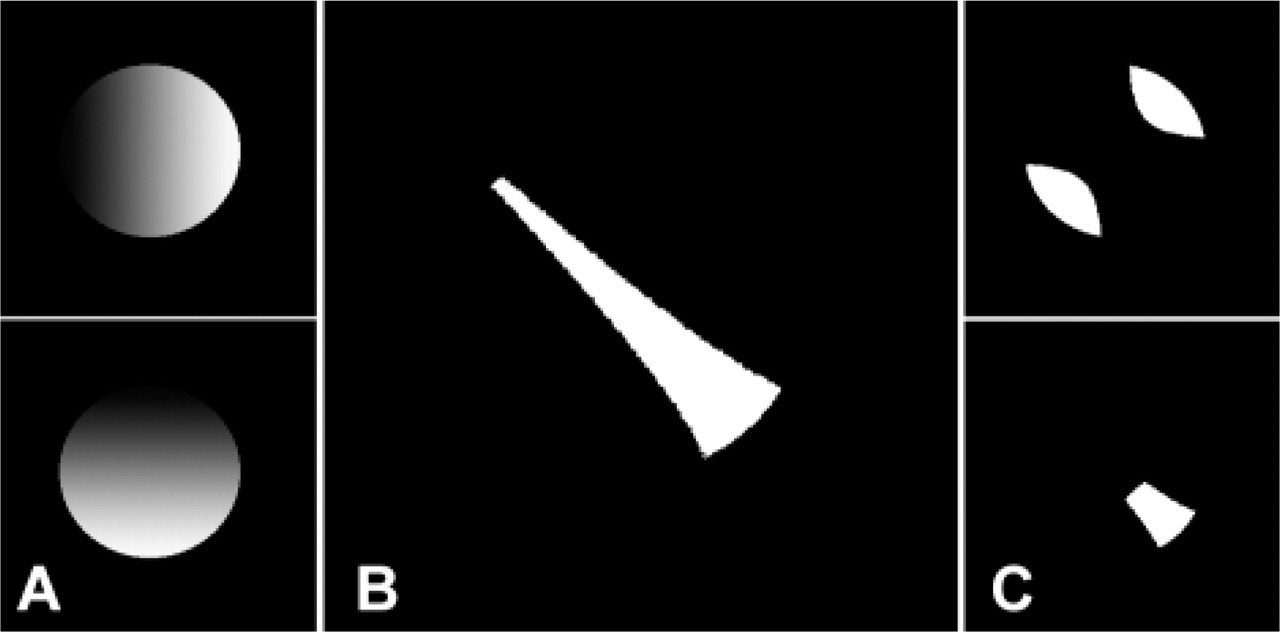
Two different types of 512 × 512 images were computer generated to test the image analysis procedures. They are shown in Figure 1.
The images of the first set were patterns of objects with Gaussian intensity distributions. Thus, each image pair simulates a situation in which only specific structures are labeled with either one or both fluorochromes.
To simulate situations in which each pixel of a specific region was double labeled, but with different combinations of the labels, a second set of images was generated, in which the same region of the digital image was filled with a linear gradient of gray levels. The direction of the gradient, however, differed for each image in the set. Thus, depending on the direction of the gradients in the image pair, different levels of correlation between the two brightness distributions can be obtained, from identity (gradients aligned) to complete anticorrelation (gradients with opposite orientation).
Biological Specimens
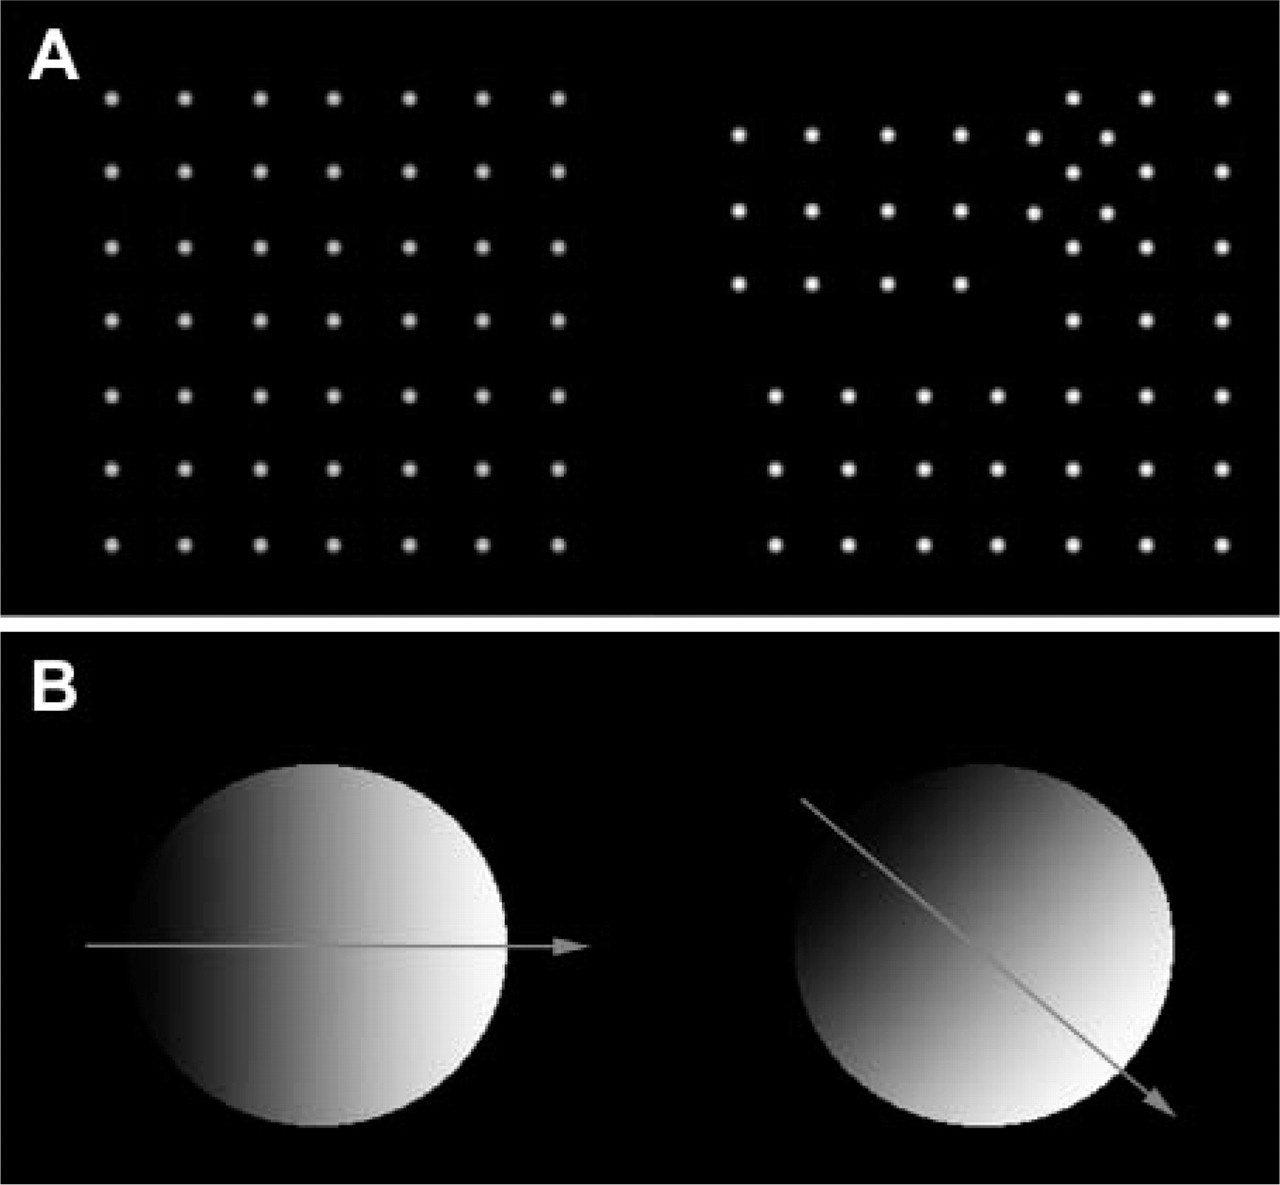
Examples of the two different types of artificial patterns used to test the image analysis procedures. Images of the first type (
Briefly, CHO cells (CHO-K1 cells; CCL61, American Type Culture Collection, Rockville, MD) were stably transfected with a double hemagglutinin–tagged (HA-tagged, N- and C-terminal) dog adenosine A2A (HA-A2A-HA) and human dopamine D2 (long form) receptor cDNAs.
The expression of the A2A and D2 receptors in the A2A-D2 CHO cell line was confirmed with binding experiments with the A2A receptor antagonist [3H]-ZM-241385 and the D2 receptor antagonist [3H]-raclopride. The density of receptors (Bmax) and the dissociation constant (Kd) determined with the A2A receptor antagonist [3H]-ZM-241385 were 290 ± 18 fmol/mg of protein and 0.4 ± 0.07 nM (means ± SEM,
The A2A-D2 cell line was grown to adherence and maintained in α-MEM medium without nucleosides, containing 10% fetal calf serum, penicillin (50 μg ml−1), streptomycin (50 μg ml−1),
The cells were then rinsed several times and incubated with an anti-rabbit biotinylated antibody (1:200) (Amersham Biosciences Europe; Cologno Monzese, Milano, Italy) for 1 hr at room temperature. After several rinses, the double immunofluorescence staining was performed with a red-colored fluorolink Cy3-labeled streptavidin (1:100) (Amersham Biosciences Europe) for D2 receptors and with a green-colored fluorolink Cy2-labeled goat anti-mouse (1:100) (Amersham Biosciences Europe) for HA-A2A receptors for 1 hr at room temperature. Finally, the slides were rinsed several times and mounted with a medium suitable for immunofluorescence (30% Mowiol, Calbiochem, INALCO SpA, Milano, Italy).
Such a calibration of the intensities of the lines used for excitation (488 nm and 568 nm) was performed according to the manufacturer's instructions. Briefly, during simultaneous detection of both labels, the excitation intensity of one line was reduced down to 0%, with the result that any structure still visible in that channel would therefore stem from the emission of the other label. To minimize this unwanted signal, the intensity of the other line was then reduced until a satisfactory setting was found. Figure 2 shows an example of the obtainable cross talk correction.
All images were recorded with a planapochromatic X100/NA 1.4 objective. With this objective, the lateral optical resolution is ∼0.18 μm and the axial resolution along the z-axis is 0.50 μm. Sampling steps of 0.08 μm in the plane of section and 0.25 μm in the axial direction were then applied, thus meeting the requirements of the Nyquist theorem (Webb and Dorey 1995).
To minimize the noise and to keep a low photobleaching rate, we selected an acquisition time of 1 sec per scan and averaged 16 scans to produce each 512 × 512-pixel image.
For each cell, two images taken in the middle depth were acquired for the analysis: the green image (G(x,y)), obtained from the acquisition of the emission selected by a 515–560 nm band pass filter; and the red image (R(x,y)), obtained from the acquisition of the emission selected by a long-pass filter above 590 nm.
A region of interest (ROI) was also interactively defined to restrict the analysis to a spatially confined area of the image covering the cell plasma membrane.
Image Analysis Procedures
Image processing and analysis were performed with the KS400 (Zeiss, Oberkochen, Germany) image analysis software and using routines specifically developed by the authors. The main steps of the applied image analysis procedures are described below.
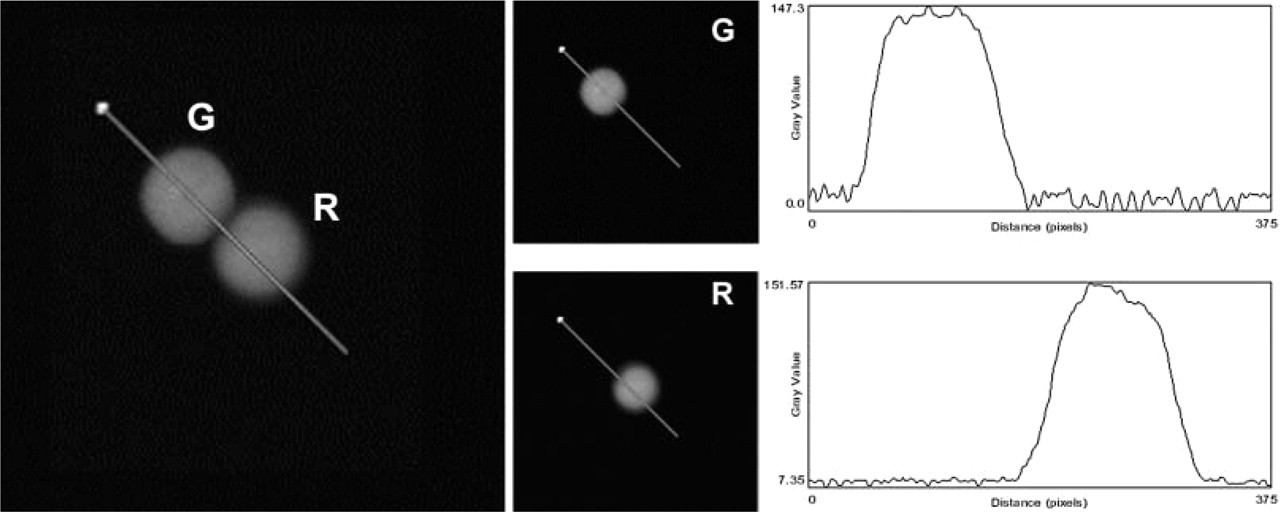
Example of the cross talk correction obtained during simultaneous acquisition by using the acousto-optical tunable filter to separately set the intensity of the excitation lines. The dual-labeled sample in the left panel was simply a mixture of single–labeled microspheres. The obtained R and G images are shown in the right panels, together with the intensity profiles along the traced line.
To circumvent these limitations, we preferred to apply the approach originally proposed by Demandolx and Davoust (Demandolx and Davoust 1996). The concept behind this method is to improve the perception of the extent of colocalization by assigning a specific color to each ratio between the two fluorescence channels.
This task was accomplished by creating a hue-saturation-brightness color image (Russ 1995), in which a specific hue value was defined for each G/R ratio:
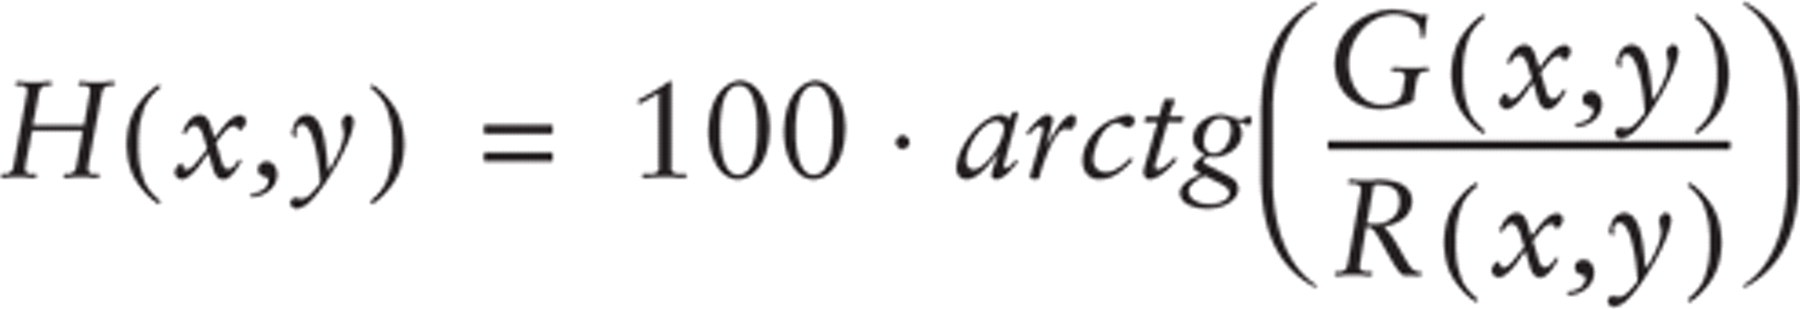
where R(x,y) and G(x,y) indicate the red and green fluorescence intensities at the image location (x,y).
To have in the look-up table only pure colors, saturation was fixed at its maximum value (255).
The brightness component (B) was defined as the normalized sum of the R and G intensities:

where Kb = 255/(Rmax + Gmax).
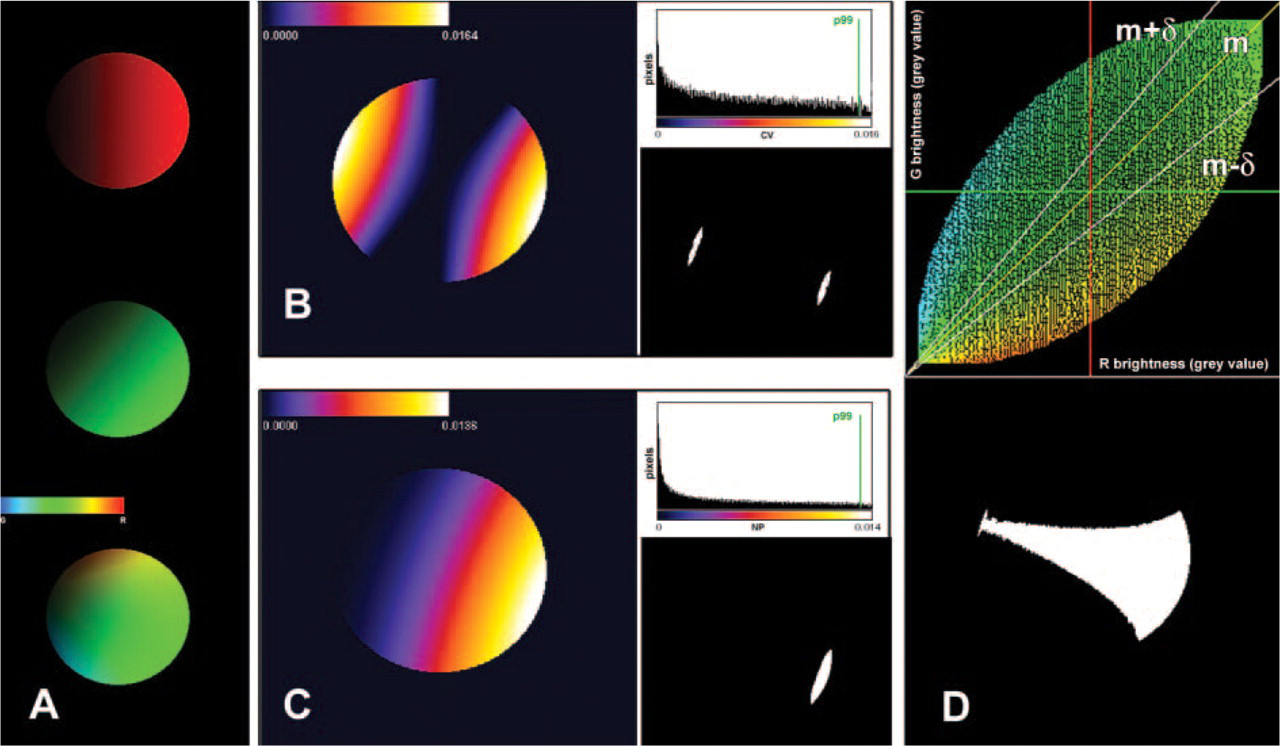
In the resulting image (see Figure 3A), therefore, the color codes the extent of colocalization, i.e., the ratio between the two fluorochrome intensities in each pixel (according to a scale ranging from blue to red through cyan, green, and yellow), whereas the intensity is proportional to the relative amount of labeling in each pixel.
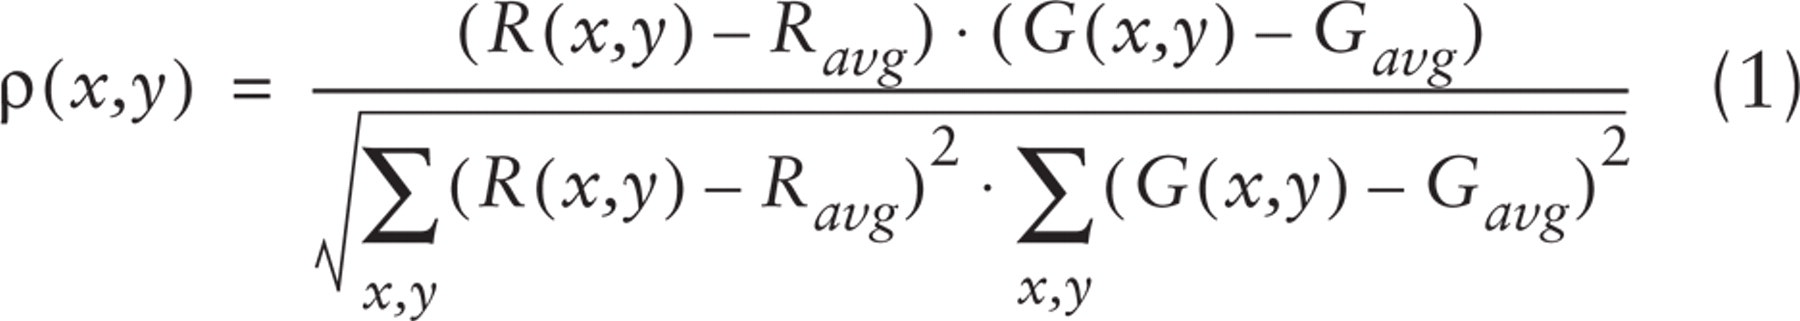
The Covariance Method
Pearson's correlation coefficient is a well-known standard procedure for getting a global measure of the match between two images (Gonzales and Wintz 1977), and it is often used to describe the degree of association exhibited by two patterns of fluorescence (Manders et al. 1992). The coefficient can be calculated from:
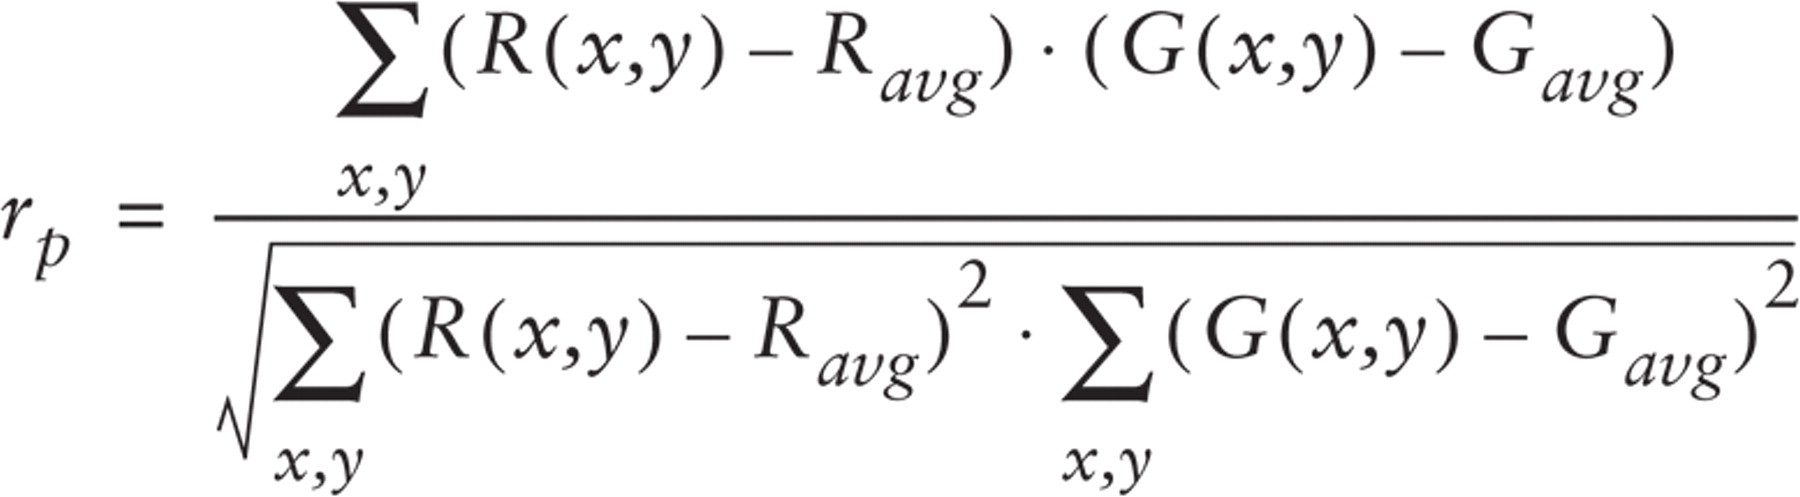
where Gavg and Ravg indicate the mean green and red intensity, respectively.
The correlation coefficient ranges from −1 to 1. A value of 0 indicates no overlap between the two patterns of intensities; a value of 1 corresponds to a perfect match, and a value of −1 corresponds to an inverse correlation. The coefficient is simply the sum over all the pixels of the following normalized covariances between channel intensities.
The pixel covariances can be positive or negative, indicating variations of the two channels in the same or in the opposite direction with respect to the mean brightness.
To discriminate the pixels expressing the highest level of association between the labels, the following steps were applied. The distribution of the positive pixel covariances was obtained and the 99th percentile (p99) calculated. Pixels showing the highest covariance (i.e., with ρ(x,y) > p99) were first analyzed. These are the locations giving the highest contribution to the overall correlation coefficient, so they can be considered as locations where high association between the two signals certainly occurs. Their mean G/R ratio (mG/R) was then evaluated and used to discriminate the whole set of highly correlated pixels (HCPs). They were defined as the pixels with G/R ratio in the range mG/R ± δG/R, where δG/R indicates a predefined G/R ratio interval. The value for δG/R used in the present study was 20% of mG/R.
Example of the application of the image analysis procedures to a pair of test images, each containing a circular region filled with a gray-level gradient (see Figure 1). The relative orientation of the two gradients is 45°. (
The procedure is illustrated in Figure 3B.
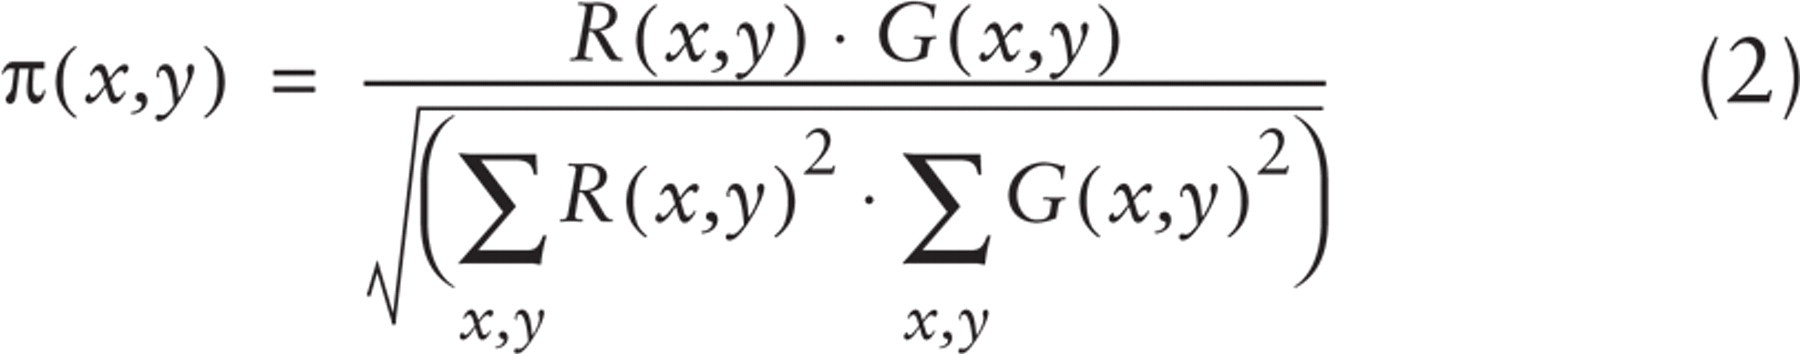
The Multiply Method
An alternative way to globally describe the degree of match between two fluorescence distributions is the following overlap coefficient, proposed by Manders et al. (Manders et al. 1993):
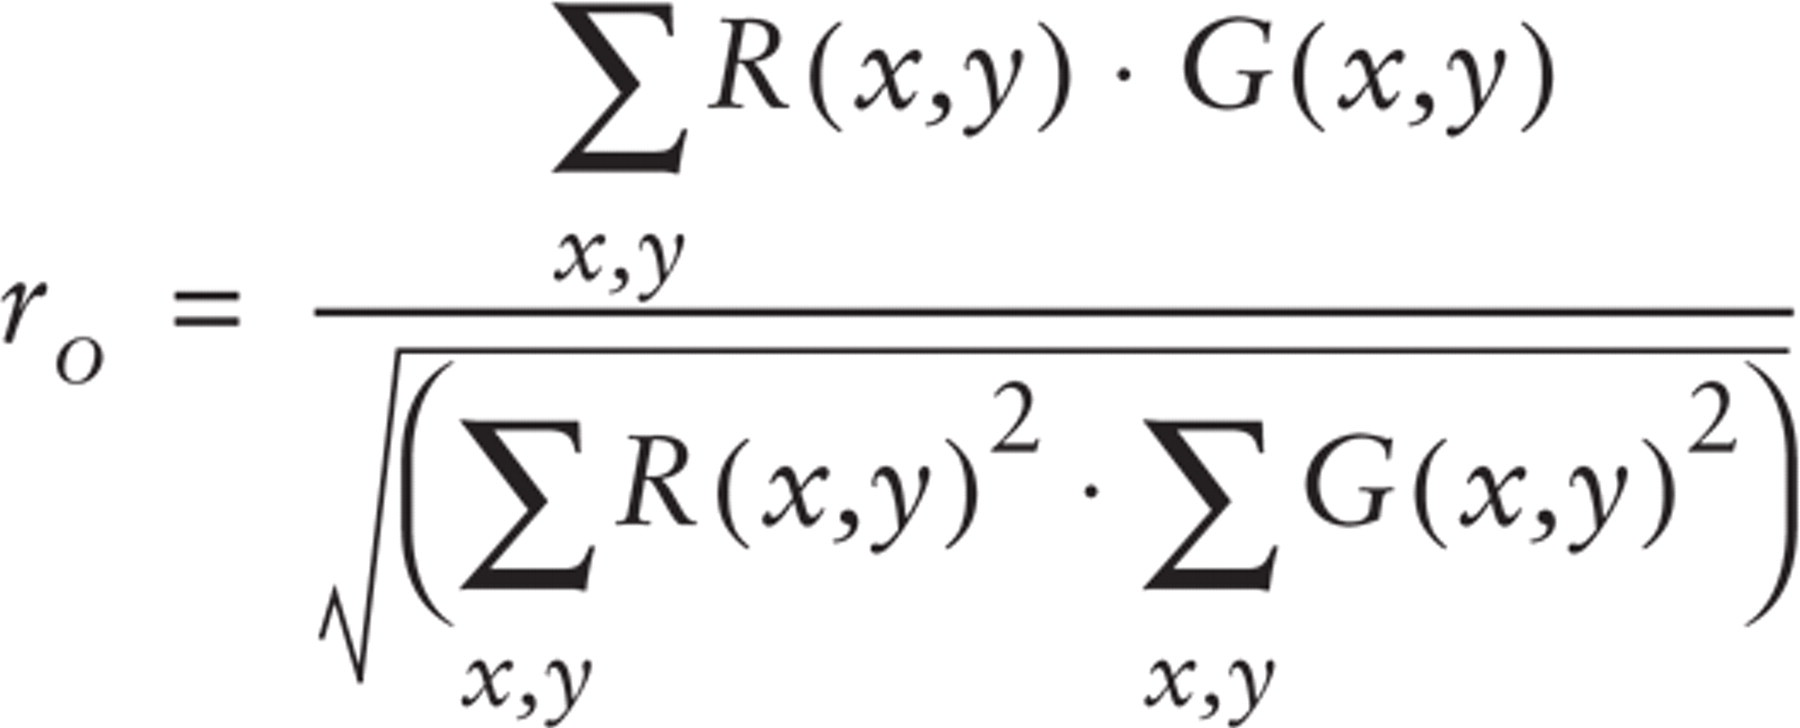
The product R(x,y)-G(x,y) in the numerator brings in a value different from zero only when calculated in a point where both signals occur. Thus, the numerator is proportional to the number of dual-labeled pixels. In the same way, the denominator is proportional to the total number of fluorescent pixels in both components of the image.
The coefficient ranges from 0 to 1, the latter value indicating a perfect match between the two fluorescence images. The overlap coefficient is the sum of the following normalized product of pixel intensities:
Pair of test images, each containing a circular region filled with a gray-level gradient (see Figure 1). The relative orientation of the two gradients is 90°. (
Following the approach described earlier, the pixels giving the highest contribution to the coefficient were first identified by taking into consideration the pixels with normalized product greater than the p99 of the distribution of π(x,y). The mG/R of these pixels was then calculated to define the range (mG/R ± δG/R) for the final discrimination of the whole set of HCPs. Figure 3C illustrates the procedure.
As shown in Figure 3D, both of the described criteria correspond to the selection, in the two-dimensional scatter plot of the signal intensities, of the pixels in a region around a line expressing the “best” correlation between the two channels. The slope of that line is identified by mG/R, whereas the width of the region around it is determined by the value defined for δG/R.
Each method, however, can provide specific additional information (see Figure 4). In particular, when the covariance method is used, a second binary image showing pixels where the highest levels of anticorrelation were located can be obtained simply by selecting pixels with negative covariance lower than a predefined threshold. They represent locations where high intensity levels of a fluorochrome correspond to low intensity levels of the other one. The multiply method allows the identification of the HCPs with a normalized product greater than a predefined threshold. They are the areas characterized by both high correlation between the channels and high concentration of labeling.
Furthermore, because the basic aspect of both algorithms is the calculation of products between R and G intensities (see equations 1 and 2), the two methods are commutative, i.e., insensitive to the order by which R and G images are considered.
Measurements
Binary images showing clusters of HCPs were characterized by a set of morphometric and densitometric parameters (see Table 1 for a summary).
Briefly, the field area of the binary pattern obtained after the application of each of the two methods was evaluated and expressed as percentage of the ROI area. These percentage field areas (FA%) express the amount of reference area occupied by clusters of HCPs.
Basic parameters measured with the covariance method and multiply method
The distribution of HCPs within the ROI was evaluated by means of the Gini index (Agnati et al. 1984; Gaile and Willmott 1984). This index allows the quantitative evaluation of the departure of the observed distribution of HCPs in the ROI from a uniform distribution pattern. Details about the calculation of the Gini index are provided in Figure 5.
The level of colocalization exhibited by the identified pattern was estimated by means of two colocalization factors (Manders et al. 1993). They represent the amount of immunoreactivity of each fluorochrome within the HCPs (sum of the intensities within the HCPs) as a fraction of its total immunoreactivity (sum of the intensities of that fluorochrome within the ROI). Therefore, each coefficient is the fraction of the fluorescence of the corresponding probe that is highly associated with the fluorescence of the other probe.
As shown in Table 1, parameters specific to each method can also be evaluated. Thus, when the covariance method was applied, the overall correlation coefficient and the FA% of the pattern formed by anticorrelated pixels were measured.
The multiply method allowed the estimation of the global overlap coefficient together with the FA% of the clusters of HCPs with high concentration of labeling.
Influence of Noise
As pointed out by Manders (Manders et al. 1993), it is possible to demonstrate that both the normalized covariance [see expression (1)] and the normalized product [see expression (2)] are insensitive to differences in signal intensities between the two images caused by multiplicative bias, including different labeling, photo-bleaching, or different setting of the detectors.
To measure the influence of random noise, a series of image pairs of decreasing signal-to-noise (S/N) ratio was obtained by adding to test images increasing amounts of Poisson noise. The S/N ratio was estimated [in decibels (dB)] as indicated by Manders et al. (Manders et al. 1993):
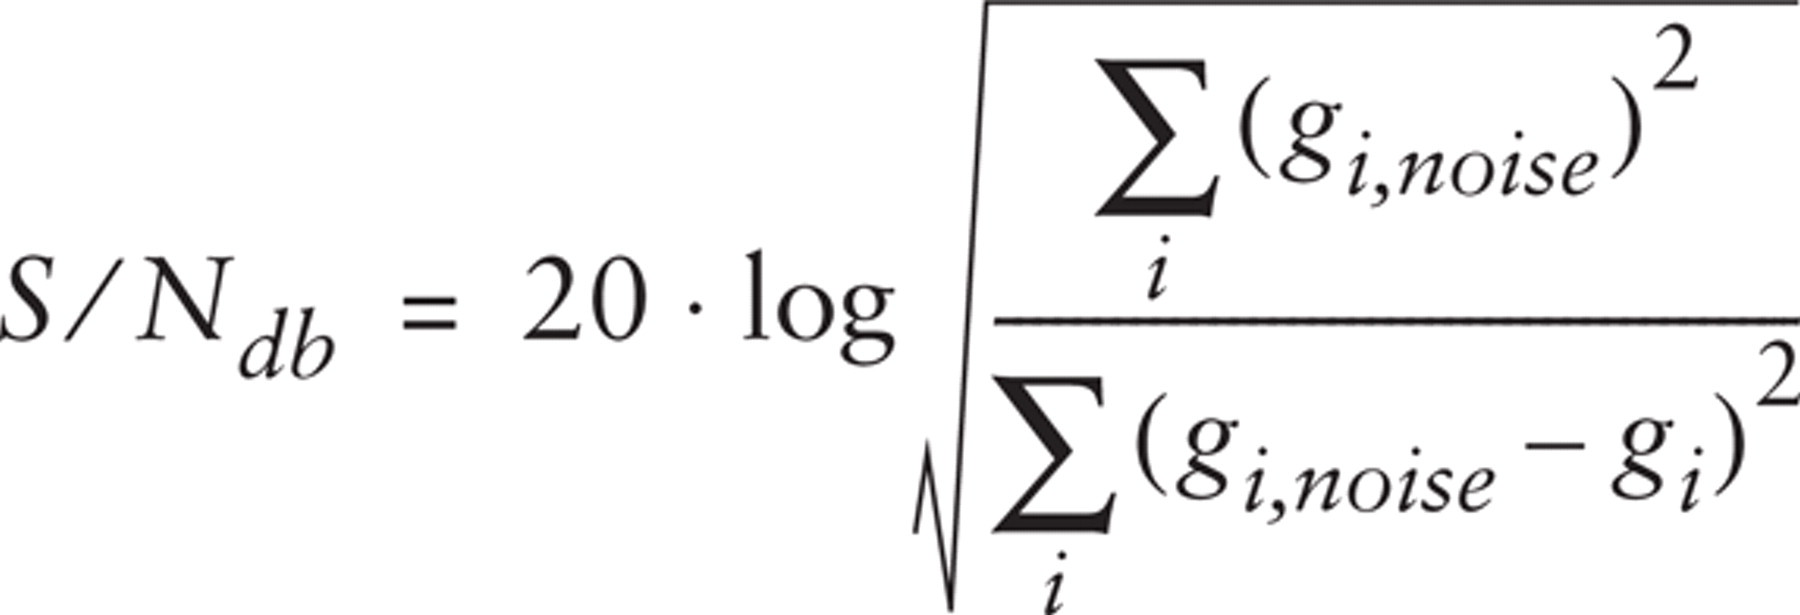
where gi,noise and gi are the gray levels of the ith pixel in the noisy and original image, respectively. The artificially degraded images underwent the same procedure applied to real images: they were median filtered and then analyzed.
The amount of noise present in the images of real specimens following the above-described image acquisition and processing procedures was estimated by evaluating the S/N ratio on images of uniform fluorescence standards (Inspeck-Red/component F and Inspeck-Green/component F; Molecular Probes, Eugene, OR).
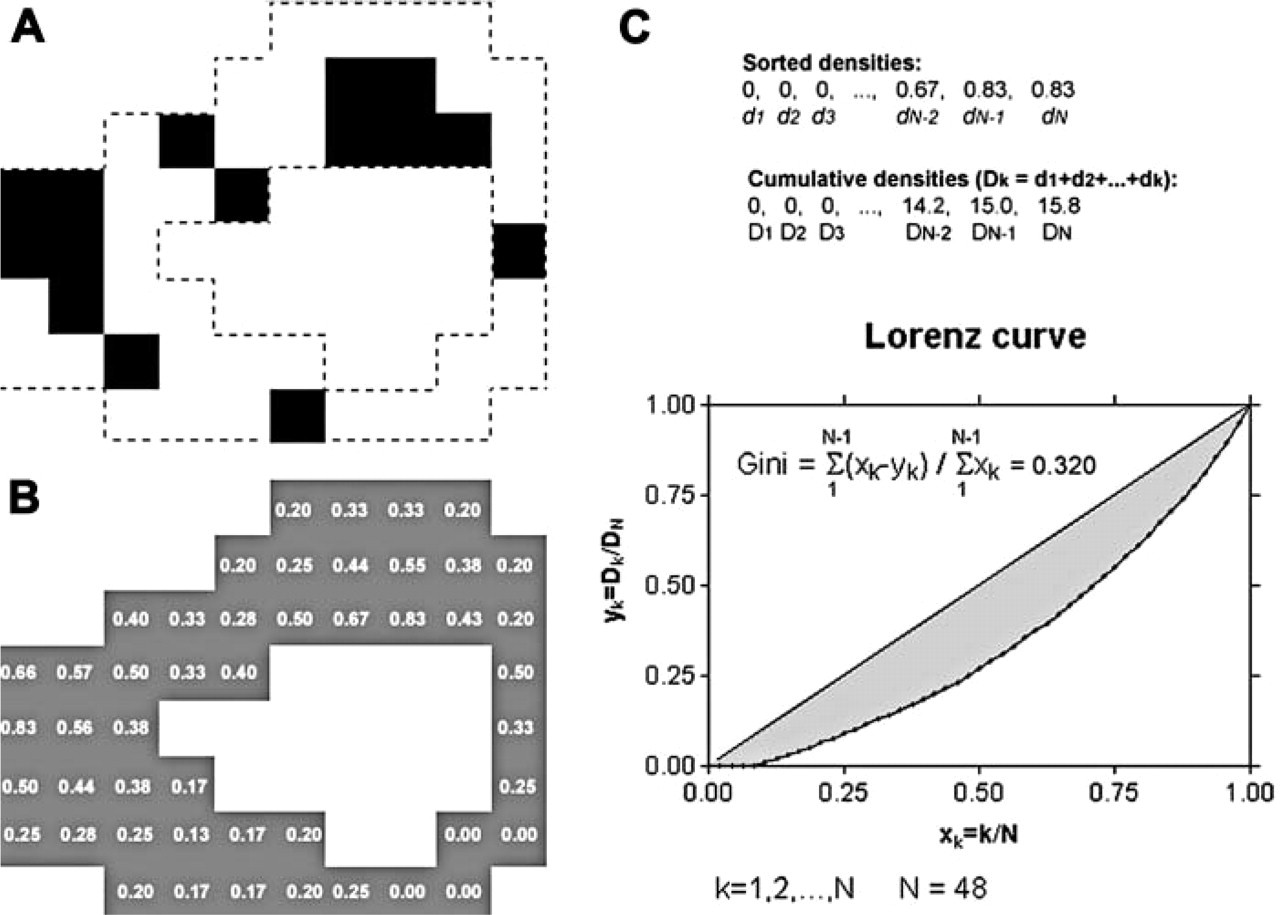
Schematic representation of the procedure used to estimate the Gini index. Dashed lines in
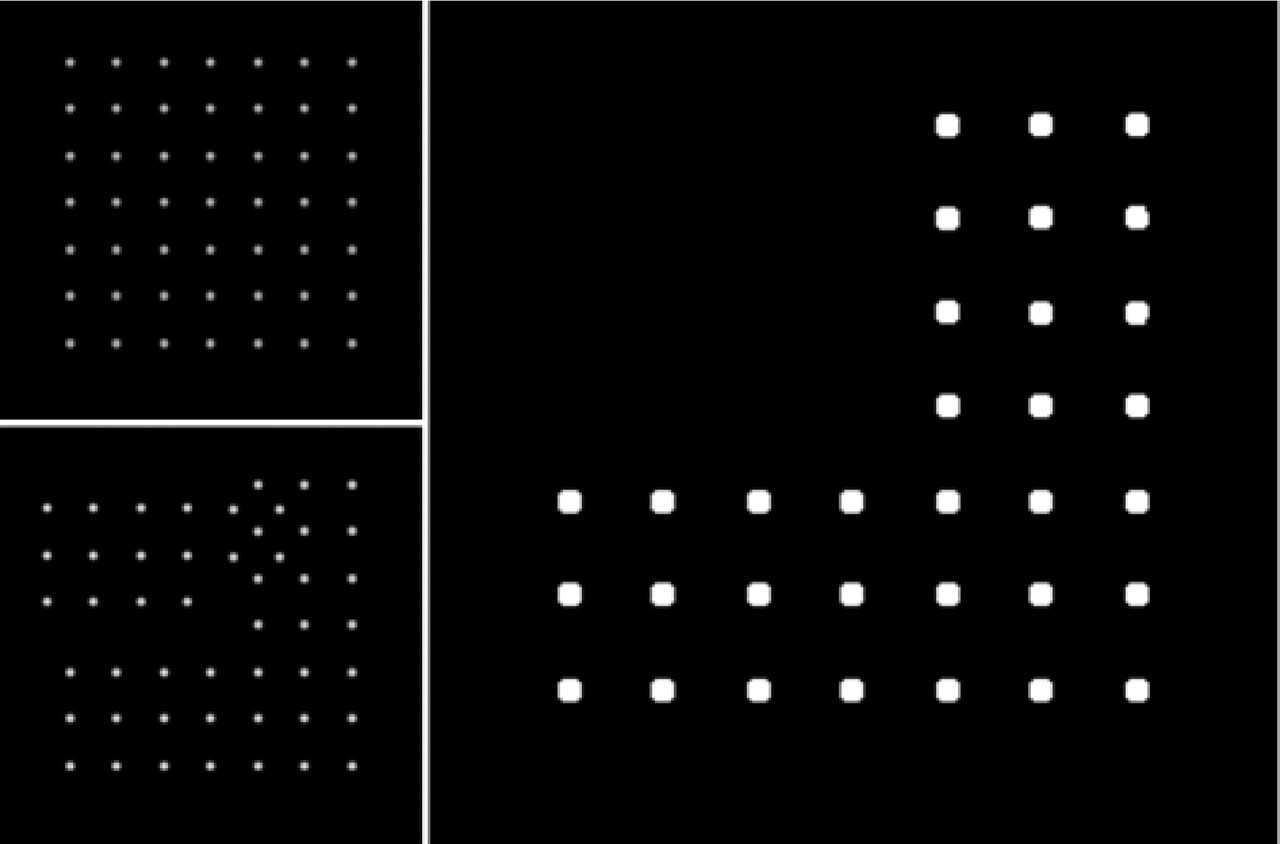
Analysis of a pair of test images containing discrete Gaussian spots (see also Figure 1). When applied to test images of this type, the multiply method led to the identification of the dual-labeled spots only (right panel). The same result was provided using the covariance method (data not shown).
Statistics
Data were processed by using statistical analysis software (GraphPad Prism 3.03; GraphPad Software Inc., San Diego, CA). The correlation between the results provided by the two methods was studied by Pearson's analysis.
The experiment on CHO cells was performed in triplicate, and in each experimental session, ∼20 cells per treatment were evaluated. The mean values of the measured parameters obtained in the treated cell cultures were then compared by Student's
Results
Test of the Image Analysis Procedures
As shown in Figure 6, when the image analysis procedures were applied to pairs of test images containing discrete Gaussian objects, both of them led to the correct identification of the dual-labeled ones.
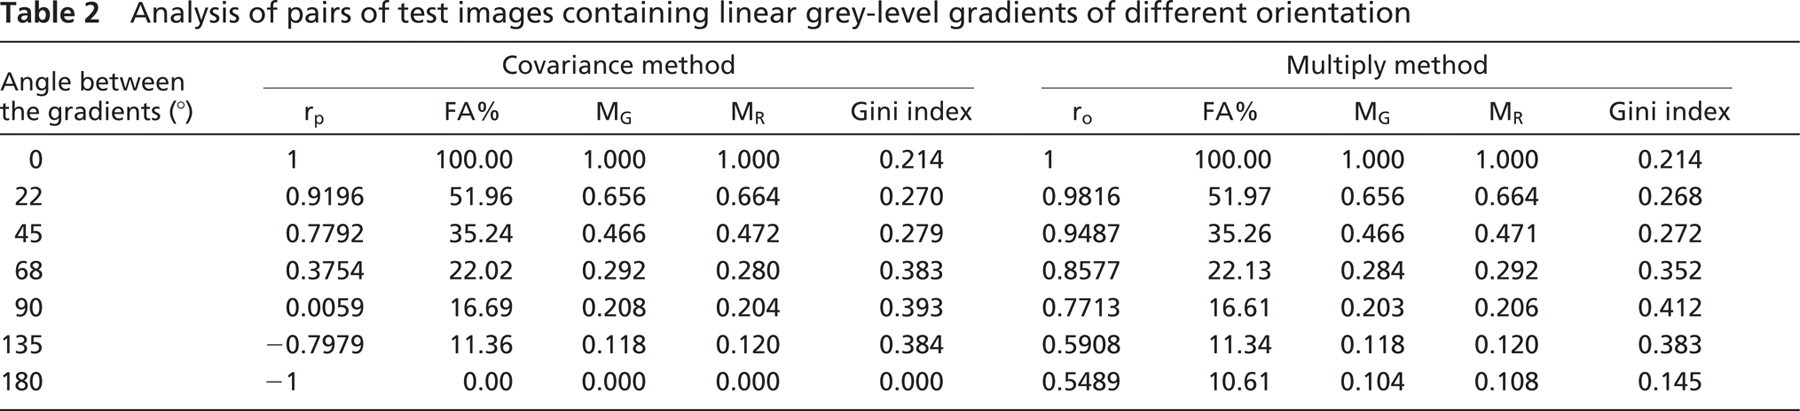
When applied to pairs of test images containing linear gray-level gradients of different orientation, they resulted in the identification of a cluster of pixels with a G/R ratio close to 1. As expected, to the extent that the level of correlation between the two patterns decreased, the size and the colocalization coefficients of such a cluster consistently decreased (Table 2). Furthermore, looking at the parameters that are common to both methods, no differences between the two procedures were detected, apart from the complete inverse correlation between the two images (i.e., when rp = −1). In this particular case, when the covariance method was applied, no clusters of HCPs were detected, whereas the multiply method discriminated the pixels with both R and G intensities close to the mean value of the R and G channel, respectively.
The analysis of a number of real image pairs of CHO cells resulted in a highly significant (
Effect of Noise and Image Processing
Figure 8 shows the results of the application of the image analysis procedures to test images degraded by known amounts of Poisson noise and median filtered before the analysis. The parameters remained almost insensitive to noise as long as the S/N ratio exceeded 13 dB (i.e., as long as the noise was less than 20%). When the images were too noisy, the parameters rapidly diminished.
The effect of the procedures applied to reduce the presence of noise in the images of real samples is illustrated in Figure 9. Following integrated acquisition and median filtering, the presence of random noise became strongly reduced. When measured on real images of fluorescence standards, acquired under the same conditions as the biological samples, the S/N ratio was ∼21 dB (21.1 ± 1.6), corresponding to an amount of noise of ∼9%.
Analysis of pairs of test images containing linear grey-level gradients of different orientation
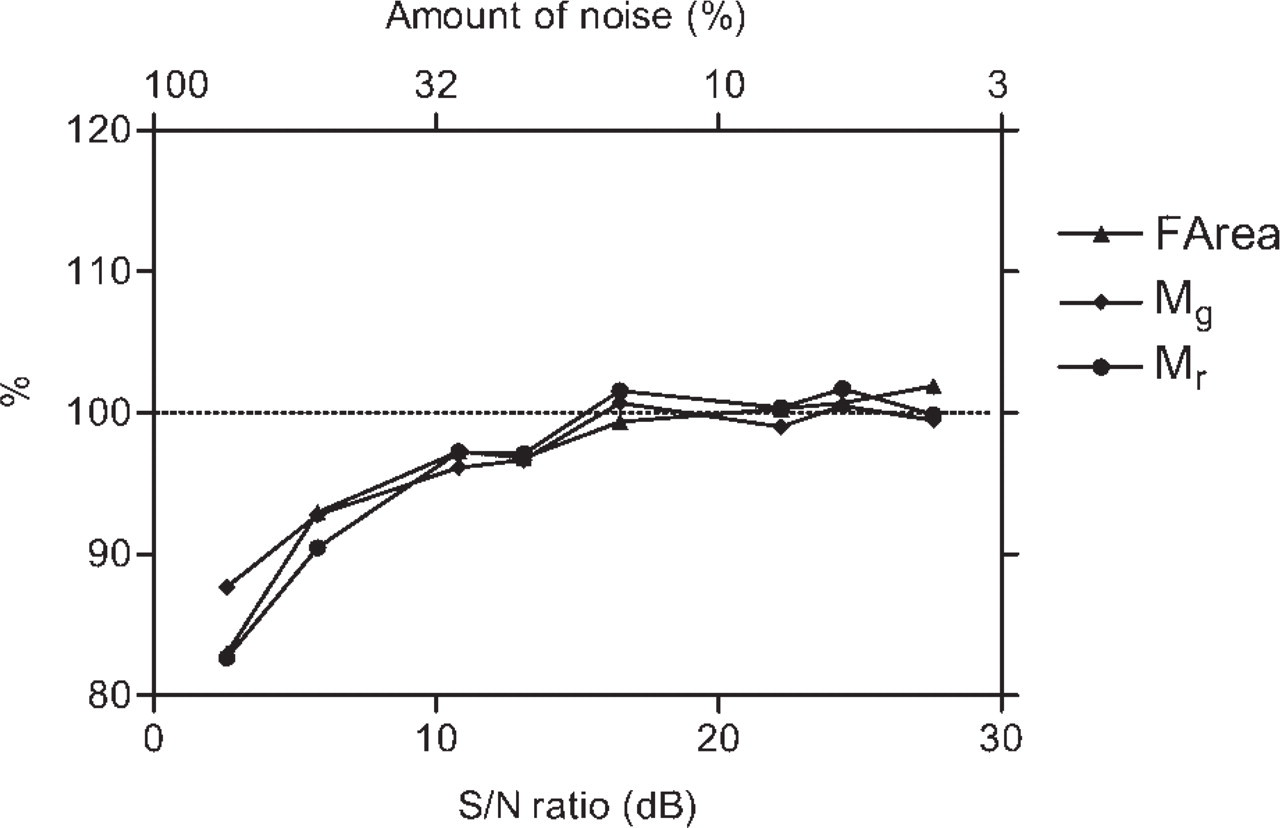
Values of the parameters characterizing the HCP pattern obtained from the analysis of a pair of test images (such as those in the lower panel of Figure 1) as a function of the noise added to the images. The measured parameters are expressed as percent of the value observed in the undegraded image. The amount of added noise is expressed as percent of the signal on the upper x-axis. The corresponding S/N ratio (in decibels) is indicated on the lower x-axis. Such a parameter decreases as the noise increases. For further details, see text and the legend to Figure 7.
A2A-D2 Colocalization in CHO Cells
Image pairs visualizing A2A and D2 receptors in CHO cells were analyzed after 15 hr of agonist treatment. Representative images of the observed HCP patterns are shown in Figure 10.
The colocalization factors estimated on these patterns, as well as the overall level of correlation between the two channels, significantly decreased (Figure 11) after 15 hr of quinpirole (a D2 agonist) or CGS-21680 (an A2A agonist) treatment.
Moreover, the pattern of HCPs appeared less clustered after treatment with both the agonists. When compared with the control cells, a decrease of ∼15% (
Discussion
The identification of strongly associated fluorescence events is a very important issue for the study of the dynamics of the interactions between receptor molecules by immunocytochemistry. It can give a first indication of receptor–receptor interactions (Agnati et al. 2003). Furthermore, this type of analysis could permit the acquisition of important features of receptor cotrafficking after drug treatments (Hillion et al. 2002), i.e., it can provide information on the internalization versus insertion of the interacting molecules in the plasma membrane.
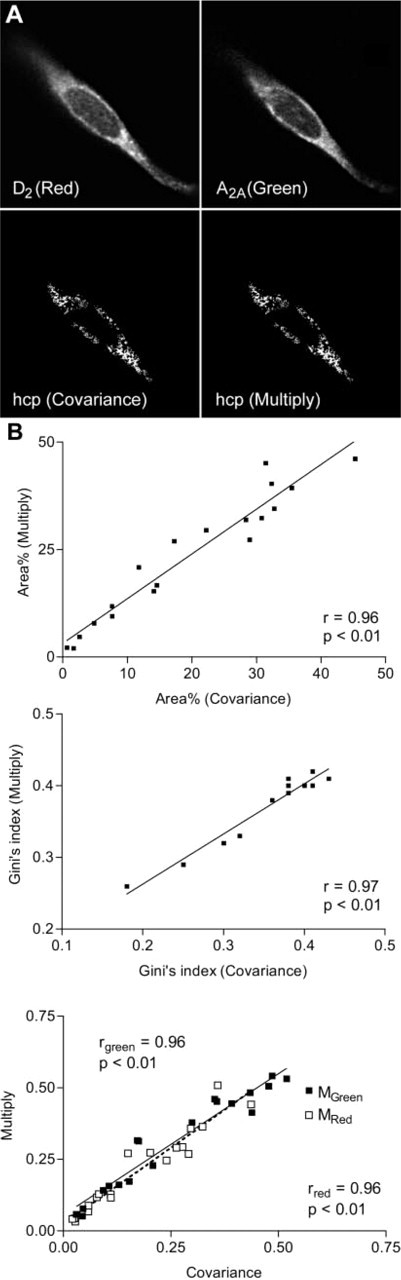
Immunofluorescence images of a Chinese hamster ovary (CHO) cell, together with the binary images of the HCP patterns obtained from the application of the covariance and multiply methods. The two resulting patterns are very similar. (
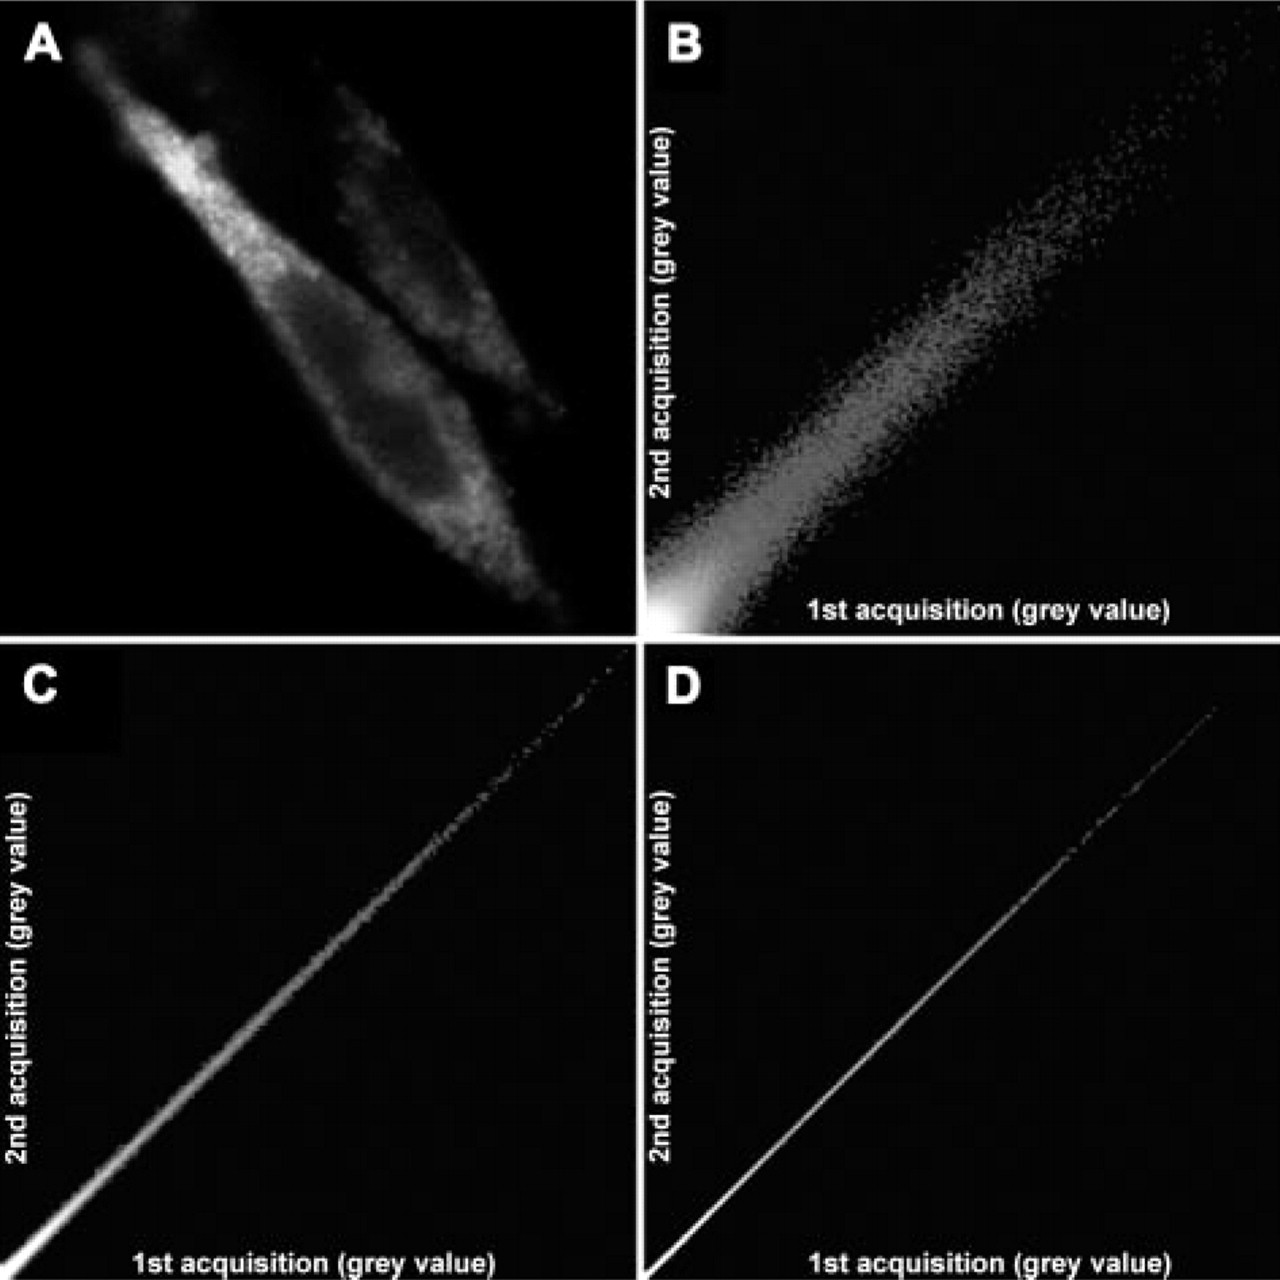
After two sequential acquisitions of a confocal immunofluorescence image of A2A receptors in a CHO cell, each pixel was plotted on a scatter diagram by reporting the brightness from the first and second acquisitions along the x-axis and y-axis, respectively. (
In this paper, colocalization analysis methods have been developed aimed at the identification and quantitative characterization of the locations in the image where two types of G protein–coupled receptors exhibit the highest level of association. Thus, these methods will not only allow a characterization of the size of receptor clusters and of their pattern of distribution on the plasma membrane surface, but they can also provide information on whether the internalization process of receptor clusters follows a distinct pattern (e.g., preferential internalization of large clusters).
Various advanced methods have previously been proposed to characterize the spatial overlap of two fluorescence markers. These methods usually involve the discrimination of significant features in the two images to obtain the corresponding binary images. An overlap procedure of these two binary images is carried out by Boolean operators (Agnati et al. 1984) or by means of other algorithms (Hammond and Glick 2000). Finally, the analysis of the overlap image is performed to obtain parameters capable of describing colocalization and other relevant features of the distribution pattern of the two fluorophores. Cross-correlation analysis was also proposed (van Steensel et al. 1996) as a method of getting a detailed description of the spatial codistribution of dual-labeled structures.
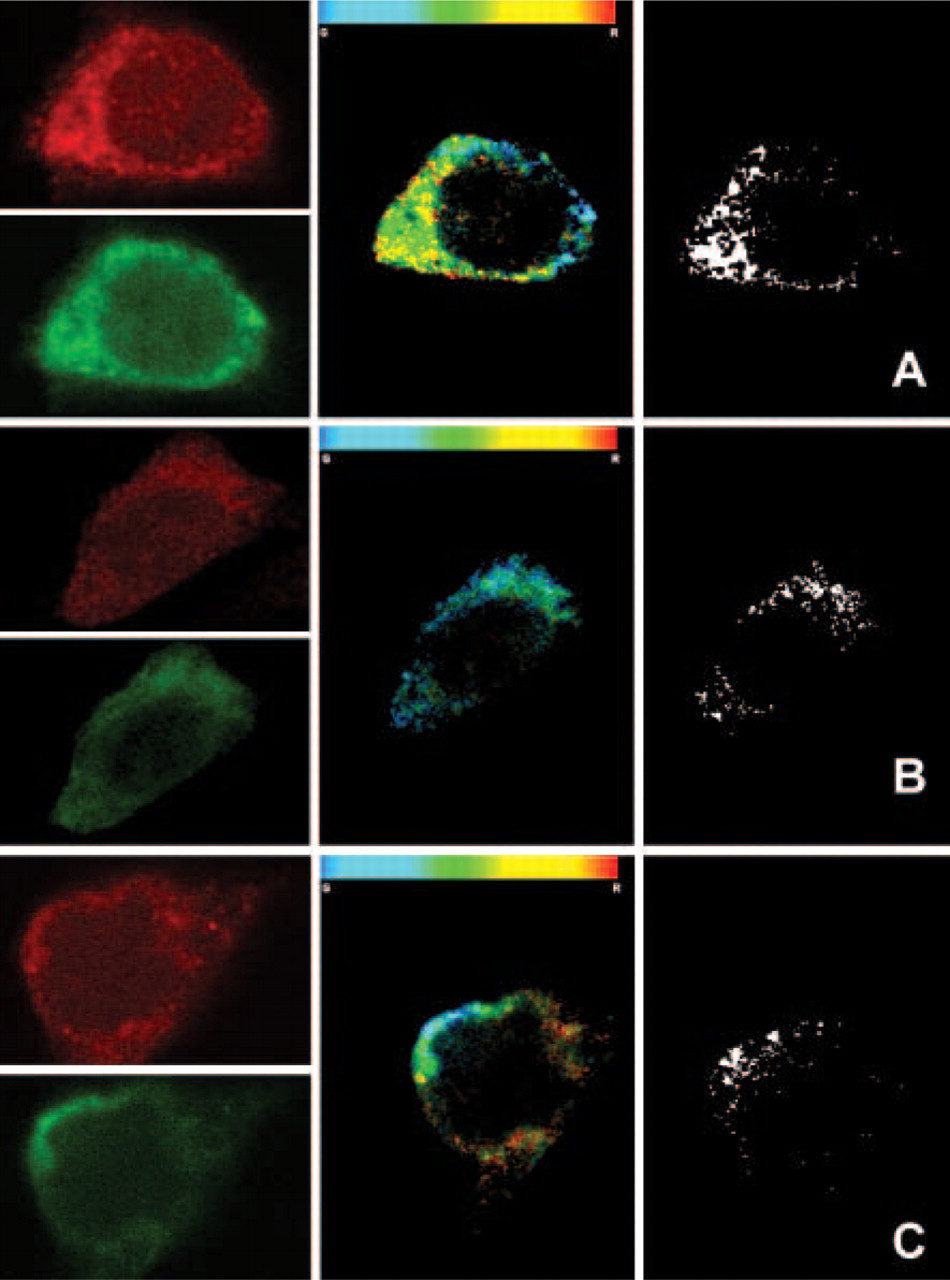
Left panels show immunofluorescence images of D2 (red) and A2A (green) receptors in a CHO cell from a control culture (
Analysis of the spatial information alone, however, does not provide the required information about the degree of association exhibited by the two markers. In fact, the potentially colocalized molecules are, in general, smaller than the elementary sampling unit [for instance, with the observation conditions used in the present study, the voxel size = 80 × 80 × 500 nm, whereas each fluorochrome-labeled antibody–receptor complex has a diameter of ∼20 nm (Eskandari et al. 1998; Arrio-Dupont et al. 2000; San Paulo and Garcia 2000), leading to a volume that is ∼102 times smaller]. Thus, several labeled proteins can be simultaneously present in the same volume element, but with a quite different ratio between the concentrations of the two species. The information carried by the intensity values of the two images has therefore to be considered if a measure of the association between the two fluorescence signals is needed.
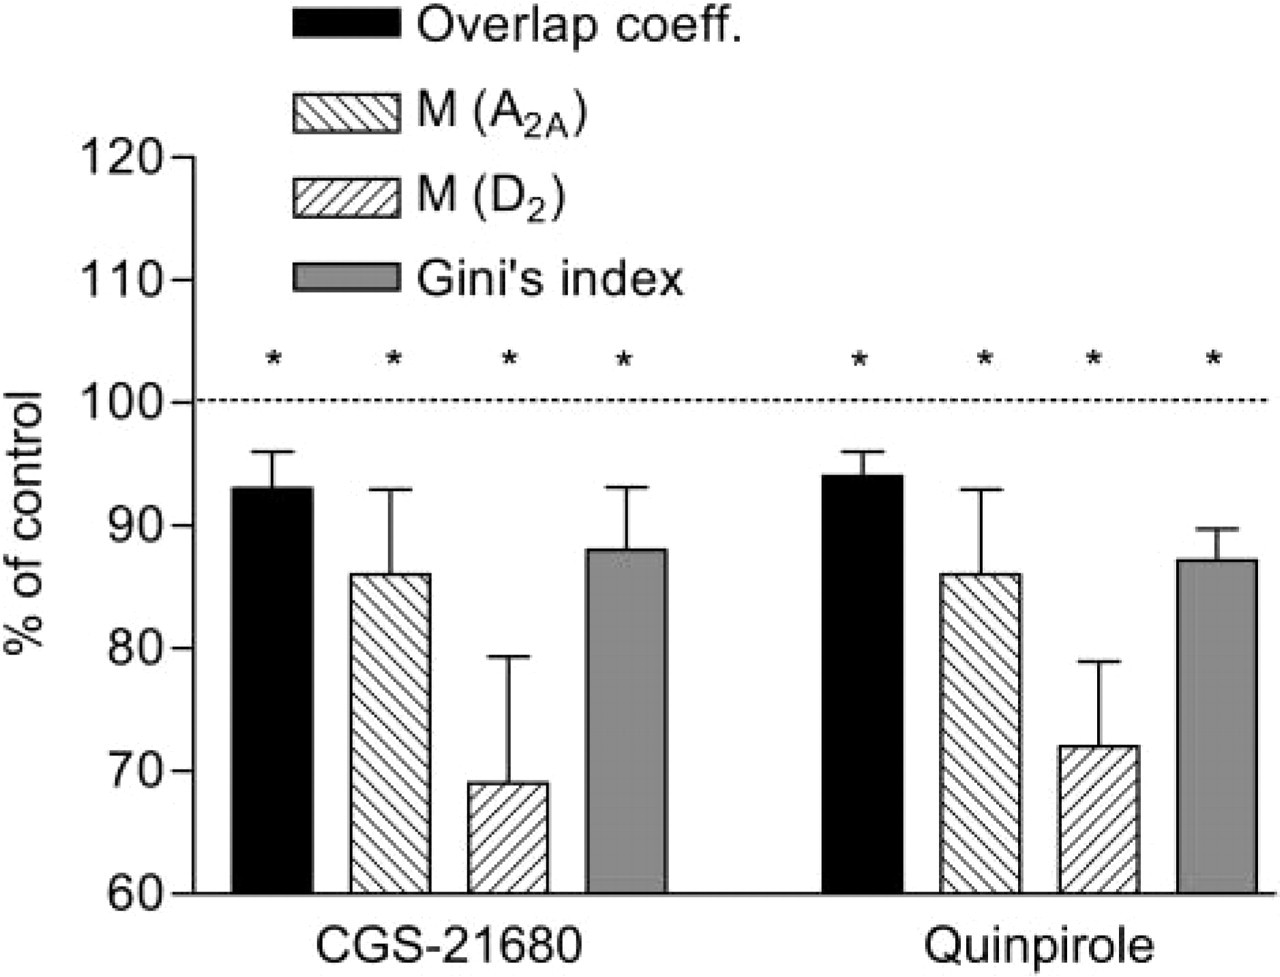
Quantitation of A2A and D2 receptor colocalization in the CHO cells after 15 hr of treatment with either quinpirole or CGS-21680. The measured parameters are expressed as percent of the value observed in the control group ±SEM. It should be noted that the M factor expresses the amount of immunoreactivity of each fluorochrome within the HCPs (number of HCPs multiplied by the mean intensity of that fluorochrome within the HCPs) as a fraction of its total immunoreactivity (area of the cell cytoplasm multiplied by the mean intensity of that fluorochrome within the cytoplasm); the overlap coefficient gives an overall evaluation of the correspondence of the R and G intensities within the entire image. The coefficient is equal to 1 and to 0 for the perfect match and mismatch between the two fluorochromes, respectively.
Correlation is a well-known statistical measure of the degree of association between two signals, and correlation-based methods are well-suited to evaluating the degree of colocalization in fluorescence microscopy of entire confocal images (Manders et al. 1992,1993). This approach, however, does not provide local information on the sites characterized by the highest level of association between the fluorochromes. Such a task is usually performed by visually inspecting the two-channel scatter plot (fluorogram) and interactively defining one or more regions of the diagram that should correspond to pixels where some correlation between the two signals occurs (McIntosh et al. 2003). On the obtained pattern, several parameters can then be evaluated. A more sophisticated approach is that proposed by Demandolx and Davoust, which allows the construction of local correlation maps (Demandolx and Davoust 1996). The regions where the association between the two patterns of fluorescence is high can then be obtained simply by thresholding the map. To compute the correlation locally, a sliding window is used, whose size is chosen according to the size of the structures where high levels of colocalization are expected to occur. This can be a limitation when areas of unpredictable size are the target of the analysis, as in the present study.
Thus, a different approach was here applied. Instead of the local correlation calculated in a window of specified size, the local contributions to the overall correlation (or overlap) coefficients were computed. Furthermore, instead of a user-defined threshold procedure, arbitrary but objective criteria based on the statistical distribution of these quantities were used to automatically identify sites of high association between the two fluorescence distributions.
When applied to test images of known characteristics, both of the proposed methods provided the expected result: they led to the recognition of dual-labeled structures in images containing a distribution of discrete Gaussian objects, or to the selection of the pixels showing the best level of correlation between the two channels in images containing a continuous distribution of brightness. Moreover, the two methods led to the identification of almost the same pattern. The extension, distribution, and colocalization level of the patterns were quantitatively evaluated using both methods, and consistent results were found, as indicated by the strong correlation observed between the data obtained using the two methods on the morphometric and densitometric parameters that are common to the two approaches.
The two methods, however, are not redundant, because each can provide additional complementary information.
The covariance method offers the possibility of detecting and quantitatively characterizing anticorrelated patterns of intensities, while the immediate detection of pixels simultaneously characterized by high correlation between the signal intensities and high concentration of labeling is a possibility offered by the multiply method.
In a previous study (Torvinen et al. 2005), through analysis using the FRET technique, we showed the presence of heteromeric A2A-D2 receptor complexes in the cotransfected CHO cell line. Furthermore, it was observed that the treatment with a D2 agonist (quinpirole) or an A2A agonist (CGS-21680) induced a co-disappearance of both A2A and D2 immunoreactivities, indicating that either A2A or D2 agonist-induced activation may cause clustering and internalization of the A2A-D2 receptor complexes. The same protocol was also used in the present study to test the proposed image analysis techniques on a real biological application. The colocalization parameters indicated a significant decrease of highly associated events 15 hr following agonist treatment, consistent with an internalization of the A2A-D2 receptor complexes. Moreover, the pattern of HCPs following treatment with either agonist resulted less-aggregated, as indicated by the significant decrease of the Gini index. Therefore, the results obtained with the image analysis techniques here described are in line with the above-mentioned findings and give them further support.
The study of receptor colocalization and trafficking, however, is not the only question that can be addressed using the methods presented here. Correlation between two patterns of fluorescence actually is a general result of the colocalization of labeled molecules, as exemplified by a variety of studies on protein coexpression (van Steensel et al. 1996; Parmryd et al. 2003), protein interaction (Petrescu et al. 2003), DNA replication (Manders et al. 1992), and organelle markers (Maletic-Savatic and Malinow 1998). The methods presented, based mainly on the search for locations where the two fluorescence signals correlate, could provide a useful tool in many different experimental investigations.
With respect to sources of error during the analysis, it should be noted that the procedures described in the present study involve the analysis of images at the pixel level. Thus, an important issue to consider is the influence of noise. As mentioned earlier, both procedures are rather insensitive to multiplicative bias, such as that introduced by differences in staining, photobleaching, or different settings of the gain of detectors. They, however, can be influenced by bias of an additive nature. Thermal noise, stray light, and blur from a specifically labeled part of the sample (Sheppard et al. 1995) can affect the result. All of these biases are characterized by statistically random fluctuations. In this study, the presence of random noise was reduced by a three-step process. Images were first acquired as the average of multiple scans. As reported by Mossberg, with this procedure, the contribution of noise decreases as 1/√n, where n denotes the number of scans (Mossberg et al. 1990). The contribution of unspecific staining was then subtracted, and median filtering was finally applied to further improve the image. This technique has proved to be a quick and simple method to obtain an S/N ratio increase, although at the expense of resolution (Landmann 2002). Because resolution was not of major concern in the present study, more-powerful (and computationally expensive) noise reduction techniques, such as deconvolution (Landmann 2002), were not used. As a result, the S/N ratio obtained was high enough to ensure a reliable discrimination of the sites of high association between the signals and an accurate measurement of the quantitative parameters, as demonstrated by the computer simulations performed by adding increasing known amounts of random noise to test images before the analysis.
Another potential source of error is the presence of cross talk between the channels. When this occurs, double labeling not related to antigen coexpression can be observed. This effect can be particularly significant when the sample is excited with more than one laser line at a time. In the present study, an acousto-optical tunable filter was used to separately set the intensities of the excitation lines to minimize the artifact during simultaneous acquisition of the images. If this device is not available or if the provided correction is not satisfactory, sequential imaging has to be performed to acquire the image data for the analysis. The proposed procedures are not linked to either modality of acquisition.
In conclusion, the present methods offer a new and sensitive approach to detecting and quantitatively characterizing associated fluorescence events and their distribution patterns in dual-color confocal laser microscopy.
Footnotes
Acknowledgements
This work has been supported by a grant from the European Commission (QLG3-CT2001–01056) and by the Italian National Research Council.
We thank Dr. Scausio (Leica Systems, Milano, Italy) and Dr. Tombesi (CIGS, University of Modena, Italy) for their careful and competent technical assistance.