
Abstract

1,1′-dioctadecyl-3,3,3′,3′-tetramethylindocarbocyanine (DiI C18(3), hereinafter called “DiI”) and 1,1′-dioctadecyl-3,3,3′,3′-tetramethylindodicarbocyanine (DiI C18(5), hereinafter called “DiD”) are fluorescent lipid analogs used to stain artificial and biological membranes. These dyes are widely used in living cell imaging studies (e.g., Danvey et al. 2008; Li et al. 2008; Leung 2009). In confocal laser scanning microscopy, DiI is usually excited by a 543- or 561-nm laser line and yields emission in the 575- to 632-nm range, whereas DiD is excited by a 633-nm laser line and emits in the 650- to 720-nm range (data according to Invitrogen; Carlsbad, CA). Both dyes consist of two indole groups linked by a polymethine chain containing three or five carbon atoms for DiI and DiD, respectively. Membrane affinity of these dyes is conferred by the presence of two long hydrocarbon chains. There are also available derivates that are compatible with long-term preservation after tissue fixation.
Recently, we made an interesting observation: prolonged laser illumination of DiD-stained (Vybrant DiD cell-labeling solution, product no. V22887, lot 550865; Invitrogen) living erythrocytes or HeLa cells by dedicated wavelength light during time-lapse confocal imaging causes the appearance of a new emission peak at shorter wavelengths while the original emission peak is reduced (Fig. 1A,B). To excite DiD, we used a 633-nm laser line (10 µW). Simultaneously, the specimen was illuminated with a 561-nm laser line (5 µW) and a 488-nm laser line (8 µW). For imaging, we used an LSM 510 META microscope with a 40× C-Apochromat NA 1.2 water immersion objective (Zeiss; Oberkochen, Germany). We used the dichroic mirror NT80/20, which does not affect the shape of dye emission spectra. The pinhole was set to 80 µm (~1 AU). The fluorescence signal was directed to the spectral META detector (Zeiss), which was set to collect fluorescence from 490 to 740 nm. The gain of the META detector (Zeiss) was set to 757 for erythrocyte and 719 for HeLa cell imaging. At the beginning of imaging of either stained erythrocytes or HeLa cells, we observed only a single emission peak centered at about 670 nm according to the specification provided by the manufacturer. After about 1 min of continuous imaging, a new peak appeared at shorter wavelengths centered at about 570 nm (Fig. 1A,B and Suppl. Fig. S1A,B).
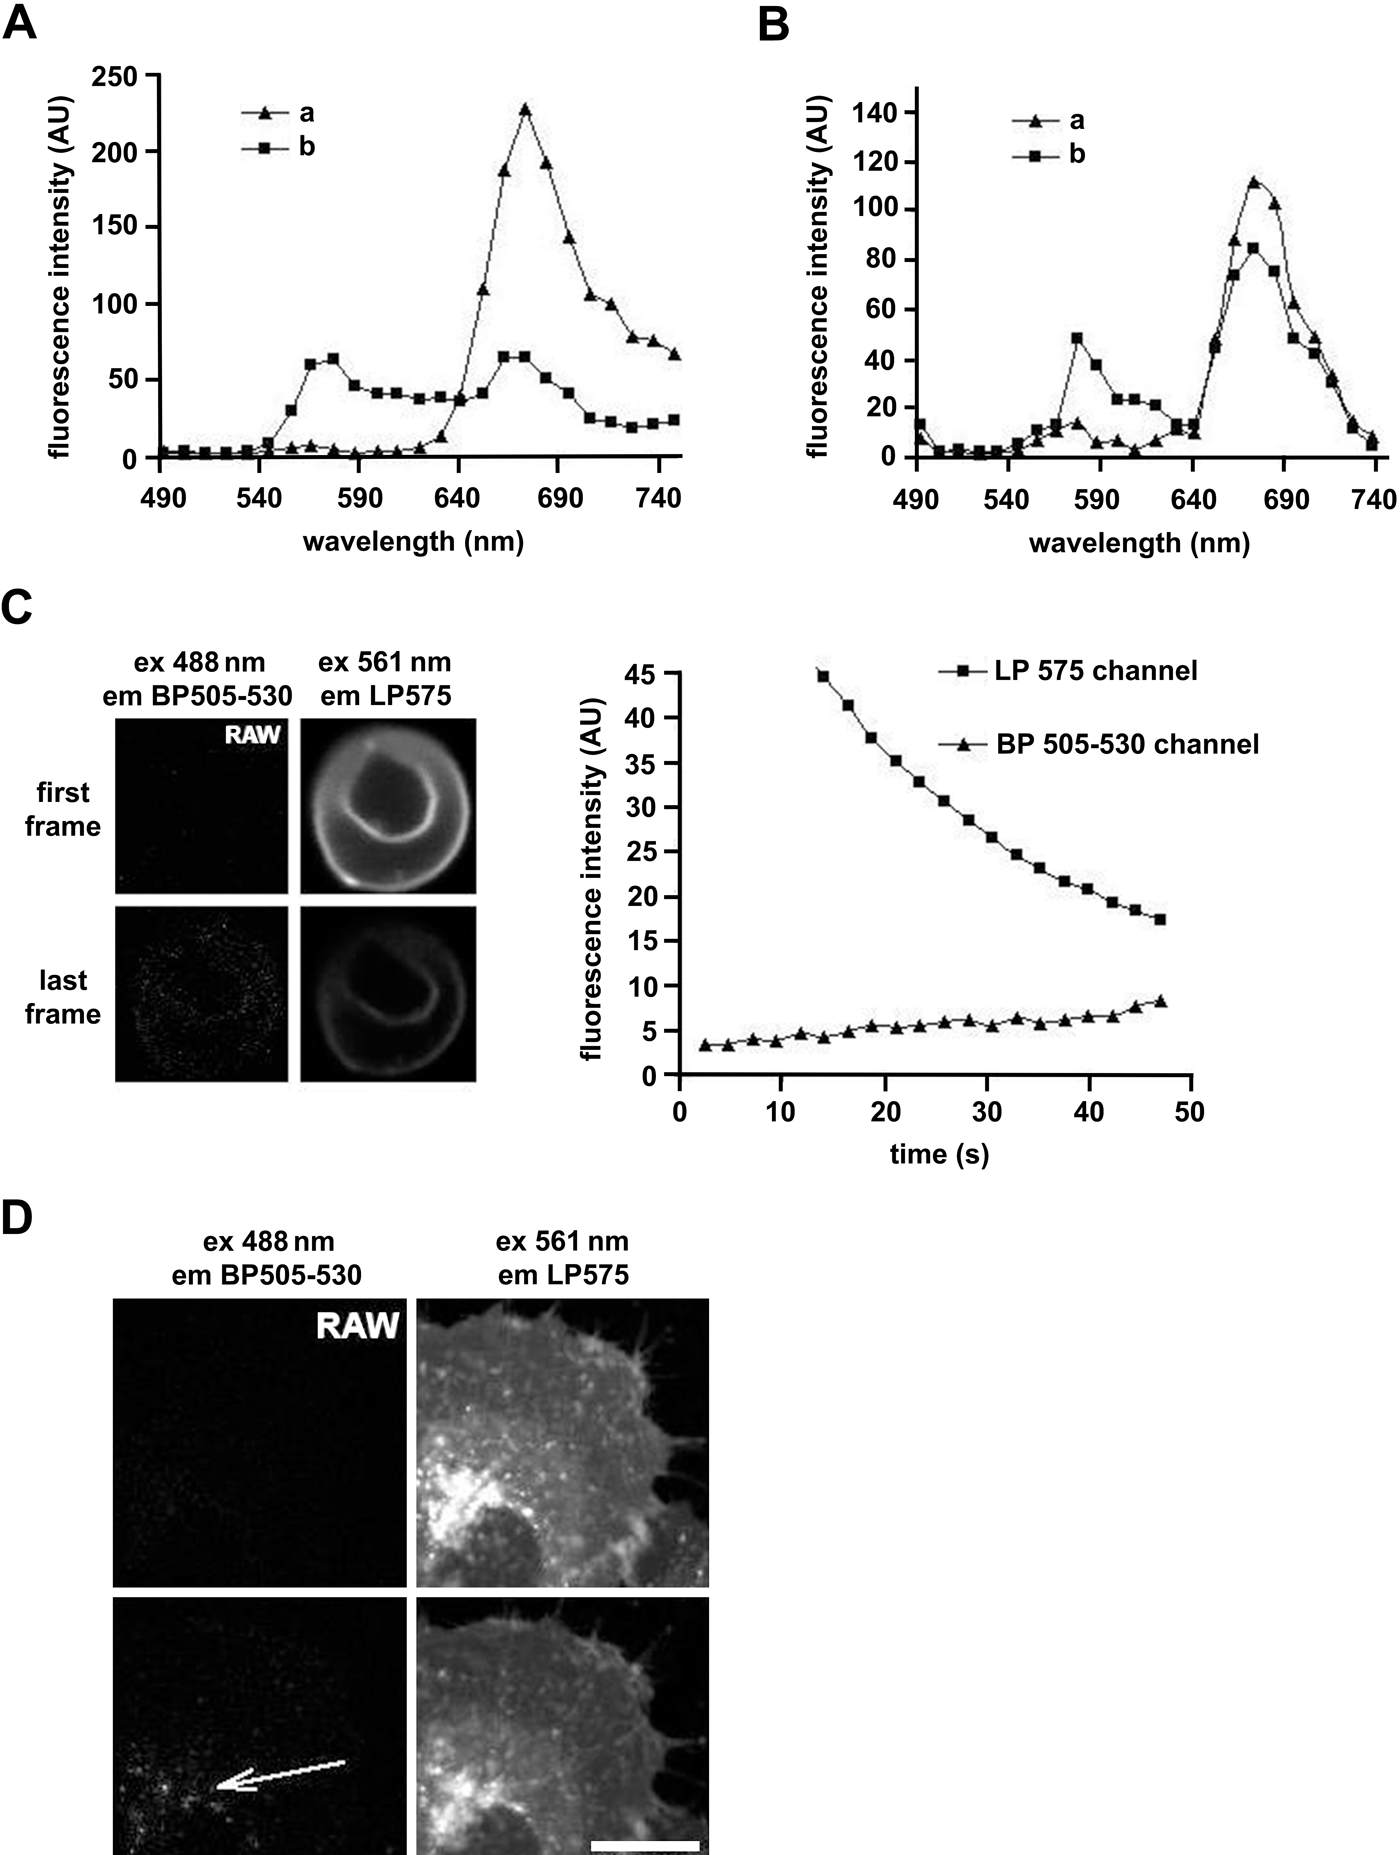
Changes in emission spectra of DiI C18(3) (DiI) and DiI C18(5) (DiD) in membranes of erythrocytes and HeLa cells. (A) Emission spectra of DiD obtained from stained erythrocytes. Imaging details are described in the text. Erythrocytes (16 × 106) obtained from healthy donors were washed twice with phosphate-buffered saline (PBS) supplemented with glucose (5.5 mM), attached to the poly-L-lysine–coated cover slips, and incubated for 10 min in 0.2 ml of PBS-glucose in the presence of DiD (5 µM). Imaging was carried out directly after washing out the dye. The DiD emission spectrum was determined from the first frame (line “a”) and from the 185 frame (line “b”). One frame was acquired per 0.3 sec. (B) Emission spectra of DiD were obtained from stained HeLa cells. Imaging details are described in the text. HeLa cells were cultured according to the standard procedure. Cells were seeded onto sterile 40-mm round cover slips placed in round Petri dishes and incubated in a humidified incubator at 37C in the presence of 5% CO2. After achieving 50–60% confluence, cells were stained with DiD by incubating in the presence of the dye (5 µM) in the media for 15 min at 37C and then washed with preheated medium. After washing out the dye, the round cover slip with HeLa cells was put into a dedicated observation chamber, placed onto a heated microscopic stage incubator (PeCon; Erbach, Germany) in the presence of 5% CO2, and left for a few minutes for temperature and gas equilibration. After that time, the imaging was performed. Line “a” presents the emission spectrum acquired from the first frame and line “b” the spectrum obtained from the last time frame (96 frames; acquisition time for each frame was 0.9 sec). DiI-stained erythrocytes (C) and HeLa cells (D) were imaged, and fluorescence was collected in two channels: BP505–530 and LP575. Imaging details are described in the text. (C, D) Upper rows present two channels of the first frame. Note that there is no signal in the BP505–530 channel. Lower rows present the same channels after about 50 sec of continuous imaging. Clearly, fluorescence is visible in the BP505–530 channel. The plot presents the increase in mean fluorescence intensity from the erythrocyte membrane in the BP505–530 channel and decrease in the LP575 channel. Erythrocytes and HeLa cells were processed and stained with DiI (5 µM) according to the same protocols as used for staining with DiD. Bar = 15 µm.
A similar effect was observed for DiI (Vybrant DiI cell-labeling solution, product no. V22885, lot 575665; Invitrogen). DiI-stained erythrocytes or HeLa cells were excited with a 561-nm laser line (100 µW), and fluorescence was collected by using a 40× C-Apochromat NA 1.2 water immersion objective (Zeiss) and was directed into the detector through an LP 575 emission filter (channel LP575). The cells were also sequentially illuminated with a 488-nm laser line (8 µW) and fluorescence collected by a second detector dedicated for narrow eGFP-like (enhanced Green Fluorescent Protein) emission through a BP505–530 filter (channel BP505–530). Pinholes in both channels were set to 1 AU, and detector gain for erythrocyte imaging was set to 879, whereas for HeLa cells, imaging was set to 750. DiI fluorescence after excitation with a 488-nm laser line can be detected in the channel of BP505–530 nm; however, in our experiments, the detector gain and the laser power were adjusted so at the beginning of the experiments, the signal in the eGFP-dedicated channel was kept slightly above detection threshold (Fig. 1, upper row in C and D). However, after acquiring several frames, a signal in the channel of BP505–530 nm was much stronger than at the beginning of imaging while the original emission signal was reduced (Fig. 1, lower row in C and D, and Suppl. Fig. S1C,D). In the case of DiI, we were unable to detect any changes in emission spectra of the dye by using the META detector (Zeiss) presumably due to lower sensitivity of this detector. Unstained cells imaged in the same conditions did not reveal even weak autofluorescence in any of the investigated spectral regions.
To the best of our knowledge, this is the first report that shows the changes of fluorescence spectra of DiI and DiD employed to stain living cells, which were evoked by laser illumination. The described phenomena could strongly affect fluorescence resonance energy transfer measurements with an acceptor bleaching technique in a similar fashion to that previously reported for the CFP (Cyan Flourescent Protein) and YFP (Yellow Flourescent Protein) pair (Kirber et al. 2007). It could also lead to other artifacts such as impression of the probe relocalization in multiple labeled imaging of living specimens.
The exact mechanism of the described phenomena remains unknown to us. There is a possibility that upon illumination, the molecules of the dyes undergo either chemical reaction or aggregation that leads to the formation of new species of the dyes with different fluorescent properties. Further studies are required to elucidate the molecular basis of the observed phenomena.
Footnotes
Declaration of Conflicting Interests
The authors declared no potential conflicts of interest with respect to the research, authorship, and/or publication of this article.
Funding
The authors received no financial support for the research, authorship, and/or publication of this article.