
Abstract
Neurochemical and morphological changes in the carotid body are induced by chronic hypoxia, leading to regulation of ventilation. In this study, we examined the time courses of changes in immunohistochemical intensity for tyrosine hydroxylase (TH) and cellular volume of glomus cells in rats exposed to hypoxia (10% O2) for up to 24 hr. Grayscale intensity for TH immunofluorescence was significantly increased in rats exposed to hypoxia for 12, 18, and 24 hr compared with control rats (p<0.05). The transectional area of glomus cells was not significantly different between experimental groups. The TH fluorescence intensity of the glomus cells exhibited a strong negative correlation with the transectional area in control rats (Spearman's ρ = −0.70). This correlation coefficient decreased with exposure time, and it was lowest for the rats exposed to hypoxia for 18 hr (ρ = −0.18). The histogram of TH fluorescence intensity showed a single peak in control rats. The peaks were gradually shifted to the right and became less pronounced in hypoxia-exposed rats, suggesting that a hypoxia-induced increase in TH immunoreactivity occurred uniformly in glomus cells. In conclusion, this study demonstrates that short-term hypoxia induces an increase in TH protein expression in rat carotid body glomus cells.
T
In animals exposed to chronic hypoxia, it has been reported that mRNA coding for TH in carotid body was increased 1.84-fold after mouse was exposed to 10% O2 for 1 day (Ganfornina et al. 2005) and increased 3-fold after rat was exposed to 10% O2 for 1 week (Wang and Bisgard 2002). In addition to the upregulation of TH mRNA, it has also been reported that TH immunoreactivity is enhanced in glomus cells of the cat carotid body after 2 weeks of exposure to 10% O2 (Wang et al. 1998). Furthermore, it is known that dopamine content in the rat carotid body increases after exposure to hypoxia for 2 days (Hanbauer et al. 1981), 1 week (Olson et al. 1983), 2 weeks (Hui et al. 2003), and 4 weeks (Pequignot et al. 1987). It is also reported that noradrenaline increases in rat carotid body after 2 weeks (Hui et al. 2003) and 4 weeks (Pequignot et al. 1987) of exposure to 10% O2. On the other hand, the size of the carotid body was increased in rats exposed to hypoxia (10% O2) for 3–4 weeks (Hanbauer et al. 1981; Dhillon et al. 1984; Kusakabe et al. 2005). In addition to the size of the organ, exposure to hypoxia (10% O2) for 2 and 4 weeks caused increases in the volume of glomus cells of the rat carotid body by 1.4- and 3.5-fold, respectively (McGregor et al. 1984; Pequignot et al. 1984). Furthermore, the rate of mitosis of glomus cells was also increased in the rats exposed to hypoxia (Dhillon et al. 1984; Bee and Pallot 1995). Thus, previous studies for chronic hypoxia-induced changes in carotid body have been performed using animals exposed to hypoxia for a long term, in the order of days to weeks. On the contrary, Czyzyk-Krzeska et al. (1992a), using rats exposed to hypoxia for periods lasting from 1 to 48 hr, found that TH mRNA was upregulated in glomus cells after exposure to hypoxia (10% O2) for 1 hr and that the concentration of TH mRNA was increased by hypoxia at all time points. However, it is unknown whether short-term hypoxia induces changes in carotid body, including changes of TH protein expression and cell volume in glomus cells, or not.
In this study, the fluorescence intensity of TH immunoreactivity was measured in the glomus cells of rats exposed to hypoxia (10% O2) for 0–24 hr to reveal changes in TH expression at an early stage of hypoxic exposure. Meanwhile, the transectional sizes of glomus cells were also examined. Finally, we discuss the changes in sensory systems for adaptation to short-term hypoxia.
Materials and Methods
Animals and Experimental Treatments
Male Wistar rats (8–11 weeks old) were used in this study. All procedures for animal handling were performed in accordance with the guidelines of the local animal ethics committee of Iwate University. All the rats were exposed to normobaric hypoxia (10% O2) for 2, 4, 8, 12, 18, or 24 hr (five to seven rats for each period). Each rat was placed in a cage (16 × 27 × 13 cm 3 ) and set in an acrylic chamber (34 × 34 × 39 cm 3 ). The levels of O2 in the chamber were continuously monitored by a gas analyzer connected with a solenoid valve. When O2 concentration increased above 10.5%, the solenoid valve was opened to flow N2 gas to induce hypoxia. The gases in the chamber were mixed by fan and were allowed to leak from small hole to prevent positive pressure. In this system, the oxygen concentration in the chamber was kept between 9.5% and 10.5% during the experiment. The CO2 level in the chamber was monitored during hypoxic exposure and was kept low (<1%). During each exposure, rats received water and food ad libitum.
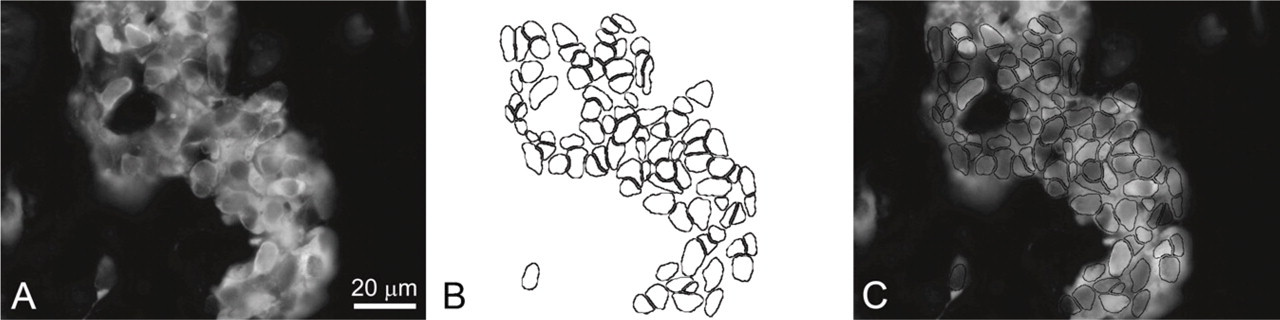
Method for measurements of immunoreactive intensity for tyrosine hydroxylase (TH) and transectional area of the glomus cells. Grayscale images of the section stained for TH (
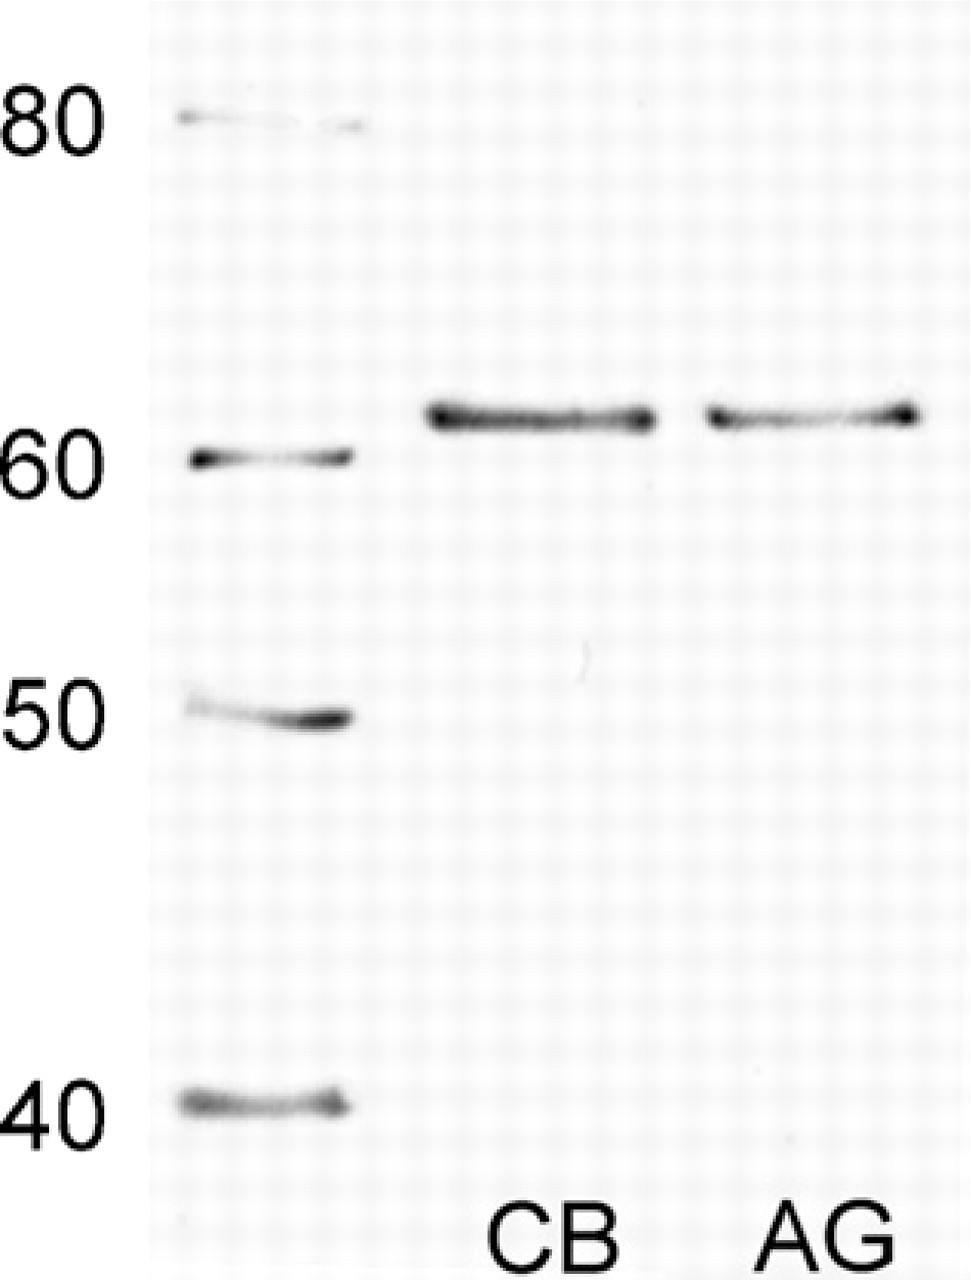
Immunoblotting analysis for TH in rat carotid body (CB) and adrenal gland (AG). The numbers on the left indicate the molecular mass (kDa). It is noteworthy that not only the result for the AG but also the result for the carotid body shows a band of TH (∼60 kDa).
After exposure to hypoxia, each rat was anesthetized with pentobarbital sodium (15 mg/kg; IP injection) and transcardially perfused through the ascending aorta with Ringer's solution (200 ml) and then with 4% paraformaldehyde in 0.1 M phosphate buffer containing 0.5% picric acid (pH 7.4; 200 ml). The bifurcation of carotid arteries was removed and further fixed with the same fixative overnight at 4C. Then, the tissues were rinsed in PBS (pH 7.4), soaked in 30% sucrose in PBS, and frozen with OCT compound medium (Sakura Finetech; Tokyo, Japan). The tissues were serially sectioned at a thickness of 10 μm using a cryostat and mounted on glass slides coated with chrome alum-gelatin.
Double Immunofluorescence
The cryostat sections were rinsed with PBS and incubated for 30 min with non-immune donkey serum (1:50 dilution) at room temperature. Then, the sections were rinsed with PBS and incubated overnight at 4C with monoclonal mouse antibody against TH (1:1000 dilution; MAB318, Chemicon, Temecula, CA) together with polyclonal rabbit antibody against human protein gene product 9.5 (PGP 9.5; 1:5000 dilution, RA95101, Ultraclone, Isle of Wight, UK). The sections were then rinsed with PBS and incubated for 90 min with Alexa Fluor 488-labeled donkey anti-mouse IgG (1:200 dilution; A21202, Invitrogen, Tokyo, Japan) together with tetramethylrhodamine isothiocyanate-labeled donkey anti-rabbit IgG (1:100 dilution; 711–025–152, Jackson ImmunoResearch Laboratories, West Grove, PA) at room temperature. The sections were placed under cover slips with glycerol-PBS and examined using an epifluorescence microscope (E600; Nikon, Tokyo, Japan), and color digital images for immunoreactivities for TH and PGP 9.5 were obtained at the same field with a digital camera (DS-L2; Nikon, Tokyo, Japan) under the same conditions (e.g., magnification, shutter speed, and iris). Controls of immunofluorescence for TH were performed by omission of the primary antibody in the original reaction sequences.
For morphometrical analysis, grayscale intensity (GI; range 0–255: black = 0, white = 255) of TH immunofluorescence and transectional area were simultaneously measured using NIH Scion Image analysis program (Scion Corporation; Frederick, MD) on a personal computer. The micrographs of the TH immunofluorescence were converted into grayscale images (256 shades of gray) for measurement of TH fluorescence intensity (Figure 1A). Glomus cells were outlined in the same area on the basis of PGP 9.5 immunoreactivity for measurement of transectional area (Figure 1B) and then merged with the image of TH immunoreactivity (Figure 1C). Then, a scatter graph was plotted and the Spearman's ρ of each experimental group was calculated to assess the correlation between TH fluorescence intensity and transectional area of glomus cells. At least 750 glomus cells were randomly measured for each experimental group.
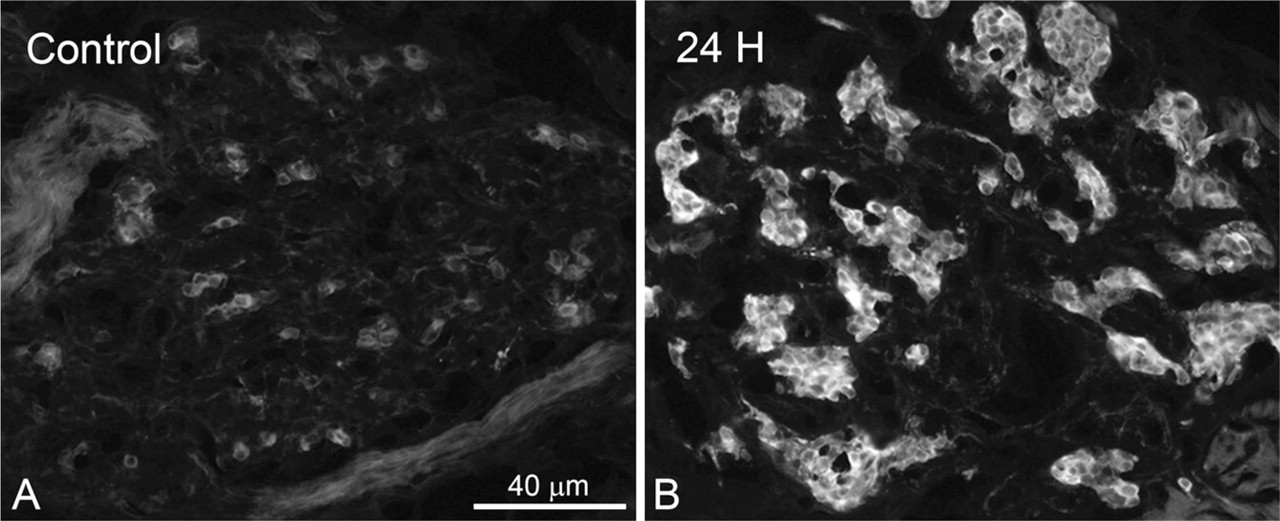
Immunoreactivity for TH in CB of control rats (
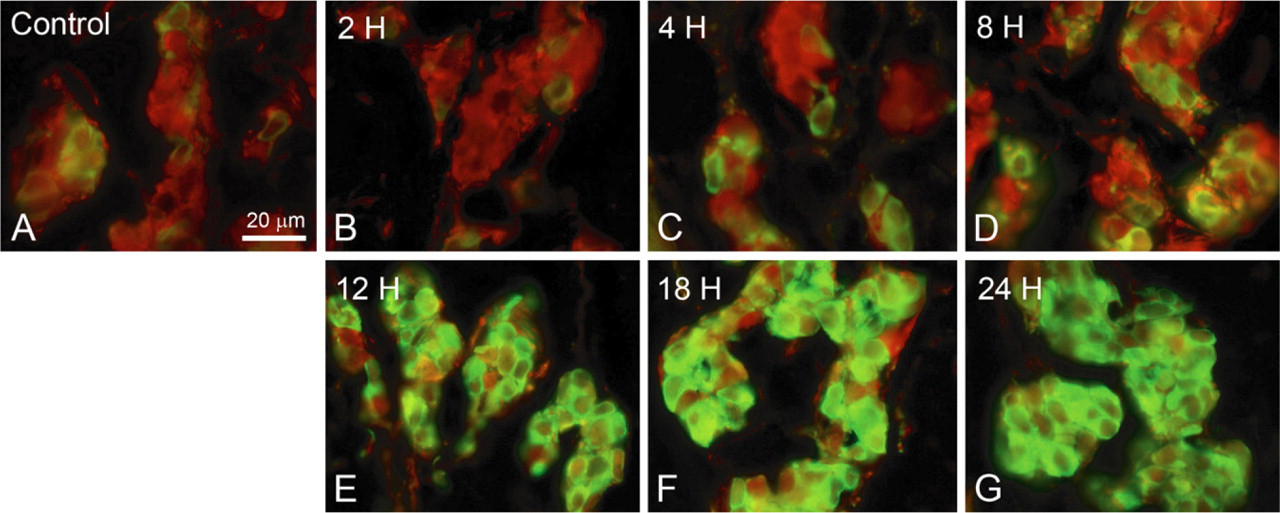
Double immunofluorescence images for TH and PGP 9.5. Green fluorescence indicates TH immunoreactivity, and red fluorescence indicates PGP 9.5 immunoreactivity. TH-immunoreactive glomus cells were scarce in the control group (
Specificity of Anti-TH Antibody
The previous reports confirmed the specificity of mouse monoclonal anti-TH antibody (MAB318; Chemicon) to TH protein in the nucleus of solitary tract of rat (Austgen et al. 2009) and the striatum of rat (Ambrosi et al. 2010). However, it is uncertain that the anti-TH antibody is specific to TH protein in carotid body. Therefore, immunoblot analysis was performed to clarify the specificity of anti-TH antibody in carotid body tissue.
Tissue samples (carotid body and adrenal gland as positive control) were collected from untreated male Wistar rats (8–9 weeks old) and homogenized in lysis buffer (20 mM Tris-HCl; pH 7.5) with protease inhibitor cocktail (P8340; Sigma, St Louis, MO). Homogenates of tissue samples were then added to an equal volume of 2X sample buffer [125 mM Tris-HCl (pH 6.8), 4% SDS, 20% glycerol, 0.002% bromophenol blue] containing 10% 2-mercaptoethanol and were denatured by boiling at 95C for 5 min. The loading samples of carotid body contained total protein from a pair of carotid bodies from a rat. Protein concentration of adrenal gland sample was determined using a commercial kit based on the Bradford assay (500–0006; Bio-Rad Laboratories, Tokyo, Japan), and the loading samples contained 0.5 μg protein extracts from adrenal gland. The boiled samples were loaded into wells of a 10% SDS polyacrylamide gel. Size markers (MagicMark XP Western Protein Standard; Invitrogen, Tokyo, Japan) were also loaded to measure molecular mass. The samples were separated by electrophoresis with running buffer (25 mM Tris, 192 mM glycine, 0.1% SDS) and electroblotted to polyvinylidene fluoride membranes with transfer buffer (25 mM Tris, 192 mM glycine, 0.1% SDS, 20% methanol) for 60 min. The membranes were blocked for 1 hr at room temperature in blocking buffer [10 mM Tris-HCl (pH 8.0), 100 mM NaCl, 0.1% Tween 20, 2.5% BSA] and incubated overnight at 4C with monoclonal mouse antibody against TH (1:1000 dilution; MAB318, Chemicon). The membranes were then incubated for 1 hr at room temperature with horseradish peroxidase-conjugated donkey antibody against mouse IgG (1:1000 dilution; 715–035–150, Jackson ImmunoResearch Laboratories). Finally, immunoreactive sites were visualized with 0.02% DAB in Tris-HCl buffer solution (pH 7.4) in the presence of 0.006% H2O2 for 10–15 min.
Raw data of tyrosine hydroxylase (TH) fluorescence intensity and transectional area of glomus cells
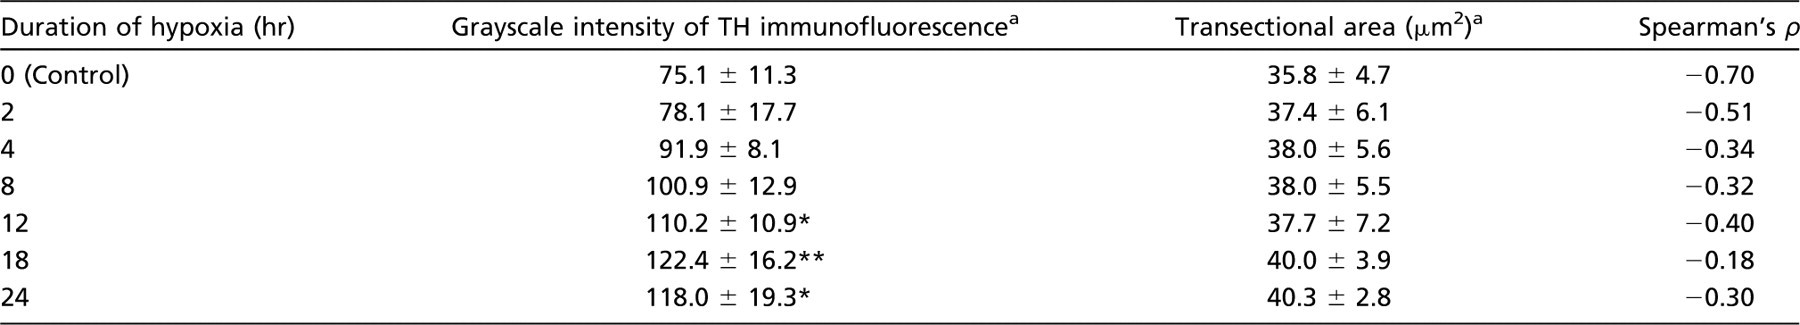
Mean ± SD values are shown.
p<0.05, comparison with control group and group exposed to hypoxia for 2 hr.
p<0.05, comparison with control group and groups exposed to hypoxia for 2 and 4 hr.
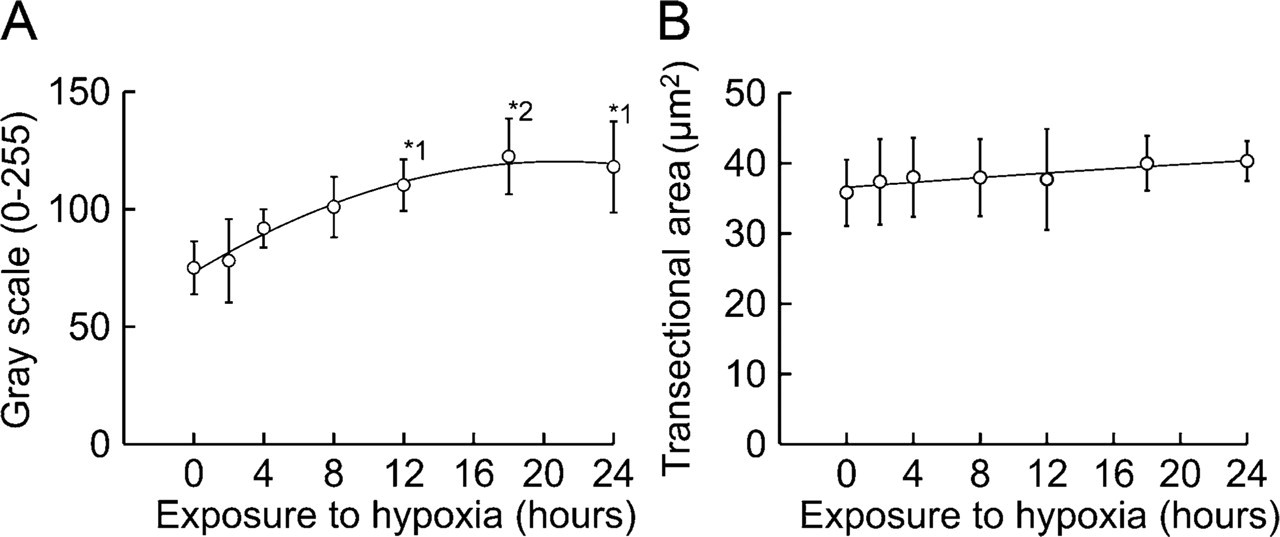
Graphs for TH fluorescence intensity (
Statistical Analysis
TH fluorescence intensity and transectional area of glomus cells were given as mean ± SD and analyzed by oneway ANOVA with post hoc Tukey-Kramer test, where applicable. p Values less than 0.05 were considered statistically significant. The correlation between TH fluorescence intensity and transectional area of each glomus cell was analyzed by Spearman's rank correlation coefficient (ρ) and confirmed by use of a permutation test (p<0.01).
Results
In immunoblot analysis, TH showed a molecular mass of ∼60 kDa in the carotid body sample and the adrenal gland sample (Figure 2). In the carotid body, TH immunoreactivity was observed in the glomus cells and varicose nerve fibers around glomus cell clusters (Figure 3). On the other hand, no immunoreactivity was observed in the sections from which anti-TH antibody was omitted (data not shown). TH immunoreactivity appeared to be enhanced in the rats exposed to hypoxia for 24 hr (Figure 3B) compared with control rats (Figure 3A). In all experimental groups, TH immunoreactivity was observed in the cytoplasm of glomus cells and nerve fibers and not in the nuclei of glomus cells (Figure 4). PGP 9.5 immunoreactivity was also observed in the cytoplasm of glomus cells and thin nerve fibers between clusters of glomus cells. In the control rats, a few glomus cells exhibited an intense immunoreaction for TH, but most cells exhibited weak reactions (Figure 4A). The TH immunoreactivity in glomus cells of the rats exposed to hypoxia for 2 hr was similar to that of control rats (Figure 4B). The intensely stained glomus cells were increased in number in the carotid body of rats exposed to hypoxia for 4 and 8 hr (Figures 4C and 4D). Furthermore, almost all the glomus cells exhibited an immunoreaction for TH in the carotid bodies of rats exposed to hypoxia for 12, 18, and 24 hr (Figures 4E – 4G). PGP 9.5 immunoreactivity in glomus cells was uniform between control rats and rats exposed to hypoxia.
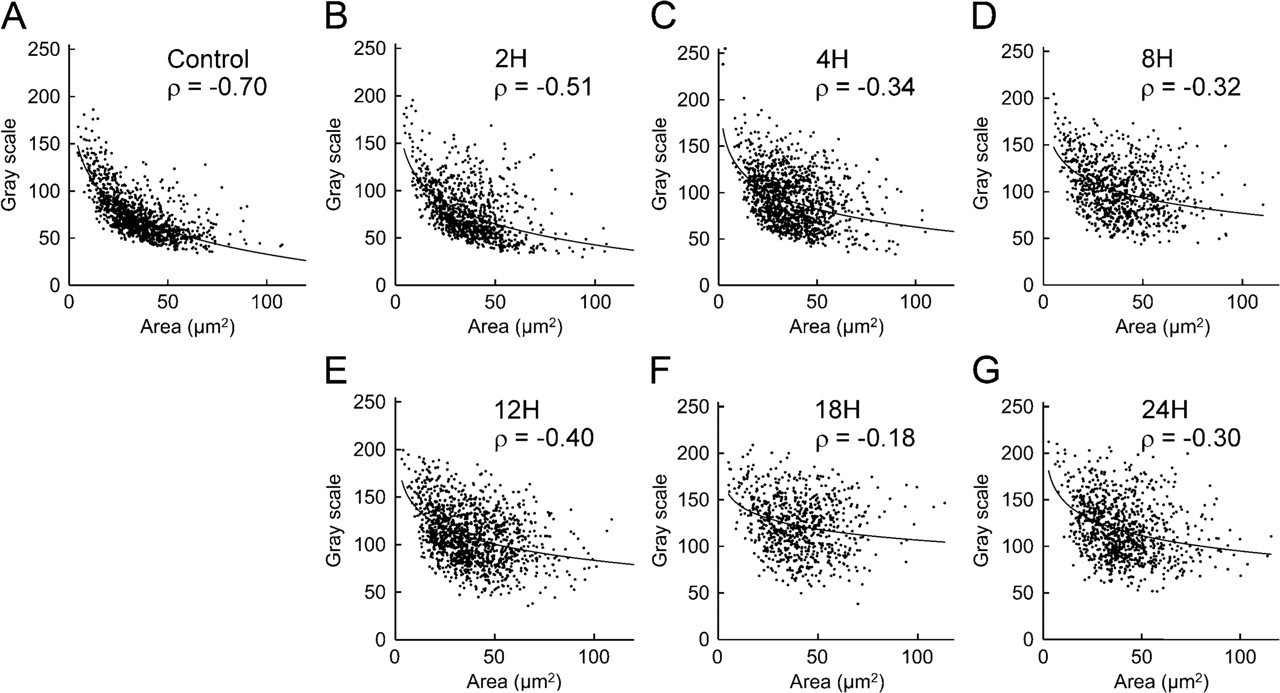
Scatter graph of control group (
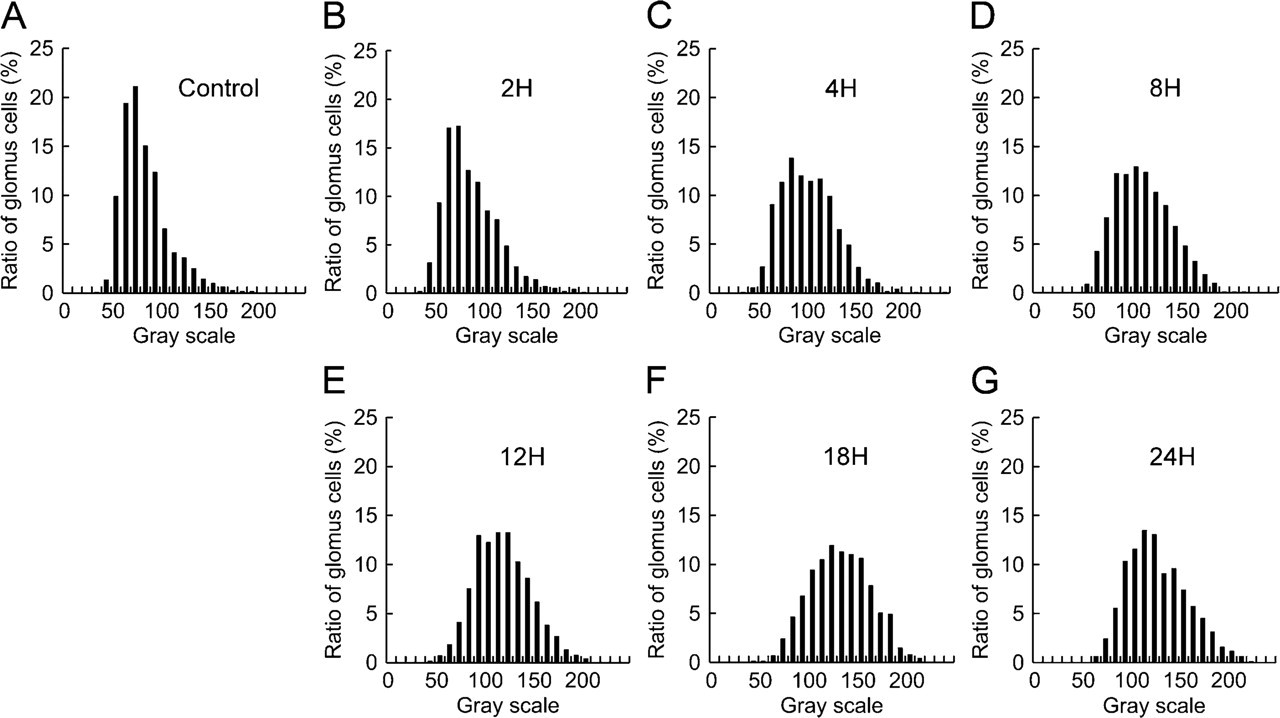
Histogram of TH fluorescence intensity of glomus cells. Histograms of control group (
TH fluorescence intensity showed a significant increase (p<0.05) in rats exposed to hypoxia for 12, 18, and 24 hr compared with control rats (Table 1 and Figure 5A). For the control rats, GI for TH immunofluorescence was 75.1 ± 11.3. GI values for rats exposed to hypoxia for 12, 18, and 24 hr were 110.2 ± 10.9, 122.4 ± 16.2, and 118.0 ± 19.3, respectively. The transectional area of each glomus cell ranged from 35 to 45 μm 2 in all experimental groups and was not significantly different between control rats and rats exposed to hypoxia (Table 1 and Figure 5B).
In the control rats, TH fluorescence intensity was higher in small glomus cells and lower in large glomus cells. In a scatter graph showing the results for the control group, plotted dots aggregate near the logarithmic approximate curve, indicating a strong negative correlation (ρ = −0.70; Figure 6A). In the rats exposed to hypoxia, Spearman's ρ decreased with increased duration of hypoxic exposure (Figures 6B – 6G). Spearman's ρ was lowest of all the experimental groups in the rats exposed to hypoxia for 18 hr, and the plotted dots are widely scattered in the graph (Figure 6F). Values of Spearman's ρ are also shown in Table 1.
Histograms for the GI values for TH immunofluorescence and the transectional area are shown in Figures 7 and 8, respectively. In the control rats, the histogram of TH fluorescence intensity shows a distribution with a sharp single peak at the GI range from 70 to 80 (21%; Figure 7A). However, in the rats exposed to hypoxia, the peak is less pronounced and shifted to the right (Figures 7B – 7G). The proportion of glomus cells in rats exposed to hypoxia for 2, 4, 8, 12, 18, and 24 hr was the highest in the GI range of 70–80 (17%), 80–90 (14%), 100–110 (13%), 110–120 or 120–130 (13%), 120–130 (12%), and 110–120 (13%), respectively. In terms of the transectional area of glomus cells, the histogram shows a distribution with a single peak in the range of 40–50 μm 2 in both control (Figure 8A) and hypoxic groups (Figures 8B – 8G).
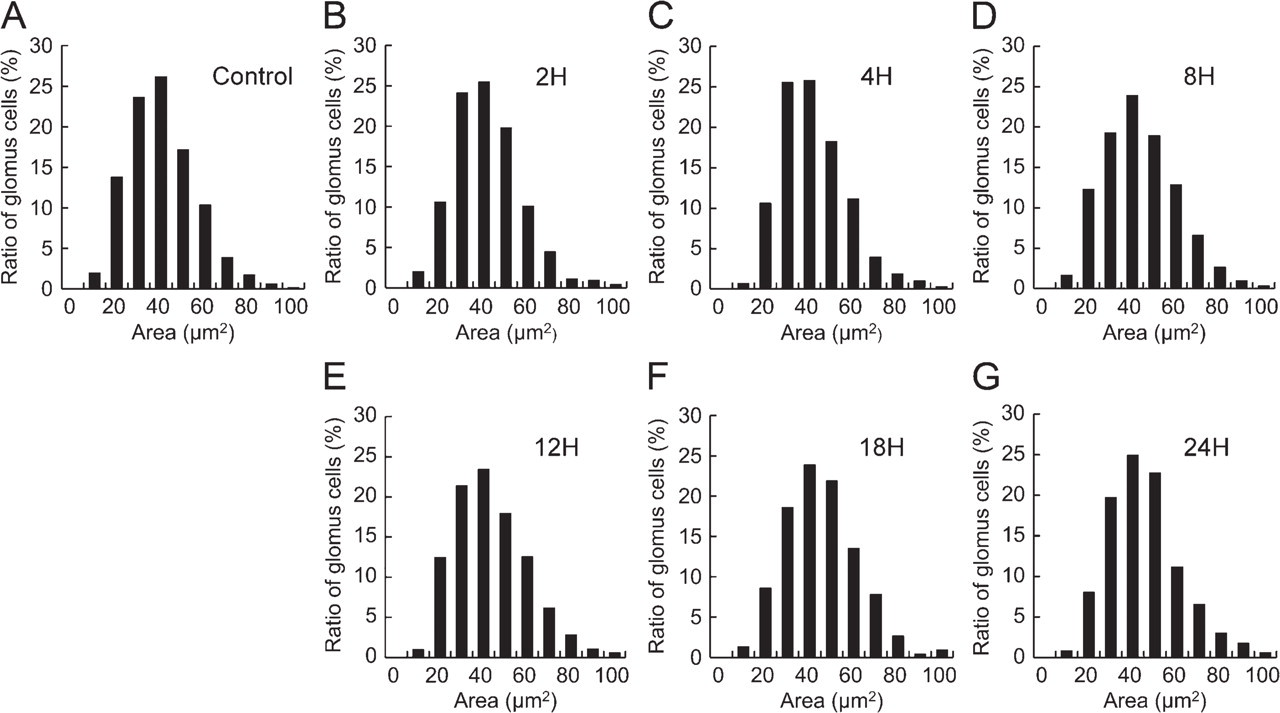
Histogram of transectional area of glomus cells. Histograms of control group (
Discussion
In this study, we reported a significant increase in the TH fluorescence intensity of the glomus cells by short-term hypoxia. In previous reports, the number of glomus cells with intense immunoreactivity for TH was reported as being increased in rats exposed to 10% O2 for 2–4 weeks, and it was suggested that chronic hypoxia induces catecholamine synthesis in the carotid body (Wang et al. 1998; Wang and Bisgard 2002). According to early neurochemical changes in glomus cells, ISH techniques confirmed that the TH mRNA level in rat carotid body glomus cells was upregulated by hypoxia of 10% O2 (Czyzyk-Krzeska et al. 1992a). This study revealed that TH mRNA increased in glomus cells after hypoxic exposure for 1 hr and reached a peak after hypoxic exposure for 6 hr, and TH mRNA level maintained above control level after hypoxic exposure for up to 48 hr. Therefore, TH protein expression in glomus cells in this study would be increased after the rapid increase in TH mRNA in response to hypoxia, and the enhanced TH protein level would be maintained by elevated TH mRNA.
In the rat carotid body, a large amount of dopamine was present with a small amount of noradrenaline (Hui et al. 2003), and the ratio of dopamine/noradrenaline is ∼5:1 (Vicario et al. 2000). Hanbauer et al. (1981) reported that 2 days of exposure to 10% O2 elicited an ∼4-fold increase in dopamine concentration of rat carotid body compared with that of untreated rats, but this exposure did not augment noradrenaline concentration in the rat carotid body. Therefore, TH increase, observed in the present study, mainly contributes to dopamine synthesis in carotid body glomus cells rather than to noradrenaline synthesis.
In the carotid body, the hypoxia-induced increase in chemosensory discharge of the carotid sinus nerve was transiently inhibited by dopamine application in cats (Iturriaga and Alcayaga 2004). It has also been reported that carotid sinus nerve activity was augmented by the application of domperidone, a dopamine D2 receptor antagonist (Iturriaga et al. 1994; Herman et al. 2003). Short-term hypoxia-induced TH may lead to the synthesis of dopamine to reduce chemosensory afferent nerve activity. It is suggested that in addition to the afferent neural discharge, dopamine would be associated with respiratory modulation. It has been reported that ventilatory acclimatization to hypoxia (VAH) occurs in human and animals exposed to chronic hypoxia (Powell et al. 1998), and changes in carotid body O2 sensitivity contribute to VAH (Howard and Robbins 1995; Powell et al. 1998). In the carotid body, it has been suggested that dopamine regulates excitatory neurotransmitter release from glomus cells via action on D2 autoreceptors (Benot and Lopez-Barneo 1990; Nurse 2005). Therefore, an increase in the level of dopamine by short-term hypoxic exposure might contribute to VAH via negative regulation of continuous discharge of the carotid sinus nerve.
It has been reported that the volumes of glomus cells were increased by exposure to hypoxia for 3–4 weeks (Dhillon et al. 1984; McGregor et al. 1984). Although there is no evidence concerning volume increase of glomus cells in the rats exposed to hypoxia for up to 24 hr, the volume of glomus cells may increase in cases of more extensive hypoxic exposure. On the other hand, other reports have stated that glomus cells can be divided into cell subpopulations based on the size of dense-core vesicles and/or innervation (McDonald and Mitchell 1975; Hansen 1981) and differences in α-bungarotoxin-binding affinity (Chen and Yates 1984). These reports suggest the existence of heterogeneity in glomus cell populations. However, the histogram of TH fluorescence intensity in each glomus cell showed single peak configuration in both control and experimental groups. Thus, heterogeneity of glomus cells could not be defined by TH immunofluorescence. There were no apparent changes in cell volume whereas Spearman's ρ decreased along with hypoxic exposure. Therefore, we confirmed that TH immunoreactivity uniformly increased in each glomus cell of the rats exposed to short-term hypoxia. Previous immunohistochemical study showed increased TH immunoreactivity in the glomus cells of cats exposed to 10% O2 for 2 weeks, and the proportion of glomus cells with high TH immunoreactivity increased to 93% from 35% in the control (Wang et al. 1998). Therefore, the present results may be similar to the results of previous studies using the rats exposed to longer hypoxic condition.
In conclusion, this study demonstrates that short-term hypoxia induces an increase in TH protein expression in rat carotid body glomus cells.
Footnotes
Acknowledgements
This study was partly supported by the Grant-in-Aid from the Japan Society for the Promotion of Science, Japan (19380166).