
Abstract
Detection and quantitation of phosphoproteins (PPs) in fixed tissues will become increasingly important as additional inhibitors of protein kinases enter clinical use and new disease entities are defined by molecular changes affecting PP levels. We characterize fixation conditions suitable for accurate PP quantitation that are achievable in a clinical laboratory and illustrate the utility of in situ quantitation of PPs by quantum dot (QD) nano-crystals in two models: (1) a therapeutic model demonstrating effects of a targeted therapeutic (quantitative reduction of phospho-GSK3β) in xenografts treated with enzas-taurin; and (2) a diagnostic model that identifies elevated levels of nuclear phospho-STAT5 in routine bone marrow biopsies from patients with acute myeloid leukemia based on the presence of the activating FLT3-ITD mutation. Finally, we document production of a well-characterized tissue microarray of widely available cell lines as a multilevel calibrator for validating numerous phosphoprotein assays. QD immunofluorescence is an ideal method for in situ quantitation of PPs in fixed samples, providing valuable cell type—specific and subcellular information about pathway activation in primary tissues.
Immunofluorescence (IF) microscopy is a well-characterized technique for the detection of proteins and antigens in tissue sections. However, commonly used organic fluorescent dyes are limited by photobleaching, broad emission spectra, and variable quantum yield (Ono et al. 2001). Quantum dot (QD) nanoparticles are inorganic manufactured fluorophores that represent a technological advance in the imaging of patient tissues (Lidke et al. 2004). QDs have the advantage of high quantum yield, narrow and controllable emission spectra, and resistance to photobleaching (Chan et al. 2002). These properties have opened new possibilities for advanced molecular and cellular imaging as well as for ultrasensitive bioassays and diagnostics (Gao and Nie 2003; Jovin 2003; Gao et al. 2004; Tholouli et al. 2008).
In this study, tissue handling conditions are explored that allow accurate quantitation of PPs in fixed tissues. We then show successful application of QD IF quantitation of PPs in fixed tissues using in vitro and in vivo models as proof of principle. Our results provide a foundation for understanding tissue handling requirements for in situ PP detection in primary human tissues in the clinical setting. This represents an expanding area of investigation (functional phenotyping) that may have implications for pathologists in disease diagnosis, disease classification, therapy selection, and therapeutic monitoring.
Materials and Methods
Materials and Cell Lines
LR3-IGF-1 was purchased from GroPep (Adelaide, Australia). Enzastaurin was kindly provided by Eli-Lilly (Indianapolis, IN). Streptavidin-conjugated QDs (605 and 655 nm) were obtained from Ventana Medical Systems (Tucson, AZ). Fixatives used: 10% buffered formalin (Cardinal Health; Dublin, OH), Zn formalin, B5 (Poly Scientific; Bayshore, NY), UMFIX (Tissue-Tek Xpress; Sakura, Torrance, CA), and Prefer (Anatech; Battle Creek, MI). All anti-phospho-protein antibodies, other than rabbit anti-phospho-PS6KB1 (T389) (Epitomics; Burlingame, CA), were obtained from Cell Signaling Technology (Danvers, MA). PC-3, MCF-7, and UT7/erythropoietin (EPO) cell lines were kindly provided by Dr. Lindner and Dr. Schade (Cancer Center, Cleveland Clinic; Cleveland, OH). SU-DHL-6 and Karpass 299 cell lines were purchased from DSMZ (Braunschweig, Germany). The rest of the cell lines come from ATCC (Manassas, VA).
Cell Blocks, Tissue Microarray, and Case Selection
Cells were fixed with 10% buffered formalin overnight. Paraffin-embedded cell blocks were prepared using the HistoGel system (Richard-Allan Scientific; Kalamazoo, MI) for immunohistochemistry (IHC). All samples were processed overnight using conventional histological techniques and embedded in paraffin, using an automatic apparatus (Tissue-TEK VIP; Miles Scientific, Naperville, IL). The melted wax temperature did not exceed 60C. The tissue microarray (TMA) was constructed from different paraffin-embedded cell lines with 1-mm-diameter cores. Six FLT3-ITD—positive and eight FLT3-ITD—negative acute myeloid leukemia (AML) cases were retrieved from the archives of the Division of Pathology and Laboratory Medicine at the Cleveland Clinic. All biopsies were fixed immediately (in less than 1 min). Clinical and laboratory information was obtained by chart review.
Tumor Xenografts
Mice were injected subcutaneously with 1 × 10⁷ HEL cells or 4 × 10⁶ HT-29/HCT116 cells. HT-29 tumors were allowed to grow until they reached 200–500 mm3 in size, and the mice were then injected with LR3-IGF-1 (Lee et al. 2003). The animals were sacrificed after 10 min, and tumors were rapidly excised and either frozen immediately inliquid N2 or fixed in 10% buffered formalin overnight. Time course experiments were done by allowing the rest of the tumor to remain at room temperature in PBS for either 15, 30, 45, and 120 min, or for 10, 20, 30, and 120 min before freezing or fixing in the same way. Nude mice bearing HCT116 xenografts (1-cm diameter) were treated with 75 mg/kg enzastaurin for 10 days twice daily by gavage. On day 10 of dosing, mice were euthanized, and tumors were harvested at 0.5, 2, and 4 hr after dosing. As a control, tumors from untreated mice were used. Xenografts were provided by the animal core facility at the Cleveland Clinic according to local accepted procedures and policies (Institutional Animal Care and Use Committee approved protocol ARC 08,175).
IHC
IHC was performed using an automated immuno-stainer (Discovery; Ventana Medical Systems). After heat-induced epitope retrieval using Cell Conditioning 1 (CC1, pH 8; Ventana Medical Systems), slides were incubated in reaction buffer containing 2% BSA (Sigma-Aldrich; St. Louis, MO) and 2% normal goat serum (Vector; Burlingame, CA) for 30 min. Subsequently, avidin and biotin block (Ventana Medical Systems) was applied for 20 min. Samples were incubated with the appropriate dilution of the primary antibodies: anti-pSTAT5 (Y694/99) (C11C5), 1:100; anti-pSTAT1 (T701) (58D6), 1:100; anti-pAKT (S473) (736E11), 1:50; anti-pGSK3β (S9), 1:50; anti-pERK (T202/Y204) (20G11), 1:100; and anti-pS6RP (S235/6), 1:400; for 120 min at room temperature. Biotinylated secondary anti-mouse/anti-rabbit antibody (1:2000, Vector) was incubated for 30 min. Slides were then incubated with streptavidin-conjugate QDs for an additional 30 min, and finally, counterstained with 4′,6-diamidino-2-phenylindole (DAPI) (Ventana Medical Systems) for 6 min. After rinsing, the slides were submerged for 2 min twice in 95% ethanol-H2O, three times in 100% ethanol, and three times in 100% xylene. Slides were mounted in Cytoseal XYL (Richard-Allan Scientific) and left overnight at room temperature in the dark. Increased attention was given to the quality of the dehydration process. This seems to be important for getting stable QD signal. IF samples were examined with a Leica microscope (Wetzlar, Germany). Sections labeled with QD 605 or QD 655 were viewed with a Chroma filter set (Chroma; Rockingham, VT) consisting of emission filters of 605/20 and 655/20 nm. Digital images were captured using identical acquisition parameters for the experiments. Multiple (five) 400X fields were randomly captured from technically acceptable regions of the slide, whereas peak pixel intensity for a specific experiment did not exceed the maximum intensity value. To normalize, we used the same positive and negative control samples for each experiment as reference to calibrate the quantitation. Digitized images have a resolution of 1392 × 1040 pixels with grayscale format and were saved in uncompressed TIFF format.
Quantitation of Fluorescence Signal
Image files were loaded into the Image-Pro Plus (Media Cybernetics; Silver Spring, MD) environment that was programmed for different routines (multistep macros). In the first step, the image of DAPI counterstain, together with the image of QD staining, was loaded into the composite preview. Using the “count/size” function and “Watershed” split, individual cells were segmented based on DAPI counterstain. Various cut-offs were used to get an area of whole cells and to exclude smaller and larger artifacts (artificial fluorescent fragments, folded or lifted sections) from the measurement. Subsequently, the composite preview was switched to the QD image, and the global data, including event number, area, mean of pixel intensities, and maximum and minimum pixel intensities, were transferred to a Microsoft Excel 2003 file. Based on our experiments with negative cell lines or based on stainings including blocking peptides, the threshold was set up and the combined score was calculated as: (intensity of positive cells — threshold) × proportion of positive cells. The rationale for using the combined score was the elimination of the effect of different intensities of cells below the threshold.
Western Blot Analysis
Cells were harvested at the indicated times and lysed as previously described (Bodo et al. 2006). Lysis buffer was added to the solid tumors, and samples were sonicated four times for 10 sec each time with 10 sec intervals on ice to rupture the cells. Protein concentration of the supernatant fraction was measured by the Bio-Rad assay (Bio-Rad; Hercules, CA). For each lane, 20 μg of protein was loaded into a 4–15% Ready Tris-HCl gel (Bio-Rad). After transfer, blots were blocked with 5% milk for 1 hr at room temperature, incubated with the recommended dilutions of the indicated antibodies overnight at 4C, and subsequently incubated with horseradish peroxidase—conjugated anti-rabbit- or anti-mouse secondary antibody (Cell Signaling) for 1 hr at room temperature. Enhanced chemiluminescence (Amersham; Arlington Heights, IL) was used for detection. For quantitation, films were scanned and the density of the bands was determined using Quantity One software (Bio-Rad).
Kinetworks PP Screen
Every cell line was maintained in culture according to the recommended conditions. For this experiment, untreated cells, i.e., cells growing for 24 hr in complete medium, were used. Subsequently, cells were washed and sonicated in RIPA lysis buffer (Upstate; Lake Placid, NY), containing 5 mM sodium fluoride, 1 mM sodium orthovanadate, and phosphatase inhibitors (Sigma-Aldrich). The homogenate was subjected to ultracentrifugation for 10 min at 13,200 rpm. Protein concentration of the supernatant fraction was measured by the Bio-Rad assay, and a phospho-site broad coverage pathway screen was performed by Kinexus (analysis KPSS-1.3; Kinexus Bioinformatics Corporation, Vancouver, BC). A heat map was constructed using PermutMatrix software (LIRMM, France). Each PP was expressed on a 0–1 linear scale and normalized to the cell line with the highest expression of corresponding PP.
Statistical Analysis
Statistical analysis was done using Pearson's correlation and Spearman rank order analysis for comparisons between groups (Statistica; Tulsa, OK). Statistical significance was established at p<0.05. Data are presented as the means ± standard error.
Results
QD-based Quantitative IF in Fixed Cells Correlates With Western Blot Quantitation
To validate QD staining, pSTAT5 detection in the EPO-dependent UT7/EPO cell line and pAKT detection in the colon cancer cell line HT-29 were chosen as models. These PPs were picked for the following attributes: examples of nuclear (pSTAT5) and cytoplasmic (pAKT) localization for active forms of the protein; and examples of phosphotyrosine (pSTAT5) and phosphoserine (pAKT) moieties. Aliquots for fresh cell lysates and formalin-fixed paraffin-embedded cell blocks were derived from the same cultured samples and simultaneously prepared for Western blot (WB) analysis and QD staining. To examine the relationship between WB results and the IF quantitation, we performed five replicate experiments for each analyte. Each replicate consisted of four different PP levels produced by varying culture conditions. These studies show that QD IF quantitation of paraffin-embedded samples correlates very well with WB data (Figure 1). The Pearson's correlation coefficients were 0.96 for the UT7/EPO cell model and 0.93 for the HT-29 cell model (p<0.001). The Spearman's rank order correlation coefficients were 0.91 for the UT7/EPO cell model and 0.90 for the HT-29 cell model (p<0.001). As further evidence that quantitation was robust and that sufficient numbers of fields were measured to give an accurate picture of PP quantitation, the variance of the running mean of each cell's IF quantitation for a representative experimental condition was not higher than 3.7% and 2.9% for the UT7/EPO and HT29 models, respectively.
Changes in PP Levels Prior to Fixation Highlight the Importance of Rapid Processing
Freshly harvested xenograft tumor sections were either snap-frozen in liquid nitrogen or held in PBS at room temperature for various times prior to freezing (Figure 2A). In the first model, WB analysis of HCT116 xenografts showed that 15 min after harvest, there was a significant increase of phosphorylation of CREB1 (S133), ERK1/2 (T202/Y204), 4EBP1 (T37/46), and S6RP (S235/236), followed by marked diminution of signal after 2 hr. PPs such as mTOR (S2448), RPS6KB1 (T389), Src (S527), IkBα (S32/36), or S6RP (S240/244) did not significantly change phosphorylation status until 45 min. AKT (S473) and GSK3β (S9) were considered the most-sensitive PPs. After 15 min of delay in freezing, a 50% decrease in PP levels was detected.
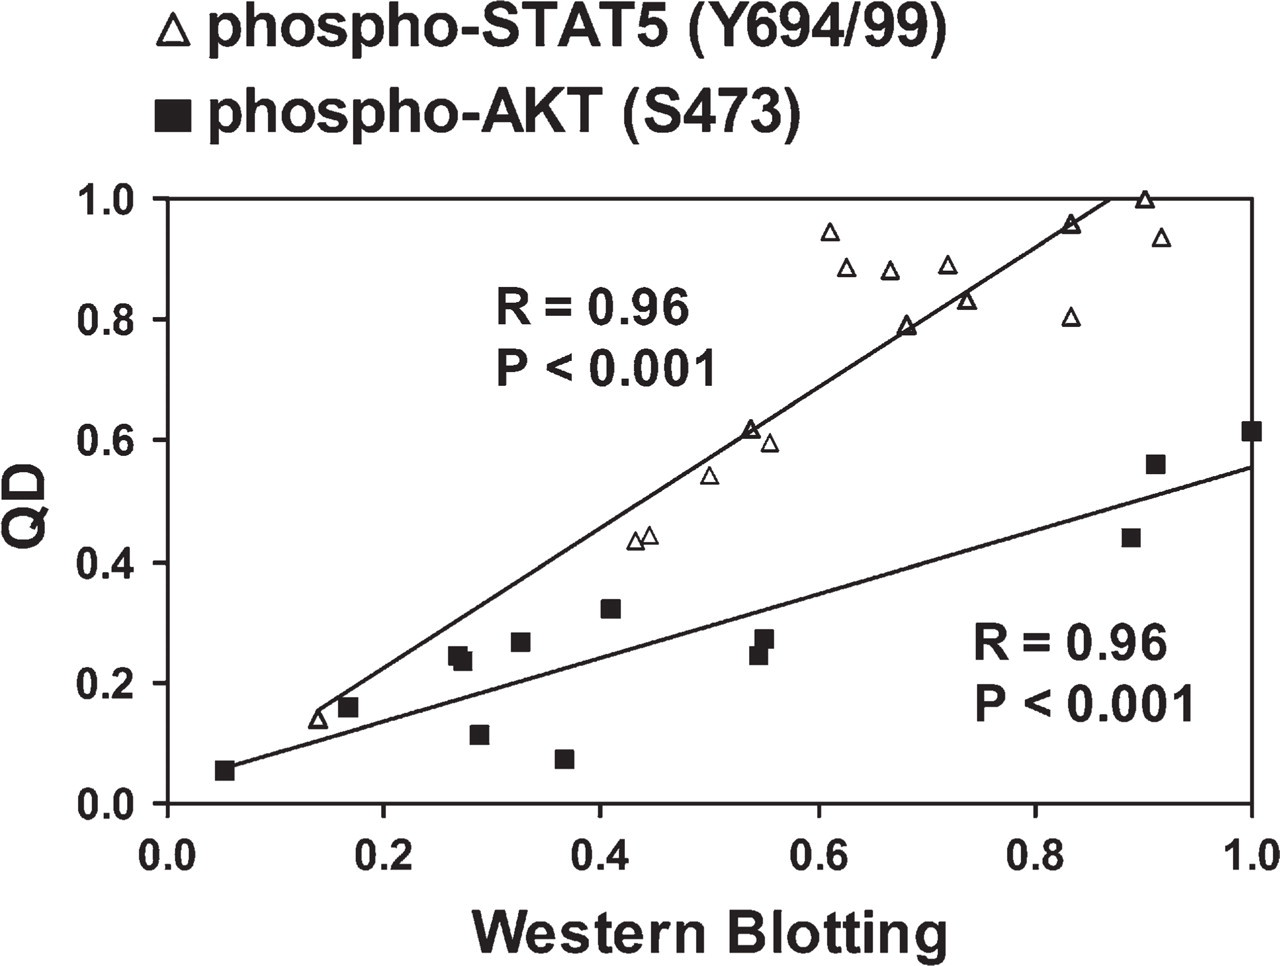
Validation of quantum dot (QD) immunofluorescence (IF) quantitation of phosphoproteins (PPs). UT7/erythropoietin (EPO) or HT-29 cells were treated with EPO or H2O2/IFG-1, respectively, to modulate PP levels. Paired samples were subjected to lysis or 10% formalin-fixed paraffin-embedded cell block preparation. Western blot (WB) quantitation of phospho-STAT5 (pSTAT5; Y694/99) in the UT7/EPO cell model or of pAKT (S473) in the HT-29 cell model was correlated with QD IF quantitation of corresponding cell blocks. Axes are expressed as relative units of optical density vs relative combined score. The Pearson's correlation coefficients in both models were at least 0.93 (p<0.001). Data presented are representative of at least five independent experiments.
Similarly, in a second model, WB analysis of HEL xenografts with high basal pSTAT5 (Y694) due to homozygous activating, JAK2 V617F mutations showed 40% reduction of phosphosignal after a 10-min delay prior to cryopreservation.
Formalin Is an Appropriate Fixative for PP Detection in Tumor Tissue
We next compared five fixatives commonly used in pathology laboratories (10% neutral buffered formalin, Zn formalin, UMFIX, Prefer, and B5) in a controlled HEL xenograft model (Figure 2B). One section from each tumor was immediately fixed in a different fixative overnight, and the quantitative QD IF data for pSTAT5 (Y694) was normalized to data of formalin-fixed samples. As can be seen in Figure 2B, replicate experiments demonstrated that alternate fixatives did not result in increased PP signal. Analogous results were obtained by using pAKT detection in HT-29 xenografts and pS6RP or pGSK3β detection in HCT116 xenografts (data not shown).
An experiment comparing overnight fixation, using formalin or Zn formalin (18 hr) vs fixation over a weekend (60 hr) showed no statistically significant changes in PP levels (data not shown). However, using an alcohol-based fixative (Prefer) resulted in a significant diminution of signal (53.0 ± 2.5%) when samples were fixed over the weekend, as compared with standard overnight-fixed samples (p<0.05, data not shown).
To validate QD IF quantitation in fixed tumor sections of known PP status, HT-29 xenograft—bearing mice were treated in vivo with LR3-IGF-1 to modulate pAKT levels (Figure 2C). This model showed a dose-dependent increase in pAKT levels due to LR3-IGF-1 stimulation, as shown by paired WB and QD IF, thus validating this technology in a tumor system manipulated to show varying levels of analyte. Compared with immediately processed serial tumor sections, a substantial decrease in PP signal was seen by WB and QD IF upon 2-hr fixation delay, confirming lability that had been observed in the previous experiment.
Construction of a Multilevel Control TMA
PP quantitation analysis in situ will require specialized control material because the lability of these analytes makes the standard practice of using “normal” or “tumor” tissue of limited value. Well-characterized cell lines represent a more-robust, controlled, and homogenous substrate.
We therefore characterized a panel of widely available cell lines via quantitative high-throughput Kinetworks PP screen 1.3 (Kinexus Bioinformatics Corporation). Levels of several PPs included in the Kinetworks screen, such as pCREB1, pERK1, pGSK3β, pAKT, pSTAT1, pSTAT5, and pSrc, were confirmed by WB in our laboratory (data not shown). A heat map based on expression of each marker across the different cell lines was constructed (Figure 3). Paired formalin-fixed cell blocks were made from the same cultures used to produce the lysates used for Kinexus quantitation. A TMA of these blocks was constructed to serve as calibrator material for PP QD IF assays. Quantitation of pSTAT1 (T701), pERK (T202/Y204), pGSK3β (S9), and pSTAT5 (Y694) was done using the method developed above. QD IF quantitation of these PPs showed good correlation with Kinetworks data. The Pearson correlation coefficients were 0.84 for pSTAT1, 0.91 for pERK, 0.96 for pGSK3β, and 0.81 for pSTAT5 detection (p<0.005). Thus, the TMA could be used to validate an IF assay by demonstrating good correlation with known relative levels. Indeed, we used the correlations seen here for pGSK3β and pSTAT5 as confirmation of the quantitative nature of the assay method for the studies below.
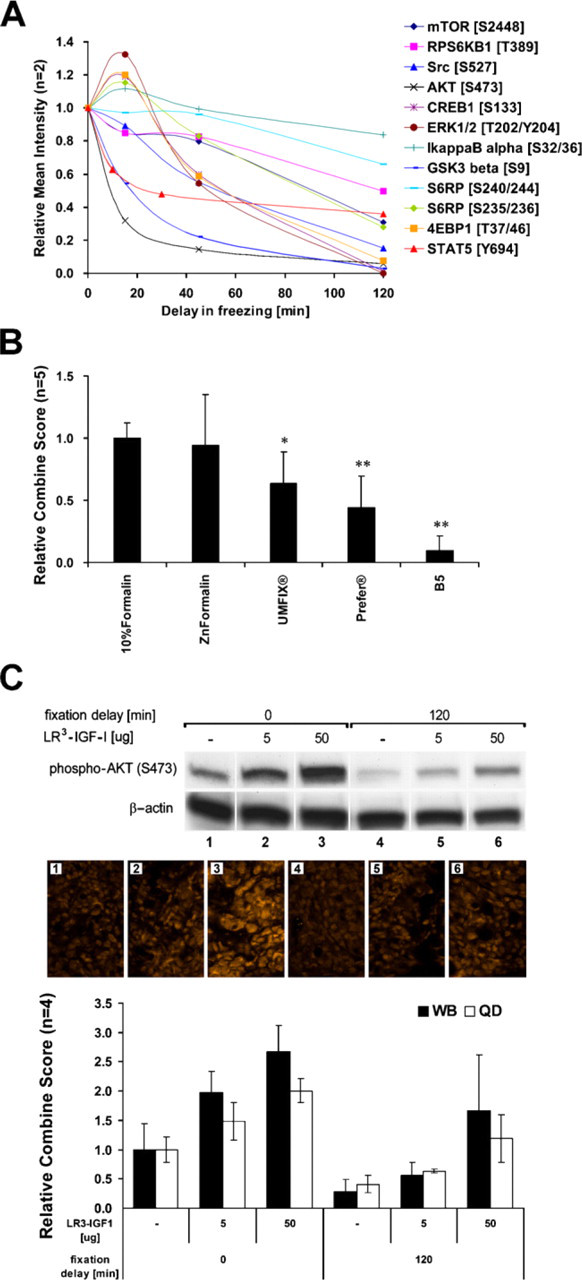
Optimization of fixation process. (
Potential Applications of PP Quantitation
In the era of targeted pathway-specific therapy, it may be useful to examine tumor cells for an intended therapeutic effect via PP detection and quantitation. As a first model for an application of QD IF quantitation, mice bearing human colon cancer HCT116 xenografts were treated with the PKCβ pathway inhibitor enzastaurin (Figure 4A). This agent is now in phase 3 clinical trials in hematologic malignancies (diffuse large B-cell lymphoma) and solid tumors (gliomas). After 10 days of enzastaurin treatment, mice were sacrificed, and tumors were harvested at 0.5, 2, and 4 hr after the last dose. As a control, tumors from untreated mice were used. Levels of pGSK3β (S9) were normalized to the cell TMA. The basal level of pGSK3β in untreated samples was comparable to the level in HH (CTCL) cells. Enzastaurin treatment induced a significant diminution of phosphosignal, with maximal inhibitory effect at 4 hr after the last dose. This lowest level was analogous to pGSK3β-negative UT7/EPO cells as seen in the TMA (Kinetworks screen).
STAT5 is phosphorylated (activated) by the FLT3 tyrosine kinase. Having suggested that pSTAT5 levels varied in AML blasts using brightfield IHC (Gilliland and Griffin 2002), we sought to confirm this in a more rigorous quantitative method in primary cells routinely processed in a diagnostic laboratory. Fourteen biopsies were analyzed and classified based on the presence or absence of the activating FLT3-ITD mutation, a poor prognostic factor in AML and the target of FLT3 inhibitors in ongoing clinical trials (Figure 4B). For this purpose, K562, HH, and MCF-7 cell lines were selected as cell lines with high, medium, and no expression of pSTAT5 (Y694/99), respectively. Using QD IF pSTAT5 quantitation, it was observed that samples with the FLT3-activating mutation (ITD-positive cases) had significantly (p<0.001) higher nuclear expression of pSTAT5 than did ITD-negative cases. The median pSTAT5 intensity of ITD-positive cases was similar to that seen in the TMA K562 cell line, whereas in ITD-negative cases, it was ∼50% lower.
Discussion
Evaluating predictive and prognostic biomarkers in individual tumors will be a challenge that must be met to realize the expectations of personalized medicine (True and Gao 2007). The study of PPs in tissues can provide an important insight into the pathobiology of tumors (Aboudola et al. 2007; Zuluaga et al. 2007). Given the growing list of potential therapeutic kinase inhibitors, quantitative in situ assays for PPs may be useful in disease subclassification, preclinical translational studies, qualification for therapy, prognosis, and disease monitoring (Irish et al. 2004; Birle and Hedley 2006).
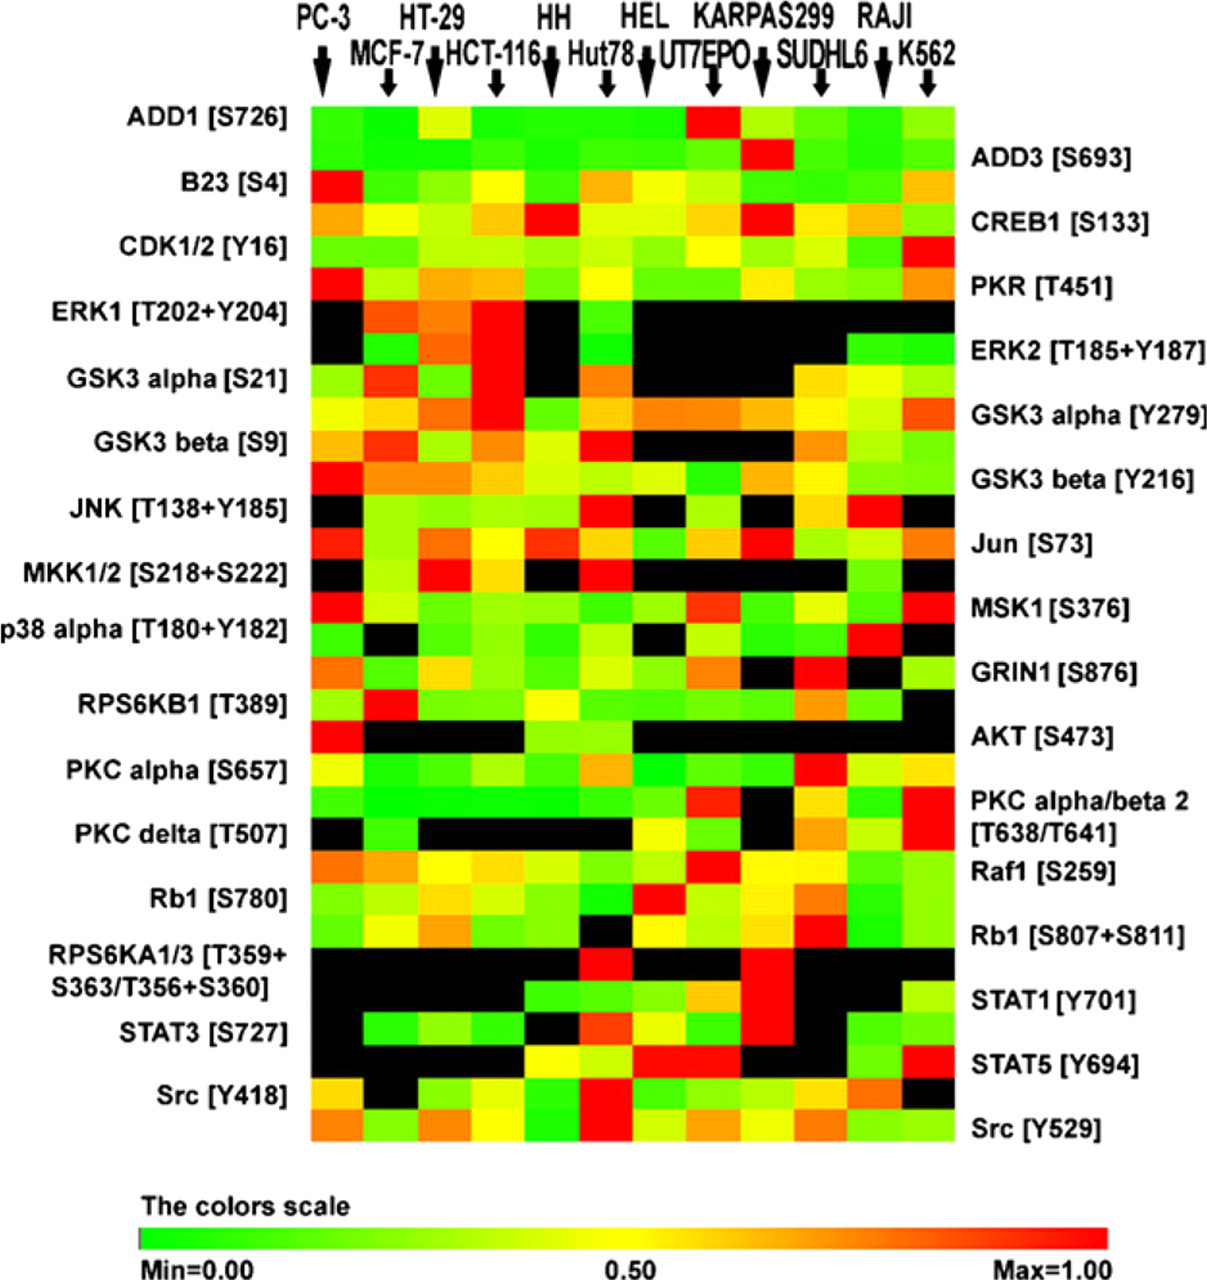
Evaluation of the expression of different PPs using the Kinetworks PP screen in the panel of various human cell lines. PC 3 (prostate adenocarcinoma), MCF-7 (mammary gland adenocarcinoma), HT-29 and HCT 116 (colorectal adenocarcinoma), HH and Hut 78 (cutaneous T-cell lymphoma), HEL (erythroleukemia) and UT7/EPO (acute myelogenous leukemia), Karpas 299 (anaplastic T-cell lymphoma), SUDHL6 (B-cell lymphoma) and Raji (Burkitt's lymphoma), and K562 (chronic myeloid leukemia). PPs are normalized to the cell line with the highest expression of corresponding PP, and relative intensities are shown on the heat map on a 0–1 linear scale. The color scale is based on the optical spectrum. Red indicates increased PP level, yellow represents 50% intensity of the highest expressed cell line, green indicates decreased PP level, and black represents no detectable expression.
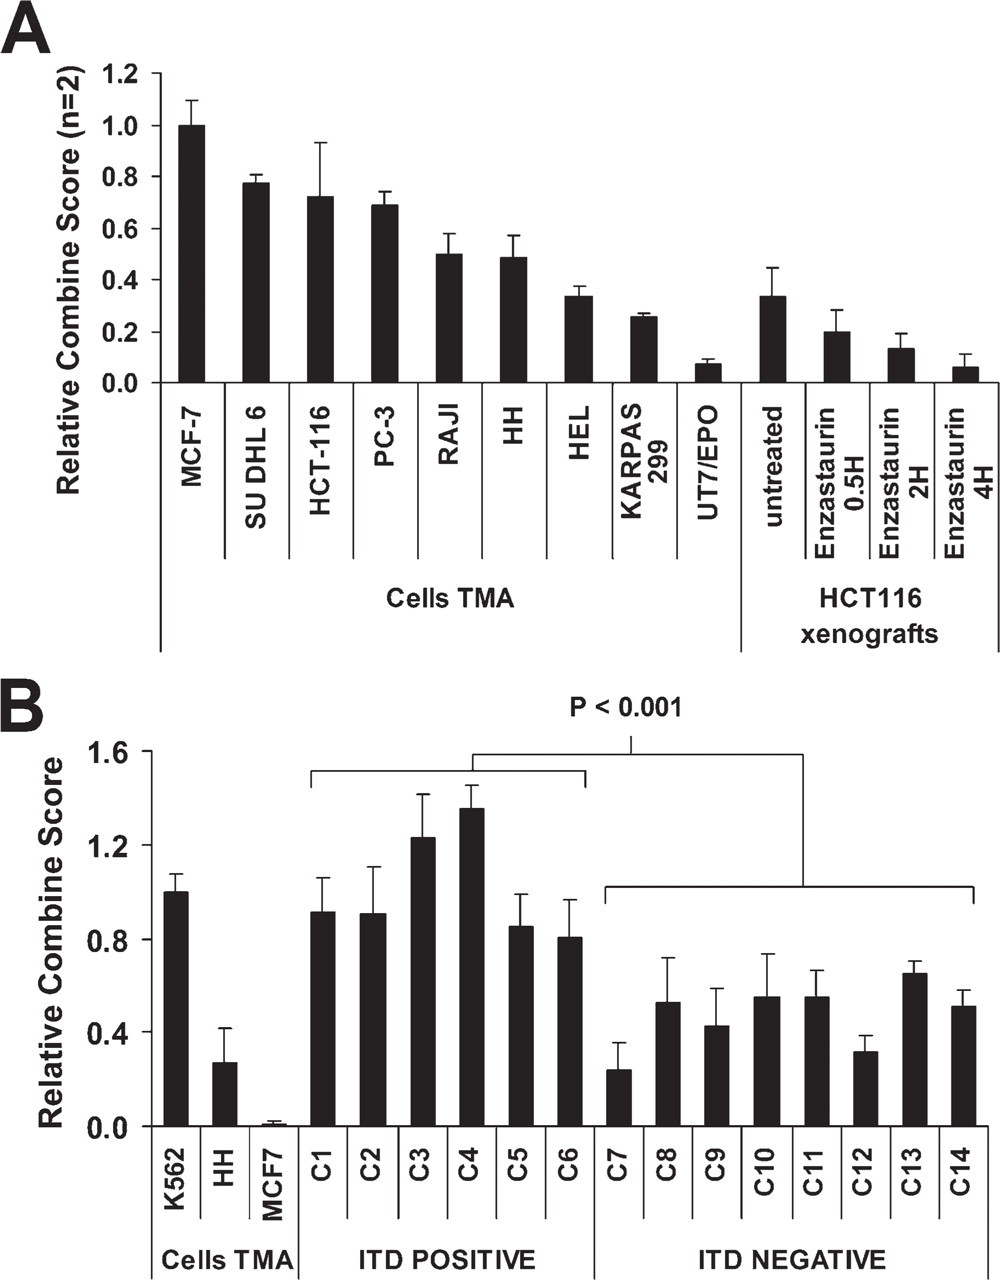
Application of standardized QD quantitation in therapy-monitoring and diagnostic models. (
QD IF assay was chosen as a platform because this might allow simple quantitative analysis in fixed tissues, cellular and subcellular localization, and because QDs provide the advantages of good sensitivity, a narrow emission spectrum allowing multiplexing, and photostability (True and Gao 2007). Manual scoring, the most widely used method of semiquantitative IHC in clinical settings, assigns a discontinuous numerical scoring system for quantitation of tumor antigens (for example 1+, 2+, 3+) (Ghazani et al. 2006). In contrast to this type of scoring, the QD-based analysis described here provides protein phosphorylation level measurements on a continuous scale, which is generally accepted as a superior method for categorizing data in biomarker analysis (Wainer 2006). We confirmed QDs as a quantitative label in tissues, showing good correlation between WB PP quantitation and QD IF using formalin-fixed paraffin-embedded cell block substrates. Thus, QD IF is a tool that could be used in subsequent quantitative PP studies.
To ensure that quantitative in situ PP analysis represents a “snapshot” of the in vivo situation, it is important to understand the variables in tissue handling that affect PP levels. The phosphorylation status of any given protein is determined by a complex interplay of kinases and phosphatases (Kurosawa 1994). We confirmed observations of previous authors that time to fixation (Baker et al. 2005; Espina et al. 2008) and choice of fixative (Burns et al. 2009) are critical variables. pAKT, pGSK3β, and pSTAT5 appear to be quite labile, and therefore rapid fixation (less than 10 min) is desirable. Samples such as small biopsies that are placed into fixative should be suitable for PP analysis, whereas surgical resection specimens are probably suboptimal, owing to routine delays prior to fixation that may extend to hours. Although we did not examine fixation penetration of tissues, our success in 3-mm xenograft tumor sections and in bone marrow biopsies suggests that this is not a significant factor, particularly relative to fixation delay. Our comparison of different fixatives showed that neutral buffered formalin, the most widely used fixative, and Zn formalin are acceptable fixatives, and no other tested fixative was superior. We also showed that commonly used fixation times in routine practice (overnight or weekend fixation) resulted in equivalent PP levels. Thus, routinely processed tissues can be confidently used for PP quantitation, provided there is no substantial delay in placing the specimen into formalin. The presence of both phosphatases and kinase inhibitors prior to fixation might be useful in prolonging the allowable time to fixation (Espina et al. 2008). However, such additives cannot reliably “restore” the native PP patterns that may have been present in vivo. Thus, the fidelity of initial PP levels may be lost if tissues are not placed in appropriate fixatives within several minutes of removal from patients, unless preliminary studies are performed to document preservation of targets in prevailing procurement conditions. These changes in PP level, due to non-uniform tissue handling, may account for negative studies or the relatively weak associations between PP levels and outcomes that have been reported (Cunningham et al. 2005; Hudelist et al. 2006; Mitsiades et al. 2007; Andre et al. 2008).
To assist in validating the quantitative nature of QD IF assays, we also produced a well-characterized multilevel control in a TMA format. We confirmed a good correlation between the data derived from quantitative Kinexus analysis and QD IF for analytes used in the models presented. This TMA will be a valuable tool for rapid verification of individual QD IF assays for PP quantitation. Indeed, this multilevel control could be used as an external calibrator for quantitative assays, with results expressed in fluorescence relative to a selected cell line. Use of a common characterized calibration reference standard would allow quantitation across assays and laboratories.
Proof of principle for QD IF quantitation of PPs was shown in a murine xenograft model and in primary human tissues. In a colon cancer xenograft treatment model using the PKCβ inhibitor enzastaurin (Graff et al. 2005), we showed the expected downregulation of pGSK3β, as detected by QD IF in treated tumors. Thus, QD IF analysis might be useful for monitoring of various levels of PPs during therapy to assess whether an intended biological effect is seen in cells of interest. The next model was based on observations that phosphorylation of STAT5 in AML blasts with the FLT3/ITD mutation is particularly strong compared with AML blasts with wild-type FLT3 (Bunting et al. 2007; Piloto et al. 2007). Patients with FLT3/ITD mutations have been demonstrated to have an unfavorable prognosis (Gilliland and Griffin 2002), and it may therefore be helpful to have a simple method for pSTAT5 quantitation, particularly while FLT3 inhibitors such as midostaurin are being developed (Stone et al. 2005). We confirm prior qualitative data (Bunting et al. 2007) and show a significantly (p<0.001) higher nuclear (active) expression of pSTAT5 in FLT3/ITD—positive cases compared with FLT3 wild-type cases.
In summary, we have characterized general conditions that allow accurate PP determination in fixed tissues using a QD IF assay. This type of assay has the advantage of morphologic evaluation that allows specific analysis of tumor cells and subcellular compartments (nuclear vs. cytoplasmic) that is not possible using WB or other tissue extraction—based methods. Fortunately, neutral buffered formalin fixations for durations typically used in clinical practice are satisfactory for quantitative assays. Importantly, decreases and increases in PP levels may occur with even minimal delays in exposing the specimen to fixative, resulting in unreliable data.
Footnotes
Acknowledgements
This work was supported by National Institutes of Health Grant R21CA123006 and by Eli Lilly and Company.
The authors acknowledge Roxanne Steinle for her technical expertise in immunostaining and Rebecca Haney for her help with xenograft tumors. We also acknowledge the assistance of Gary Pestano (Ventana Medical Systems) and his kind provision of QD reagents; and Dr. M. Nassiri (University of Miami) for assistance in tissue processing.