
Abstract
Quantum dots are semiconductor nanocrystals that have broad excitation spectra, narrow emission spectra, tunable emission peaks, long fluorescence lifetimes, negligible photobleaching, and ability to be conjugated to proteins, making them excellent probes for bioimaging applications. Here the author reviews the advantages and disadvantages of using quantum dots in bioimaging applications, such as single-particle tracking and fluorescence resonance energy transfer, to study receptor-mediated transport.
Keywords
Semiconductor nanocrystals, also known as quantum dots (QDs), are widely used in biological research as fluorescence imaging tools (Chan et al. 2002; Gao and Nie 2003; Jovin 2003; Yu et al. 2006). QDs show several significant advantages over most organic fluorophore dyes. Their tunable core sizes (1–10 nm) generate a wide range of fluorescence emission peaks with nearly Gaussian emission peaks, which do not show the “shoulders” displayed by the typical emission spectra of organic dyes. QDs show very broad absorption patterns, which can be efficiently excited far from their emission spectra to avoid background scattering. Moreover, QDs have far greater quantum yields as well as photostability than that of organic dyes at similar wavelengths (Resch-Genger et al. 2008). The combination of these fluorescence characteristics makes QDs a very powerful tool for fluorescence multiplexing, single-molecule tracking (SPT), fluorescence resonance energy transfer (FRET), and high-throughput screening (HTS).
When compared to standard organic fluorophore dyes, QDs show few disadvantages, such as their large size (10–30 nm) and their “blinking” behavior, in which dark periods of no emission interrupt longer periods of fluorescence (Lee SF and Osborne 2009; Resch-Genger et al. 2008). Recently, novel QDs generated with an alloyed composition gradient from the core to the surface have been shown not to undergo “blinking,” therefore displaying a continuously strong fluorescent emission (Wang X et al. 2009). Importantly for biological applications, these gradient-based QDs can be produced in smaller sizes (5–7 nm) (Wang X et al. 2009). These and other developments in QD research represent significant progress toward the generation of novel intracellular fluorescent probes for the bioimaging of living cells and tissues (Law et al. 2009; Smith AM and Nie 2009). Here, we focus on the use of QDs to study the dynamics and transport of membrane-bound receptors. The use of QDs in SPT has led to significant developments in the cell biology of receptor surface dynamics (Pinaud et al. 2010). In contrast, the use of QDs as FRET donors is still an emerging technology (Algar and Krull 2008). The continuous progress in the generation of brighter, smaller, and non-blinking QDs will allow the development of combined SPT and FRET techniques that have the potential to revolutionize the field of membrane receptor dynamics, activation, and transport.
Quantum Dots in Bioimaging
QDs contain a semiconductor core (e.g., Cd and Se) surrounded by a semiconductor shell (ZnS) to improve their optical properties. Core shell QDs can be manipulated in several different ways to generate water-stabilized QDs with improved aqueous solubility and colloidal stability. One way is ligand exchange, in which hydrophobic capping surface ligands are replaced by hydrophilic bifunctional ligands (Medintz et al. 2003; Susumu et al. 2009). Another approach includes covering the hydrophobic surface groups with block copolymers or phospholipid micelles (Dubertret et al. 2002; Groc et al. 2004; Lidke et al. 2005) (Fig. 1A). The main commercial sources of QDs use this strategy to encapsulate core shell QDs into a micelle of amphiphilic polymers. Water-stabilized QDs have a wide range of applications in fluorescence bioimaging because of their high photostability as well as enhanced brightness and functionality.
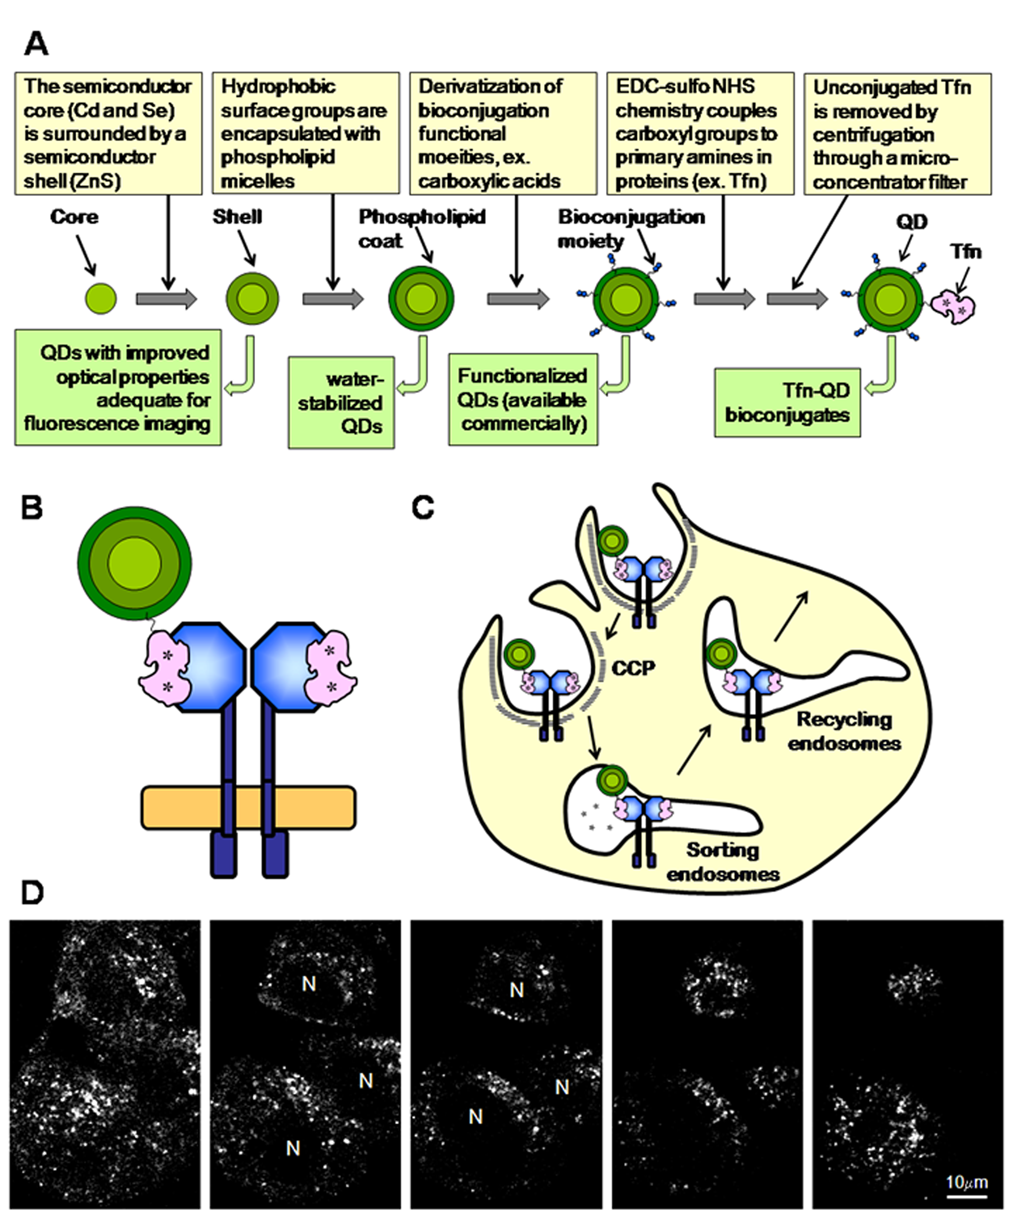
(A) Generation of transferrin (Tfn)–quantum dot (QD) bioconjugates. (B) Two molecules of Tfn (iron bound; asterisks) bind each transferrin receptor (TFR) dimer at the plasma membrane. In this particular example, one QD–Tfn and one unlabeled Tfn bind a TFR dimer. (C) TFR–Tfn complexes are internalized via clathrin-coated pits (CCP) and delivered to endosomes by clathrin-coated vesicles. Upon endosome acidification, iron is released from Tfn, and then the TFR–Tfn complexes are recycled back to the plasma membrane (PM) via recycling endosomes. (D) Endocytic uptake of Tfn–QD580 leads to a tubulo-vesicular staining throughout the cell. Confocal images were collected via a vertical z-scan with a 1-µm interval.
Before using QDs in cellular imaging, one should consider the following parameters: stability, specificity, size, and derivatization/conjugation. Both encapsulated and ligand exchange QDs show good dispersion in water, stability in a wide range of pHs, and reduced nonspecific binding to cellular components. Currently, both types of QDs have been derivatized to proteins, oligonucleotides, and other biomolecules using straightforward bioconjugation methods (Fig. 1A) and have been used routinely in cellular targeting, sensing, and imaging (Carion et al. 2007; Frasco and Chaniotakis 2010; Liu et al. 2008; Susumu et al. 2009). QD–protein conjugates can be used as probes toward specific biological mechanisms in immunoassays and live-cell imaging as well as in a variety of other fluorescence-based detection assays, including SPT and FRET. QD conjugates can be used as excellent fluorescent probes in a variety of microscopy instruments, such as wide-field and confocal microscopes, mostly depending on the availability of adequate emission filters. Spectral imaging, which uses linear unmixing algorithms to separate overlapping emission spectra that are separated by more than 10 nm, is an important methodological tool to develop QD-based multiplexing imaging protocols both in cultured cells and in tissues.
QD Cell-Based Applications: Receptor-Mediated Transport
QDs as Tracking Molecules in Membrane Receptor Surface Dynamics
Understanding how cellular components located at the plasma membrane are able to sense changes in the extracellular environment, transmit signals into the cell, and carry on the uptake of essential molecules is one of the most important problems in the field of cell biology. Most of these processes are mediated by the binding of extracellular ligands, such as growth factors (e.g., epidermal growth factor [EGF], cholesterol-containing lipoproteins, iron-loaded transferrin [Tfn]), to membrane-bound receptors at the plasma membrane (Fig. 1B). Subsequently, the receptor–ligand complexes are endocytosed and delivered to endosomal compartments for degradation or recycling back to the plasma membrane (Fig. 1C) (Maxfield and McGraw 2004; Sorkin and von Zastrow 2009). The development of new QD-based bioimaging technologies is essential to further our understanding of the regulation of receptor-mediated endocytic pathways in cells and tissues.
Because of their brightness and photostability, water-stabilized QDs have been used to track many receptor-mediated endocytic trafficking events in live cells using fluorescence microscopy (Resch-Genger et al. 2008). For example, QDs conjugated to EGF have been used to track the dimerization of the EGF receptor (EGFR) and its ability to elicit downstream signal transduction events (Danglot et al. 2010; Lidke et al. 2004). Importantly, QDs are very effective for the long-term labeling of endosomes without significant negative effects (Hanaki et al. 2003). QDs conjugated to nerve growth factor (NGF) have been used to visualize the real-time endocytic behavior of NGF receptors (NGFR) at a nanoscale resolution (Rajan et al. 2008). Biotinylated α-bungarotoxin was bound to streptavidin-conjugated QDs to characterize the assembly dynamics of acetylcholine receptor clusters in postsynaptic membrane (Geng et al. 2009). Moreover, peptides that serve as ligands for membrane-bound receptors have been conjugated to QDs and shown to be internalized into cells (Anas et al. 2009; Zhou and Ghosh 2006). QDs have been used to monitor ligand binding to G-protein-coupled receptors (GPCRs) (Young and Rozengurt 2006). As shown previously for dye–ligand conjugates, QD–ligand conjugates added to the extracellular media provide a clear distinction between membrane receptors located in the biosynthetic pathway and those at the plasma membrane that are available to bind QD–ligands and undergo surface motility, oligomerization, and/or endocytosis.
Advantages and Disadvantages of QDs as Tracking Molecules
There are several advantages in using QDs versus organic dyes to track membrane receptor dynamics. First, QD–ligand conjugates provide measurements of single or small quantities of ligand-bound receptors, allowing for development of SPT methods (Alcor et al. 2009; Chang YP et al. 2008; Groc et al. 2007; Serge et al. 2008). Second, QD-based SPT has been used to determine the diffusion characteristics of individual receptors as well as their subcellular localization over time (Bats et al. 2007; Groc et al. 2004; Groc et al. 2007). It is important to note that diffusion measurements obtained using QD tracking methods have been generally consistent with those generated using fluorescence recovery photobleaching (FRAP) approaches (Bats et al. 2007; Groc et al. 2007). Third, individual or small assemblies of QD–ligand receptor complexes can be tracked for long periods of time in live cells (Gralle et al. 2009; Groc et al. 2004). Specific algorithms have been developed to reconnect the QD track during their “dark” time, allowing for the acquisition of longer and more informative diffusion trajectories than those obtained with rapidly photobleaching fluorophores (Calamai et al. 2009; Chang YP et al. 2008; Groc et al. 2007).
Tracking surface receptors in tissues in whole animals is crucial to probe the role of membrane protein dynamics in important biological processes, such as cancer metastasis, because tumors in vivo contain blood vessels and three-dimensional morphology and communication systems that cannot be replicated in cultured cells. Recently, high-resolution imaging methods in the nanometer range have been developed to image the membrane transport and dynamics of tumor cell proteins during metastasis in living mice using antibody-conjugated QDs (Gonda et al. 2010). This technology can also be applied to detecting cancer cells in sentinel lymph nodes in whole animals using QDs conjugated to tumor-specific molecules (Hikage et al. 2010).
In the future, QDs will be used to further advance receptor imaging technology, bringing together the ability to follow individually multiple membrane receptors over long periods of time with three-dimensional resolution (Ram et al. 2008) and biosensor, multiplexing, and tissue imaging technology. For example, the detailed analysis of QD blinking dynamics may be used in a wide range of biosensing applications (Lee SF and Osborne 2009). Furthermore, the QD’s narrow emission spectra permits the efficient co-tracking of membrane receptors together with one or more regulatory proteins (Alcor et al. 2009). Recently, this technology has been used to demonstrate a role for calmodulin-dependent protein kinaseII activation in the regulation of the surface diffusion of AMPARs at synaptic sites (Opazo et al. 2010). Multiplexed tracking should provide information on the effect of protein–protein interactions in the surface distribution of receptors.
Cellular Transport of QD–Ligand Conjugates
Upon specific binding of QD–ligand conjugates to their receptors at the plasma membrane, QD-labeled ligand–receptor complexes are subsequently taken up by the cells via their respective receptor-mediated mechanism of internalization. For example, QDs coupled to Shiga toxin, ricin, and Tfn were all endocytosed specifically via binding to their receptors in a clathrin-mediated manner (Fig. 1C) (Tekle et al. 2008). Clathrin-mediated endocytosis has also been shown to be the most important pathway for the intracellular delivery of peptide-conjugated QDs (Anas et al. 2009). Researchers are currently taking advantage of the ability of QD–ligand conjugates to trigger their internalization upon binding to their respective receptors, to deliver a wide variety of nanoparticles to specific tissues of interest for diagnostic or treatment purposes (Bonoiu et al. 2009). An interesting targeting strategy is to control the entry into a wide variety of cells by the conjugation of an agonist or antagonist GPCR ligand to the surface of nanoparticles, which would lead to cellular uptake versus binding arrest at the cell surface, respectively (Hild et al. 2010).
The transferrin receptor (TFR) has been widely used in the study of clathrin-mediated endocytosis and recycling (Maxfield and McGraw 2004). Tfn internalization via TFR is responsible for the majority of iron uptake by cells (Fig. 1C) (Richardson et al. 2010). The QD labeling of Tfn does not affect its clathrin-mediated endocytosis via binding to TFR (Chithrani and Chan 2007; McGrath and Barroso 2008; Tekle et al. 2008) (Fig. 1D). However, the intracellular endocytic transport and recycling of Tfn–QD conjugates appears delayed (Chithrani and Chan 2007; Tekle et al. 2008). A similar behavior has been shown for the internalization of Shiga toxin (Tekle et al. 2008), suggesting that QD–ligand conjugates can be endocytosed correctly but may be subsequently retained in different endocytic structures than their normal intracellular destination. It is also important to test whether the internalization of QD conjugates affects the normal intracellular transport of unconjugated ligands. Although the recycling of Tfn–dye conjugates was not affected by the intracellular accumulation of Tfn–QDs (McGrath and Barroso 2008; Tekle et al. 2008), internalization of ricin–QD conjugates appears to disrupt the normal intracellular transport of unconjugated ricin (Tekle et al. 2008). In contrast to EGF–biotin–streptavidin–QD conjugates (Lidke et al. 2005; Liu et al. 2008), gold nanoparticles conjugated to anti-EGFR antibodies have been shown to affect the kinetics and mechanism of EGFR endocytosis and intracellular transport (Bhattacharyya et al. 2010). Therefore, nanoparticle bioconjugates may induce distinct changes in the normal intracellular trafficking pathways of receptor–ligand complexes. The mechanisms underlying such alterations maybe unique to the type of nanoparticle, conjugated ligand, and type of cell used for the internalization studies, indicating that the uptake mechanism of each novel nanoparticle–ligand conjugate, as well as the effect of its internalization in intracellular trafficking pathways and cell viability, should be carefully evaluated. This is particularly important because specific targeting using Tfn, for example, has been used to deliver nanoparticles containing drugs, imaging agents, or siRNAs into cancer cells, which show higher expression levels of TFR (Choi et al. 2010; Davis 2009; Davis et al. 2010; Hu-Lieskovan et al. 2005; Wang J et al. 2010), with potential of being used in diagnosis and treatment in clinical settings.
QD Size, Coating, and Valency
Here we evaluate how several parameters, such as size, coating, and valency, may affect the transport of QD–ligand conjugates via endocytic trafficking pathways. Several lines of evidence suggest that endocytic uptake can accommodate large cargos such as the QD–ligand conjugates (10–100 nm). First, viral particles of comparable size have been shown to take advantage of intracellular endocytic processes to get inside cells (Sieczkarski and Whittaker 2002; Smith AE and Helenius 2004), suggesting that carrying a large probe as a QD should not disrupt the regulation of the endocytic trafficking of ligand–receptor complexes. Second, QD ligands have been detected entering and exiting confined membrane environments, such as the synaptic cleft (Dahan et al. 2003; Mikasova et al. 2008), although a reduced access of QD–ligand conjugates to confined or restricted membrane environments has been detected (Chang YP et al. 2008; Groc et al. 2007). Third, 50-nm gold nanoparticle–Tfn conjugates are taken up at higher levels than smaller conjugates (Chithrani and Chan 2007), suggesting that for smaller nanoparticles to be taken up by clathrin-coated pits, they must be clustered together, whereas a single larger nanoparticle can enter the cell at a faster kinetics. Furthermore, rod-shaped nanoparticles showed a lower uptake in comparison to spherical-shaped nanoparticles, suggesting that shape as well as size plays a role in endocytosis (Chithrani and Chan 2007). Therefore, the overall size and shape of the QD–ligand molecules/complexes should be taken into consideration for cell uptake purposes; for example, antibody–QD and QD–streptavidin–biotin–ligand conjugates are significantly larger than peptide–QD or directly conjugated ligand–QD complexes.
A major problem of QDs as tracking molecules in live cells is their level of nonspecific adsorption, which may lead to ligand- and receptor-independent cell uptake. For example, a wide variety of QDs have shown a reduced but consistent level of nonspecific binding to different intracellular membrane compartments, leading to their non-receptor-mediated uptake in live-cell imaging (Warnement et al. 2008) as well as in animal imaging (Zhang H et al. 2009). QDs have been shown to bind nonspecifically via electrostatic interactions to various cellular proteins, leading to artifactual cellular stainings as well as to decreasing signal-to-noise ratios in the vitro assays (Pathak et al. 2006; Warnement et al. 2008). Moreover, nonspecific protein adsorption to the QD surface may prevent QD-conjugated ligands from interacting with their respective cellular receptors. It has also been suggested that hydrophobic ligands may self-assemble to the QD surface, reducing their ability to interact with their cellular targets (Warnement et al. 2008). Therefore, the role of QD surface charges in nonspecific binding to cells should be evaluated as a function of QD surface coating (Lee H et al. 2010; Liu et al. 2008; Park et al. 2010). For example, PEG derivatization has been shown in a variety of different cell types and tissues to dramatically decrease nonspecific uptake by preventing QD self-aggregation and nonspecific interactions between QD and cell surface components (Choi et al. 2010; Kelf et al. 2010). However, even PEG-containing nanoparticles show significant nonspecific adsorption to different tissues irrespective of the nanoparticle ligand content (Choi et al. 2010; Davis 2009; Davis et al. 2010). Extensive research is currently being performed to develop novel QD surface coatings that will result in QD particles with smaller sizes and lower nonspecific adsorption, while preserving their excellent optical properties and stability over time and in a wide range of pH and salinity. For example, novel surface coatings based on a heterobifunctional ligand (DHLA–SB) have been developed as a favorable alternative to PEG-coated nanoparticles, and streptavidin-functionalized DHLA–SB QDs have been used to track the endocytic recycling of cannabinoid receptor 1 (CB1R) in live cells (Muro et al. 2010). Other water-soluble compact CdSe/ZnS QDs have been prepared by ligand exchange reaction using thiolated nitrilotriacetate (NTA). The resulting NTA–QDs revealed higher stability and remarkable conjugation efficiency compared to the other QDs prepared with different ligands by using the ligand exchange method (Park et al. 2010).
Other QD properties, such as surface coating homogeneity and surface tension, must also be considered to understand the effect of QD conjugation on the dynamics of specific versus nonspecific interactions (Clarke et al. 2008; Swift and Cramb 2008). Therefore, testing different QD surface layers as well using various conjugation protocols is recommended when characterizing the specific interaction of QD–ligand conjugates with their cellular receptors (Clapp et al. 2006; Kelf et al. 2010).
Another parameter that may affect the behavior of QD ligands is their multivalency because cross-linking may disrupt the internalization, trafficking, motility, and signaling of membrane receptors (Alcor et al. 2009; Groc et al. 2007). For example, the larger size and potential cross-linking of QD–streptavidin–biotin–Tfn complexes may be at the basis of their accumulation in endocytic structures and not efficiently recycling to the plasma membrane (Tekle et al. 2008). Conjugation of antibodies to nanoparticles may induce receptor clustering, which could influence the endocytic ability of the antibody–nanoparticle conjugate (Bhattacharyya et al. 2010). Therefore, when tracking membrane receptors, QD–ligand conjugation should avoid multivalency and potential cross-linking of receptor proteins; thus, directly labeling QD molecules with Fab fragments or protein or peptide ligands should be the first conjugation methodology to be considered (Alcor et al. 2009; Groc et al. 2007).
The main strategy to generate monovalent QD–ligand conjugates uses sub-stoichiometric derivatization to achieve the conjugation of zero to two ligands per each QD molecule (Andrews et al. 2008; Howarth et al. 2008). To be successful, the conjugation reaction conditions should be carefully monitored, and a thorough evaluation of the QD valency should be performed (Andrews et al. 2008; Andrews et al. 2009; Clarke et al. 2008; Howarth et al. 2008). This approach creates a large amount of unconjugated QDs, which could lead to significant nonspecific background in cell surface binding experiments. To address this problem, purification methods to separate and isolate monovalent QDs have been developed (Howarth et al. 2008). Recently, a novel approach combining peptide surface coating, stable covalent conjugation, and gel electrophoresis purification has generated small monofunctionalized QDs that were used to track individual proteins in cells (Clarke et al. 2010). An important advance in the synthesis and purification of QDs will be the ability to generate QD–ligand conjugates with a bound known number of ligands, which will provide the ability to analyze the behavior of receptors bound to monovalent vs. multivalent receptor.
As it has been mentioned above, taking full advantage of the physical and optical characteristics of QDs in biomedical imaging applications means using potentially detrimental properties of QD molecules to your own benefit to achieve specific experimental goals. For example, ligand-targeted nanoparticles that induce multiple receptor binding and potential receptor cross-linking have been shown to undergo increased cell uptake, which may be required for effective and specific cell entry into cancer cells (Bhattacharyya et al. 2010; Choi et al. 2010; Liu et al. 2008; Wang J et al. 2010). Furthermore, high levels of ligand density may lead to increased cytotoxicity in selective cell types, which may be advantageous for effective cancer therapy (Wang J et al. 2010). Therefore, depending on the experimental goal, QD–ligand conjugates showing different sizes and shapes and/or single valency versus multivalency should be evaluated. For example, where the ability of large unconjugated QDs to bind to the cell surface has been used to dissect membrane vesicle fusion mechanism (Zhang Q et al. 2007), EGF–QD conjugates with different valencies have been used to modulate receptor-mediated activation of the signal transduction cascade (Lidke et al. 2005).
In summary, at the experimental level, several parameters should be addressed to demonstrate that QD ligands behave comparably to unconjugated ligands and therefore may act as a reliable probe of receptor–ligand complex dynamics. First, QD ligands should bind to their respective receptors in a ligand-dependent manner and activate receptor signaling pathways in a manner similar to that of unlabeled ligand in cells. Second, QD ligands should be endocytosed and delivered to their correct destination with similar kinetics to that of the unlabeled ligand. Third, diffusion and moving speeds of QD ligands should match the values reported using other ways to label those ligands (Cui et al. 2007). Fourth, QD-monovalent ligand should not induce substantial activation of its respective receptor signaling pathway using standard functional cell-based assays. In summary, QD–ligand conjugates are a versatile and flexible tool to study the diffusion, trafficking, and activation of membrane-bound receptor–ligand complexes. Furthermore, the ability to evaluate the specificity, function, and behavior of QD ligands in cells allows for the screening of their biological activity, before proceeding to animal imaging experiments (Yang, Mao, et al. 2009; Yang, Peng, et al. 2009; Zhang H et al. 2009).
QD Cell-Based Applications: QD as Donor Molecules in FRET Reactions
FRET
FRET is the non-radiative transfer of energy from a donor fluorophore to an acceptor fluorophore in close proximity (Wallrabe and Periasamy 2005). When a donor fluorophore is excited by an external energy source (e.g., a laser), energy will be transferred to an acceptor fluorophore located within nanometer range (2–8 nm) through dipole–dipole coupling. Energy transfer will occur if there is a significant spectral overlap between the donor emission and the acceptor absorption spectra, a favorable dipole–dipole orientation, and a large enough quantum yield (Lakowicz 1999; Li et al. 1999; Stryer 1978; Wu and Brand 1994). Upon energy transfer, the following events will occur: (a) Donor fluorescence is reduced (quenched), (b) acceptor fluorescence is increased (sensitized), (c) donor photobleaching rate is decreased, (d) donor excitation lifetime is decreased, and (e) thus, upon acceptor photobleaching, donor fluorescence is increased (unquenching). For a known donor–acceptor pair, energy transfer efficiency (E) provides a measure of spatial proximity because it decreases rapidly with increasing distance between the two fluorophores (Forster 1965; Lakowicz 1999; Stryer 1978).
QD as FRET Donors
The spectral characteristics of QDs, such as their increased photostability, narrow emission spectra, and broad excitation spectra, make them extremely good candidates for donor fluorophores in a FRET reaction. In contrast, because of their large extinction coefficients and long excited-state lifetimes, QDs do not perform adequately as acceptors in FRET reactions (Algar and Krull 2008; Medintz and Mattoussi 2009; Zhong 2009). Recently, QDs have been shown to act as strong FRET donors to organic dye acceptors in a variety of biological applications (Algar and Krull 2008; McGrath and Barroso 2008; Medintz and Mattoussi 2009; Zhong 2009). Steady-state and time-resolved fluorescence measurements have demonstrated that efficient non-radiative energy transfer between QD donors and organic dye or fluorescent protein (FP) acceptors occurs in a manner consistent with the Forster theory of dipole–dipole interactions (Algar and Krull 2008; Dennis and Bao 2008; Medintz et al. 2003; Medintz et al. 2004; Medintz and Mattoussi 2009).
The Förster distance (R0)—that is, the distance at which the energy transfer efficiency (E) is 50%—is an important FRET property that should be considered when selecting an adequate QD–dye or QD–FP donor–acceptor pair. The Förster distance can be estimated from the photophysical properties of the donor and acceptor fluorophores (Lakowicz 1999). The practical experimental range of FRET measurements is ~2 to 8 nm, depending on the microscopy system’s capabilities and on the R0 values of the selected FRET pairs. Thus, the choice of a FRET pair and its respective R0 can play a role in extending the distance range that will be assayed in a particular FRET-based assay. When choosing a FRET pair, one needs to keep in mind that a larger R0 will increase the likelihood of a FRET event. Increasing R0 may be achieved by using a donor with a higher quantum yield, an acceptor with a larger extinction coefficient, and a pair with a larger spectral overlap. Specifically, for a FRET pair using QD as the donor molecule, the quantum yield of the QD in the absence of the acceptor will be crucial for the calculation of a large R0 value. Recently, QDs with high quantum yields have been shown to act as strong FRET donors in vitro when selected together with an adequate acceptor molecule providing a strong spectral overlap (Dennis et al. 2010). Another important parameter to consider when selecting the QD to use in FRET reactions is the surface coating that surrounds the QD core. Recently, eight different coatings using three types of coating schemes were compared in terms of their ability to transfer energy to FPs assembled onto the QD particle (Dennis et al. 2010). Small ligand coatings, such as DHLA or NTA, or flexible lipid–PEG coatings with terminal carboxyl groups allow for shorter distances between the QD and FP FRET pair, resulting in strong energy transfer levels in the in vitro assays (Dennis and Bao 2008; Dennis et al. 2010; Liu et al. 2008). Variations in the diameter of the QD particle due to non-uniform coating may be responsible for the strong FRET levels shown by carboxyl functionalized lipid–PEG-coated QDs (Dennis and Bao 2008; McGrath and Barroso 2008).
QDs as Donors in FRET-Based Immunoassays and Biosensing
The majority of QD-mediated FRET reactions have been performed in vitro in diagnostic immunoassays or biosensor machineries (Algar and Krull 2008; Wagner et al. 2010; Zhong 2009). As mentioned above, multivalent QDs allow each QD molecule to be conjugated to multiple acceptor molecules. This can have a significant advantage in the assembly of biosensor machineries, where a central QD donor acts as a scaffold for the binding of multiple biosensor molecules that can be labeled directly or indirectly with acceptor dye fluorophores (Algar and Krull 2008; Medintz and Mattoussi 2009; Zhong 2009). The ability to multifunctionalize QDs can also be used to induce aggregation as shown for the amyloid aggregation of the protein α-synuclein using streptavidin QDs loaded with biotinylated α-synuclein in vitro and in cells (Roberti et al. 2009). Furthermore, low donor/acceptor ratios due to the attachment of multiple acceptors to multivalent QDs will result in improved FRET efficiencies and highly sensitive QD-mediated FRET reactions. Conversely, the development of monovalent QDs is important for the development of FRET-based approaches to follow interactions between membrane-bound receptors because they may be negatively affected by cross-linking/oligomerization (see below).
The development of QD–protein conjugates that can act as sensors, catalysts, and/or active reagents (i.e., “actuators”) is a major application of nanotechnology to biomedical research and clinical disease diagnostic and treatments. Because of the clear advantages of using QDs as donor molecules in FRET events, several biosensor machineries have been designed based on QD–protein FRET modalities (Frasco and Chaniotakis 2010; Zhong 2009) to detect the enzymatic activity of proteases (Boeneman et al. 2009; Medintz et al. 2006; Shi et al. 2006; Suzuki et al. 2008) and kinases (Yildiz et al. 2007), as well as to visualize protein amyloid aggregation (Roberti et al. 2009), pH changes (Snee et al. 2006; Suzuki et al. 2008), and biologically important molecules, such as cocaine (Zhang CY and Johnson 2009), dopamine (Lee KR and Kang 2009), maltose (Medintz et al. 2003), and glucose (Duong and Rhee 2007).
QDs have also been used as donor molecules in FRET-based in vitro immunoassays for disease diagnostic and antibody profiling. For example, a sandwich immunoassay was recently developed to measure the concentration of estrogen receptor β by the presence of FRET between QD-labeled monoclonal antibodies and organic acceptor-labeled polyclonal antibodies against estrogen receptor β (Wei et al. 2006). Single-bead FRET-based immunoassays have been developed to detect anti–topoisomerase I antibodies, a marker of systemic sclerosis autoimmune disease (Sukhanova and Nabiev 2008; Sukhanova et al. 2007). Recently, aptamers have been used in the detection of epithelial tumor marker mucin 1 using a FRET-based assay (Cheng AK et al. 2009). FRET is an adequate strategy for the development of assays for disease biomarkers because it can be performed in the presence of unbound as well as bound QD probes, avoiding time-consuming wash steps (Wagner et al. 2010). The development of high-throughput screening of FRET-based immunoassays should significantly increase the sensitivity, reliability, and reproducibility of clinical diagnostics.
QD as Donor Molecules in FRET-based Assays in Cells
Here, we address QD–protein FRET-based assays that have been performed in cultured cells. Although QD–protein conjugates have been used in numerous FRET reactions, the majority of these have been characterized in in vitro assays, and only a few have actually been tested in live or fixed cultured cells. It is important to notice that the use of QD–protein conjugates in FRET reactions in cultured cells raises several particular issues that may affect negatively energy transfer events. For example, high levels of nonspecific binding of QD–protein conjugates to different cellular compartments may decrease the signal-to-noise ratio of the FRET signal. QD-mediated nonspecific adsorption to various cellular components may reduce the ability of QD–protein conjugates to interact with their respective acceptor-labeled target molecules, leading to reduced signal-to-noise ratios of FRET signal and significantly lower sensitivity of QD-based biosensors and binding assays (Yildiz et al. 2007). Moreover, the microscopy instruments used to visualize the FRET reaction in cells may limit the selection of QD–dye pairs, although the use of spectral imaging may alleviate such concerns (see below). As mentioned above, the large size of QDs, including their QD core and surface chemistry, may result in strong geometrical exclusion, which may lead to reduced FRET detection sensitivity (Wallrabe, Elangovan, et al. 2003). Moreover, significant heterogeneity in the orientation of the protein conjugated to the QD may yield a mixed functional behavior, resulting in a non-optimal performance of the QD–protein conjugate as FRET donor (Medintz et al. 2003; Medintz et al. 2004). In FRET reactions, the QD blinking behavior can also pose significant problems because it reduces the ability of donors to transfer energy to transiently proximally located acceptor molecules. On the other hand, non-blinking QDs have been shown to have multiple emission peaks (Wang X et al. 2009), which would increase the complexity of FRET processing and analysis.
Significant energy transfer between QD and dye molecules has been visualized qualitatively in cultured cells using fluorescence microscopy. For example, occurrence of FRET between QD and Alexa Fluor dyes has been detected at the cell surface by the binding of the QD–dye–streptavidin conjugate to EGFR via specific binding to EGF–biotin (Liu et al. 2008). FRET signals were also detected between QD donors and biarsenical acceptors, such as FlAsh, to assay amyloid aggregation in live cells (Roberti et al. 2009). Recently, acceptor photobleaching was used to measure the efficiency of energy transfer between QD–fibronectin and acceptor RFP–integrin molecules to probe cell surface receptor–ligand interactions (Sun et al. 2009). Moreover, QD–FRET-based assays have been developed to measure the interaction between plasmid DNA and polymeric gene carriers (Chen HH et al. 2008). QDs have been used as successful siRNA carriers, and FRET has been used as an assay to measure the release of the siRNA into the cell (Lee H et al. 2010), showing the importance of QD–FRET assays in drug delivery and gene transfer experiments. Recently, the activation of EGFR in live cells was analyzed using QD-based SPT and FRET (Kawashima et al. 2010). This QD-based approach brings together two very important imaging technologies for the research of membrane receptor dynamics, receptor–receptor and receptor-ligand interactions. Although advanced SPT methodologies have been designed to assay receptor–receptor interaction (Chung et al. 2010), only FRET provides a direct proximity assay that is sensitive to nanometer range variations in the distance between donor- and acceptor-labeled receptors. In the future, QD–ligand conjugates will be used to investigate simultaneously the surface motility of receptors and receptor–receptor interactions in live cells.
FRET Microscopy Using QDs as Donors in Cells
The use of QDs as donors in FRET microscopy influences the methodology used to image the cells and collect FRET data. Both fluorescence lifetime microscopy (Periasamy and Clegg 2009; Wallrabe and Periasamy 2005) and intensity-based FRET microscopy (Elangovan et al. 2003; Periasamy et al. 2008; Wallrabe et al. 2007; Wallrabe et al. 2006; Wallrabe, Elangoven, et al. 2003) have been used to image and analyze FRET between QDs and acceptor fluorophores, such as organic dyes and FPs, in live or fixed cultured cells (Kawashima et al. 2010; McGrath and Barroso 2008).
One of the major shortcomings of using traditional organic fluorophores as donor and acceptor molecules in intensity-based FRET is that the spectral overlap between the donor emission and the acceptor excitation spectra can result in significant contamination of the FRET signal, including the donor emission that “bleeds” into the acceptor emission channel (i.e., donor spectral bleedthrough [DSBT]) and the acceptor emission that results from the direct excitation of the acceptor by the donor excitation wavelength (i.e., acceptor SBT [ASBT]). As mentioned previously, QDs provide great flexibility to obtain a significant spectral overlap between their emission and the dye acceptor absorption spectra. Therefore, QDs can be paired with a wide variety of acceptor fluorophores, such as organic dyes (McGrath and Barroso 2008) and fluorescent proteins (Dennis and Bao 2008; Dennis et al. 2010), while maintaining substantial spectral overlaps and significant FRET efficiencies. Using QD as donors in FRET reactions should lead to a significant reduction in the overall SBT signal, while preserving the strong spectral overlap necessary for FRET. Whereas the ASBT can be lowered by exciting the QDs at wavelengths that minimize the acceptor excitation, DSBT is reduced because QDs display narrow emission peaks that minimize the donor emission bleedthrough into the acceptor channel upon donor excitation. In summary, the careful selection of a QD–acceptor FRET pair should result in a significant reduction of SBT while preserving the strong spectral overlap necessary for FRET, leading to decreased signal-to-noise ratio of the FRET signal and reduced intensity-based FRET processing and analysis.
Fluorescence lifetime microscopy (FLIM) can measure FRET by determining the decrease in the lifetime of the donor fluorescence (Chang CW et al. 2007; Wallrabe and Periasamy 2005). Fluorescence lifetime refers to the average time a molecule stays in its excited state before emitting a photon and is an intrinsic property of a fluorophore (Periasamy and Clegg 2009). In FLIM–FRET microscopy, the fluorescence decay of the donor molecule is determined independently of the probe concentration, excitation light intensity, and light scattering. In summary, FLIM–FRET microscopy is an accurate method to measure distance between molecules in the nanometer range. Although QDs show long lifetimes that should allow for enhanced sensitivity and signal-to-noise ratio, their complex decay behavior may lead to a challenging analysis of time-resolved fluorescence measurements. Nevertheless, FLIM–FRET has been used to demonstrate energy transfer between EGF–QD and anti-EGFR–AF upon EGFR dimerization via a decrease in the QD fluorescence lifetime (Kawashima et al. 2010).
FRET Analysis of Receptor-Ligand Interactions Using Tfn–QD
The TFR–Tfn system has been used to develop a quantitative intensity-based FRET imaging assay in epithelial cells (Elangovan et al. 2003; Periasamy et al. 2008; Wallrabe et al. 2007; Wallrabe et al. 2006; Wallrabe, Elangovan, et al. 2003). The cellular uptake of TFR–Tfn complexes is an excellent FRET system due to the homodimeric nature of TFR, which allows the binding of two molecules of Tfn to the TFR homodimer at the plasma membrane (Fig. 2A,B) (Cheng Y et al. 2004; Richardson 2004). ZnS–CdSe core shell carboxy functionalized QD566 and QD580 (emission peak at 566 nm and 580 nm, respectively) were encapsulated in the hydrophobic core of a micelle composed of a mixture of n-poly(ethylene glycol) phosphatidylethanolamine (PEG-PE) and phosphatidylcholine (PC) (Dubertret et al. 2002) and bioconjugated to iron-loaded Tfn employing EDC sulfo-NHS chemistry (Fig. 1A). Several experimental approaches were used to demonstrate that Tfn–QD is specifically internalized into epithelia cells via TFR. First, Tfn–QD580 conjugates localize to punctate endocytic-like structures throughout the cell (Fig. 1D). Second, internalization of Tfn–QD566 is reduced in the presence of excess unlabeled Tfn, suggesting that the majority of Tfn–QD566 enters cells via TFR-mediated endocytosis. Third, a strong co-localization was detected between Tfn–QD580 and Tfn–AF594 in punctate endocytic-like structures, suggesting that both these Tfn conjugates are internalized and delivered to the endocytic pathway in a TFR-dependent manner (Barroso and Sztul 1994; Periasamy et al. 2008; Wallrabe et al. 2006). Despite several variables such as the size of the Tfn–QD conjugates, the number of Tfn molecules per QD particle, the iron-load level of Tfn–QD conjugates, and the slight nonspecific interaction between the QD surface layer and the plasma membrane, these results show that the Tfn–QD conjugates can track the internalization and trafficking of TFR–Tfn complexes (McGrath and Barroso 2008).
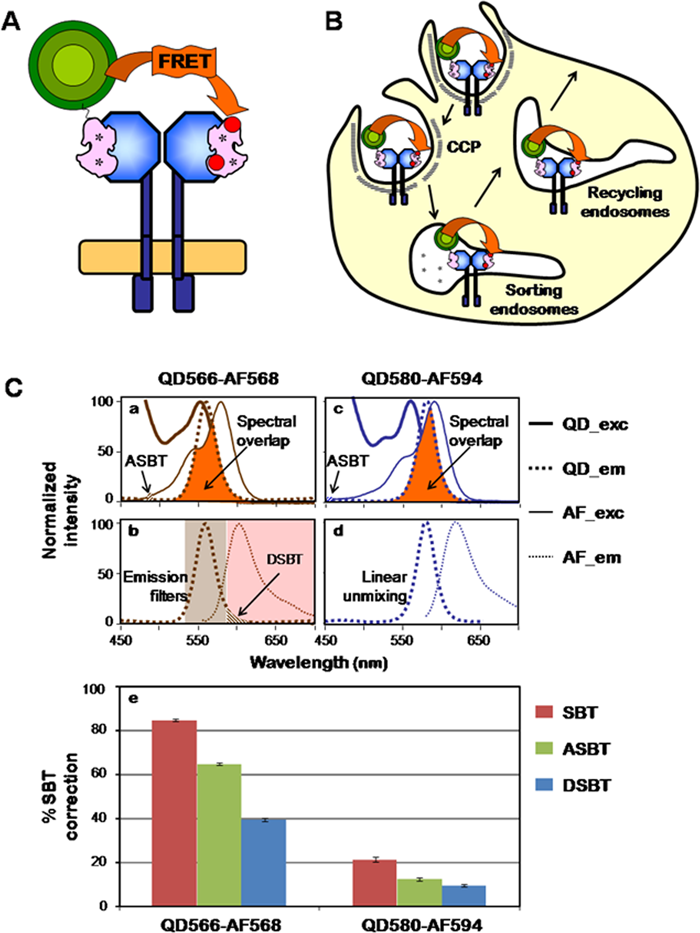
Fluorescence resonance energy transfer (FRET) reactions between transferrin (Tfn)–quantum dot (QD) (donor) and Tfn–Alexa Fluor (AF) (acceptor) conjugates. (A) Here, one donor QD–Tfn and one acceptor AF–Tfn bind a transferrin receptor (TFR) dimer. (B) Energy transfer (FRET) occurs between Tfn–QD (donor) and Tfn–AF (acceptor) upon their binding to the TFR homodimer at the plasma membrane and throughout the endocytic pathway. (C) The spectra of QD566 and QD580 are available from Evident Technologies (Troy, NY) and eBioscience (San Diego, CA), and those of AF568 and AF594 are available from Invitrogen (Carlsbad, CA). Panels a, b: Excitation and emission spectra of QD566–AF568. The orange area indicates the spectral overlap between the QD566 (donor) emission (left panel; Qem) and the AF568 (acceptor) excitation spectra (left panel; AFex). Excitation of AF568 at the 488-nm donor laser excitation determines acceptor spectral bleedthrough (ASBT) levels, whereas the emission of QD566 collected by the emission filter LP590 represents donor spectral bleedthrough (DSBT) levels (McGrath and Barroso 2008). Panels c, d: Excitation and emission spectra of QD580–AF594. The orange area indicates the spectral overlap between the QD580 (donor) emission (right panel; QDem) and the AF594 (acceptor) excitation spectra (right panel; AFex). The 458-nm and 514-nm argon laser lines were used for QD580 and AF594 excitation, respectively. Excitation of AF594 at the 458-nm donor laser excitation determines ASBT levels. QD580 and AF594 reference spectra were used to separate their respective emission spectra using linear unmixing and therefore remove DSBT from uncorrected FRET (uFRET) images (McGrath and Barroso 2008). Dex, donor excitation wavelength spectrum; Aex, acceptor excitation wavelength spectrum; Dem, donor emission wavelength spectrum; Aem, acceptor emission wavelength spectrum; dotted line, emission; solid line, excitation; brown line, QD566/AF568; blue line, QD580/AF594; brown shaded rectangle represents the donor emission filter (BP535-590) and red shaded rectangle the acceptor emission filter (LP590). Panel e: Role of ASBT (green) and DSBT (blue) in the overall SBT (red) correction after FRET processing. QD566–AF568 FRET pair shows higher ASBT due to the excitation of AF568 at the 488-nm donor laser excitation, whereas QD580–AF594 shows overall lower SBT correction because ASBT is lower due to the reduced level of excitation of AF594 at the 458-nm donor laser excitation, and DSBT is removed completely by linear unmixing separation of the QD580 and AF594 emission spectra. Nevertheless, comparable E% levels are obtained for both FRET pairs, thus validating this QD-based FRET system (McGrath and Barroso 2008).
The importance of ASBT and DSBT in the FRET processing and analysis of two different QD–AF FRET pairs was tested. Both QD–AF FRET pairs (i.e., QD566–AF568 or QD580–AF594) possess a R0 = 6 nm, suggesting that these QDs can act as strong donors for their respective AF acceptor partners (Fig. 2A). Three types of cells, including cells internalized with Tfn–QD (donor single labeled), Tfn–AF (acceptor single labeled), or with both Tfn–QD and Tfn–AF (double labeled), were subjected to intensity-based FRET confocal imaging using emission filter-based or linear unmixing approaches (Table 1) (McGrath and Barroso 2008; Periasamy et al. 2008; Wallrabe et al. 2007; Wallrabe et al. 2006; Chen Y et al. 2007). The single-labeled and double-labeled images were processed for FRET intensity-based analysis using a SBT correction algorithm (Elangovan et al. 2003; Wallrabe, Elangovan, et al. 2003; Wallrabe, Stanley, et al. 2003). To determine the level of SBT contamination due to ASBT or DSBT in both QD–AF FRET pairs, the SBT correction algorithm was used to process FRET images in the presence of only the acceptor or the donor single-label reference images, respectively. For the QD566–AF568 pair using emission filter-based confocal imaging, the ASBT levels are significantly higher than that of DSBT (~70% ASBT vs. 30% DSBT), suggesting that ASBT is the predominant correction in the overall SBT (Fig. 2C). In contrast, for the QD580–AF594 using linear unmixing-based spectral confocal imaging approaches, ASBT and DSBT levels are similar but strongly reduced (9% ASBT vs. 11% DSBT) (Fig. 2C).
Confocal Imaging Settings for QD–Dye FRET Pairs
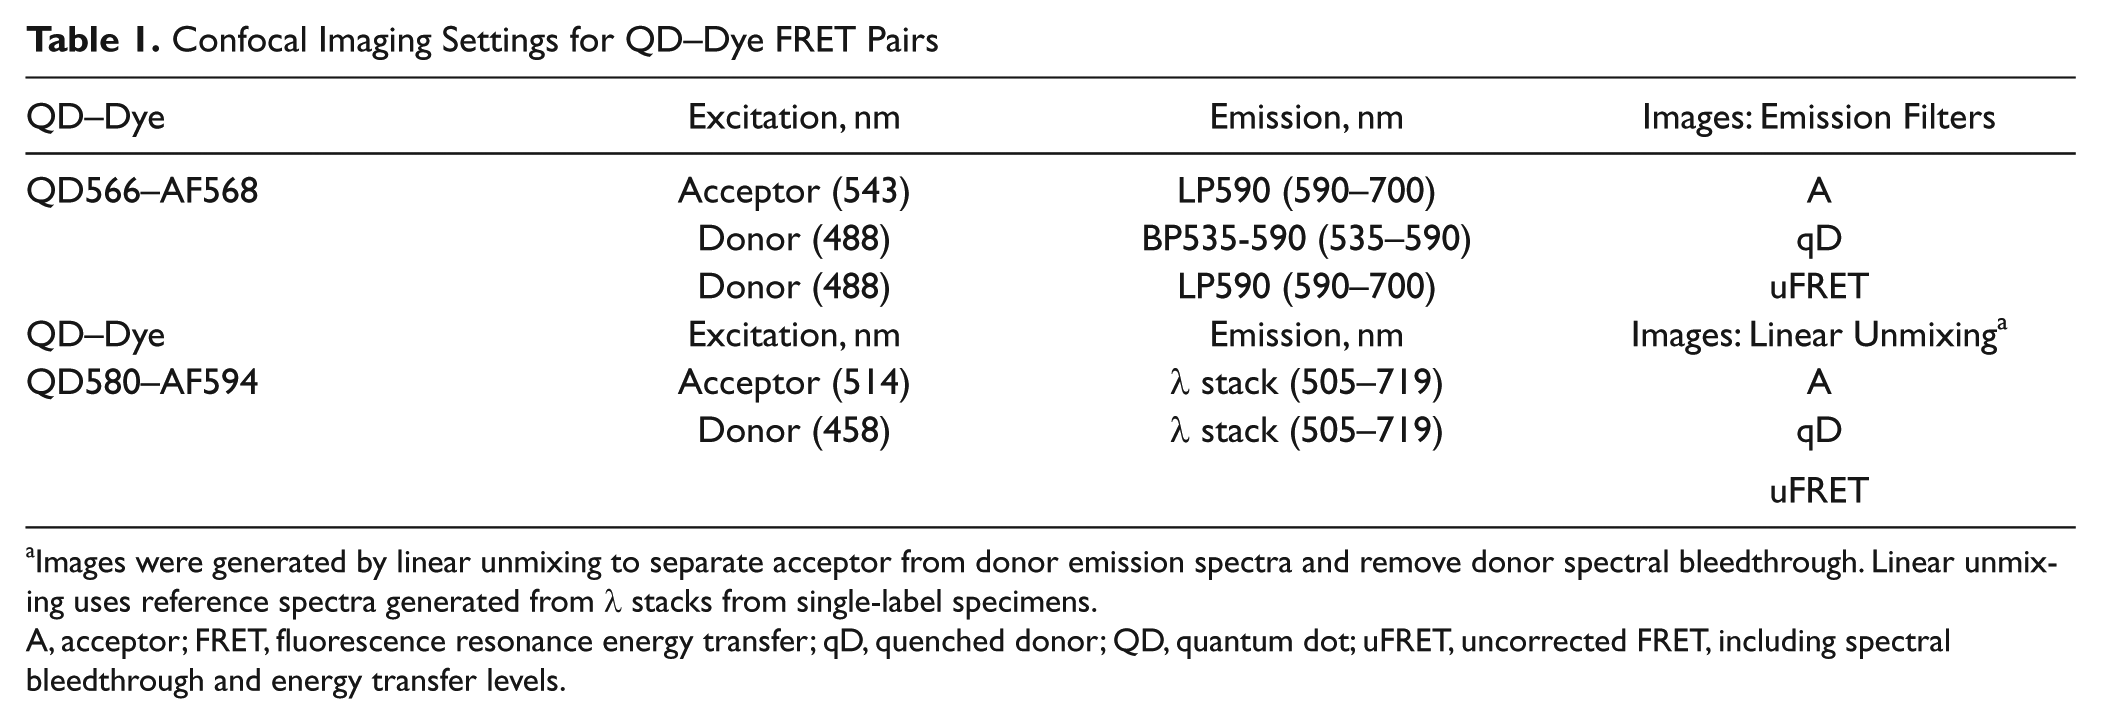
Images were generated by linear unmixing to separate acceptor from donor emission spectra and remove donor spectral bleedthrough. Linear unmixing uses reference spectra generated from λ stacks from single-label specimens.
A, acceptor; FRET, fluorescence resonance energy transfer; qD, quenched donor; QD, quantum dot; uFRET, uncorrected FRET, including spectral bleedthrough and energy transfer levels.
These Tfn–QD conjugates were used to evaluate the overall ability of Tfn–QD donor conjugates to transfer energy to Tfn–Alexa Fluor (Tfn–AF) acceptor molecules upon binding to TFR homodimer and subsequent internalization into the endocytic pathway (Fig. 2A,B) (McGrath and Barroso 2008). E% measurements indicate that the FRET behavior of TFR–Tfn complexes occurs similarly in a manner independent of the QD–AF FRET pair used. Considering the diameter of unconjugated QDs (~15 nm; Dennis et al. 2010), it is important to discuss their ability to transfer energy to AF acceptor molecules. An interesting hypothesis is that the lipid coat, enveloping the QD core, displays a non-uniform diameter shell, which may explain the ability of these QDs to act as FRET donors to AF acceptors at distances that may be close to the R0 values of these QD–AF FRET pairs. In summary, using selective QD–AF FRET pairs allows for a significant reduction of the ASBT because QDs, due to their broad excitation spectra, can be excited at wavelengths that minimize the acceptor excitation. Spectral imaging, which uses a linear unmixing algorithm to separate the donor and acceptor emission spectra, can then be used as the sole methodology necessary to remove the DSBT.
Conclusions and Future Perspectives
New QD developments will draw upon the unique biophysical properties of QDs to eliminate much of the image-processing analysis required in determining energy transfer levels; strengthen the quantitative data obtained in automated high-throughput FRET imaging; make live-cell FRET imaging faster, brighter, and more quantitative; and allow for application of FRET-based approaches to tissue biology ex vivo and in vivo. The characterization of QDs in the far-red region will have significant benefits for biological imaging because it minimizes autofluorescence, increases the depth of tissue penetration, and facilitates multiphoton absorption/excitation (Chong et al. 2007). Several QD–FRET innovative approaches are currently being developed. Whereas supramolecular complexes containing QD, fluorescent proteins, and organic dyes are being tested to enable long-range FRET detection up to 13 nm (Lu et al. 2008), FRET between QD–gold nanoparticles may allow the development of novel biological and chemical sensing assays (Zhang J et al. 2008). Finally, QDs’ spectral characteristics make them very useful for the development of multiplex FRET, in which several different dye acceptors are conjugated to the same QD donor, or multiple QD donors emitting at distinct wavelengths are used with the same dye acceptor (Clapp et al. 2005; Suzuki et al. 2008). Multiplex FRET approaches would track one or more QD–protein donor conjugates as they interact with one or more target acceptor molecule(s). In the future, these novel QD-based FRET approaches will significantly expand our ability to track the temporal dynamics of protein–protein interactions in live cells. Although the complex nature of the physical and optical characteristics of QDs may appear undesirable for their use in bioimaging, developments in QD synthesis and surface modification show potential to reduce the negative effects, whereas applications that exploit them are now coming to light. For example, further research on QDs may allow for the combination of SPT with FRET to track the membrane dynamics of receptors and their ligands and how receptor oligomerization or interaction with accessory regulatory proteins modulates the membrane dynamics and activation of receptors.
Footnotes
Acknowledgements
I thank Kate Anderson and Horst Wallrabe for their valuable comments.
The author(s) declared no potential conflicts of interest with respect to the authorship and/or publication of this article.
The author(s) received partial financial support from Evident Technologies, Inc. during the 2006-2008 period for the research described in this article.