
Abstract
Quantum dot nanocrystal probes (QDs) have been used for detection of somatostatin hormone in secretory granules of somatostatinoma tumor cells by immunofluorescence light microscopy, super-resolution light microscopy, and immunoelectron microscopy. Immunostaining for all modalities was done using sections taken from an epoxy resin-embedded tissue specimen and a similar labeling protocol. This approach allowed assessment of labeling at light microscopy level before examination at super-resolution and electron microscopy level and was a significant aid in interpretation. Etching of ultrathin sections with saturated sodium metaperiodate was a critical step presumably able to retrieve some tissue antigenicity masked by processing in epoxy resin. Immunofluorescence microscopy of QD-immunolabeled sections showed somatostatin hormone localization in cytoplasmic granules. Some variable staining of tumor gland-like structures appeared related to granule maturity and dispersal of granule contents within the tumor cell cytoplasm. Super-resolution light microscopy demonstrated localization of somatostatin within individual secretory granules to be heterogeneous, and this staining pattern was confirmed by immunoelectron microscopy.
Somatostatinoma is a relatively rare neuroendocrine tumor that occurs in the periampullary region of the duodenum or pancreas. It is thought to arise from pluripotent Delta-cells (D-cells) that are known to produce the hormone somatostatin (Varikatt et al. 2006).
The diagnosis of somatostatinoma generally is based on findings of positive immunohistochemical staining of tumor cells for somatostatin. This may be supported by routine transmission electron microscopy showing abundant electron-dense secretory granules in the tumor cell cytoplasm. Previously, we have used immunoelectron microscopy to demonstrate somatostatin localization in tumor cell secretory granules, although in this (Varikatt et al. 2006) and in other studies (Yong et al. 2010), we have found determination of whether or not the labeling was specific difficult due to low probe density over the target structures. Immunocytochemical approaches employing correlation light microscopy can assist but may be difficult when immunoelectron microscopy and immunohistochemical studies employ a different sample, different protocol, and different marker system. The benefits of correlation studies employing light and electron microscopy (Vicidomini et al. 2008) would therefore best be realized with a dual-purpose reagent that can be used on a single specimen under the same labeling protocol and is able to be viewed in both microscopy modalities.
Nanocrystal quantum dots (QDs) offer the possibility of an immunolabeling probe suitable for application in both fluorescence light microscopy and transmission electron microscopy. Discovered in the early 1980s, QDs are semiconductor nanoparticles 1 to 6 nm in size generally consisting of a cadmium and selenium (CdSe) core surrounded by a polymer layer (Gao et al. 2004). Their semiconductor properties are derived from the atomic structure of the core that forms a hexagonal crystalline array. Under excitation by light of an appropriate wavelength, they emit photons of a different wavelength suitable for examination by conventional fluorescence microscopy. Furthermore, the heavy elements forming the core can provide electron density for visualization by transmission electron microscopy. They are readily conjugated to antibody and other affinity ligands to create probes for use in immunocytochemistry.
In this article, we demonstrate the use of QDs in postembedding immunolabeling of somatostatin in human somatostatinoma tumor cells. We have chosen these cells as a model system in which to investigate QD immunolabeling as the labeling pattern has previously been well characterized using immunohistochemistry and immunoelectron microscopy of colloidal gold probes (Varikatt et al. 2006). In addition, the hormone-containing secretory granules of these cells offers a convenient cytoplasmic compartment in which to assess the sensitivity and specificity of immunolabeling. QD immunolabeling was able to be visualized by conventional widefield epifluorescence microscopy, super-resolution light microscopy, and transmission electron microscopy to reveal somatostatin localization within secretory granules.
Materials and Methods
The tissue used in the present study was obtained from a tumor mass located in the ampulla of Vater that was excised from a 37-year-old female patient who underwent a Whipple’s procedure in 2003 (Varikatt et al. 2006). The diagnosis of somatostatinoma was unsuspected prior to surgery and was made initially by examination of an intraoperative frozen section from the excised tissue with confirmation by positive immunohistochemical staining of tumor cells for somatostatin. The diagnosis was supported by routine transmission electron microscopy showing abundant electron-dense granules in the tumor cell cytoplasm and subsequent immunoelectron microscopy demonstrating positive labeling of cytoplasmic secretory granules for somatostatin.
Tissue Processing
Tissue sampled from the case described above was processed for both routine immunohistochemistry and transmission electron microscopy. The histological tissue was fixed in neutral buffered formalin for 24 hr. Processing included rinsing in water, then dehydration in graded alcohols, clearing with xylene, and embedding in paraffin wax. The tissue for electron microscopy was fixed in 2.5% glutaraldehyde in 0.1 M sodium cacodylate buffer (pH 7.4) for 24 hr. then rinsed in 0.1 M sodium cacodylate buffer and processed routinely. This included block staining in 2% osmium tetroxide for 4 hr followed by a rinse in sodium acetate, then 1 hr in 2% uranyl acetate, and then dehydration in graded alcohols and acetone. The tissue was embedded in Spurr low-viscosity resin with ERL 4221 used as the epoxy monomer and cured at 70C for 16 hr.
Immunohistochemistry
Conventional immunohistochemistry was performed using a commercially available antibody for somatostatin on an immunoautostainer platform (Dako; Glostrup, Denmark). Tissue sections (3 µm) from formalin-fixed paraffin tissue blocks were deparaffinized in xylol and hydrated through graded alcohol. Heat-induced epitope retrieval was carried out using a water bath. Endogenous peroxidase was quenched in all sections with 3% hydrogen peroxide for 5 min. The slides were then sequentially incubated with primary polyclonal antibody to somatostatin (Dako A0566) for 10 min and then Post Primary Block and NovoLink Polymer (Leica Mikrosysteme Vertrieb GmbH; Wetzlar, Germany), each incubated for 10 min. All incubations were performed at room temperature. Diaminobenzedine Plus (Dako) was used as the color chromogen and was incubated for 5 min. Slides were counterstained with Harris hematoxylin. Positive and negative controls were run simultaneously with negative controls treated identically except for replacement of the primary antibody with negative control reagent (Dako). Positive controls were obtained from normal pancreatic tissue where islet cells in pancreatic ductules contained somatostatin and were positively stained. Light microscopy images were acquired using an Axio Scope A1 microscope (Carl Zeiss MicroImaging GmbH; Jena, Germany). High-resolution 24-bit uncompressed 1600 × 1200-pixel 8-bit RGB color digital images were acquired in uncompressed .tiff format using a CCD-based camera (SPOT RT Slider; Diagnostic Instruments Incorporated, Stirling Heights, MI). Postprocessing included linear adjustment only to brightness and contrast and some unsharp mask sharpening using Photoshop CS2 (Adobe Systems Incorporated; San Jose, CA).
Immunofluorescence Microscopy
Widefield epifluorescence microscopy of QD immunostaining for somatostatin was carried out using semithin 500-nm epoxy sections. These sections were cut from a Spurr resin-embedded tissue block that had been routinely prepared for transmission electron microscopy, including block staining with 2% osmium tetroxide in 0.1 M sodium cacodylate buffer (pH 7.4) and 2% uranyl acetate. The sections were dried onto positively charged adhesion Superfrost Plus glass slides (Gerhard Menzel GmbH; Braunschweig, Germany). These were then further dried in a 35C oven for 15 min. Antigen retrieval was carried out by deplasticizing, or etching, the section surface. This was done by placing a droplet of saturated aqueous sodium metaperiodate on the sections in a humid chamber and incubating for 40 min at room temperature. After incubation, the sections were washed with distilled water, and biotin-streptavidin blocking reagents (Endogenous Biotin-Blocking kit from Invitrogen; Carlsbad, CA) were applied for 20 min each. A further protein block consisting of 1% normal goat serum and 1% acetylated bovine serum albumin (Aurion; Wageningen, The Netherlands) in phosphate-buffered saline (PBS) was applied for 30 min. This buffer has a negative charge that allows it to bind polycationic sites in the specimen and therefore block charge-based interactions with metallic immunolabeling reagents. Antibody diluent (Dako) was then added to condition the sections before a polyclonal anti-somatostatin antibody (Dako A0566) was applied. All incubations in the primary antibody were done at room temperature for 1 hr in a humid chamber. This was followed by application of a biotinylated goat anti-rabbit secondary antibody and then streptavidin-conjugated QD probes (Invitrogen). Negative controls with primary antibody omitted were run with each staining run. Optimal primary antibody concentrations were determined through a series of dilutions with selection criteria, including the intensity of positive staining and absence of nonspecific background staining, and 1:20 was found optimal. Positive controls were validated by immunohistochemistry. In addition, F(ab′) 2 goat anti-rabbit IgG (H+L)–conjugated QD probes were also trialed under identical incubation conditions for comparison to streptavidin-conjugated QDs. These were used as secondary reagents for comparison of labeling density with streptavidin-conjugated QDs. QD probes with emission wavelengths of 525 nm, 565 nm, and 655 nm were used, and these were excited at 385 nm with a LED light source (Carl Zeiss MicroImaging GmbH). Sections were viewed using an Axio Scope A1 fluorescence microscope (Carl Zeiss MicroImaging GmbH) fitted with a Chroma filter set (E460SPUVv2, D525/40m, 475dcxru) for QD 525 nm (Chroma Technology Corp.; Bellows Falls, VT), a Carl Zeiss filter set 09 (EX BP 450–490, BS FT 510, EM LP 515) for QD 565 nm, and a Chroma filter set (E460SPUVv2, D655/40m, 475dcxru) for QD 655 nm. Sections were dehydrated through an ethanol series and toluene before being mounted in Q-Mount medium (Invitrogen) under 0.170-mm-thick high-performance cover glasses (Carl Zeiss MicroImaging GmbH). We also tried imaging QD-labeled sections in conventional aqueous slide mounting medium (Thermo Scientific; South Logan, UT) and PBS. Acceptable immunofluorescence was detected and photographic imaging was possible provided images were captured immediately after staining, as was suggested in a previous study (Timp et al. 2006). Quenching of QD emission did occur with these preparations after several days’ storage under refrigeration, whereas sections mounted with Q-mount retained strong fluorescence up to 2 months after staining. Objectives used were N-Achroplan 20×/0.45, N-Achroplan 40×/0.65, EC Plan-Neofluar 40×/0.75, and N-Achroplan 63×/0.85 (Carl Zeiss MicroImaging GmbH).
Super-resolution Light Microscopy
Super-resolution light microscopy refers to a range of recently developed light microscopy technologies that allow viewing of lateral resolution exceeding the normal (approximately 200 nm) limit imposed by the diffraction properties of light as described in Abbe’s equation (Hell 2007). Super-resolution fluorescence microscopy in the present study was performed using a Nikon Ni Eclipse inverted microscope fitted with an N-SIM (Structured Illumination Microscopy) illuminator (Nikon Corporation; Tokyo, Japan). This system gave a lateral resolution of approximately 100 nm by analysis of specimen data obtained from moiré patterns collected when three-dimensional (3D) images of the sample were acquired through a fine phase grating according to the principles of Gustafsson et al. (2000). The microscope was fitted with a 100× CFI Apo TIRF objective (NA 1.49) that was used with immersion oil. Fluorescence excitation was produced using a 488-nm laser, and images were acquired with an electron multiplying charge-coupled device (EMCCD) digital camera (Andor Technology plc; Belfast, Ireland). Final images were rendered from 15 separate images in 3D-SIM mode using NIS-Elements software (Nikon Corporation). Epoxy sections (500 nm) for examination by super-resolution fluorescence light microscopy were cut from the tissue block prepared for routine transmission electron microscopy. They were immunostained for somatostatin identically as the sections used for widefield immunofluorescence observation using 565-nm QDs and were mounted in Q-Mount mounting medium (Invitrogen) under 0.170-mm-thick high-performance cover glasses (Carl Zeiss MicroImaging GmbH).
Transmission Electron Microscopy
For transmission electron microscopy (TEM), ultrathin sections, 90 nm thick, were cut from the same epoxy-embedded tissue block that had been used to obtain sections for widefield epifluorescence microscopy and super-resolution light microscopy. This block had been processed routinely into Spurr resin as described above. The sections were stained with alcoholic uranyl acetate and Reynolds lead citrate and examined using a Morgagni 268D transmission electron microscope (FEI Company; Einhoven, the Netherlands) at 80 kV. Images were acquired using an integrated MegaView III digital camera (Olympus Soft Imaging Solutions GmbH; Munster, Germany).
Immunoelectron Microscopy
For immunoelectron microscopy, ultrathin sections, 120 nm thick, were cut from the same epoxy-embedded tissue block used to obtain sections for widefield epifluorescence light microscopy, super-resolution light microscopy, and routine TEM. The sections were thicker than the 70–90 nm generally used for routine TEM examination in order to strengthen the sections to withstand being deplasticized on uncoated grids and enhance their inherent contrast without the need to apply additional section staining. The sections were then placed on 300 mesh nickel grids, and the section surface was etched using saturated sodium metaperiodate as with sections for the light immunofluorescence studies. Incubation procedures were identical to those used for the light immunofluorescence studies apart from the ultrathin sections being floated upside-down in direct contact with droplets of reagent; whereas, for light microscopy, droplets of reagent were placed on top of sections adhering to glass slides. 565-nm QDs were used for immunoelectron microscopy as their size of 3–5 nm was comparable to colloidal gold probes commonly used for immunogold labeling.
Correlation Microscopy
Direct correlation between images from widefield epifluorescence microscopy and electron microscopy was achieved from a single section. A 120-nm-thick ultrathin section was mounted on an electron microscopy grid and immunostained for somatostatin using streptavidin-conjugated 525-nm QDs as for immunoelectron microscopy. The section was then viewed by widefield epifluorescence light microscopy and subsequently by TEM. For light microscopy, the grid was observed on a glass slide in PBS under a glass cover slip. After acquiring fluorescence images, this grid was then washed in distilled water, dried, and then viewed by TEM. Corresponding areas of tumor were located in images from both microscopy modalities.
Patient consent was obtained for examination of the surgical tissue specimen reported in this study. The images and analysis described herein were obtained from routine specimens obtained as part of the normal diagnostic process in anatomical pathology. All procedures followed were in accordance with the Declaration of Helsinki 1975.
Results
Somatostatinoma tumor cells, viewed in wax histological sections at low magnification by brightfield light microscopy, formed cords and gland-like acinar structures interspersed between collagenous stroma (not shown). Individual cells showed features of epithelial differentiation with rounded nuclei, eosinophilic cytoplasm, and apical microvilli lining luminal spaces occasionally filled with calcium aggregations or psammoma bodies.
Routine paraffin sections immunostained for somatostatin visualized by diaminobenzidine (DAB) showed somatostatinoma cells with intensely positive cytoplasmic staining. Occasional masses of cytoplasmic granules were visible in the more densely stained regions (Fig. 1).
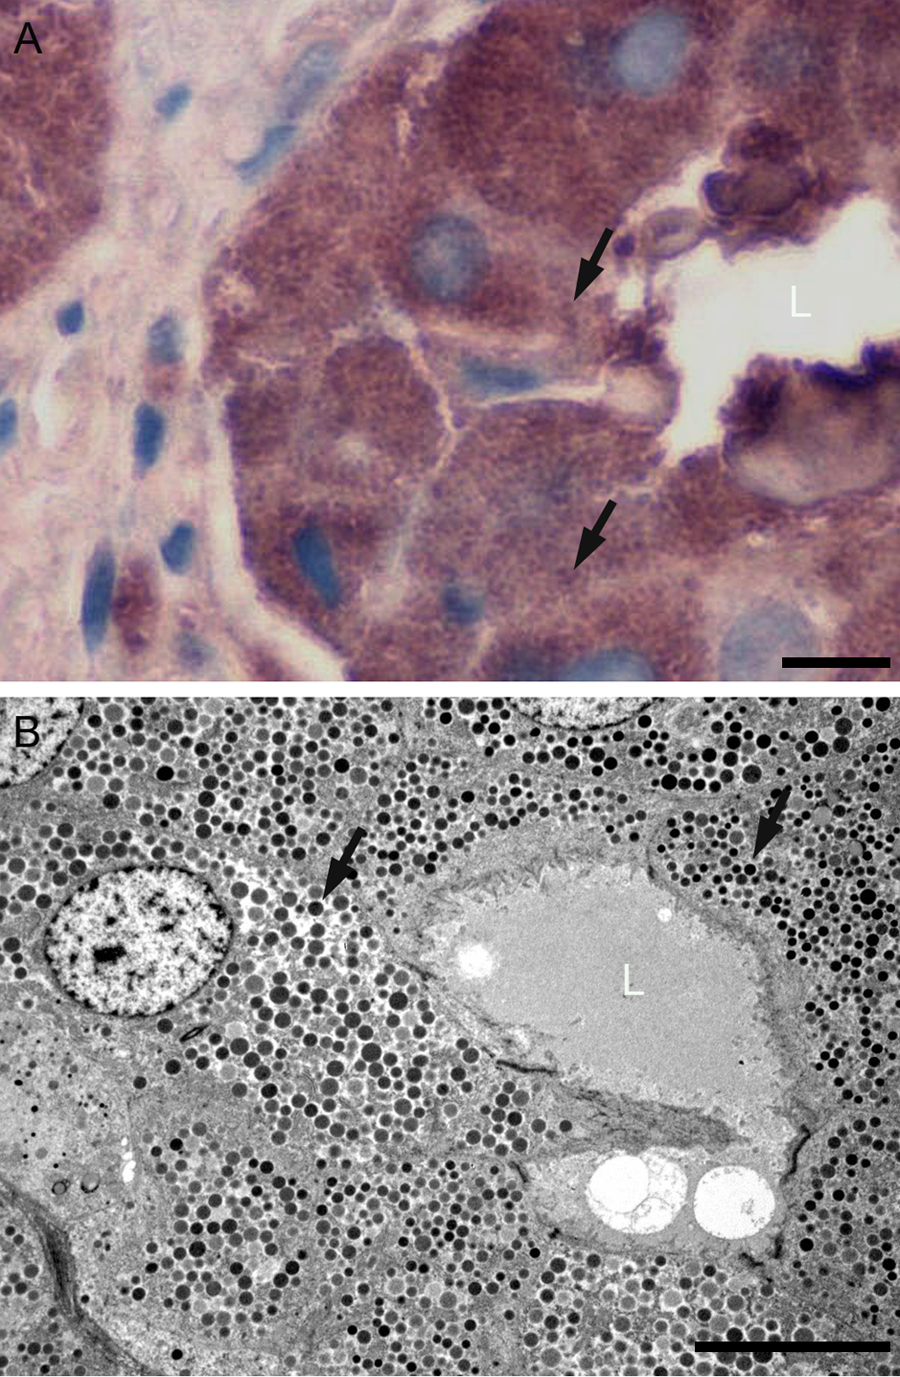
(A) Conventional immunohistochemical localization of somatostatin in somatostatinoma tissue visualized with diaminobenzidine in a paraffin section showing positively stained cells forming an acinar structure with central lumen (L). Staining is intense and the morphological features of the secretory granules are difficult to discern (arrows). (B) Conventional transmission electron microscopy of a similar acinar structure showing abundant secretory granules (arrows) filling the cytoplasm. Scale bars = 8 µm.
Equivalent tissue, when viewed in semithin epoxy sections stained with methylene blue and basic fuchsin, showed tumor cell cytoplasm to contain abundant granules, which stained variably from pink to blue (not shown). Features, such as nuclear chromatin, microvilli, and stromal elements, all appeared with improved resolution over that observed with 3-µm wax histological sections.
Immunofluorescence Light Microscopy
Fluorescence light microscopy of tumor tissue immunostained for somatostatin using QD probes showed positive staining in a large proportion of cells forming irregular clusters and characteristic acinar structures. Some areas of the tumor immediately adjacent to positively stained regions were negatively stained. The positive staining was localized to abundant granules filling most of the cytoplasmic space. Using 525-nm QDs, positive immunostaining appeared as apple-green fluorescence (Fig. 2A). This fluorescence remained stable for prolonged periods of time, allowing thorough examination and imaging to be carried out. Nuclei were revealed as dark unstained rounded spaces lying among the positively stained secretory granules. Some nonspecific staining of nuclei was apparent, but background staining was generally at a low level. The 655-nm QDs produced positive staining that was red in color (Fig. 2B), and 565-nm QDs produced olive green to yellow positive immunostaining (Fig. 2C). Positively stained granules viewed by widefield epifluorescence microscopy appeared as regular rounded structures (Fig. 2C). The dimensions of individual secretory granules measuring approximately 500 nm were easily resolved.
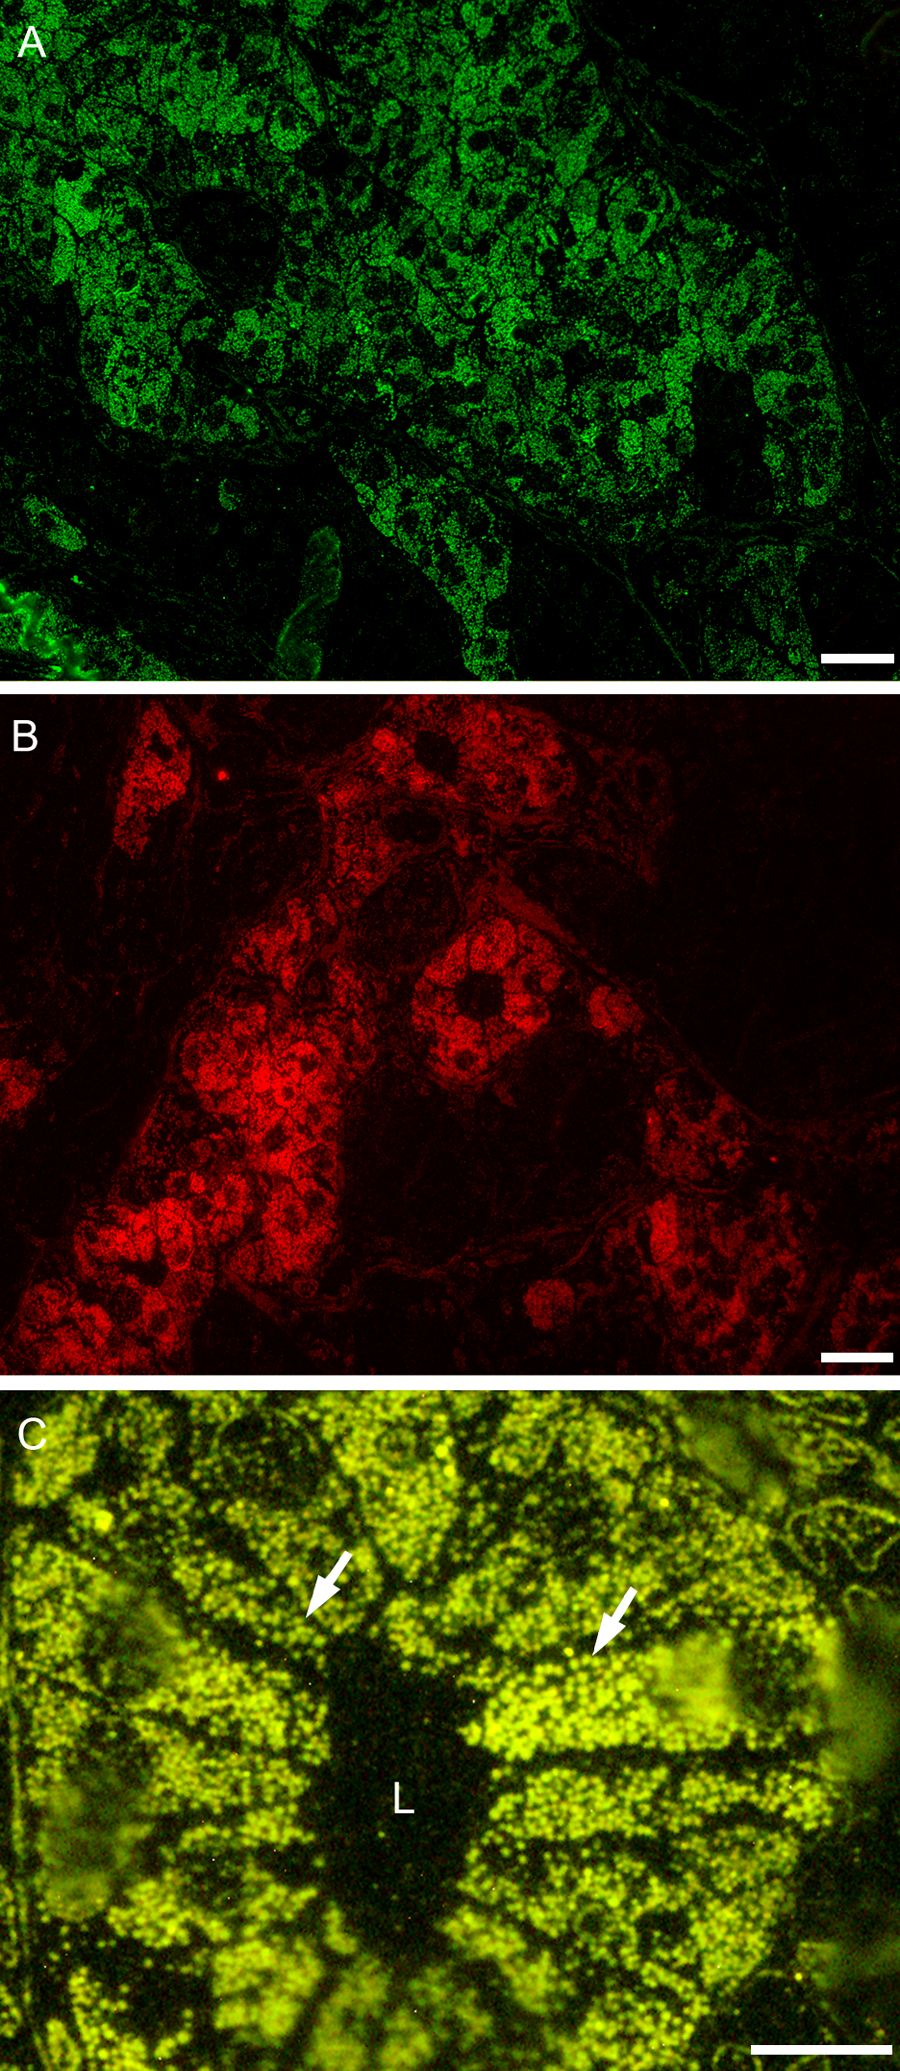
Quantum dot (QD) localization of somatostatin in tumor cells forming gland-like structures in an epoxy section. Different-sized QDs produced different-colored immunofluorescence. The 525-nm QDs (A), 655-nm QDs (B), and 565-nm QDs (C) with higher power view showing secretory granules (arrows). The acinar lumen (L) is also shown. Scale bar: A = 20 µm, B = 20 µm, C = 8 µm.
Electron Microscopy
Routine electron microscopy showed tumor cells with rounded nuclei forming acinar structures interspersed between muscle tissue and stroma. The tumor cell cytoplasm contained abundant 200- to 500-nm membrane-bound secretory granules with amorphous contents displaying a variable level of electron density (Fig. 1).
Immunoelectron Microscopy
Immunoelectron microscopic localization of somatostatin with QDs was carried out using routine ultrathin epoxy sections and a similar labeling protocol to that used for the widefield epifluorescence microscopy studies. After etching of the section surface, ultrastructural detail was not as fine as with conventional TEM sections, but tumor cells were still able to be observed forming acinar structures around lumina lined with microvilli, as seen by widefield epifluorescence microscopy and routine TEM. The cells contained abundant secretory granules (Fig. 3) that showed heterogeneous positive staining. Varying numbers of probes were attached to different regions of individual secretory granules with the highest density seemingly associated with the more electron-dense granules. High magnification revealed QDs to possess an irregular outline suggestive of a crystalline form (Fig. 3).
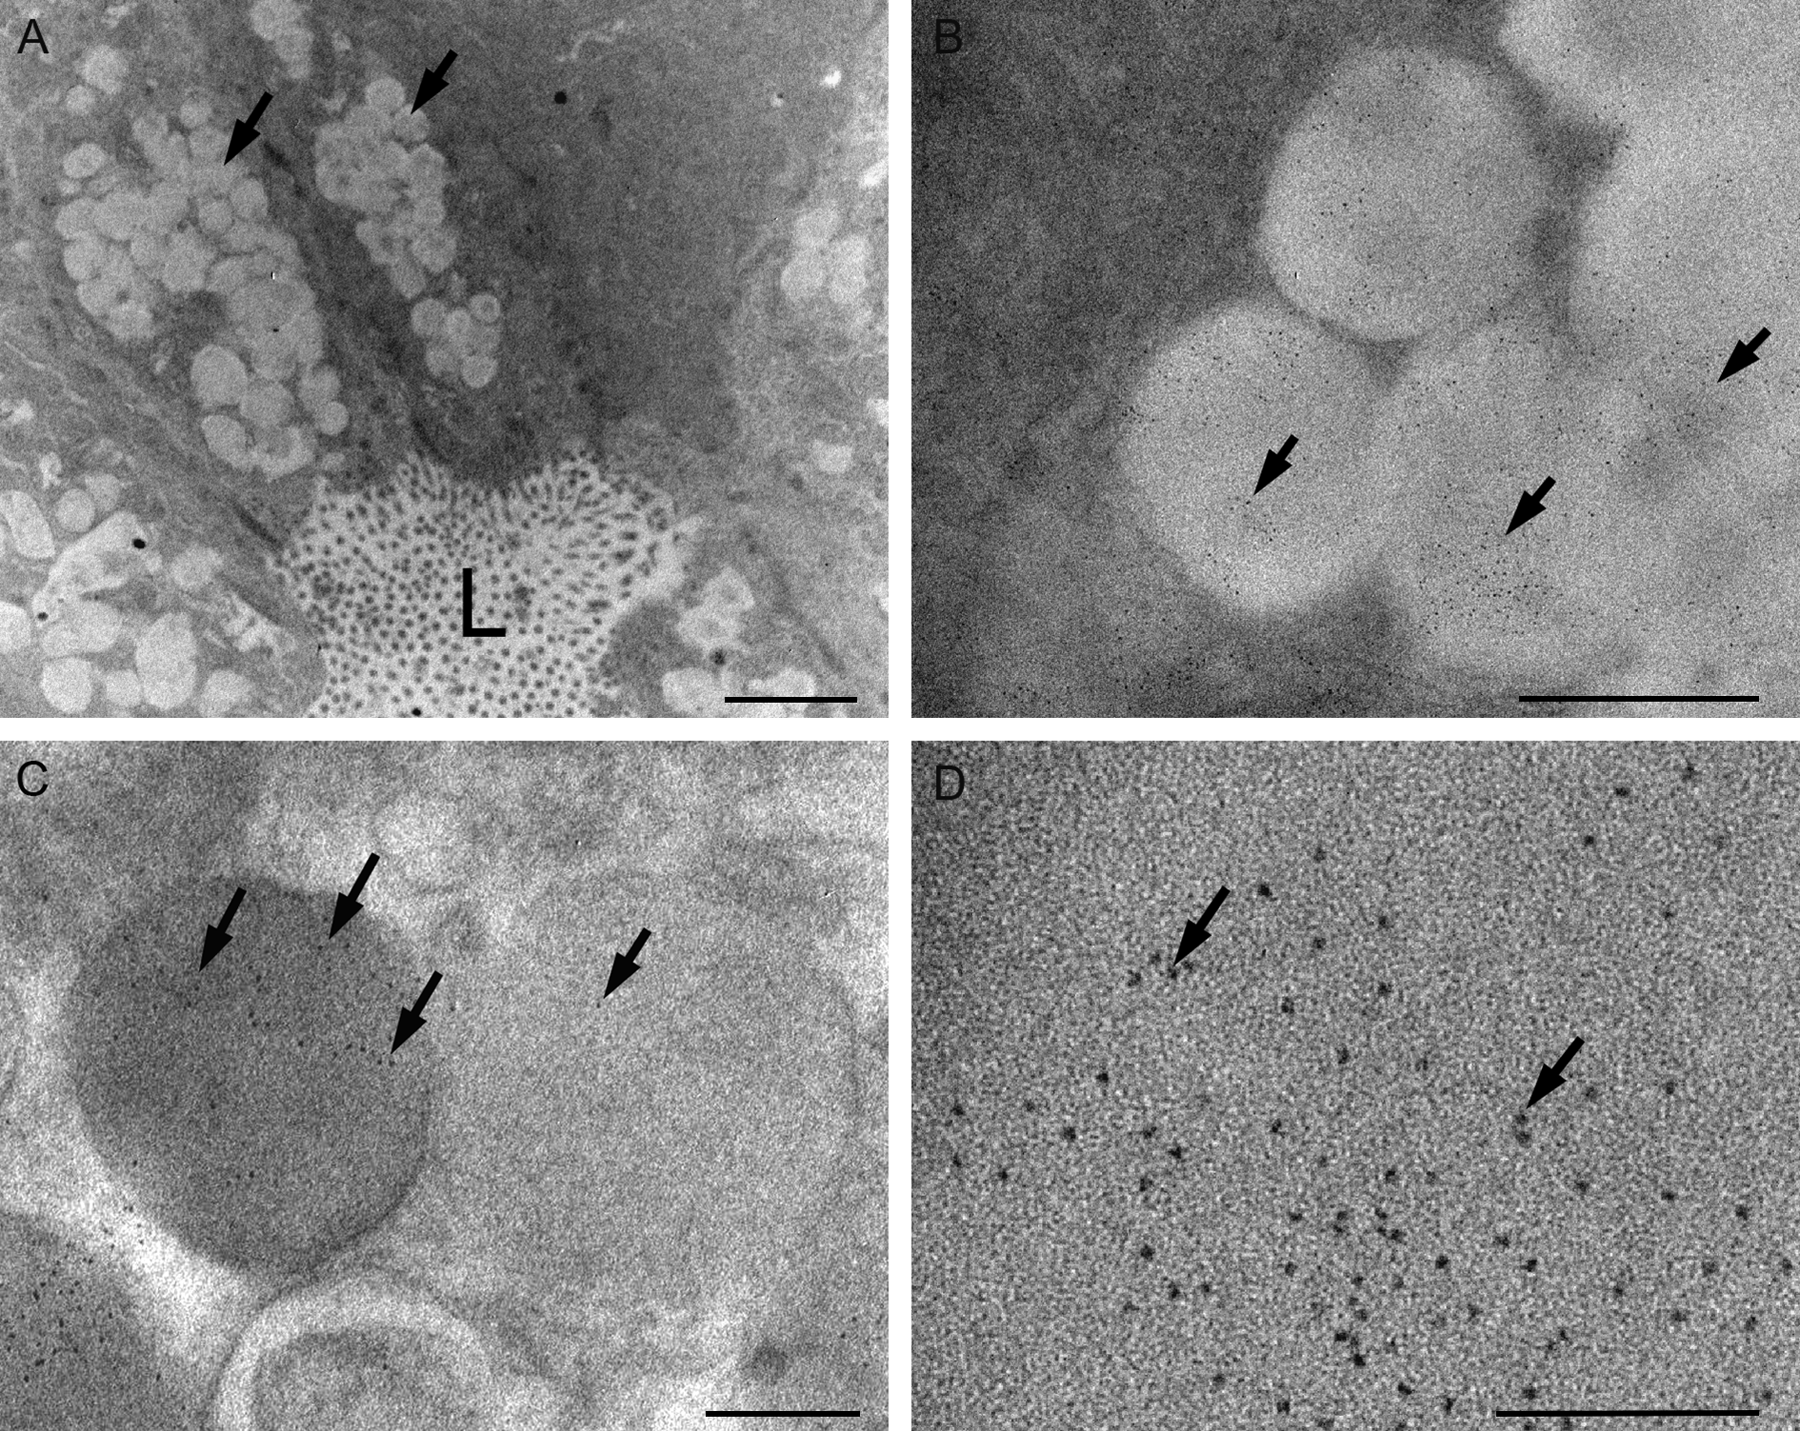
Immunoelectron microscopy on an etched ultrathin epoxy section showing positive labeling of somatostatin in secretory granules using antibody-conjugated quantum dots (QDs) (565 nm). (A) Low-power view showing tumor cells containing secretory granules (arrows) and forming an acinar structure with central lumen (L). QDs in secretory granules are difficult to see at this magnification due to their small size of 3 to 5 nm. (B) QD labeling of somatostatin (arrows) in secretory granules. (C) Density of labeling (arrows) appears to be higher in darker granules. (D) High-power view showing nanocrystal form of QDs (arrows). Scale bar: A = 2 µm, B = 500 nm, C = 180 nm, D = 100 nm.
Super-resolution Light Microscopy
Super-resolution light microscopic localization of somatostatin with QDs was carried out using routine semithin epoxy sections and an identical labeling protocol to that used for the widefield epifluorescence microscopy studies. Examination by super-resolution light microscopy at ×100 showed the tumor cell cytoplasm to comprise large numbers of positively immunostained and highly fluorescent secretory granules. The staining of individual granules was irregular, with regions of bright and dim fluorescence able to be resolved within single granules (Fig. 4). This staining pattern was similar to the labeling pattern seen by immunoelectron microscopy, which also showed the irregular distribution of QDs over secretory granules. This can be seen more clearly in immunoelectron microscopy images segmented into regions of high and moderate probe density that would presumably correspond to regions of high and moderate fluorescence (Fig. 5). Ring-like structures of bright fluorescence were also identified in the super-resolution images (Fig. 4) that were not observed by widefield epifluorescence microscopy. Analysis of TEM images suggested that these structures may correspond to large secretory granules with unusual margination of electron-dense material internal to the limiting membrane (Fig. 4). Based on the observation of increased probe density over more electron-dense regions of secretory granules, it is possible that these areas at the granule margin, when immunostained with QDs, would produce ring-like bright fluorescence when observed by super-resolution microscopy.
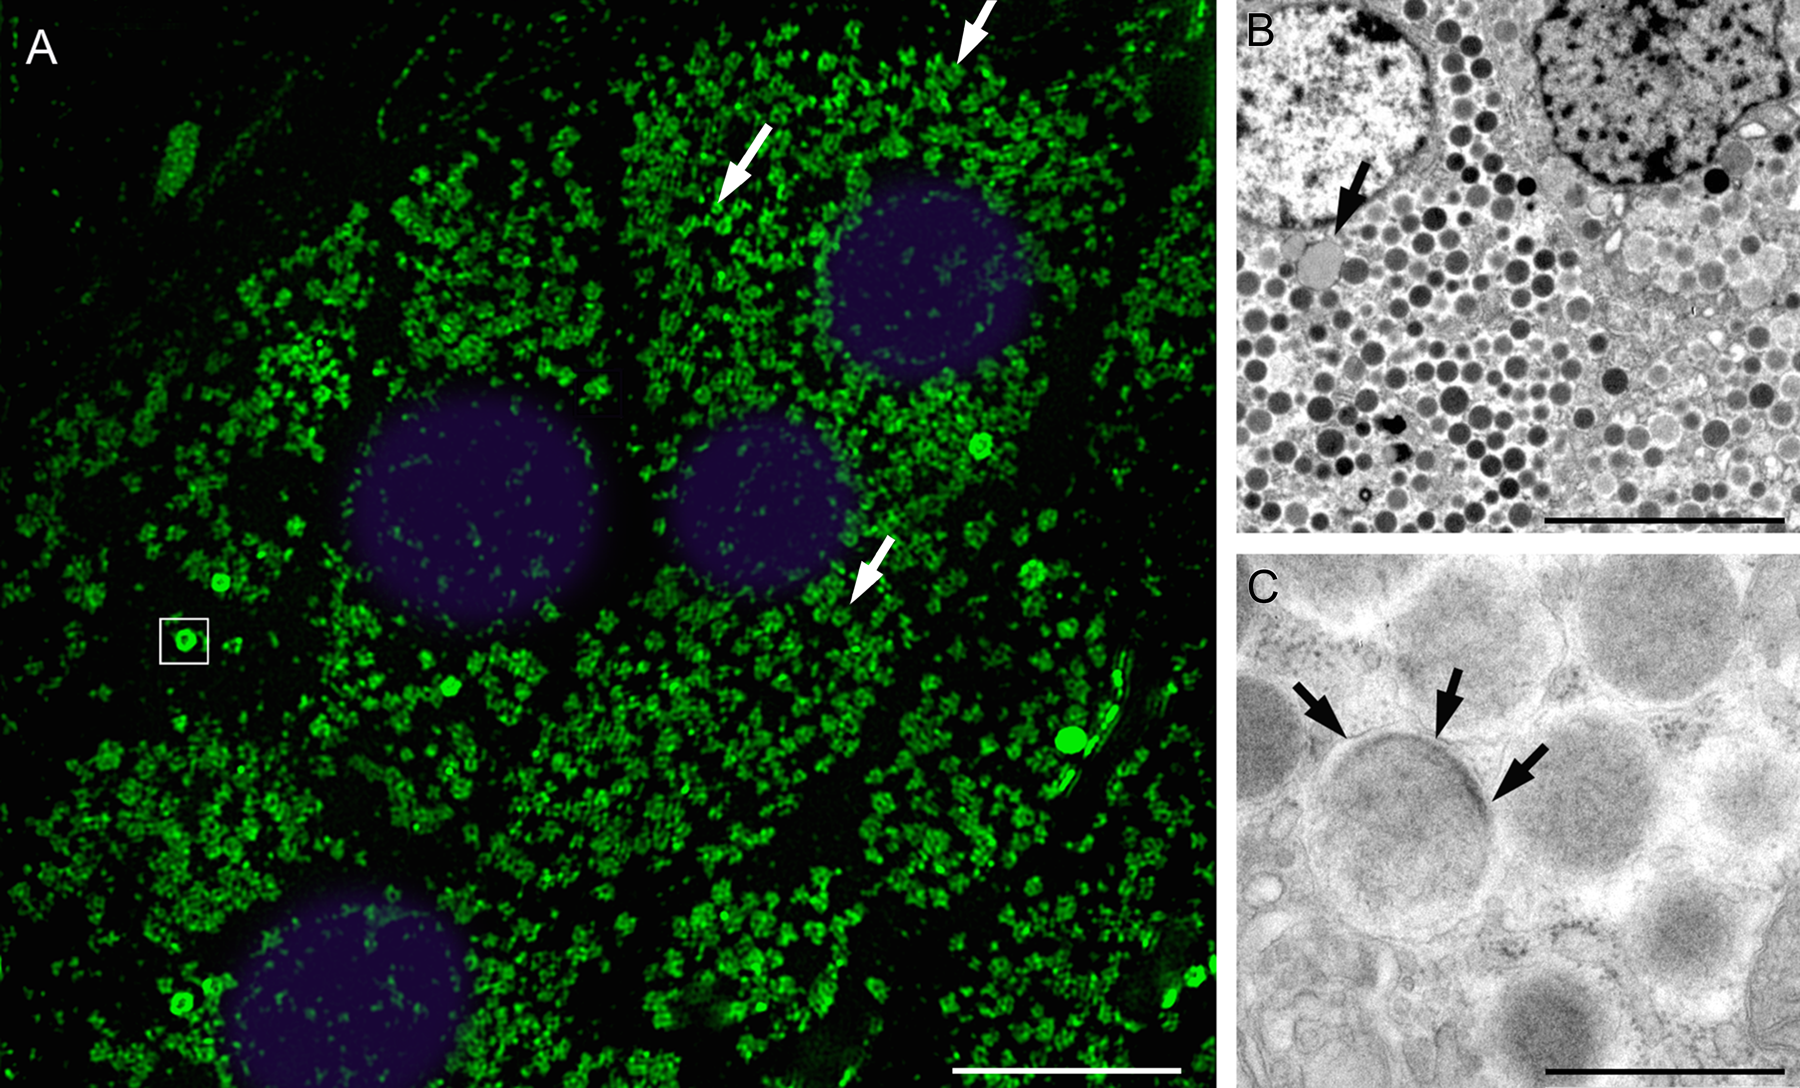
(A) Super-resolution light microscopy image of somatostatin labeling with streptavidin 525-nm quantum dots (QDs) in a 500-nm semithin epoxy section acquired in 3D-SIM mode. The 100-nm resolution of this microscope resolved the irregular distribution of somatostatin in individual secretory granules. Labeling can be seen to be variable with areas of high and moderate fluorescence (arrows). Intensely stained 500- to 600-nm ring-shaped or “doughnut-like” structures in the cytoplasm (square box) and some nonspecific staining in nuclei (colored blue) may also be seen. Super-resolution imaging of QD probes is possible due to their high photostability and strong fluorescence signal. Objective was ×100 with oil immersion and excitation was with a 488-nm laser (monochrome image with false color). (B) Transmission electron microscopy image showing 500- to 600-nm sized granules with electron-dense material at their margins (arrow) thought to correspond to ring-shaped fluorescent structures. (C) Higher power view of a 500-nm secretory granule with electron-dense material inside the limiting membrane (arrows). Scale bars: A = 8 µm, B = 6 µm, C = 500 nm.
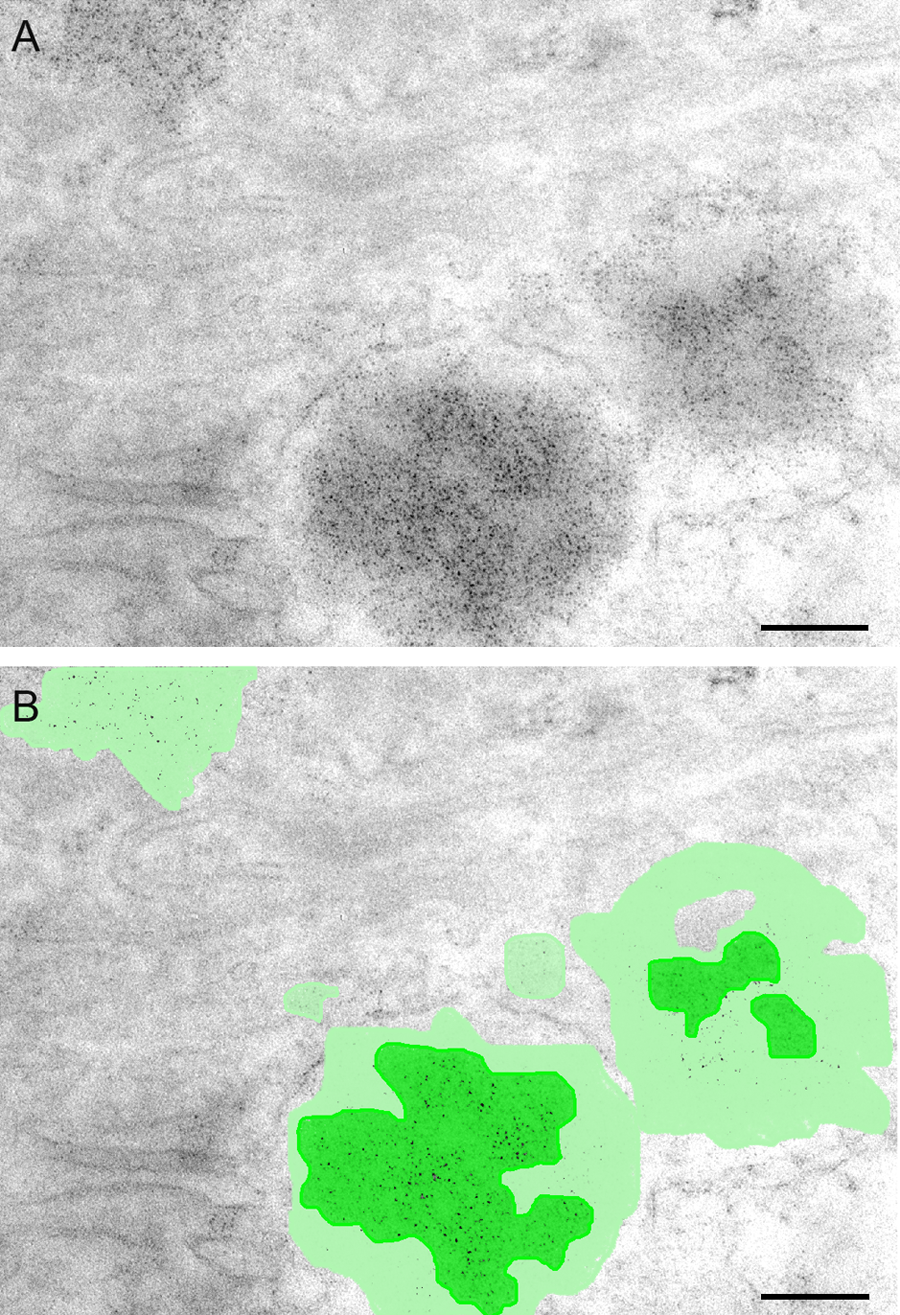
(A) Quantum dot (QD) immunoelectron microscopy showing somatostatin localization in secretory granules and the high-probe density achieved with strepavidin-conjugated QD probes applied following a biotinylated secondary antibody. (B) Same image with false color segmentation showing areas of highest probe density (dark green) and moderate probe density (pale green). Scale bar = 200 nm.
Correlation Studies
Direct correlation images from widefield epifluorescence and electron microscopy were obtained from a single section immunostained for somatostatin with 525-nm streptavidin-conjugated QDs (Fig. 6). Fluorescence microscopy showed variable levels of staining in different regions of the tumor. Interestingly, some areas of negatively stained tissue were lying immediately adjacent to morphologically similar areas that were positively stained. Examination of the same areas in images obtained by TEM showed the negatively stained areas to contain cells with less electron-dense secretory granules that had partially dispersed their contents into the cytoplasm. Strongly fluorescent tumor cells contained regularly shaped, rounded, and electron-dense granules with a high density of QD labeling.
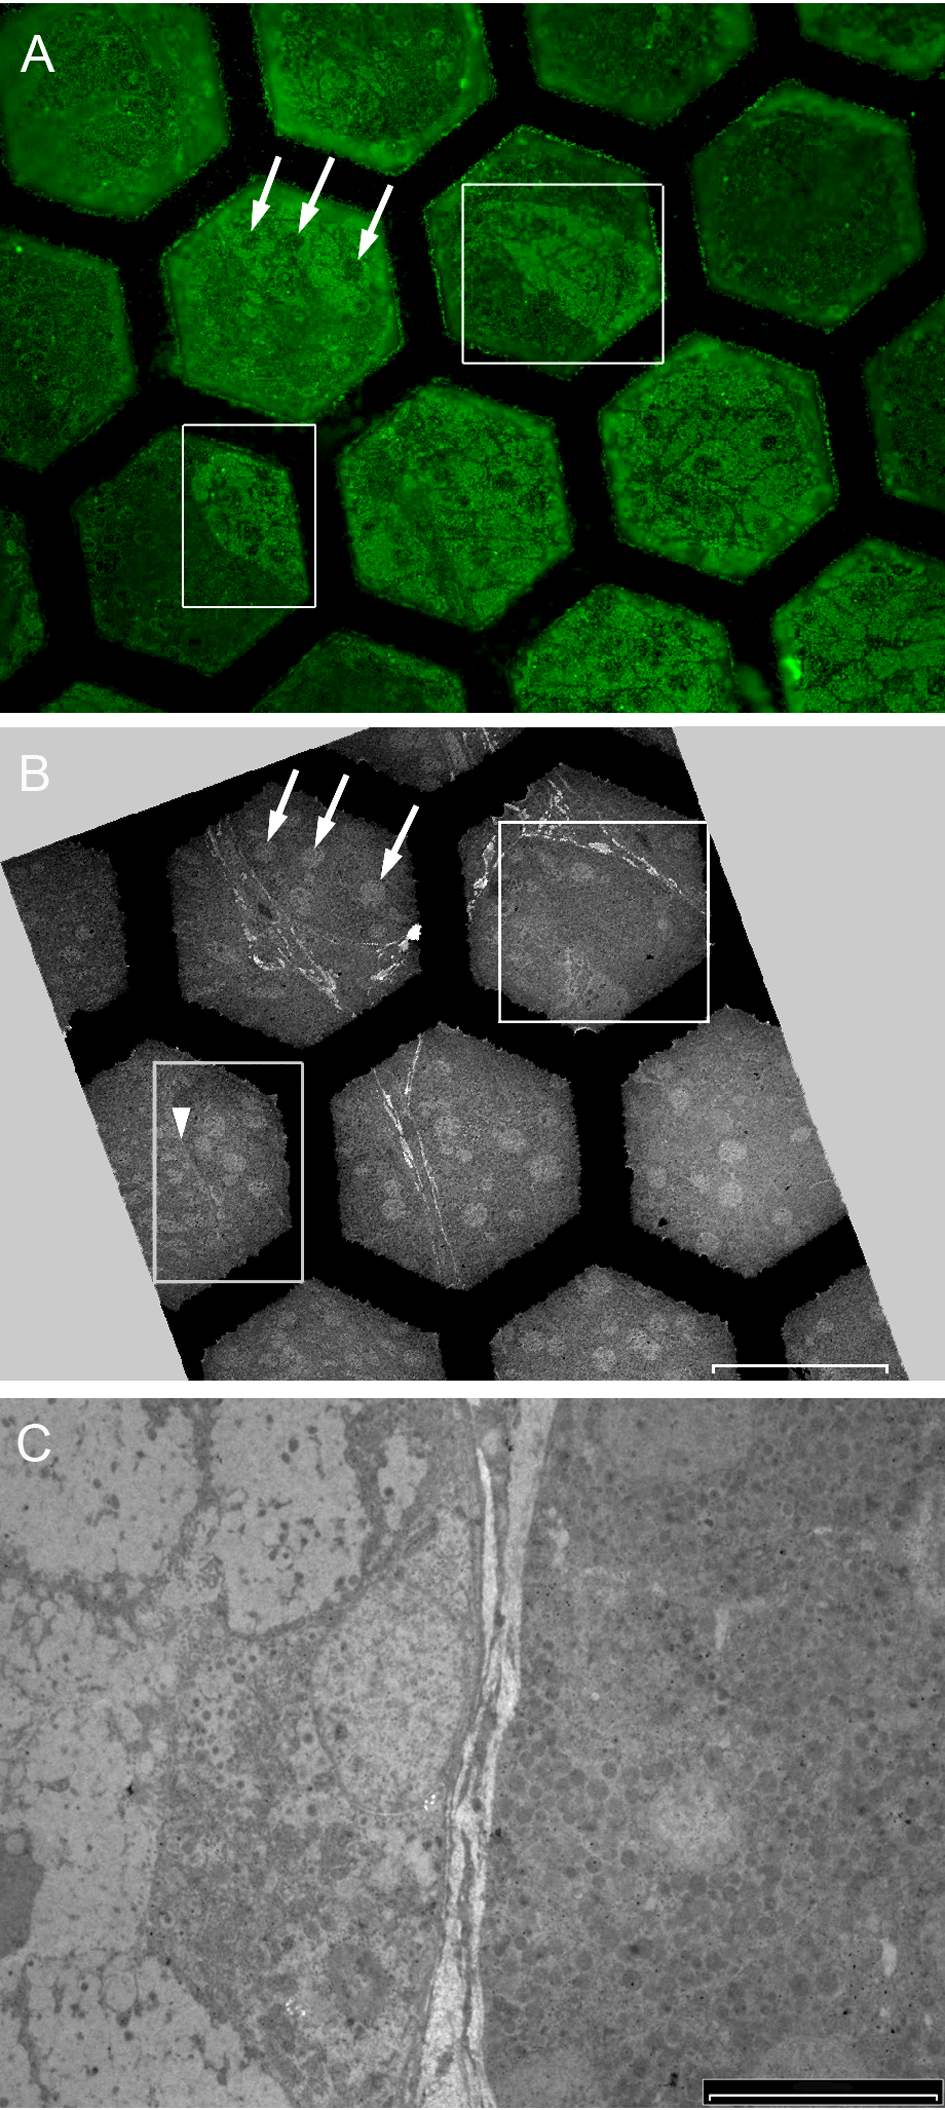
Correlation microscopy images from widefield epifluorescence microscopy and immunoelectron microscopy. (A) Immunofluorescence image with two areas of unusually shaped tumor cell clusters (inside squares) and some clearly defined tumor cell nuclei (arrows). (B) The same structures in the same section as seen by low-magnification transmission electron microscopy (TEM). Areas of strongly stained tumor (A) lay adjacent to areas with low level or negative staining (arrowhead). (C) Higher magnification TEM view of the area identified with the arrowhead in (B) showing cells in a region with low-level staining (left-hand side) to contain more dispersed pale secretory granules. Cells in the gland-like structure on the right-hand side contain more electron-dense granules. Scale bar: A = 50 μm, B = 50 µm, C = 10 µm.
Discussion
The search for a universal immunocytochemical reagent that can be visualized by both light and electron microscopy has been conducted for some time. Early studies demonstrated that it was possible for diaminobenzidine used in immunoperoxidase staining to be visualized by electron microscopy (Antoine et al. 1974), but ultrastructural detail was not optimal. Later, colloidal gold coupled with fluorescein isothiocyanate (FITC) (Roth et al. 1980) was found to have improved contrast as a dual light and electron microscopy marker. Subsequently, it was established that nano- or ultra-small colloidal gold could be intensified with a silver reaction to the point where the deposits could be resolved by brightfield light microscopy (De Valck et al. 1991), thus allowing the one primary reagent to be used for both microscopy modalities. More recently, fluoronanogold reagents (Robinson and Vandré 1997) and QD nanocrystals (Nisman et al. 2004) have been employed as single reagents for correlation light and electron microscopy studies.
QDs offer significant advantages for use in immunocytochemistry because of their high quantum efficiency in the emission of photons and increased photostability compared with organic fluorophores such as FITC (Tokumasu and Dvorak 2003; Hutter and Maysinger 2011). The optical properties of QDs are determined by the core constituent material, particle size, and surface chemistry (Resch-Genger et al. 2008), and it is the heavy elements of the core that provide the additional feature of electron density, enabling visualization by TEM. They may be functionalized by conjugation with antibodies, antibody fragments, and streptavidin as have other particles such as colloidal gold. QDs have been used previously for immunolabeling studies using pre-embedding procedures (Giepmans et al. 2005) and postsection labeling of acrylic resin-embedded cells (Nisman et al. 2004). However, their use in routine pathology has to date been limited.
The results of the present study demonstrate the utility of QDs for immunolabeling studies of archived and routinely processed pathology tissue. Super-resolution light microscopy images were readily acquired due to the high photostability and brightness of the QD immunofluorescence signal. Their suitability for immunoelectron microscopy has also been demonstrated. Another benefit of this approach was that light microscopy visualization of immunolabeling provided a broader overview of the staining pattern. This assisted with determining the significance of the labeling obtained with immunoelectron microscopy by allowing easier recognition of any nonspecific labeling. The use of the same specimen and labeling protocol for both techniques was also possible—the only differences being section thickness and the position of the section during incubations, which seemed to have a negligible effect on staining.
The epoxy-embedded tissue sections from glutaraldehyde-fixed osmicated tissue used in our study offer inherently better preservation than sections from paraffin-embedded tissue, conventional cryostat frozen tissue (Groos et al. 2001), or methacrylate-impregnated tissue (Schwarz and Humbel 2007). Using widefield epifluorescence microscopy examination of QD-labeled semithin epoxy sections, it was possible to resolve individual secretory granules sized approximately 500 nm in diameter. In comparison, secretory granules observed in paraffin sections were ill-defined and difficult to quantify.
The high photostability of QDs under laser stimulation was a significant aid in acquiring suitable images by super-resolution light microscopy. However, the variable staining of individual secretory granules observed by super-resolution light microscopy was an unexpected finding. Positively stained secretory granules observed by widefield epifluorescence microscopy appeared as strongly fluorescent rounded structures. The irregular outline and strong to moderate fluorescence of secretory granules seen by super-resolution light microscopy was initially difficult to reconcile with the appearance by epifluorescence. However, the irregular labeling pattern did correspond to the similar pattern of probe attachment seen by immunoelectron microscopy. By segmentation of immunoelectron microscopy images into presumed areas of bright and moderate fluorescence, based on QD probe density, it was possible to recognize that the labeling pattern seen in super-resolution was likely to be more accurate than the widefield epifluorescence view. This is consistent with findings from previous studies showing widefield microscopy images to possess more rounded outlines when compared with higher resolution structured illumination microscopy images of the same specimen (Gustafssson et al. 2000). Likewise, the brightly fluorescent ring-like structures seen by super-resolution light microscopy were not seen in widefield epifluorescence microscopy examination of the same specimen. Analysis of TEM images acquired from ultrathin sections from the same specimen suggested that these structures may correspond to a subpopulation of large secretory granules that showed margination of electron-dense material under the limiting membrane. We had previously observed that the highest probe density was associated with electron-dense secretory granules, the electron-dense material presumably representing sites of more concentrated somatostatin antigen and therefore producing more intense fluorescence. We considered whether this apparent variation in secretory granule density might be due to the presence of protein added to the section surface in the immunostaining procedure by examining QD probes applied to formvar-coated grids. The formvar coating provided a “clear” window on which the probes could be examined by electron microscopy. There was found to be quite noticeable added electron density in pale cloud-like formations surrounding QDs. However, this density was characterized by soft edges and was most obvious when automatic contrast/gamma adjustment was used in acquisition. We therefore looked for changes in density that were limited by membrane and used manual gamma adjustment to avoid this potential artifact when evaluating the electron density of individual secretory granules. The ring-like structures may not have been observed by widefield epifluorescence microscopy, as the approximately 200-nm resolution of this microscopy technology would be insufficient to resolve the variation in labeling intensity within individual granules, which would therefore appear as filled-in rounded areas of fluorescence.
It is interesting to note that the present study was carried out using 8-year-old archived human pathology tissue that was routinely processed for transmission electron microscopy, including fixation with glutaraldehyde, osmication, and embedding in epoxy resin with heat curing at 70C. To achieve any immunolabeling on such a specimen is remarkable as current thinking would suggest that antigenicity would be lost after such severe processing. Usually, care must be taken to preserve tissue antigens by minimizing exposure to fixatives such as glutaraldehyde and limiting temperature of curing to below 55C. However, earlier studies have demonstrated that it is possible to achieve both significant labeling and high-quality ultrastuctural preservation using osmicated epoxy-embedded tissue (Hearn et al. 1985). This and the results of the present study suggest that routine processing of tissue for electron microscopy may not totally destroy tissue antigenicity and that etching or deplasticizing of the section surface is capable, to some extent, of re-exposing tissue epitopes for antibody binding.
Etching or deplasticizing of sections to reveal antigenic epitopes is a critical step when attempting to immunolabel epoxy sections. Solutions of sodium ethoxide (Brorson 1997), sodium metaperiodate (Stirling and Graff 1995; Groos et al. 2001), and 2-methoxyethyl acetate (MEA) (Brorson and Reinholt 2008) are commonly used. Sodium metaperiodate is a strong oxidizing agent and, in the present study, etching of the section surface for 40 min at room temperature was found to give an acceptable balance of labeling probe density with retention of adequate ultrastructural detail. Extending to 50 min caused loss of ultrastructural definition and aggregation of membrane and cytoplasmic constituents. Sodium metaperiodate clearly is capable of providing some form of antigen retrieval and partial reversal of some of the epitope masking effects of fixation, epoxy embedding, and heat curing. Unlike some other studies, we did not require further antigen retrieval to successfully immunolabel our epoxy sections. Previous studies have found that antigen retrieval by heating in citrate buffer (Stirling and Graff 1995; Brorson and Strøm 1998; Groos et al. 2001), Tris-HCl (Yamashita et al. 2009), or alkaline solutions (Yano et al. 2003) significantly increased immunlabeling probe density over that obtained with etching alone. Other aspects, such as an increased amount of accelerator in epoxy resin (Brorson 1998a), the use of propylene oxide in specimen processing (Brorson 1996), the sectioning process itself (Hann et al. 2001), and osmication of tissue (Brorson 2004), have also been shown to affect antigen retrieval from epoxy sections.
In addition to antigen retrieval processing, the physical dimensions of labeling probes, choice of targeting ligand, and surface characteristics of the nanoparticle used may also affect binding avidity to target antigens. We noted that use of streptavidin-conjugated QDs applied after a biotinylated secondary antibody produced a much higher labeling density than was obtained under identical conditions with QDs of the same size conjugated to the F(ab′) 2 antibody fragment. This may be due to either the higher affinity of the biotin-avidin bond or effects of QD surface chemistry influencing the binding of protein targeting ligands, which in turn can influence binding of the probe to the target antigen (Tassa et al. 2010). Although producing higher probe density over the target structures, labeling with streptavidin QDs did not appear to be as specific as obtained with equivalently sized antibody fragment QDs. With streptavidin QDs, occasional probe clusters were found spreading outside the secretory granule-limiting membrane, suggesting that amplification of the labeling and extension of the link between the probes and the target epitopes had resulted in spreading of the probe cluster beyond the granule-limiting membrane. We did not notice any appreciable difference in labeling using streptavidin-conjugated QDs of different wavelengths or colors, despite their different sizes. Increased labeling density with smaller sized probes is a well-known phenomenon in immunoelectron microscopy (Yi et al. 2001). It was not possible to assess what role differences in QD shape played in binding avidity, although we did notice quite a large variety of crystalline shapes in QDs of the same 565-nm wavelength. Probe shape may not be a significant issue as nanoprobes of similar size and composition, but different shapes are now being produced to allow double labeling studies with comparable affinity (Meyer et al. 2010).
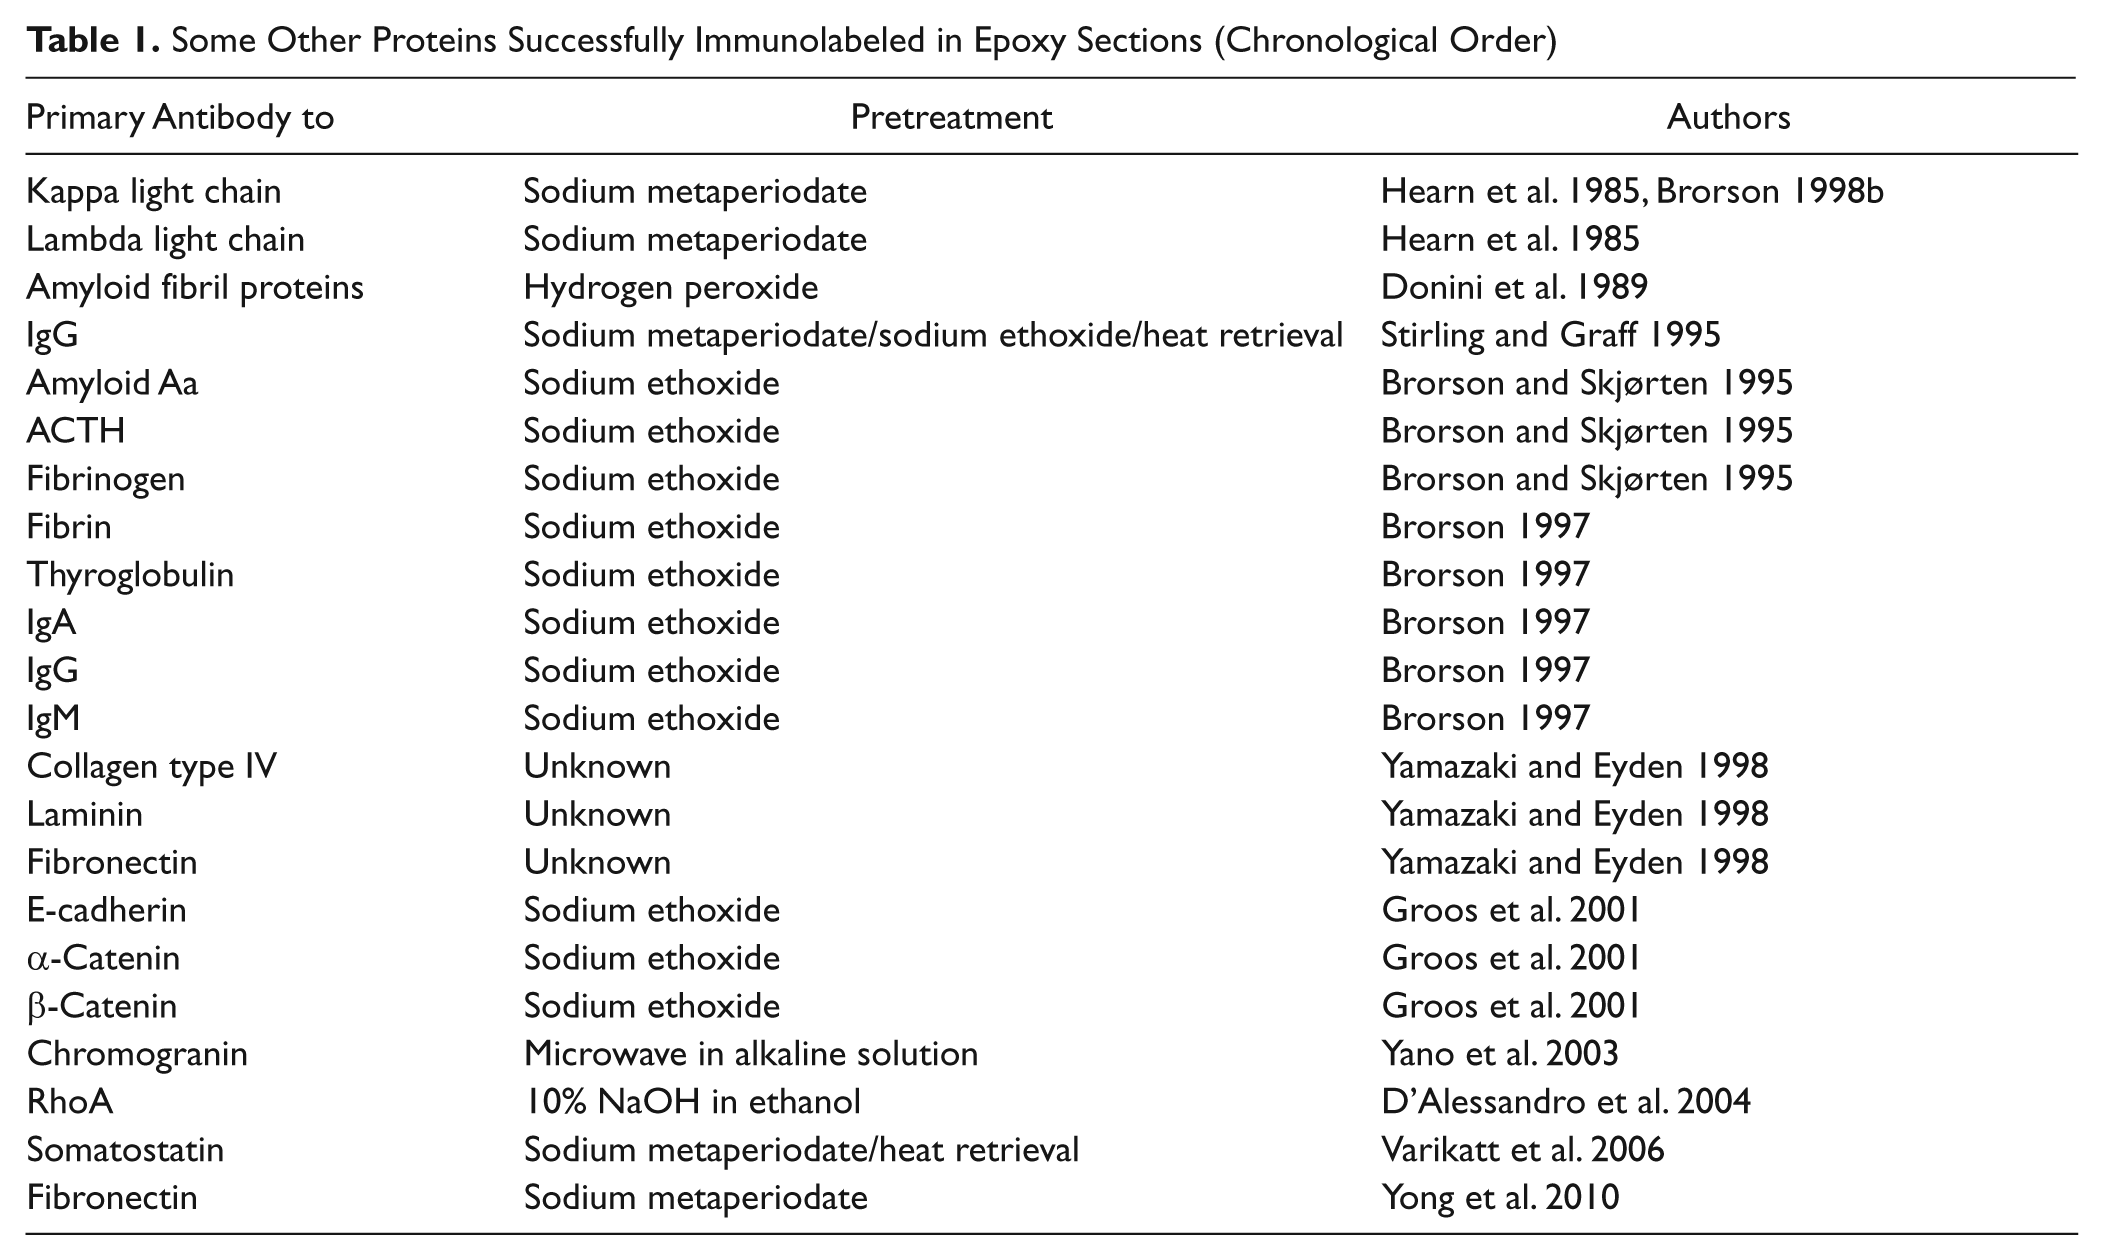
The anti-somatostatin polyclonal antibody used in this study did produce some minor nonspecific labeling of nuclear chromatin that was detectable by both light immunofluorescence microscopy and immunoelectron microscopy. This may be a result of the use of a high antibody concentration (1:10 dilution) equal to approximately 3.47 mg/ml that is commonly used for immunoelectron microscopy. The level of background labeling was generally low, and the method achieved a high degree of specificity for cytoplasmic secretory granules. We acknowledge that using polyclonal antiserum for our labeling of somatostatin hormone represents a favorable immunolabeling scenario. This was intentional as we sought a convenient model to demonstrate “proof of principle” for the QD immunocytochemical approach. Despite this, the list of other proteins that have been successfully labeled using etched epoxy sections continues to grow (Table 1). In addition, it has been suggested that carbohydrates and other non-protein components are not as strongly linked in epoxy sections, so they may be appropriate targets for labeling with this approach (Schwarz and Humbel 2007).
Some Other Proteins Successfully Immunolabeled in Epoxy Sections (Chronological Order)
The QD immunolabeling approach offers several advantages for immunocytochemical studies. Primarily, the ability to use complementary microscopy techniques to view sections immunolabeled with an essentially common protocol is a significant aid to interpretation. The ability to use routinely processed pathology tissue presents the possibility of accessing archived diagnostic tissue for research investigations. Further improvement in the efficiency of molecular retrieval processing and probe affinity binding should increase the range of intracellular and extracellular structures able to be studied by this approach.
Footnotes
Acknowledgements
The authors thank Mr. Tristen Tan, Coherent Scientific P/L, for providing access to the Nikon N-SIM microscope and assisting with super-resolution light microscopy image acquisition.
Declaration of Conflicting Interests
The authors declared no potential conflicts of interest with respect to the research, authorship, and/or publication of this article.
Funding
The authors received no financial support for the research, authorship, and/or publication of this article.