
Abstract
Particulate gold labeling applied to ultrathin sections is a powerful approach for locating cellular proteins and lipids on thin sections of cellular structures and compartments. Effective quantitative methods now allow estimation of both density and distribution of gold labeling across aggregate organelles or compartment profiles. However, current methods generally use random sections of cells and tissues, and these do not readily present the information needed for spatial mapping of cellular quantities of gold label. Yet spatial mapping of gold particle labeling becomes important when cells are polarized or show internal organization or spatial shifts in protein/lipid localization. Here we have applied a stereological approach called the rotator to estimate cellular gold label and proportions of labeling over cellular compartments at specific locations related to a chosen cell axis or chosen cellular structures. This method could be used in cell biology for mapping cell components in studies of protein translocation, cell polarity, cell cycle stages, or component cell types in tissues.
F
The standard approaches for quantifying gold labeling estimate the density or the distribution of gold in relation to compartment profiles (D'Amico and Skarmoutsou 2008). Typically, the gold density is estimated by combining gold counts with stereological estimators of profile areas or length, and the distribution is estimated by counting gold labeling across appropriately sampled cellular compartments (Lucocq 1994, 2008). For such analyses, recent studies have emphasized the usefulness of χ2 statistics for comparison of labeling intensities/distributions between compartments or experiments (Mayhew and Lucocq 2008).
But these methods are not well suited to mapping cell components in three-dimensional (3D) space. The reason is that they often employ random sections that can intersect parts of a cell that cannot be identified as belonging to the cell of interest, and may lack precise information about the spatial arrangements of labeling or structures. And yet it could be of interest to map the location of antigens relative to a cell axis or a central location in the cell, for example, in polarized cells in which membrane domains are organized relative to the cell axis, or in polarized cells that contain gradients of organelles through their cytoplasm. Even in cells without obvious polarization, there may be regional variation in the distribution of cell components, for example, when the endoplasmic reticulum (ER) is dispersed and the Golgi is central, or when movement of endocytic organelles from the periphery toward the cell center occurs. One way of mapping gold particles in individual cells would be to carry out serial sectioning, but this is labor intensive, and it would be preferable to use a method that requires analysis of only a single section. Such a technique could be a useful tool in cell and tissue biology.
The solution presented here is to use the rotator (Vedel-Jensen and Gundersen 1993; Tandrup et al. 1997; Mironov and Mironov 1998). This is a stereological probe that represents an application of the Pappus theorem (Howard and Reed 1998) and utilizes random rotation of a section plane around an identifiable axis to estimate aggregate parameters (such as volume) within appropriately sampled cells. Because the axis may be chosen along a recognizable direction in the cell, this approach is well-adapted for use in polarized cells, and stereological estimates can be adapted to obtain local estimates of organelle/structure at specific cell regions relative to the axis or other identifiable structures (Nyengaard and Gundersen 2006).
However, it has been pointed out recently that the rotator can be used in combination with a probe called the disector to estimate numbers of cell components/ organelles (Nyengaard and Gundersen 2006), and this principle is adapted here for the estimation of gold particle labeling. The method uses a single section through the central portions of a cell and allows estimation of relative proportions of gold label over different compartments, estimation of the total amount of gold label per cell in 3D if needed (Lucocq 1992,1994,2008; Griffiths 1993), and importantly, the mapping of quantities of labeling relative to a unique reference axis, a cell center, or any identifiable structure or set of structures. This adaptation of the rotator for number estimation of gold particle labeling should be particularly useful for assessing the distribution, amounts, and gradients of labeling in polarized cells or in specific cell types/cell stages in culture or tissues.
Materials and Methods
Cell Preparation
MDCK cells were grown on polycarbonate filters with a pore size of 1 μm (Sterlitech; Kent, WA). The cells were fixed in 0.5% glutaraldehyde in 0.2 M PIPES, pH 7.2, at room temperature for 30 min, washed in PBS (155 mM NaCl, 4 mM phosphate buffer, pH 7.4), filters rolled and then embedded using progressive lowering of temperature (PLT). Dehydration of the sample was done in progressive steps of ethanol comprising 30%, 50%, 70%, 100%, and 100% v/v in water at 0C, -10C, -25C, -40C, and -50C, respectively for 30 min at each step, followed by HM23 resin-ethanol at -50C in volume ratios of 25:75, 50:50, and 75:25, each for 1 hr, followed by an hour in 100% HM23 with a final change to 100% HM23 and infiltration for 16 hr. The resin was polymerized using a 15-W ultraviolet lamp for 24 hr at -50C followed by a 48-hr polymerization step at 25C. All PLT steps were done using a Leica AFS freeze substitution machine (Leica Systems; Vienna, Austria). Sections were made with a Diatome diamond knife (Biel, Switzerland) and collected on 1-mm x 2-mm slot copper support grids coated with pioloform (Agar Scientific; Stansted, Essex, UK). Ultrathin sections were cut orthogonal to the monolayer.
Immunogold Labeling and Rotator Sampling
Sections were preincubated on blocking buffer, which contained 1% BSA and 0.5% cold-water fish skin gelatin (Sigma; Poole, Dorset, UK) in PBS. This was followed by incubation on anti-actin antibody polyclonal antibody raised in rabbit (a kind gift from Giulio Gabbiani, Geneva, Switzerland) diluted in the blocking buffer and then, after washes in PBS, by gold labeling using 10 nm gold 1:100 in PBS (prepared as described in Lucocq 1993). Sections were contrasted in 3% uranyl acetate followed by lead citrate.
To sample the central region of MDCK cells, a stack of sections was randomly positioned, with approximate intervals of 1 μm between the sections. At each location, a 300-nm section and an adjacent 80-nm section were mounted separately on slot grids. Images of the whole filter were recorded from 300-nm sections at low magnification (x300). Cell nuclei with profiles that appeared in the second (so-called reference) section and disappeared in the first look-up section were selected and followed through the series to identify the section with a nuclear profile of largest diameter. Eighty-nm sections immediately adjacent to this section were then labeled for actin as described above and imaged at higher magnification (x7500). Gold particles located over homogeneous fibrillar material in contact with the plasma membrane (actin cortex) were considered for quantitation.
Results
Rationale and Overview of the Approach
The rotator was originally used as an approach to estimate volume and is an application of the Pappus theorem, which states that “If a planar figure revolves about an external axis in its plane, the volume of the solid thus generated is equal to the product of the area of the figure and the distance travelled by the centre of the gravity of the figure” (Vedel-Jensen and Gundersen 1993). In electron microscopy, the rotator can be used to estimate organelle and cell volume (Mironov and Mironov 1998; Nyengaard and Gundersen 2006). First, an axis of rotation needs to be defined, and one way to do this is to use sections that are allowed freedom to “rotate” (during processing) around a constant direction. This direction could be “vertical,” passing through cells orthogonal to a defined horizontal plane, e.g., the surface of a culture dish or a plane inside a tissue, such as an epithelial surface. Sections passing through an appropriately sampled, centrally located structure, such as a nucleolus, centrosome, or nucleus, can then be used for rotator estimates (see below). Another way to allow freedom of rotation around an axis is to first ensure unrestricted freedom of rotation in all directions during processing. The axis might then be defined after sectioning by an appropriately sampled (and aligned) set of structures within the cell. These structures could be two centrosomes at either end of the mitotic spindle (McCullough and Lucocq 2005) or the long axis passing through the apical dendrite and axon of a neuronal cell. Formal ways of ensuring uniform random rotation have been described (see Howard and Reed 1998).
For rotator estimates to be unbiased, the cells, or the centrally located structure within them, must be sampled with equal probability. This can be done using the disector, which selects individual structures according to their number rather than their size (Sterio 1984). It may be advantageous in the present approach to sample a central structure such as the centrosome or a nucleolus (if solitary) so that the axis of rotation is located as near to the center of the cells as possible. An alternative is to sample the edge of the cell nucleus first and then scan through subsequent sections at intervals until the nucleus reaches a maximum size. These procedures tend to position the sections used for estimation fairly reproducibly from cell to cell and aid their identification. They also preserve aspects of cellular organization that may be present in relation to this axis.
A simple published method for volume estimation in electron microscopy with the rotator utilizes random point hits on organelles, combined with distances of these hits from the axis, to estimate global volumes (Mironov and Mironov 1998). But the application of the rotator is not limited to the estimation of volume. Number can also be estimated by applying the physical disector, in which objects found in one section plane are counted if they disappear in a second section plane parallel to the first (Sterio 1984; Gundersen 1986). A simple equation (Nyengaard and Gundersen 2006) then combines, the height of the disector, h(dis), and the distance, d, from the object/structure (str) counted to the axis to estimate the number per cell:
This forms the basis of a rather straightforward way of estimating the number of gold particles in 3D (Figures 1B and 2). In immunocytochemical labeling, the gold-labeled epitopes/determinants are unique to the section, and the gold particles themselves are added after sectioning and cannot be present in the adjacent section(s). Therefore, the height of the disector used for counting the gold particles is equal to the thickness (t) of the section that has been labeled. So in a rotator:
Thus, it is only necessary to know the section thickness,
Notice that it is only in rather special circumstances that the absolute value of Ng per cell is needed. One example would be the estimation of labeling efficiency, where the number of gold particles per cell is compared with the number of molecules estimated biochemically (Lucocq 1992,1994,2008; Griffiths 1993), an issue not discussed further here. Section thickness determination can be achieved for resin sections using published methods (Small 1968; Gunning and Hardham 1977), and has also been achieved for thawed frozen sections prior to contrasting (Griffiths et al. 1984). Alternatively, labeling may be expressed in terms of a labeling index, in which the section thickness is kept constant from experiment to experiment and ignored along with the constant π (section thickness may influence the labeling signal if there is penetration into the section; see below). In this case, the sum of distances from the axis for gold particles in each organelle/compartment/location for all cells, Σd(cells), is related to the number of cells examined:
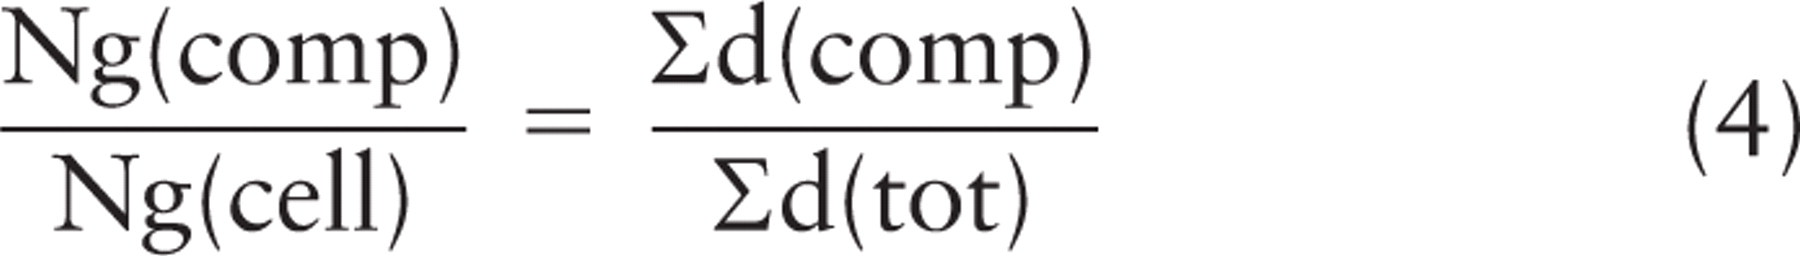
In everyday usage, however, it is the proportion of total golds over different compartments that is often of interest, and this can also be determined in the rotator. Importantly, this proportion cannot be obtained here by simply counting the numbers of particles over each compartment. This is because gold particles furthest from the axis have a greater weighting than those close to it. To obtain an estimate of the proportion of total labeling that would label a compartment in 3D, the rotator estimate of the number of particles over the organelle/compartment per cell is divided by the estimate of total particles. Here, the section thickness term t, as well as the constant π, cancel in the equation. Therefore, the fraction of gold particles over an organelle/ compartment (comp) compared with the total (tot) is given simply by the ratio of sums of distances of gold particles to the axis:
Sampling central cell regions of nuclei and application of the rotator for quantifying gold particles. (
The advantage of the rotator for mapping gold particle location is that the axis of rotation may be defined according to the cell structure/organization. For example, in a polarized cell, the axis might be chosen in a direction through the center of a basal nucleus to the apex, through an apical dendrite and basal axon of a neuronal cell, or the centrosome and apex/basolateral aspect of a polarized epithelial cell. Alternatively, the axis may be defined by a vertical section oriented orthogonal to a culture dish or an epithelial surface and may pass through an appropriately sampled structure such as the centrosome. The gold labeling can be assigned according to its compartment or organelle location or even its position in space relative to some visible structures, say the plasma membrane or the centrosome or the axis itself. In fact, gold labeling can be grouped/assigned in any way that allows better understanding of relative quantities in different regions/structures of the sampled cell or cells.
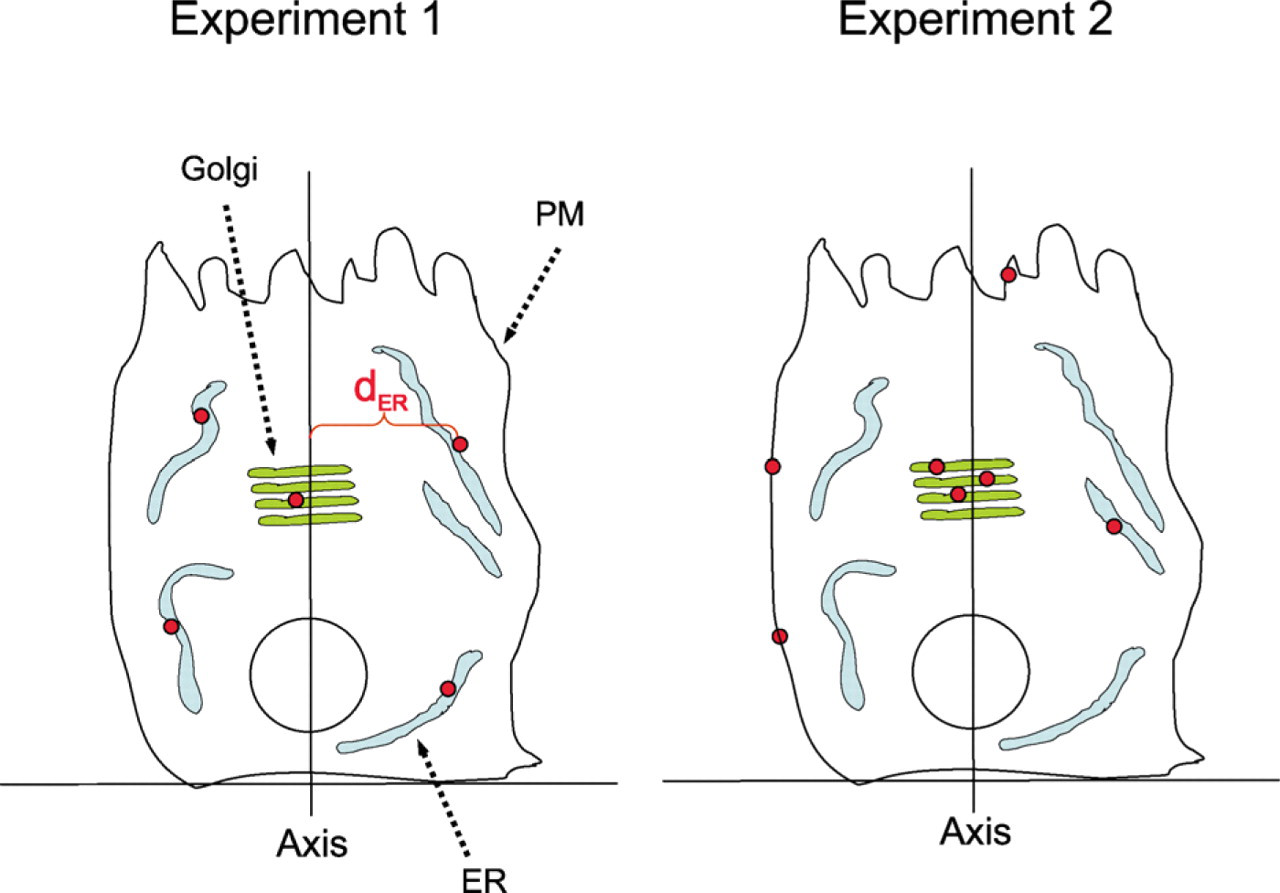
Theoretical example of gold labeling for a protein that translocates through the secretory pathway. Cells expressing a viral glycoprotein were investigated under conditions in which the glycoprotein first accumulates in the endoplasmic reticulum (ER; experiment 1). The glycoprotein is then allowed to move by vesicular transport into the secretory pathway (experiment 2), during which time further protein synthesis is inhibited. In experiment 2, gold particle labeling increases in the Golgi and plasma membrane (PM), reflecting intracellular transport through the secretory pathway. After fixation and embedding, vertical ultrathin sections passing through the central regions of cell nuclei were selected as described in the text and labeled for the viral glycoprotein. Detailed analysis of data is given in the text and in Table 1.
Basic Procedure for Data Acquisition
Embed cells in suitable medium for labeling and structural display. It may be necessary to identify a vertical direction perpendicular to an identifiable horizontal plane such as the surface of a culture dish or the surface of an epithelium. Embedding is then carried out so that sections may be cut perpendicular (vertical) to this axis. Orientation of the specimen (or section) around the vertical axis should be randomized during embedding, and the section(s) should be placed at a random location within the specimen. In some cases, say for cells in suspension, an alternative strategy might be to ensure random orientation and position (isotropic uniform random) (Nyengaard and Gundersen 1992) and then consider cells that are sectioned along a chosen axis. Here the axis might be defined by apical and basal structures that can been sampled appropriately. If a vertical direction is used, this does not have to pass along any preferred axis of the cell structures. However the precise and reproducible location of the vertical axis central to the cell(s) will reduce variation in the estimates and allows greater precision, especially if spatial mapping is carried out (see below for details).
Select cells appropriate for the study. One possibility is to use disectors to select the edge of unique organelles/structures within the cell such as the centriole or nucleus (Sterio 1984). Once the cell has been selected in this way, a short series of sections may be necessary to identify a section that is more centrally located in the sampled organelle (Figure 1A). This could be the middle section of a series through the centriole or nucleus, or the section with the maximal profile size (diameter or area). Selection can be done with semithin sections using light microscopy or ultrathin sections mounted on slot grids using electron microscopy. Selection of section locations and cells using disectors should form part of a multistage sampling scheme, as detailed in Lucocq (2008) and Mayhew and Lucocq (2008).
Carry out immunogold labeling of sections containing central regions of selected cells/organelles and record images at the lowest magnification that allows visualization of both gold and the structures of interest. If ultrathin sections mounted on delicate slot grid support films are to be used for sampling as well as gold counting, it may be useful to immunolabel the whole set of sections prior to selection of cells. As with any quantitative study, the sections should be of highest possible quality, with good display of structures/compartments and minimal artifacts such as folds.
Take images covering the whole of each selected cell (it may be necessary to overlap images and to make a collage of these). Next, draw an axis bisecting any structures that define the axis to which the gold labeling will be referred. As already noted, the precision of the placement and orientation of this axis on the 2D image, and in 3D space, will determine the precision of the estimations of gold per cell and also the precision of any local estimates of gold labeling relative to cell structures or to the axis.
Identify gold labeling of interest and measure the distance between gold particles and the selected axis (d). As required by the aims of the study, assign populations of particles to regions/structures (see Figures 1B and 2). Then calculate the sum of d for each cell, or for each compartment or location of interest within each cell. To speed up this procedure, it is useful to classify gold particles into bands of known width that are oriented along the axis (see Figure 3). The number of gold particles in each band multiplied by the distance of the center of the band to the axis is an estimate of the Σd for that band.
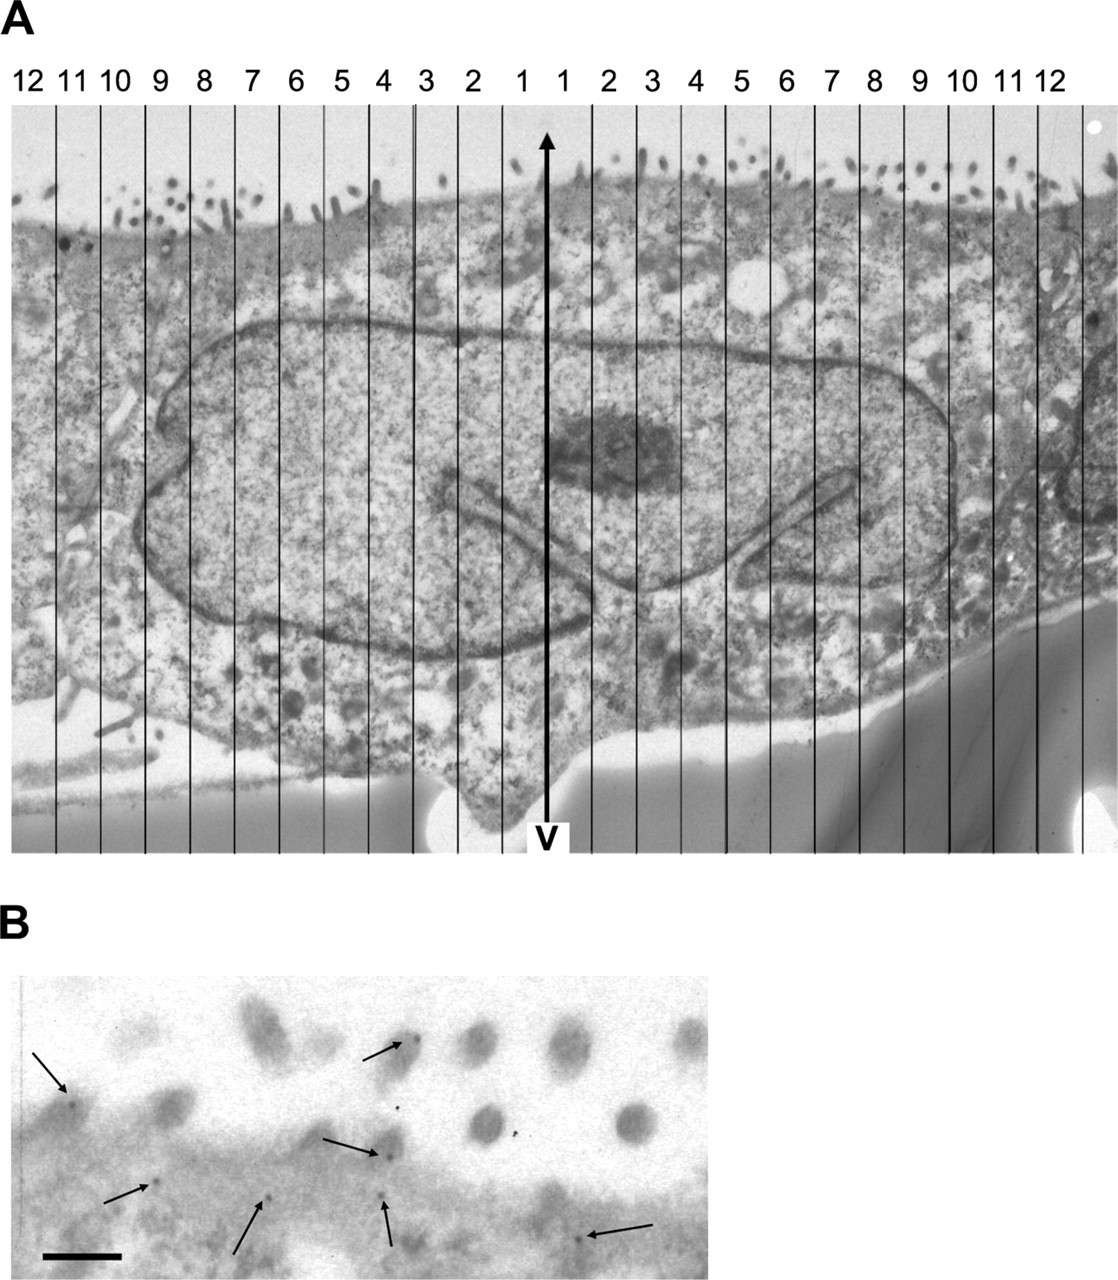
Example of gold labeling for actin analyzed using the rotator in an MDCK cell. The MDCK cells were embedded in Lowicryl HM23 and immunogold labeled for actin. Cells were selected using the procedure described in the text and illustrated in Figure 1. (
Data Processing
The sum of distances of gold particles from the axis for each compartment (Σd) is an index of total gold labeling on that compartment for that cell (labeling index). This is because the estimate of the total gold labeling on that compartment for that cell is obtained by multiplying Σd by a constant (π/t), when mean section thickness does not vary. The index can be expressed as a mean labeling index by summing distances over a number of cells and dividing by the number of cells examined: Σd(comp)/Ncell. Also, in any one cell-section, Σd for gold labeling on one organelle or location can be used to calculate the proportion of a total pool of gold labeling (tot) that is associated with that particular organelle/compartment/location. Σd(comp)/Σd(tot) is an estimator of the fraction of gold labeling over that compartment (equation 4 above). Note that because these estimates depend on the length of the circles of rotation, the proportion cannot be found by simply counting the gold particles (unless the golds are equidistant from the axis). It is then also possible to compare gold labeling of a compartment(s)/location (or indeed whole cell) between two experimental conditions (Figure 2; Table 1). The values of Σd(comp) or Σd(cell) can be compared as a ratio; for example, as Σd(compexp2)/Σd(compexp1), or as (Σd(compexp2) - Σd (compexp1))/Σd(compexp1), which reveals the relative change in labeling in the compartment/cell from one treatment to the next. Interestingly, under conditions where the amount of target molecule per cell is constant, such ratios, e.g., Σd(cellexp2)/Σd(cellexp1), inform about any change in the relationship between gold label and target molecule (labeling efficiency). Thus, if labeling efficiency decreases, say because of movement between compartments or posttranslational modifications, then the total labeling per cell will fall.
To estimate the number of golds per cell, it is necessary to multiply Σd by π/t, where the section thickness t can be found by measurement of section folds (Small 1968), or by changes in the size of a truncated specimen block (Gunning and Hardham 1977). This estimate is equivalent to the total gold that would be located over that compartment if the cell were serially sectioned entirely at that particular section thickness (see discussion below on labeling penetration into the section).
Theoretical example
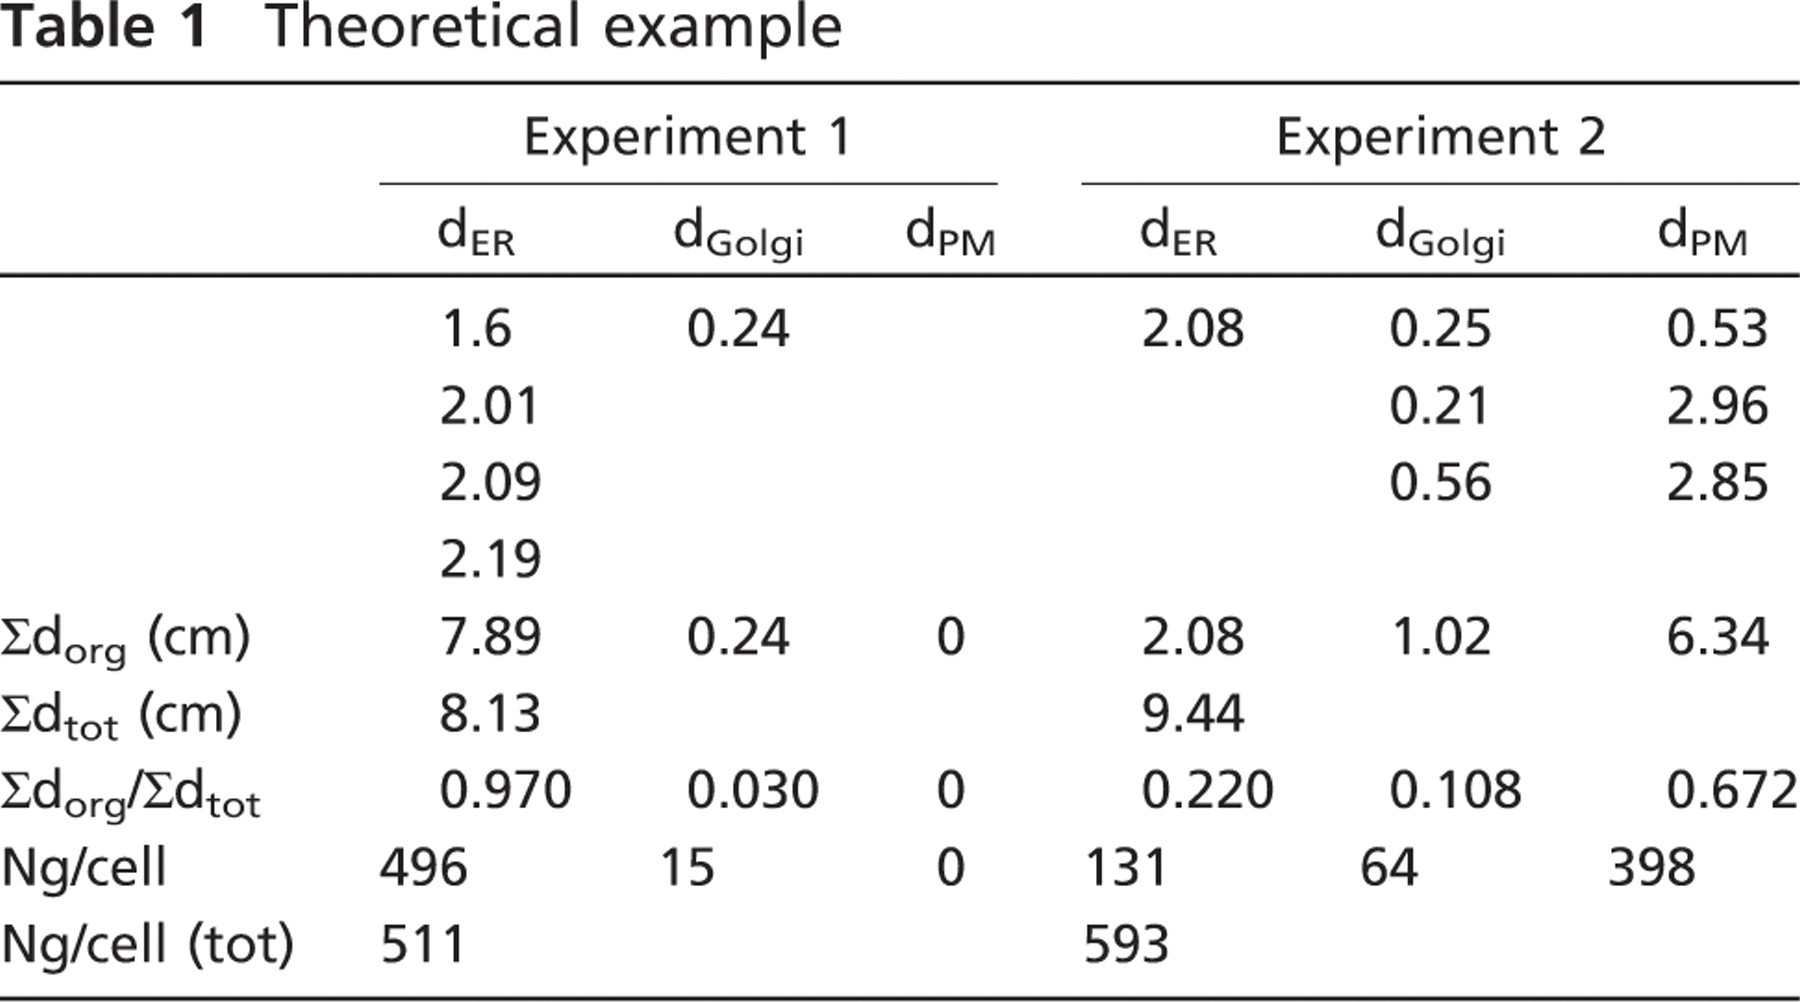
Polarized cells from two experiments (described in the text and illustrated in Figure 2) were grown on a substratum, fixed, and embedded in resin. Cell nuclei were sampled unbiasedly using the disector in sections oriented orthogonal (vertical) to the substratum but with random rotation around the vertical direction. Centrally located nuclear sections were immunogold labeled, and images were recorded. An axis bisecting the nuclear profile in a vertical direction was drawn, and the apparent distance (d) of each gold particle to the axis was recorded. Then d was summed for gold particles labeling endoplasmic reticulum (ER), Golgi apparatus (Golgi) and plasma membrane (PM) to provide a labeling index applicable to these conditions of labeling and magnification. An estimate of the fraction of golds over each organelle (org), compared to the total (tot) for each experiment, is given by Σdorg/Σdtot. Whereas in experiment 1, most (97%) of the gold labeling is present over the ER, this drops to 22% in experiment 2, and now 67% of label is found at the plasma membrane, indicating movement of the protein from the ER through the Golgi to the plasma membrane. Total golds (Ng) per cell can be calculated using the magnification of x5000 and section thickness, t, of 0.1 μm. The real Σd = apparent Σd (μm)/5000, and according to equation 2, would be multiplied by the factor π/0.1 to give the total golds. So for the ER in experiment 1, Ng/cell would be (78,900/5000) x π/0.1 μm = 496 golds per cell over the ER. Because protein synthesis was inhibited, a consistent small increase in the total golds per cell in experiment 2 could suggest a small increase in the overall labeling efficiency when the protein resides in the Golgi and/or the plasma membrane. dER signifies the distance of this particular ER-related gold label to the axis.
Statistical Considerations
For the estimate to reflect the population from which it is drawn, it is important to obtain data from more than one cell as part of a multistage sampling design (see Mayhew and Lucocq 2008). Data might be obtained from ≃10–20 cells in the first instance (see Tables 2 and 3), and the variation in any estimate will depend on a number of factors, which include: (1) the intensity of labeling, (2) heterogeneity in distribution of labeling, (3) reproducibility in axis position/orientation, and (4) inherent differences in the cells. If the intensity of labeling is high, it may be necessary to sub-sample, and this can be easily done using systematically spaced quadrats to which unbiased 2D counting rules can be applied (see Real Example below and also Lucocq 2008). In this case, the rotator estimates will tend to be more precise if the labeling distribution is more dispersed in the cell volume and will be more imprecise if the labeling is spatially restricted.
Theoretical Example
To illustrate application of the rotator to gold labeling, we present a theoretical example, which examines the distribution of gold labeling across membrane-bound compartments in cells labeled under two different experimental conditions (Figure 2; Table 1). In this system, the gold labeling is located over three compartments for simplicity. The labeled protein is a viral glycoprotein that is made in the ER. After synthesis, the protein passes by vesicular transport through the Golgi en route to the plasma membrane. In this cell type, the ER and plasma membrane are widely dispersed, whereas the Golgi is centrally located close to the nucleus. The cells examined here come from a pulsechase-type study in which the protein was accumulated in the ER (experiment 1) and was then released into the secretory pathway in the presence of a protein synthesis inhibitor (experiment 2). The protein passes first into and then through the Golgi apparatus and then to the plasma membrane. This cell type is grown on culture dishes and polarizes with a brush border situated at its apex. To sample the cells, vertical sections were prepared at a random location with random orientation allowed around the vertical direction. The cells were selected using combined light and electron microscopy as follows. A stack of section pairs composed of adjacent semithin (500-nm) andultrathin (100-nm) sections were prepared with 1 μm between each pair. Using the semithin sections viewed by light microscopy, cells that exhibited a nucleus profile in one section but not in the preceding section (the “look-up” section; Sterio 1984) were selected, and subsequent semithin sections were examined to find the sections containing the largest nuclear profile (diameter; see Figure 1). Next the EM section(s) adjacent to these semithin sections were immunogold labeled for the viral protein of interest and contrasted. Cells were located and photographed at a magnification large enough to locate the gold and to identify the compartments of interest (x5000).
Real example: rotator estimates of actin labeling in MDCK cells (data from a single cell)
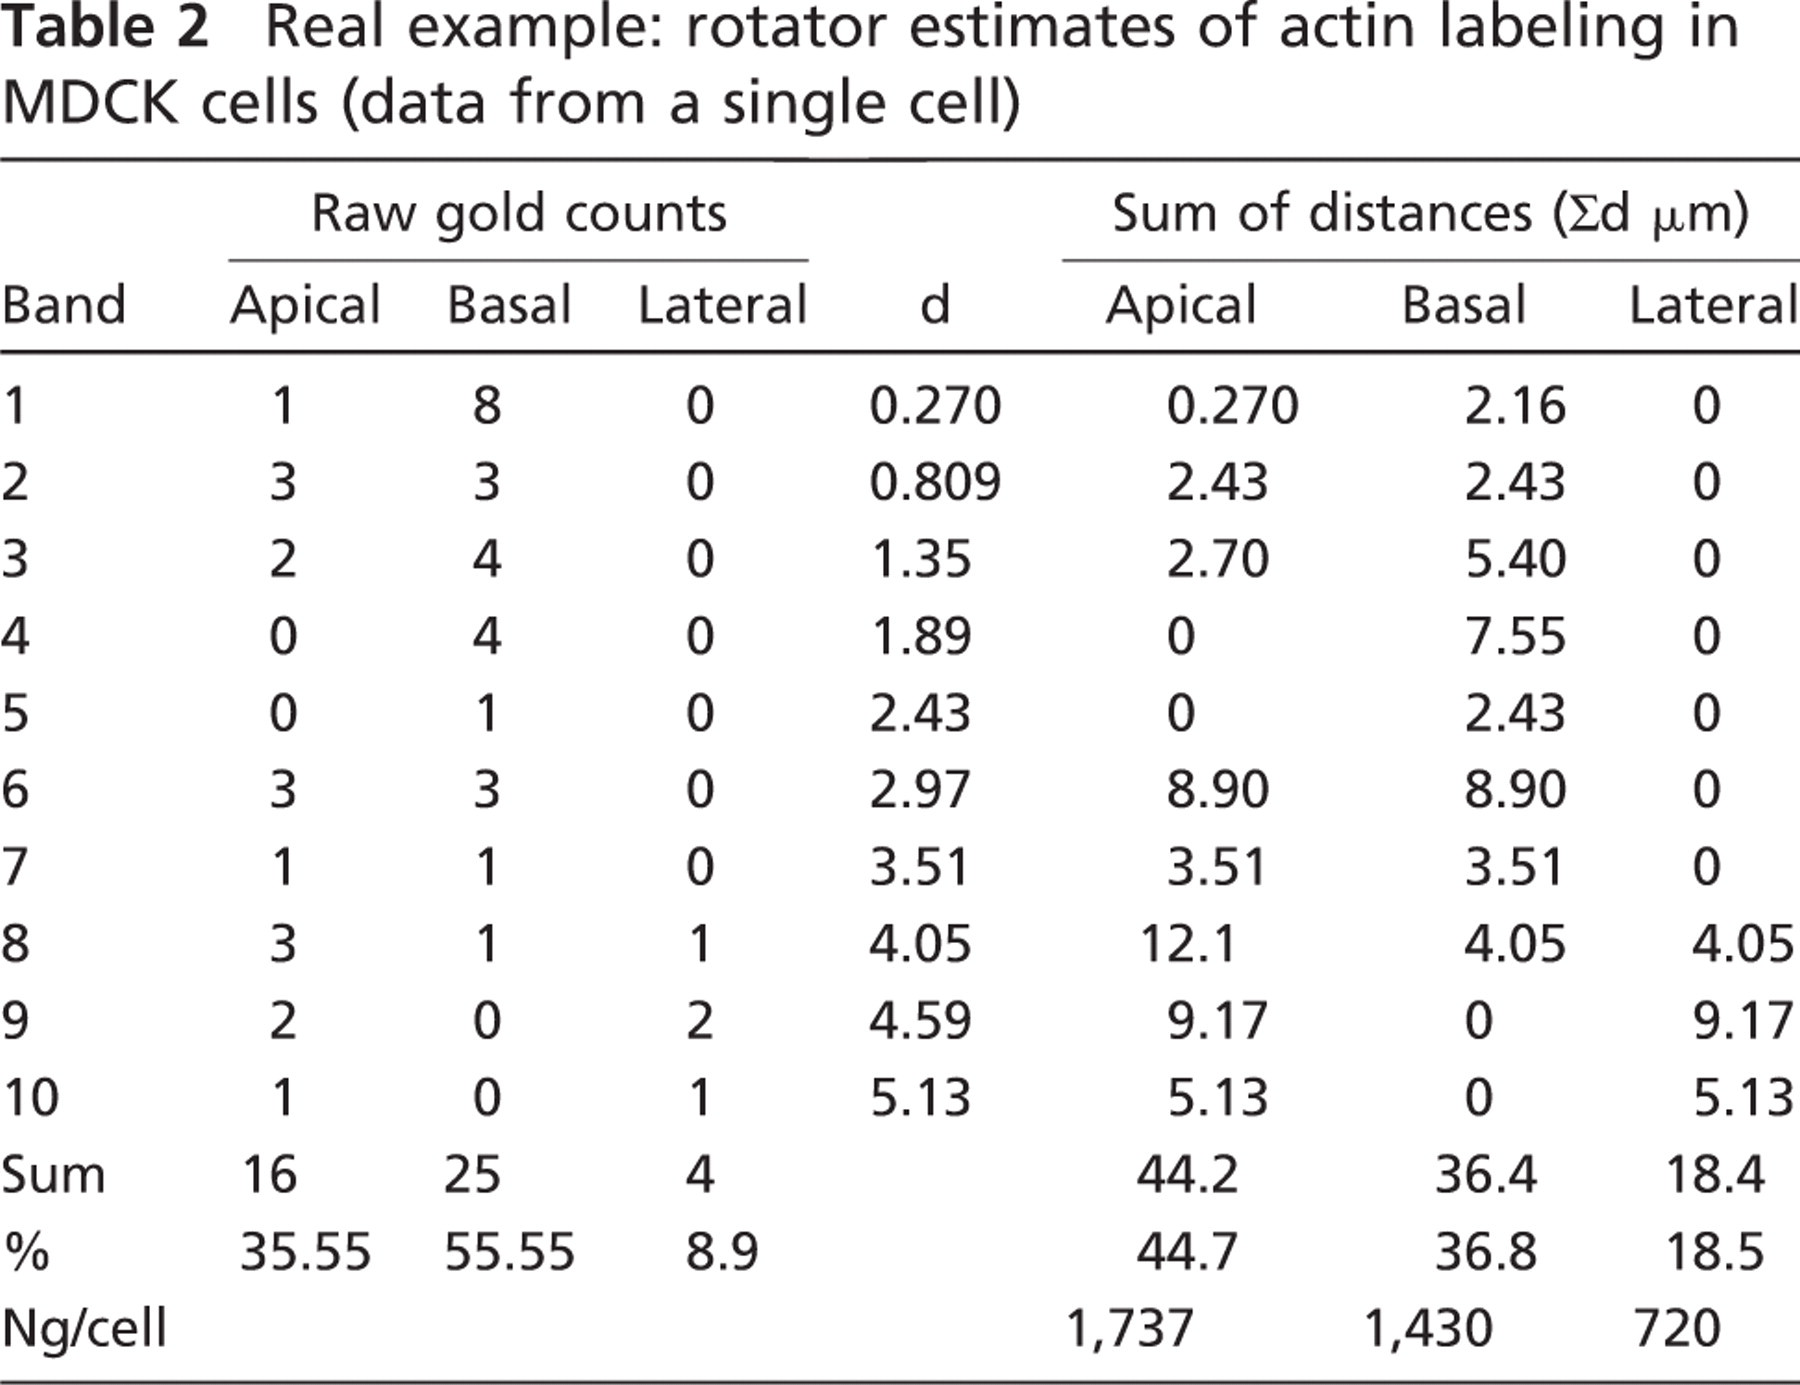
Summary data for all nine cells analyzed in this experiment are presented in Table 3. MDCK cells grown on polycarbonate filters were fixed, embedded, and sectioned vertically. Sections passing through central portions of nuclei were identified using the sampling scheme described in the text and shown in Figure 1. These sections were immunogold labeled and recorded at the lowest magnification that allowed gold and compartments of interest to be identified. As shown in Figure 3, an axis was placed at the midpoint of the nuclear profile, and approximately 12–15 equal-sized bands were superimposed on the image on each side of the midpoint. In this case, these measured 0.540 μm in width. The central points of each band are therefore located at d1 = 0.270 μm, d2 = 0.809 μm, d3 = 1.35 μm, etc. For each cell, the gold particles in each location of interest (apical, basal, and lateral plasma membrane) were counted for each band (apical is at the top in this micrograph). The estimate of the sum of distances of gold particles from the axis (Σd) for each band was calculated from number of gold counted (Ng) x d. The first band contains one gold counted over the apical membrane, and so Σd1 = 1 × 0.270 μm = 0.270, and the second band contains three golds, so Σd2 = 3 × 0.809 μm = 2.43. Note that golds on both sides of the axis are counted and summed. The sum for the apical compartment for this cell (Σdap,cell1) would be Σd1 + Σd2 + Σd3 + … Σdn = 44.2, which is a labeling index that can be used in calculations of labeling proportions. The total golds for the cell are calculated using a section thickness of 0.08 μm. Notice that there is a marked difference between the percentages of gold label over each compartment based on the raw counts (biased), compared to the percentages based on the rotator estimates (unbiased). In this case, the sums of distances for the individual bands contain spatial information and could be analyzed further, e.g., to test for potential gradients of actin labeling in the apical or basal plasma membrane domains.
On images of complete cell profiles assembled from overlapping fields, an axis was drawn in a vertical direction central to the nucleus profile (orthogonal to the culture dish). Then, for gold particles in the ER, Golgi, and plasma membrane, the distances of gold particles to the axis were measured and summed for each organelle. The data were then processed and interpreted as shown in Table 1. In this hypothetical example, labeling and cell number has been kept low for reasons of clarity, but in a real experiment, there would be much more. In experiment 1, the sums of d for each organelle (Σdorg) and the overall total (Σdtot) were calculated using apparent distances without correction for magnification. Each of these sums represents a labeling index, which can be used to estimate the proportion of labeling over the cell in 3D, given by Σdorg/Σdtot. For the ER in experiment 1, the proportion was 7.89/8.13 = 0.97. Thus, expressed as a percentage, there was an estimated 97% of the gold labeling associated with the ER in this cell. The estimate for the Golgi was 3%. Note that on the basis of gold counts, the apparent proportion was 80% and 20% over the ER and Golgi, respectively, which is not correct for the 3D estimates for this cell. This shows that in sections oriented along this axis, labeling proportions in 2D do not report on 3D quantities. The reason is that the ER is more dispersed and is distributed more peripherally so that the circles of rotation for ER elements are much larger than for the Golgi, and, therefore, each gold particle over the ER will represent a larger amount of label in 3D. Using the magnification 5000x, the real Σd would be apparent Σd(μm)/5000, and at the section thickness of 0.1 μm, the Σd would be multiplied by the factor π/0.1. So for ER in experiment 1, Ng/cell would be (78,900/5000) x π/0.1) = 496 golds per cell over the ER.
Notice that it is also possible to assess the changes from experiment to experiment over individual organelles. Thus, the number of gold particles over the ER decreases by (7.89–2.08)/7.89 = 0.74 or 74% from one experiment to the next, which is roughly reflected in the observable label, because the compartment has not changed its distribution. (If the ER had changed its distribution, then the rotator estimates would still be unbiased and the 2D counts would not!) This reduction corresponds to a change from 496 gold particles per cell to 131 over the ER (365 gold particles). In the case that the labeling efficiency (golds per antigen) for the ER under these conditions is known, which might be say 0.01, then these 365 gold particles would represent 36,500 molecules of viral protein per cell leaving the ER in the time between experiments. Such conclusions may help the interpretation of such experiments in which protein translocation occurs. For this system, therefore, the results show that during the time of release from the ER, substantial labeling has appeared at the plasma membrane, even though a substantial fraction of the total particles on the section appear to be in the Golgi. However, because of its central location, the particles over the Golgi represent only a minority of the total. The plasma membrane pool predominates because that compartment is a dispersed structure and is relatively distant from the axis of rotation.
Real example: rotator estimates of actin labeling in MDCK cells (summary of data from nine cells)
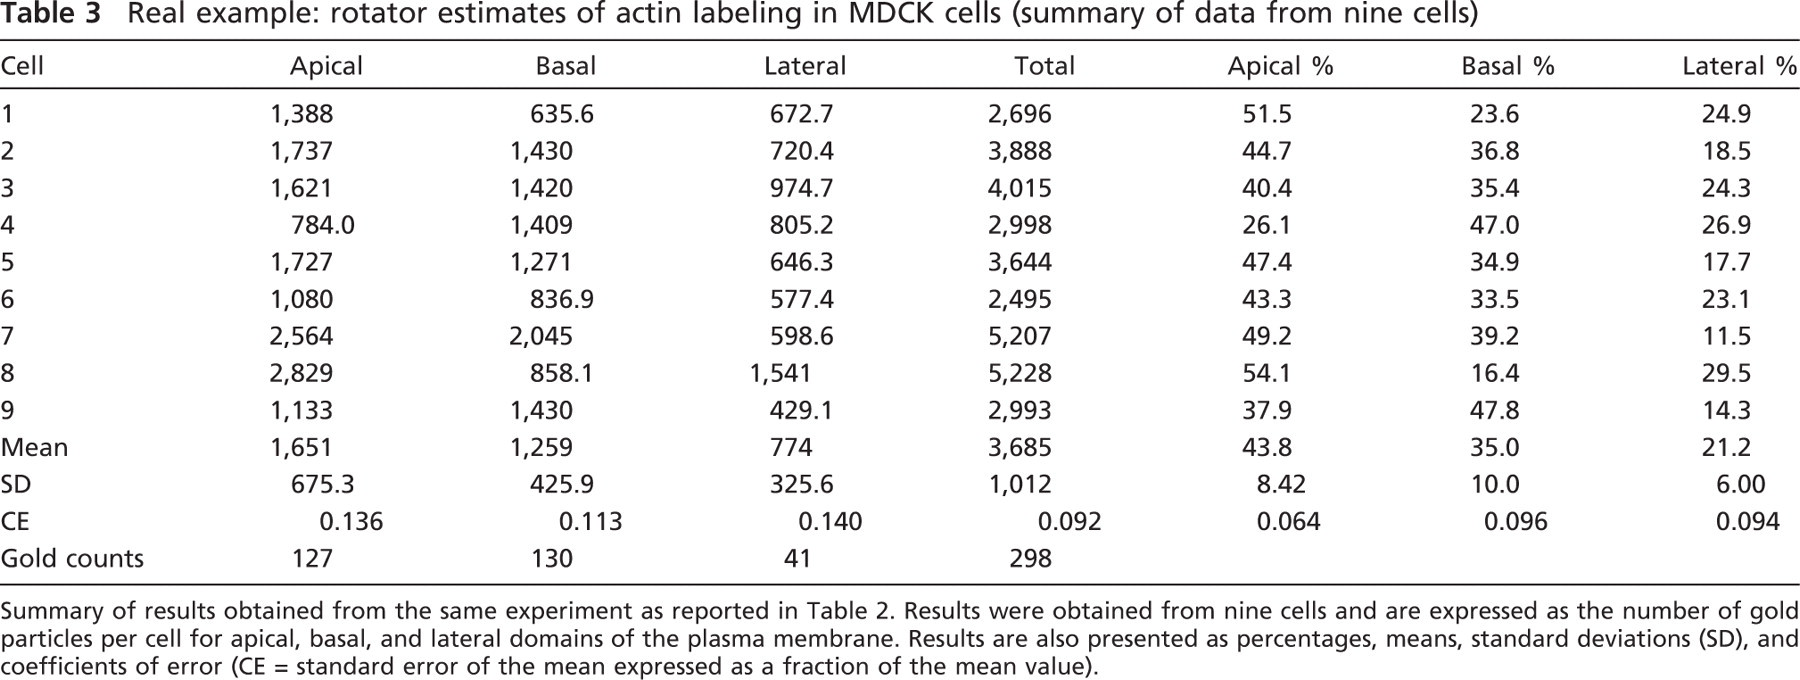
Summary of results obtained from the same experiment as reported in Table 2. Results were obtained from nine cells and are expressed as the number of gold particles per cell for apical, basal, and lateral domains of the plasma membrane. Results are also presented as percentages, means, standard deviations (SD), and coefficients of error (CE = standard error of the mean expressed as a fraction of the mean value).
This experimental system also illustrates additional possibilities for spatial mapping. For example, movement from the base to the apex of the cell could be detected if gold particles were categorized according to their distance from the cell base or from the center of the nucleus; or movement from the centrally located Golgi to the plasma membrane might also be detectable by mapping the distance of gold labeling in relationship to the point at which the axis crosses the most apical aspect of the nuclear envelope.
Real Example
Cells grown on a substratum can be sampled easily using vertical sectioning for rotator estimates. MDCK cells are polarized and display an apical domain exposed free to the culture medium, a lateral domain contacting adjacent cells, and a basal domain contacting the substratum (Figure 3). This example estimates the total cellular labeling for the cytoskeletal protein actin at each of these locations.
MDCK cells were cultured on polycarbonate filters and embedded using the PLT method in HM23. They were then sectioned at random locations, but in an orientation perpendicular to the culture dish. Adjacent 300-nm and 80-nm sections were taken at intervals of 1 μm, and cells were sampled with the semithin sections using the disector principle (as described above and in Figure 1). Nuclei profiles found in the sampling semithin section but not in the previous section were selected for examination. For each sampled cell, the successive semithin sections were then examined to identify the cell nucleus with the largest diameter. The adjacent thin section was then immunogold labeled for actin. Micrographs of selected cells (
In this example, the labeling density was such that all gold particle labeling could be counted easily. But what strategy might be employed if labeling were more intense? One solution would be to sample a known fraction of the gold particles unbiasedly. This can be done using a systematic array of quadrats, together representing a known fraction of the total area (f). By random placement of the array and applying unbiased counting rules to these quadrats (Gundersen 1977; Lucocq 1994) gold particles would be selected unbiasedly. They could be analyzed by direct measurement of d or by the banding method illustrated in Figure 3. It would be prudent to make the quadrats small relative to the cell and therefore at high density, so as to preserve the resolution of any spatial information. The proportion of golds over different organelles could then be computed directly from equation 4, and if necessary, the total golds for each compartment computed for each d or band by multiplying the counts by 1/f.
Labeling Specificity, Labeling Penetration, Section-compression, and Shrinkage
The method described here assesses the quantity and relative proportions of labeling signal in the rotator and does not address questions of specificity. This issue cannot be answered by mapping of gold labeling per se and needs to be addressed with the use of appropriate control conditions (Lucocq 2008). One of the best controls is experimental or genetic manipulation that leads to a reduction in expression of the protein/component of interest. Diminution of the signal then signifies its specificity. Signals that are generated by such controls could be compared with experimental values using the present methods. For example, after knockdown of expression of a specific protein, rotator estimates expressed as total gold signal per cell or as a mean labeling index could be compared with the experimental value.
Penetration of labeling into the section occurs to a variable degree depending on the technique and the compartments of interest (see Lucocq 1994 for discussion). In methacrylate and epoxy resin sections, labeling is essentially limited to the section surface, whereas in thawed cryosections, labeling penetration depends on the matrix density of the cellular compartment in question. The penetration can have an impact on how the rotator estimates of labeling will vary when the section thickness is changed. If labeling is located only at the section surface, then as the section thickness increases, the number of gold particles per cell will decrease because the total signal in each section will remain the same. However, if the labeling is located throughout the section, then the number of gold particles in each section will increase in proportion to the section thickness, and the number of golds per cell in 3D will remain constant. Therefore, even though full-thickness penetration of gold particles is likely to be rare, it may be advisable to perform experiments at constant nominal section thickness irrespective of whether the final readout used is gold particles per cell, mean labeling index, or labeling proportions.
Finally, shrinkage and section compression are important effects generated during section preparation (Lucocq 1994). Both of these factors will tend to reduce the overall apparent size of cells and their profiles, and will tend to increase the concentration of antigens and therefore increase the labeling density. However, unless the antigens become so crowded that the labeling efficiency starts to drop, the total number of gold particles is likely to remain constant. Therefore, rotator estimates are likely to be robust to such changes because they are sensitive to the total amount of gold labeling and not its concentration. Consequently, this is an advantage over methods that use local density/ concentration of gold label as their readouts.
Discussion
The application of the rotator to gold labeling estimates has a number of advantages. The first is that it allows individual cells with a particular characteristic to be selected for analysis with a degree of surety. Each selected cell is sectioned through its central portion along a defined axis, thereby increasing the probability that characteristic structures will be visible. By comparison, random sections (even if they are orientated along the cell axes) will inevitably slice some cells in regions where identification of cell type or its component structures will be harder or where spatial relationships between labeled cell components are not as clear as in centrally located oriented sections. The method described here now allows the investigator to perform targeted studies on cells that may form the minority of a total cell population, as is the case in many tissues. Cells can be selected (unbiasedly) using light microscopy sections first and the final estimates provided by immuno-EM analysis of selected and immunogold-labeled sections.
A second advantage of this “golden” rotator is the preservation of spatial information, which can be organized according to any convenient spatial marker(s). Thus, if the axis of rotation is biologically significant, as in a polarized cell, the axis itself could be used as a reference. In this case, labeling quantities can be mapped according to distance along the axis from the cell base or from a central cell structure, or according to the distance from the axis to the cell periphery in a horizontal direction. Preserving spatial information could be very useful in strongly polarized cells such as neurons, in motile or epithelial cells, or in cells where transport of organelles from one region of the cell to another occurs. A further advantage is that internal organization of organelles is now accessible, and gradients of molecules in widespread organelles such as nucleus, ER and Golgi, or plasma membrane can now be studied without recourse to serial section analysis.
One apparent disadvantage of these rotator estimates may be the amount of effort needed to obtain them. This is in part due to the sampling procedure, which would normally require a stack of sections to be made for disector sampling and selection of “central” sections. However, compared with serial sectioning, this is a rather minor investment in effort to obtain spatial information. Furthermore the work load can be significantly reduced by judicious use of light microscopy at the cell sampling stage, thereby restricting the EM analysis to a limited number of gold-labeled sections. Importantly, our study suggests that once cells have been identified, it may be possible to get reasonably precise and unbiased estimates of spatial distributions with a rather modest amount of work, say from 10–20 cells and a total count of 200–300 particles. Our experience suggests that like most stereological approaches, the specimen preparation for these rotator estimates forms a major portion of the total effort, with the measurement/ estimations comprising a relatively minor fraction of the total work load.
Finally, there are a number of related strategies that have not been explored in the present report. One of these would be to combine gold particle estimates with volume estimates to assess the 3D density of gold labeling inside organelles or cell space. Another is to use the related spatial estimator, the nucleator (Gundersen 1988), to map the spatial arrangement of gold particles in relation to a central point in the cell. This could be especially useful in structures organized around the centrosome, such as the Golgi, elements of the endosome system, or secretory vesicles. Further work will now be required to refine and extend the usefulness of the rotator and related stereological approaches in gold-labeling studies.
Footnotes
Acknowledgements
C.G.B. was a recipient of a Capacity-building Studentship from the Medical Research Council.
We thank Alan Prescott for advice and John James for help with the electron microscopy.