
Abstract
Particulate gold labeling on ultrathin sections is in widespread use for antigen localization at the EM level. To extend the usefulness of gold labeling technology, we are evaluating different methods for sampling and estimating quantities of gold labeling. Here we present a simple, rapid, and unbiased method for assessing the relative pool sizes of immunogold labeling distributed over different cell compartments. The method uses a sampling approach developed for stereology in which a regular array of microscopic fields or linear scans is positioned randomly on labeled sections. From these readouts, gold particles are counted and assigned to identifiable cell structures to construct a gold labeling frequency distribution of those labeled compartments. Here we use ultrathin cryosections labeled for a range of different proteins and for a signaling lipid. We show by scanning labeled sections at the electron microscope that counting 100–200 particles on each of two grids is sufficient to obtain a reproducible and rapid assessment of the pattern of labeling proportions over 10–16 compartments. If more precise estimates of labeling proportions over individual compartments are required (e.g., to achieve coefficients of error of 10–20%), then 100–200 particles need to be counted over each compartment of interest.
O
Existing methods for quantifying gold particles on ultrathin sections prepared for transmission EM have focused on estimating a labeling density over 2D profiles (Lucocq et al. 1986,1989,2001; Griffiths 1993; Lucocq 1992,1994; Mayhew et al. 2003). This is variably expressed as the number of gold particles per length of membrane trace, per length of cytoskeletal filament/tubule, or per sectional area of organelle profile. In addition, with knowledge of section thickness and cell or organelle volume, these 2D readouts can be converted into 3D densities of gold particles per surface or volume of a subcellular compartment or structure (Lucocq 1992,1994; Griffiths and Hoppeler 1986; Griffiths 1993). The labeling densities are calculated using counts of gold particles combined with estimates of organelle/membrane 2D profile or 3D size. Then, with the caveat that the efficiency of labeling (gold particles per antigen) can vary among compartments (see Griffiths 1993 for discussion), the labeling concentration may give an impression of the local antigen concentration.
Although labeling densities report on antigen density, it may also be of interest to know the pool sizes of gold labeling (and therefore antigen) in different cell compartments. This is especially important when labeling has a complex distribution through multiple compartments or when the distribution of the antigen varies according to changes in cell physiology. To obtain this readout, the size estimations of intracellular compartments in 2D or 3D are not needed, and unbiased representative samples of gold particle numbers displayed on the cryosection can be used directly. Importantly, if the ultrathin sections are positioned randomly within the samples, the 2D counts will be representative of the counts over the 3D space as well, and the pattern of labeling (labeling distribution) then provides an estimate of which compartments hold major pools of antigen and which ones do not (Lucocq 1994,2003; Griffiths 1993).
Recently we have embarked on a strategy for identifying (and developing) efficient and sensitive ways to describe antigen labeling distributions and concentrations in cell structures/compartments and to test for preferential labeling (Griffiths et al. 2001; Mayhew et al. 2002,2003; see Ochs et al. 2002, Fujii et al. 2003, and Mironov et al. 2003 for applications). Importantly, this effort has been assisted by adaptation of existing quantitative stereological methods in which random sampling rules, combined with design-based stereological estimators, are applied to avoid biased selection of specimens and data and to provide precise and efficient estimates of relevant structural quantities (Cruz-Orive and Weibel 1981,1990; Mayhew 1992; Lucocq 1994; Howard and Reed 1998). We consider the formalization of these methods to be important because, although the role of random sampling both for quantitating gold labeling and in the wider scheme of the sampling hierarchy may be widely recognized, there has been little work on examining which are the most efficient procedures for obtaining quantitative results.
Here we focus on a rapid and simple method for evaluating antigen labeling distributions that can be employed at both the early and the late stages of research studies. The method takes advantage of the fundamental “cornerstone” of all design-based stereology, i.e., unbiased selection of sampling items by random sampling (Gundersen and Jensen 1987; Mayhew 1991; Gundersen et al. 1999). In this method, a systematic random array of micrographs or scans is used to count gold particles and assign them to various compartments. The systematic placement makes data collection rapid and therefore improves efficiency.
The procedure yields an unbiased quantitative estimate of the distribution pattern of labeling within a cell or tissue and is illustrated using antigens/moieties that are likely to have complex distributions. These include (a) ezrin, the actin-binding protein that probably forms significant pools in the cytosol and associates with actin at cell membranes and intracellular membrane structures (Bretscher et al. 2000,2002; Defacque et al. 2000,2002), (b) LAMP1, the lysosomal membrane glycoprotein that is distributed on membranes of the endolysosome system (Rouille et al. 2000), (c) the lipid, phosphatidylinositol 4,5-bis-phosphate, which we have recently demonstrated in plasma membrane and a variety of intracellular membranes using novel methodology (Watt et al. 2002) and, finally, (d) an array of phosphoinositol and phosphoinositide (lipid) kinases whose distribution has thus far not been studied in depth by immunoEM (Vanhaesebroeck et al. 2001). The detailed distribution and related biology of these kinases will be published and discussed elsewhere. Here, gold labeling obtained with antibodies against these proteins is used simply to illustrate the generality of the method.
We show that to obtain a reproducible pattern of labeling over a range of (10–16) intracellular compartments, a count of 100–200 gold particles can suffice. If more accurate and reproducible estimates of the proportion of gold particles on a single compartment are required, then 100–200 particles should be counted on that single compartment, a result consistent with the sample size requirements for other stereological estimators of size/number (Gundersen and Jensen 1987; Mayhew 1990; Lucocq 1993).
Materials and Methods
Rationale of the Counting Method
Typically, processing for immunoelectron microscopy starts with animals, plants, organs, or cell cultures each of which may have been treated under different experimental conditions. After fixation, a number of blocks or pellets are made from which a limited number of ultrathin sections are cut and mounted on EM support grids and labeled with colloidal gold reagents. Finally, very small areas of these ultrathin sections are examined or photographed in the transmission electron microscope (TEM) for gold counting. Significantly, the small areas used for counting represent an extremely small fraction of all the possible areas that could be examined on that section, and each of the ultrathin sections used for the analysis also comprises only one of many that could be selected. Furthermore, the blocks or animals are each likely to represent a selection or sample of a larger “population” of items. Therefore, it would be impractical to examine the entire surface of each possible section through all of the blocks from each animal or culture. Sampling is therefore a necessity. To ensure that a sample is fair (unbiased), the sampling method must ensure that every item has exactly the same chance of being chosen. The key to achieving this is random selection of culture dishes, tissue blocks, cell pellets, sections, and fields. Although random sampling is adequate at most of these levels (e.g., animals, cell pellets, or blocks) it is important to consider some important refinements to the approach. First, at the level of sectioning, it may also be important to cut sections not only at a random position but also at a random orientation. This is particularly crucial because the appearance of membrane traces on ultrathin sections and the labeling of membrane antigens are sensitive to orientation of the sections (see Discussion). Second, at the level of examining or photographing the labeled ultrathin section, it may be more appropriate to use a modification to random sampling termed systematic random sampling. This tends to be more efficient than simple random sampling. In systematic random sampling, the position of the first item is selected at random but a pre-set (systematic) pattern then determines the positions of all other items in the sample (for some practical examples see Gundersen and Jensen 1987; Mayhew 1990,1991). This type of sampling is well suited to counting using TEM because regular arrays of micrographs or regularly spaced scans of the ultrathin section are convenient and easy to arrange (see below). It is systematic random sampling that is used in this report to sample gold particles in an unbiased and efficient manner.
When specimen support grids are used, the spaces (windows) between grid bars can be used to fix the systematic random pattern. The encounters between grid bars and the specimen section are randomized during the process of mounting the section on the grid and by the choice of grid corner. From such a random starting point there are alternative ways of arranging a systematic array in which to do the counting. One way is to randomly select a grid square that contains a labeled section and, starting at the corner of this square (random position), micrographs are taken at intervals across the grid square to form a regular array (Weibel 1979). The spacing is determined by applying equal rotations of the manual translation controls of the microscope or, when motorized controls are available, by programming systematically spaced locations. Another approach used in this report is implemented as follows. Starting at a grid square corner, the whole of the sectioned pellet/block within that grid square is scanned continuously in equally spaced parallel sweeps across the specimen (Figure 1). Random selection ensures that scanning is done irrespective of the amount of cell or the intensity of gold labeling, for example. This strategy allows counting to be performed directly at the TEM. Again, the spacing between sweeps is determined by the rotations of the manual translation controls or by programming the motorized stage control if present.
Some cautionary notes on the (systematic) random sampling process are worth making. First, provided a selected field or scan shows the cell type or structure of interest, it must be analyzed regardless of its content. For example, the field must not be moved to ensure that the whole cell profile becomes contained within the field. Nor should a given field be restricted to cell profiles containing, e.g., a nuclear profile or Golgi complex. These would constitute component-biased samples (Mayhew 1979). A second point to note is that, when micrographs of the sampled fields are recorded, it is more efficient to select the minimum magnification at which gold particles and cell compartments can be clearly identified (Lucocq 1994). By definition, going higher than this magnification will not improve identification and, in practice, it will actually be less efficient because higher magnifications provide smaller sample areas and, in effect, merely amplify field-to-field variation (Cruz-Orive and Weibel 1981). Once the appropriate magnification has been selected, gold particles are counted in each field and assigned to different preselected compartment categories. Compartment categories are often determined partly by experience and expectation, but they may also be chosen arbitrarily by the investigator to suit the needs of a particular study (Mayhew et al. 2002, 2003). The gold counts can now be used to construct a bar chart of the observed frequency of labeling of different compartments (Figure 1). The approach we suggest is not only the simplest conceivable method to quantify immunogold labeling but it is also the most rapid.
Applications
Cells and Labeling. J774A1 murine macrophages (purchased from ATCC; Rockville, MD) were grown on 10-cm dishes by cultivating in DMEM + 10% fetal calf serum + glutamine + penicillin/streptomycin in a 37C incubator with a 5% CO2 atmosphere. Cells were pre-labeled with three different markers to identify early endocytic organelles (5 min, 5-nm protein A–gold), late endosomes, and lysosomes (16-nm gold for 1 hr followed by an overnight chase) and phagosomes [labeled with latex beads for 1 hr followed by a 1-hr chase (Desjardins et al. 1994; Jahraus et al. 1998)].
The cells prepared as thin cryosections according to Tokuyasu (Tokuyasu 1973,1978; Griffiths 1993) were labeled with antibodies directed against a panel of lipid kinases (see below), LAMP1, and ezrin, followed by protein A-gold. For present purposes, five antibodies against lipid kinases are reported and defined as follows: anti-p-110-α PI3kinase (Kin 2), an anti-PI4kinase-α/AE2448 (Kin 6), an anti-hVPS34 PI3kinase (Kin 10) (Murray et al. 2002), and AE245A, an antibody to PI4kinase-β (Kin 5) (Backer 2000). Labeling for the lipid phosphatidylinositol 4,5-bisphosphate was performed as described in Watt et al. (2002).
Sampling. To ensure random sampling of sections and cells, all fragments from a given pellet were allowed to settle haphazardly (Stringer et al. 1982) and fixed to cryoholders at random orientations. One or two cubes chosen at random (lottery method) were cut to provide two or three grids for each antibody dilution. Each grid carried several sections. Sections were viewed by TEM using a Zeiss EM 10 at 80 kV or a JEOL 1200EX at a primary magnification of 20,000, and a grid corner of a randomly selected grid square containing well-contrasted sections was selected. Systematic random sampling of TEM fields was achieved by scanning the pellet profile in parallel scans separated by equal spacing conferred by equal turns of the Y-axis translation control. The procedure is illustrated in Figure 1.
Roughly 100–200 gold particles were counted per grid square and each particle was assigned to a particular cell compartment (to estimate the number of scans needed for gold counts in this range, a single pilot scan across the pellet was made in the first instance). The field was only moved off-track (or to a higher magnification) to aid identification of the compartment structure but was moved back onto the scan track (and the starting magnification) once this had been done. A range of compartments was identified, including plasma membrane, early endosomes, late endosomes, multivesicular endosomes, early endosome-like structures without 5-nm gold and late endosome-like structures without 16-nm gold, phagosomes, endoplasmic reticulum, nuclear envelope (both inner and outer membranes), clearly recognizable Golgi stacks and vesicles, outer mitochondrial membrane and matrix (including the inner mitochondrial membrane), nuclear matrix, cytoplasm, and unidentified membranes (see figure legends for details).
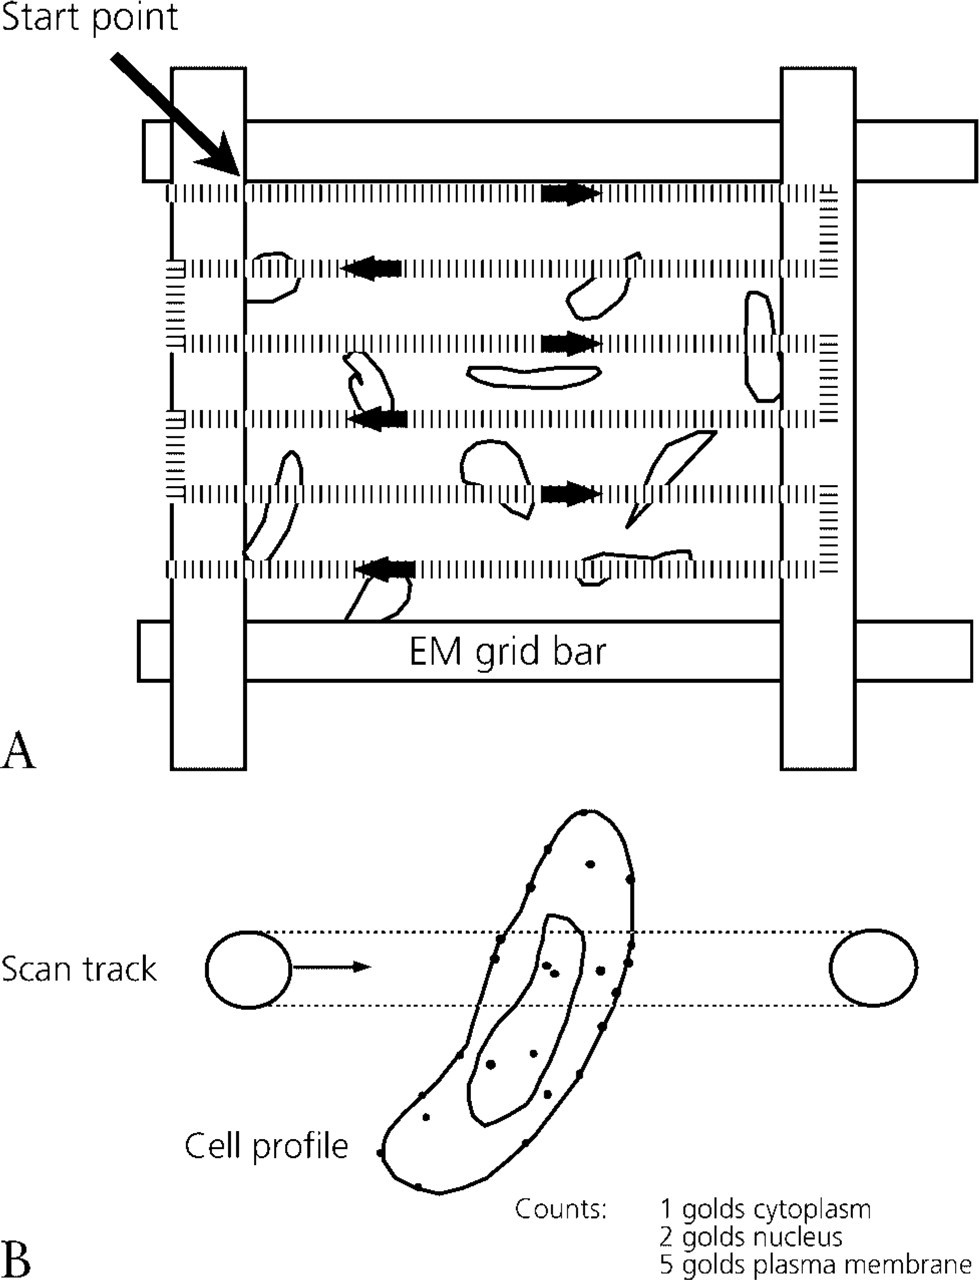
Rapid scanning method for counting gold particles over intracellular compartments. (
Statistical Analyses
Observed gold counts were used to construct numerical and percentage frequency distributions. These distributions (single or pooled) were used to test for correlations between the distributions of gold counts on individual grids of the same experiment or on grids of different experiments (Siegel 1956). To compare labeling distributions we used (a) the Pearson correlation coefficient (r), which describes the degree to which proportions of gold label agree from one count to the next, (b) the rank-based Spearman correlation coefficient (rs), which assesses the degree to which the order or rank of compartments, with respect to the labeling proportion they hold, is reproduced between groups (this non-parametric statistic does not rely on restrictions and assumptions needed for interpreting the Pearson r), and (c) the Kendall rank coefficient of concordance, which compares the agreement between ranks between more than two distribution patterns. Each of these coefficients gives a value with a maximum value of +1 and is relatively insensitive to variation in the total number of gold particles. The procedures for analyzing two labeling distributions to obtain Pearson and Spearman coefficients are illustrated in Tables 1 and 2. Notes on the application of Kendall rank coefficient of concordance are given in Siegel (1956).
Example of calculation of Pearson correlation coefficienta
Example of calculation of Spearman correlation coefficienta
Results
The main goal of this work was to test the idea that a count of 100–200 gold particles is sufficient to detect reproducible patterns in the distribution of gold particle labeling over a range of different cell structures present in immunolabeled sections. We used thawed ultrathin cryosections prepared according to Tokuyasu and selected concentrations of antibody that produced heterogeneous labeling patterns over cell structures and compartments. Higher concentrations produced more intense and more homogeneous labeling, probably due to nonspecific interactions of the labeling system with the sections. Patterns of labeling were said to be reproducible when the patterns displayed a parametric or non-parametric correlation coefficient in excess of 0.8.
We then decided which compartments to include in the analysis. LAMP1 is thought to reside predominantly in membranes of the endolysosomal system. Ezrin is a cytoplasmic protein that, when activated, binds to membranes (from the literature mostly the plasma membrane), where it is involved in actin binding and/or assembly (Bretscher et al. 2000,2002). This protein is involved in de novo actin assembly on phagosomes and, probably, also on endosomes (Defacque et al. 2000,2002; unpublished data). The phosphoinositide lipid phosphatidylinositol 4,5-bisphosphate (PI4,5P2) has been localized to a range of intracellular membranes, plasma membrane, and nucleus using the PH domain of PLCdelta1 tagged with GST as described elsewhere (Watt et al. 2002). The phosphoinositide kinases have not been localized at the EM level, but immunofluorescence data suggest that they are predominantly cytoplasmic but can be targeted or recruited to act in intracellular membranes (Vanhaesebroeck et al. 2001).
On the basis of these data, we examined between 10 and 16 compartments for each antigen and lipid, including compartments known to contain the antigen as well as some that were expected to lack these proteins. In all cases, we included elements of endocytic and secretory pathways, mitochondria, nucleus, and cytoplasm and in some cases phagosomes (LAMP1, ezrin, and lipid kinases; see figure legends).
Reproducible Patterns of Labeling with 100–200 Gold Particles
To estimate the distribution of gold particles over compartments, we selected portions of the whole cell pellet profile and, from a random start point, scanned systematically spaced strips across the sample, assigning gold particles to appropriate compartments (see Materials and Methods and Figure 1 for details).
Examples of distributions of ezrin and PI4,5P2 are illustrated in Figures 2 and 3 and statistical results are presented in Table 3. Ezrin labeling was first evaluated by counting 100 particles on each of four grids and 200 particles over three grids. Qualitatively, there appears to be a similar pattern between the distributions at 100 particles but results appear to be more reproducible when 200 particles are counted. This is borne out by the correlation coefficients (see Table 3). There is also a greater concordance between individual grids when 200 particles are counted.
Approximately 200 particles were used to evaluate the distribution of PLCdelta1 labeling for PI4,5P2, which qualitatively appears quite variable (Figure 3). Much of the variability appeared to be due to variable amounts of extraction of lipid (and therefore labeling), especially at the plasma membrane (see Watt et al. 2002). However, there was a good correlation between individual grids within each of two experiments and between pairs of grids of independent experiments. There was also good concordance (Kendall coefficient W near to 1) between the ranking orders in each of the two experiments or when all six grids from the two experiments were considered together. Quantitation confirmed that the variation between grids occurred at the plasma membrane. When compartments were ranked in order of labeling signal, this ranking was remarkably consistent over all grids (see Figure 3).
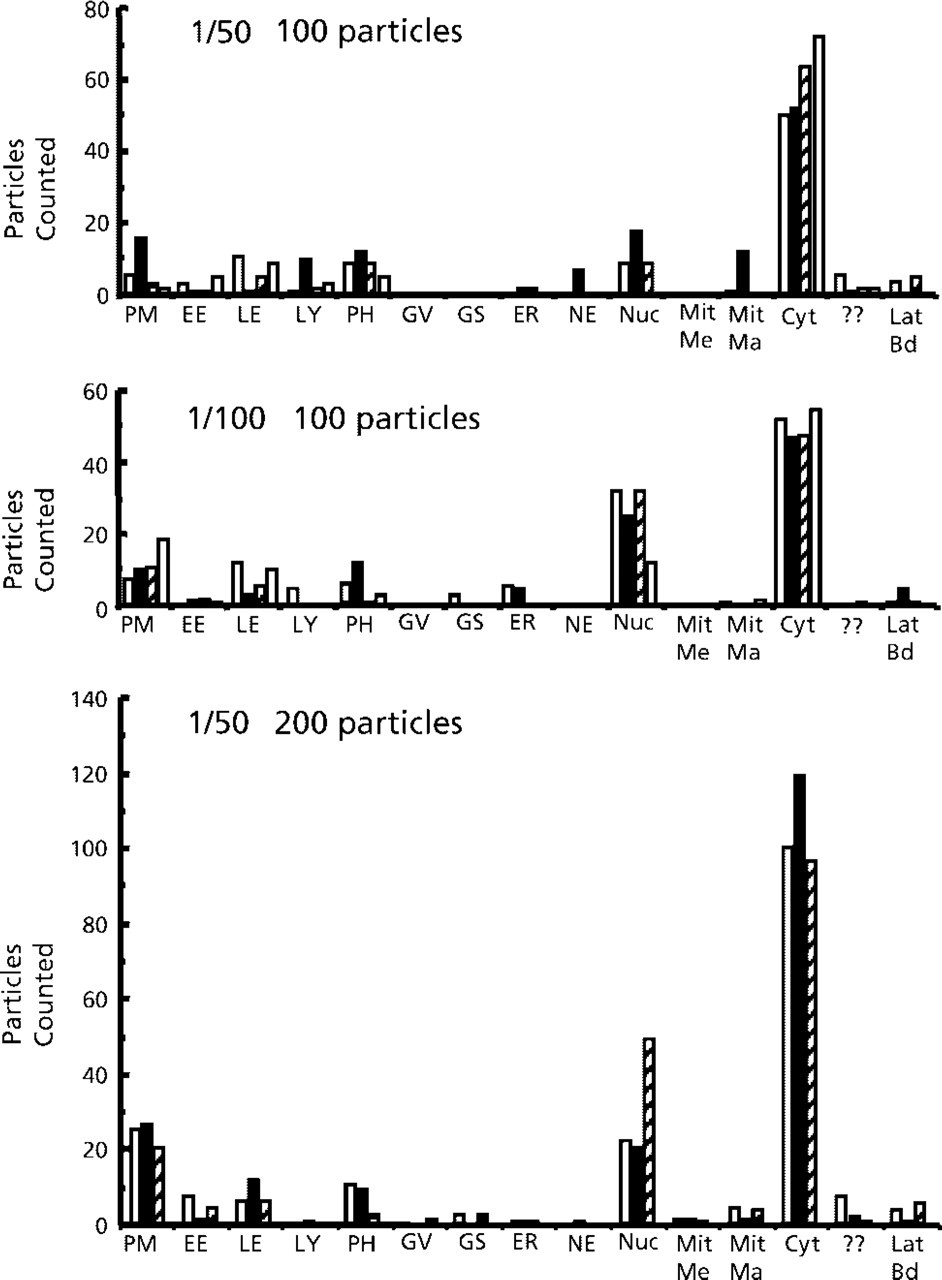
Patterns of label for the actin-binding protein ezrin. Proportions of labeling over cell compartments labeled using antibodies against ezrin at the stated dilutions were assessed as described in Materials and Methods. In each experiment, 100 gold particles per grid (total four grids) or 200 particles per grid (total three grids) were counted. Total counts are presented and abbreviations are as follows. PM, plasma membrane; EE, early endosome; LE, late endosome; LY, lysosome; PH, phagosome; GV, Golgi vesicle; GS, Golgi stack; ER, endoplasmic reticulum; NE, nuclear envelope; Nuc, nucleoplasm; Mit Me, mitochondrial membrane; Mit Ma, mitochondrial matrix; Cyt, cytosol; ??, unidentified membrane structures; Lat Bd, latex beads.
These observations were largely confirmed using 100 particle counts for various lipid kinases. The emerging trend was a very good correlation between distributions obtained from different blocks when 100 particles on each of two grids were counted. Increasing the total number of particles counted from 100 to 200 and spreading observations over two grids greatly increases the reproducibility of the distributions obtained. We also found interesting effects of dilution on the results. When the anti-p110α type I PI3kinase catalytic subunit (Kin 2) was labeled with dilutions of 1:100, 1:250, and 1:500, the distributions of labeling at 1:250 and 1:500 dilutions were virtually identical (r = 1) but the 1:100 dilution was slightly less similar to either of these (r = 0.983). On dilution of the antibody, certain compartments increased and others decreased their share of labeling. The latter included mitochondria, which were not expected to contain this protein. There was considerable variation in the LAMP1 labeling pattern when 100 particles per grid were sampled (Table 3). Qualitative observations suggested that the variation was due to the presence of heavily labeled but relatively infrequently sectioned structures such as lysosomes and phagosomes. Interestingly, decreasing the number of categories from 16 to 11 by fusing categories did not increase the correlation between grids. However, pooling the results of the two grids from the same experiment produced a marked improvement in the correlation between experiments. Therefore, it is likely that the variation in the presence of the heavily labeled organelle profiles in the section was related to their relative rarity, and that taking more sections increases the chances that rare structures are sectioned and included in the sample. We conclude that, if most of the labeling is inhomogeneously distributed over rare structures, it may be difficult to obtain reliable estimates of the labeling distribution using a single count of only 100 particles from one grid. Increasing the number of grids examined increases the reproducibility of the distribution patterns from one experiment to the next.
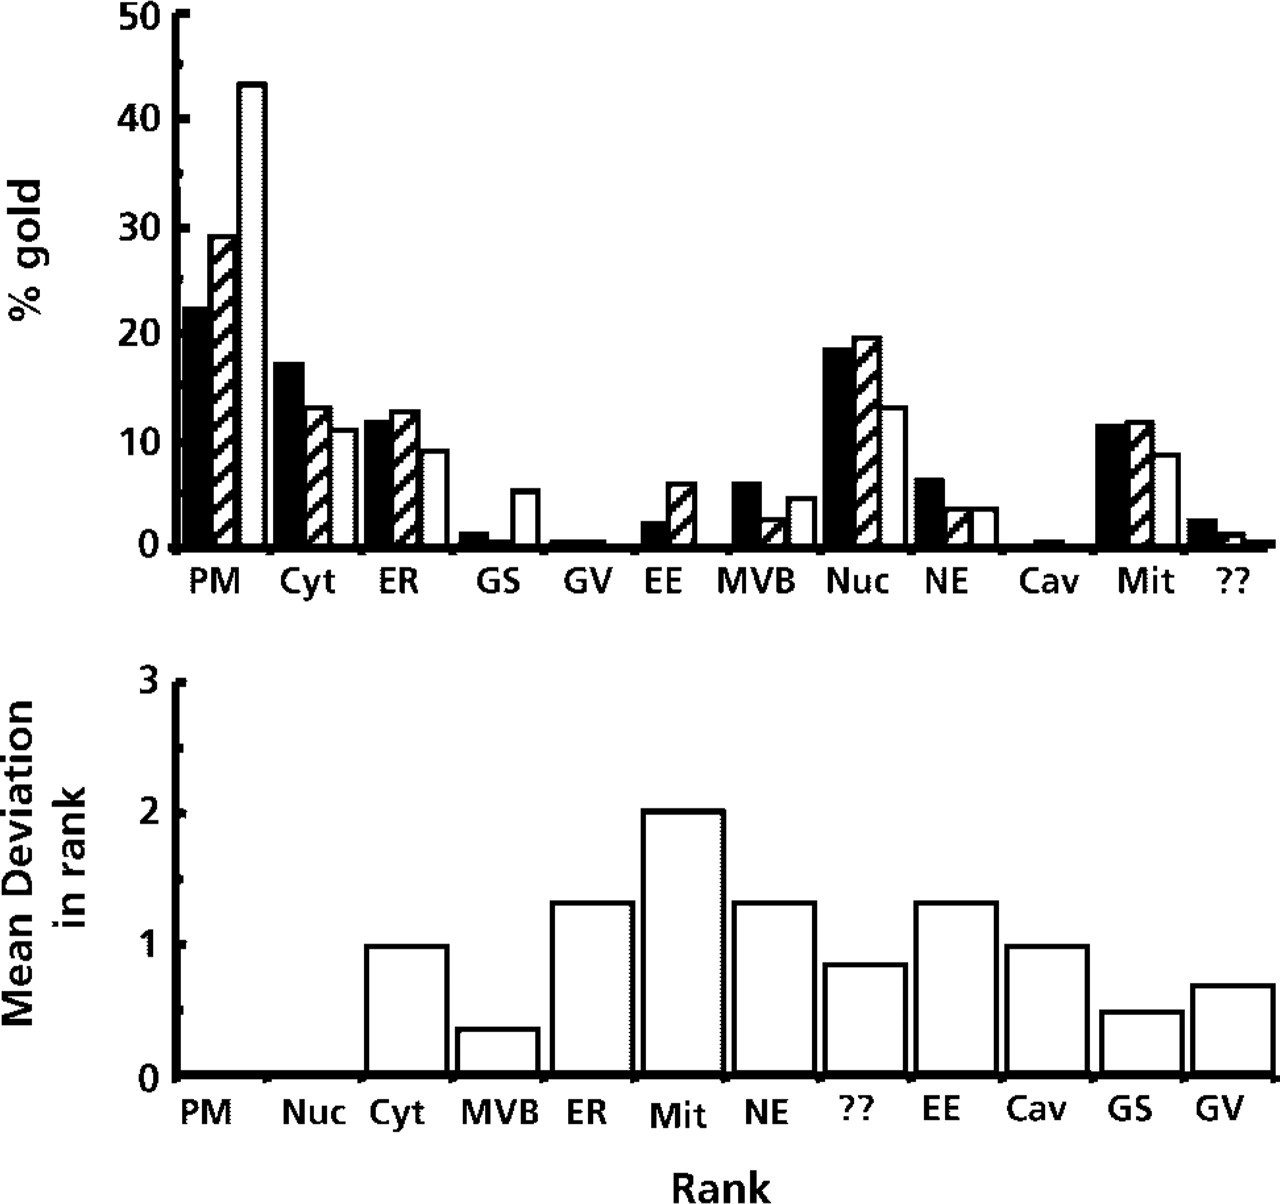
Patterns of label for the lipid PI4,5P2. PLCdelta1 labeling was from three grids of the same experiment (200 gold particles per grid counted according to the scanning procedure described in Materials and Methods). The overall patterns are similar, although certain compartments have higher variability than others (e.g., plasma membrane). Despite the variability in proportion of label, the overall rank order of labeling proportions (lower part of figure; data from six grids, three in each of two experiments) is reasonably well preserved from grid to grid. PM, plasma membrane; Cyt, cytosol; GS, Golgi stack; GV, Golgi vesicle; EE, early endosome; MVB, multivesicular body; NE, nuclear envelope; Nuc, nucleoplasm; Mit Me, mitochondrial membrane; Mit Ma, mitochondrial matrix; ??, unidentified structures.
Comparison of labeling distributions using correlation and concordance coefficientsa
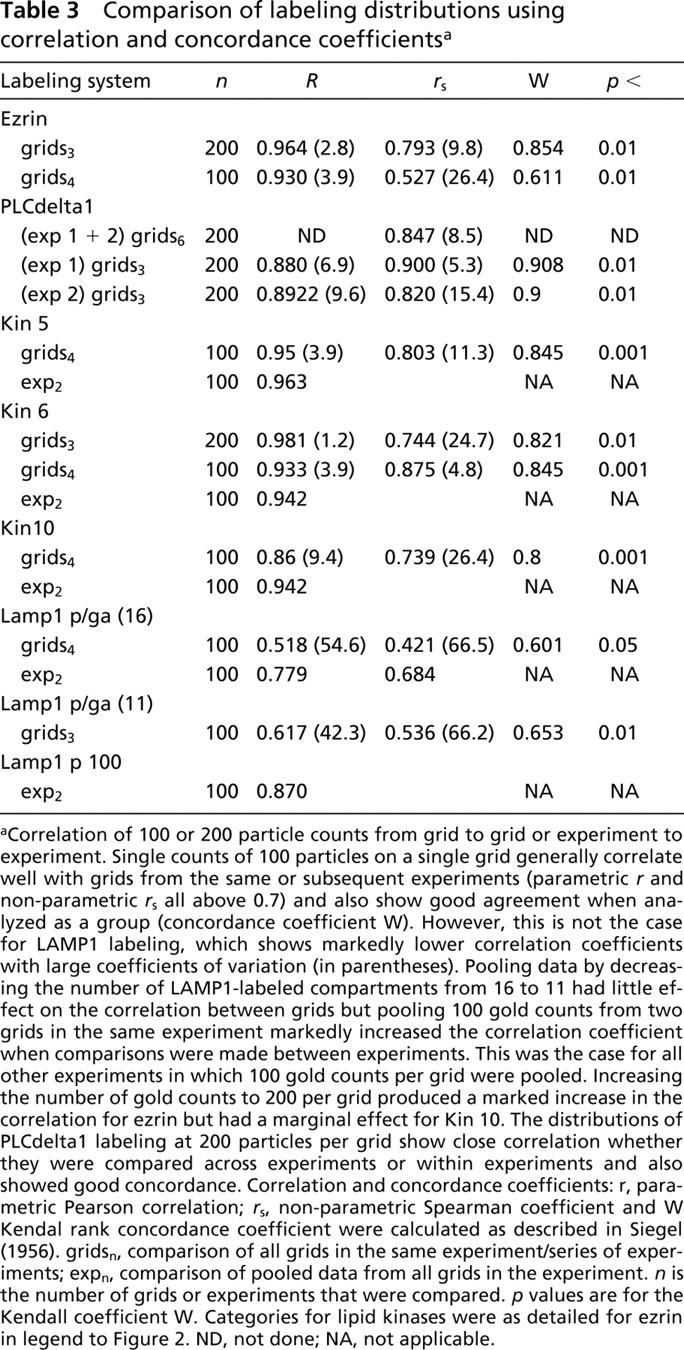
Correlation of 100 or 200 particle counts from grid to grid or experiment to experiment. Single counts of 100 particles on a single grid generally correlate well with grids from the same or subsequent experiments (parametric r and non-parametric r s all above 0.7) and also show good agreement when analyzed as a group (concordance coefficient W). However, this is not the case for LAMP1 labeling, which shows markedly lower correlation coefficients with large coefficients of variation (in parentheses). Pooling data by decreasing the number of LAMP1-labeled compartments from 16 to 11 had little effect on the correlation between grids but pooling 100 gold counts from two grids in the same experiment markedly increased the correlation coefficient when comparisons were made between experiments. This was the case for all other experiments in which 100 gold counts per grid were pooled. Increasing the number of gold counts to 200 per grid produced a marked increase in the correlation for ezrin but had a marginal effect for Kin 10. The distributions of PLCdelta1 labeling at 200 particles per grid show close correlation whether they were compared across experiments or within experiments and also showed good concordance. Correlation and concordance coefficients: r, parametric Pearson correlation; r s, non-parametric Spearman coefficient and W Kendal rank concordance coefficient were calculated as described in Siegel (1956). gridsn, comparison of all grids in the same experiment/series of experiments; expn, comparison of pooled data from all grids in the experiment. n is the number of grids or experiments that were compared. p values are for the Kendall coefficient W. Categories for lipid kinases were as detailed for ezrin in legend to Figure 2. ND, not done; NA, not applicable.
Obtaining Precise Estimates of Proportions over Individual Compartments
We have shown above that the sampling of 100–200 particles is sufficient in most cases to obtain a reproducible pattern of the distribution of label over a range of cellular compartments. However, it may be of interest to estimate more precisely the proportion of label over a particular compartment or structure. One way of assessing the precision is to estimate the coefficient of error, which can be predicted from the standard deviation of the data and the number of grids in the sample. We plotted the log of the total number of particles counted against log of the coefficient of error to provide an impression of the relationship between these quantities (see Figure 4). There was a reasonably consistent relationship that could then be used to assess the coefficient of error obtained at various sizes of sample (i.e., numbers of gold particles counted per compartment). As expected, the more gold particles that were counted over a compartment, the smaller was the coefficient of error. The relationships shown in Figure 4 predict that, at a coefficient of error of 10%, a count of around 130 particles would be a sufficient investment of effort, while for a 5% coefficient of error ≃400 particles would be needed. Therefore, to obtain a more precise estimate of the proportion of labeling over a particular compartment, additional effort is necessary.
Discussion
In this study we evaluated a simple and efficient method for estimating the patterns of immunogold labeling over subcellular compartments. The method depends on collecting data from a systematic random set of scans from which the location and amount of gold labeling are determined. The sampling strategy allows an unbiased and efficient assessment of the distribution of labeling proportions over cell structures. We show that reproducible patterns of labeling can be obtained when counts of ≃200 gold particles, spread over one or two grids, are made. This is a modest investment of effort and is therefore well adapted to pilot studies as well as more extensive investigations of distributions. Our results also indicate that spreading sampling fields and gold counts widely over the available material, by sampling at least 100–200 gold particles per grid on each of two grids (from one or more independent experiments), provides reproducible results. This reflects the relative importance of higher sampling levels in multilevel sampling designs for stereology (Shay 1975; Gundersen and Østerby 1981; Gupta et al. 1983), in which it is better to spread counts over more blocks and more grids rather than over more fields within a single grid. This effect is illustrated particularly well in the case of the inhomogeneously distributed and clustered antigen LAMP1. Here, counts of 100 gold particles from two EM grids produced a more reproducible result than a count of 200 made on a single EM grid. Again, it is important to emphasize that higher levels in the sampling scheme (experiments/animals/tissue slices/blocks) must also incorporate unbiased sampling design to ensure unbiasedness of the gold labeling estimate.
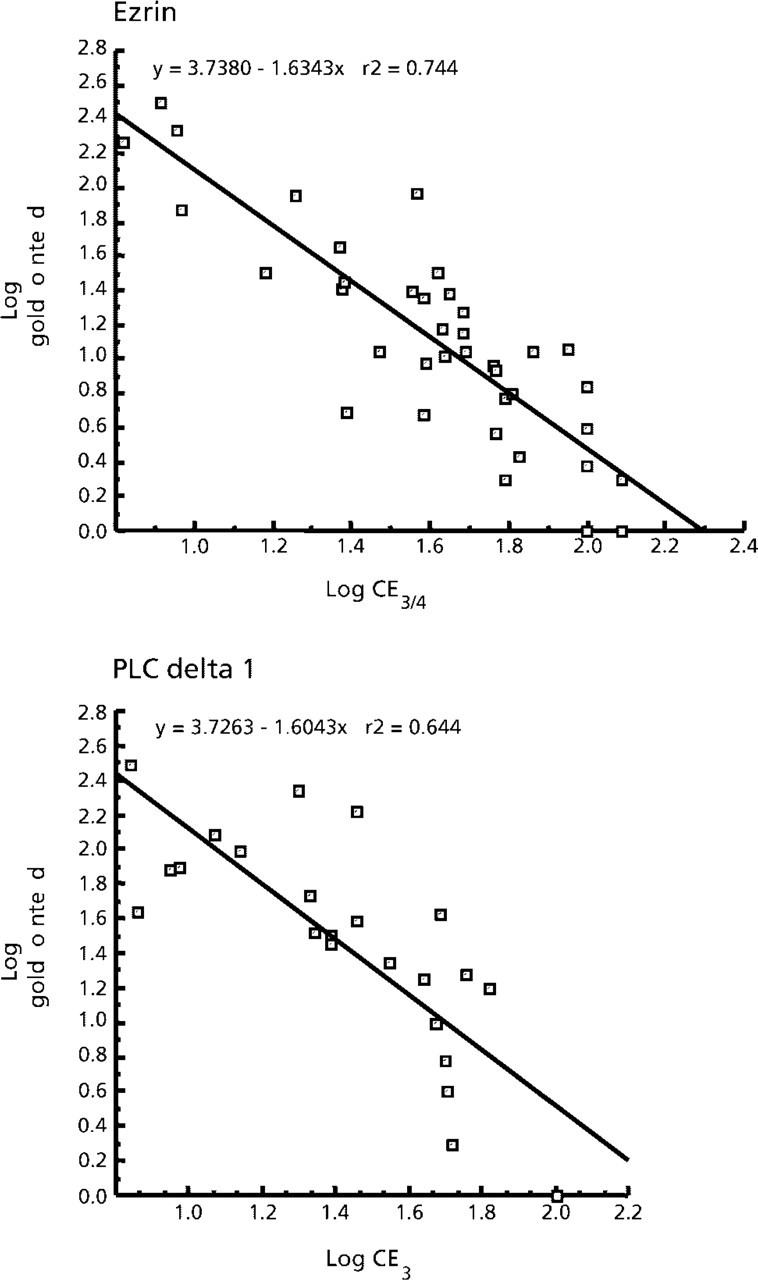
Coefficient of error of estimates is related to total gold particles counted. Relationship between the coefficient of error of the labeling proportion in a compartment compared with the total number of gold particles counted over all grids in the experiment. Ezrin data are from three experiments, one with 200 particles counted on each of three grids and two with 100 particles counted on each four grids (7/45 compartments were excluded from the analysis because they had total counts of zero or 1). The PLCdelta1 data were obtained from two independent experiments. In each experiment, 200 gold particles were counted on each of three grids. Coefficients of error were calculated for each experiment using the results for each grid, i.e., for ezrin n = 3 and 4, for PLCdelta1 n = 3.
It is important to distinguish between reproducibility of the pattern of labeling proportions over multiple compartments (assessed here by correlation and concordance coefficients) with accurate estimates of a labeling proportion for a single compartment. Our results show that if more accurate estimates of the proportion of labeling on an individual compartment are required, then the counts need to be focused on the compartment of interest. In the present study, 100–200 gold particles over an individual compartment were required to obtain a coefficient of error of 10%. Of course, if this level of accuracy is needed for additional compartments, then 100–200 particles should be counted over these as well, dramatically increasing the work required. Interestingly, previous stereological studies have also shown that counts of 100–200 events (e.g., test point hits, test intersections, or cell counts) are generally sufficient to obtain precise quantitative structural data in stereological studies (Braendgaard and Gundersen 1986; Gundersen 1986; Gundersen and Jensen 1987; Mayhew 1990). Therefore, our findings reinforce this widely used and valuable rule of thumb (Lucocq 1993).
Combining systematic sampling with random sampling provides an easy and rapid means of obtaining a sample that is well adapted to analysis of sections placed on EM grids. Although the value of simple random sampling alone is likely to be widely appreciated, its implementation on EM grids is not facile because each random location of a field or scan would need to be identified using randomly generated coordinates. In contrast, in systematic random sampling the array used here is first positioned randomly using a randomly placed grid feature and the array is developed from this location. An additional advantage is that the use of systematic sampling arrays is well known to improve precision of estimates, especially when the sample (e.g., gold labeling distribution) is heterogeneous. Therefore, it is important to ensure that the scans or fields are spread widely over the specimen, even when the labeling is intense. In this case, the number of fields or scans can be maintained by reducing the number of gold particles sampled, e.g., by reducing the width of the scanning aperture/band or by increasing the magnification. Conversely, if the labeling is very low, increasing the number of scans or fields can increase the number of particles counted. In some cases, complete coverage of the section may be required (Pryde et al. 1998)
In starting out with this type of analysis, an important consideration is the type of compartments to include in the analysis. A guide to possible labeled compartments is likely to be obtained from an initial qualitative assessment of the labeling pattern. In addition, there may also be useful background information available, such as protein sequence information (presence of membrane/organelle targeting sequences), sub-cellular fractionation studies, or immunofluorescence localization, which will offer clues about the true location of the antigen. Finally, the number of compartments is expected to have a significant effect on the reproducibility of results. Increasing the number of compartments (at a sampling level of 100–200 particles) will decrease counts on compartments and increase the random variation, especially on weakly labeled structures. However, decreasing the number of compartments will decrease the breadth and resolution of the analysis and, if the number of categories is reduced by pooling categories, the functional relevance of the data may become restricted. In the cases presented here, the number of compartments analyzed was in the range of 10 to 16 (Mayhew et al. 2002,2003).
What, then, is the significance of the labeling distributions reported here? One must consider the possibility is that the labeling is nonspecific, either because the affinity probe (antibody/PH domain) itself binds to multiple components or because of interactions of the affinity probe with the section (see Griffiths 1993 for further discussion of specificity and of appropriate controls). However, in the case that gold label is truly specific, it will report on the distribution of antibody binding sites that are accessible to the antibody and therefore will reflect the distribution of antigen. Thus, in contrast to methods that report on the density of the antigen, the present method allows comparison of the total pool sizes of label in different structures. The extent to which the distribution of gold reflects the “true” distribution of antigen is also governed by a variable termed labeling efficiency, which is the average number of gold particles per antigen in the section. On ultrathin sections, this value is known to vary substantially between different compartments, and ultimately the labeling efficiencies of different compartments, in addition to antigen amounts, will govern the proportions of label. Interestingly, much of the labeling efficiency variation on ultrathin cryosections appears to be related to variable penetration into the section and, when this penetration difference is negated, the labeling efficiencies appear to become much more homogeneous (Griffiths and Hoppeler 1986; Post-huma et al. 1988; Slot et al. 1989; Griffiths 1993; Oprins et al. 1994). Combining the present analysis with more specialized embedding techniques may allow more accurate readouts of relative antigen amounts over different intracellular compartments.
Although the present methods are likely to yield unbiased (or, at least, internally valid) estimates for the compartments to be estimated via their volume, the same may not be true for different membranes. When thin sections are observed by TEM, membrane images may be lost due to technical biases associated with lateral resolution (Paumgartner et al. 1981) and tilting of membranes away from the electron axis (Mall et al. 1977; Mayhew and Reith 1988). These biases are influenced, in turn, by membrane orientation characteristics (Stringer et al. 1982; Baddeley et al. 1986; Mayhew and Reith 1988; Mattfeldt et al. 1990; Nyengaard and Gundersen 1992). In the present study, we recognized this problem by identifying a separate compartment for unidentified membranes.
In summary, we have presented a simple method for assessing the distribution pattern of labeling over intracellular compartments that employs basic random sampling techniques that are widely employed in stereological analyses. Our results show that a modest effort, counting only 100–200 gold particles on each of two EM grids, is sufficient to obtain a reproducible impression of the labeling distribution pattern and, when the labeling is specific, an impression of the distribution of the antigen or other labeled component.
Footnotes
Acknowledgements
We thank Dr Janine Illian of SIMBIOS for reading the manuscript and checking the statistics. JML was supported by a Research Leave Fellowship from the Wellcome Trust (059767/Z/99/Z) and by Tenovus Scotland.