
Abstract
Proliferation and fusion of myoblasts are needed for the generation and repair of multinucleated skeletal muscle fibers in vivo. Studies of myocyte differentiation, cell fusion, and muscle repair are limited by an appropriate in vitro muscle cell culture system. We developed a novel cell culture technique [two-dimensional muscle syncytia (2DMS) technique] that results in formation of myotubes, organized in parallel much like the arrangement in muscle tissue. This technique is based on UV lithography-produced micro-patterned glass on which conventionally cultured C2C12 myoblasts proliferate, align, and fuse to neatly arranged contractile myotubes in parallel arrays. Combining this technique with fluorescent microscopy, we observed alignment of actin filament bundles and a peri-nuclear distribution of glucose transporter 4 after myotube formation. Newly formed myotubes contained adjacently located MyoD-positive and MyoD-negative nuclei, suggesting fusion of MyoD-positive and MyoD-negative cells. In comparison, the closely related myogenic factor Myf5 did not exhibit this pattern of distribution. Furthermore, cytoplasmic patches of MyoD colocalized with bundles of filamentous actin near myotube nuclei. At later stages of differentiation, all nuclei in the myotubes were MyoD negative. The 2DMS system is thus a useful tool for studies on muscle alignment, differentiation, fusion, and subcellular protein localization.
Keywords
T
It is known that cells in culture orient themselves in accordance with the topography of the substratum, and several systems have been developed to spatially organize cells of different types. Most previous studies have been based on selective cell attachment to surface bound components (Brunette et al. 1983; Chesmel and Black 1995; Mulder et al. 1998; Evans et al. 1999). However, these techniques were rather inefficient in directing the alignment of differentiated myotubes, and in several cases, use of chemical cues to direct attachment and growth required the use of serum-free media to avoid blocking the surface pattern. In addition, attachment factors coated to the substratum to facilitate cell adhesion can cause interference with high-resolution microscopy. To circumvent the problem with a random growth pattern and the requirement of serum-free media and to enable high-resolution studies of muscle cells, we used a micro-pattern technology based on UV lithography to generate a surface of fine channels on glass coverslips. This novel cell culture system, termed the two-dimensional muscle syncytia (2DMS) technique, was used to characterize different developmental and metabolic aspects of the subcellular organization of C2C12 cells during differentiation.
Formation of contractile myotubes from myoblasts involves a plethora of molecular processes engaging components of the plasma membrane, the cytoplasm, and the nucleus. One example is the force-generating actin filament system, which is essential for motility and maintenance of cell polarity and undergoes extensive rearrangement on myotube formation. The successive reorganization of the actomyosin system and the shift in expression of the components of this contractile machinery from non-muscle to muscle isoforms exemplifies important and not fully understood processes during muscle development (Lloyd et al. 2004; Sanger et al. 2005; Hotulainen and Lappalainen 2006).
The glucose transporters GLUT1 and GLUT4 are important for dynamic energy regulation in skeletal muscle cells; this glucose transport system is preferentially based on GLUT1 in myoblasts and GLUT4 in myotubes (Guillet-Deniau et al. 1994). GLUT4 translocates between intracellular compartments and the plasma membrane in both muscle and adipocytes (Cushman and Wardzala 1980; Suzuki and Kono 1980). However, compared with adipocytes, less is known about the molecular machinery of the glucose transport in muscle fibers, because progress in this area has been hampered by the lack of muscle cell lines/systems, which closely reflect the anatomy and physiology of muscle fibers.
Another typical feature during muscle differentiation is the variation in expression of myogenic factors. The transcription factors MyoD and Myf5 have been reported to be regulated by components of the cell cycle (Lindon et al. 1998) and are involved in the activation of muscle differentiation (Berkes and Tapscott 2005). It is known that C2C12 myoblast cultures gradually become heterogeneous with respect to MyoD expression, whereas Myf5 is expressed in the majority of the cells (Yoshida et al. 1998). During subsequent myotube formation, the expression pattern of these transcription factors changes further (Perry and Rudnick 2000), and the roles of MyoD and Myf5 are not fully understood.
The central importance of force generation, energy regulation, and control of gene expression for muscle development led us to use fluorescence microscopy to characterize the distribution of filamentous actin, cell nuclei, GLUT1, GLUT4, Myf5, and MyoD during myotube formation. We observed extensive formation of myotubes arranged in parallel in the micro-patterned glass, which enabled us to distinguish individual myotubes and hence determine the subcellular distribution of these proteins and their nuclei during early stages of muscle differentiation. We propose that this system can be used for further analysis of intracellular localization and transport of a multitude of proteins during myogenic differentiation. It is expected to become a fruitful complement to sample preparation of fixed and sectioned material obtained from biopsies or tissue.
Materials and Methods
Cell Culture
C2C12 murine skeletal muscle myoblasts (Jasmer and Kwak 2006; Riquelme et al. 2006) of less than nine passages were kept at proliferative state in 175-cm2 culture flasks in DMEM (1 g glucose/liter), 10% FBS, 1% penicillin-streptomycin (PEST), and 1% glutamine; at 50% confluency, the cells were trypsinized (0.25% trypsin for 10 min at room temperature) and replated. Differentiation was induced ∼24 hr after the cells had reached confluence by adding low-serum containing medium (DMEM; 1 g glucose/liter), supplemented with 2% horse serum, 1% PEST, and 1% glutamine. All cell culture media were from HyClone (Logan, UT), and supplements were from Invitrogen Life Technologies (Carlsbad, CA).
Micro-patterned Coverslips
The borosilicate glass coverslips were cleaned in a 1:1 solution of concentrated sulphuric acid (H2SO4) and hydrogen peroxide (H2O2) for 5–7 min and rinsed with water for 1 min, followed by heating at 95C for 2 min to remove moisture (Figure 1A). A continuous 2-μm-thick layer of aluminum (Al) was sputtered on the glass as mask material using a sputtering machine (Magnetron Sputter CS730S, 1000 W, 540 s; Von Ardenne Anlagentechnik GmbH, Dresden, Germany). A positive resist (Microposit S1813 photo resist; Shipley Company, Marlboro, MA) was spun over the Al surface, followed by soft baking at 115C for 75 sec. The resist was patterned by UV lithography (Karl Suss / Suss Microtek, Mask Aligner MA6/BA6, 12 mW/cm2, 3.8 s; Munich, Germany) and developed for 45 sec (Microposit 351 developer; Shipley Company). Hard baking was performed as the soft baking. The Al was patterned using reactive ion etching (RIE) in an inductive coupled plasma (ICP) machine (ICP-RIE, Plasma-Therm SLR 1401; St. Petersburg, FL). For etching, Cl2 (10.0 standard cubic cm [sccm]) and BCl3 (40.0 sccm) were used together with Ar (20.0 sccm) with powers of 15.0 W for bias and 500 W for the inductor, respectively, at 5 mTorr. The total etching time was 13 min. The polymerized remains on the etched surfaces were removed by etching for 1 min in the same machine in a plasma of O2 (10.0sccm) and Ar (20sccm) at 5 mTorr, with 5.0 W bias and 800 W on the inductor. The remaining resist on the Al surface was removed by acetone in an ultrasound bath for 20 min, followed by O2-ashing [Plasmastripp-Tepla 300, O2 (500 sccm), 1000 W, 30 min; Technics Plasma GmbH, Munich, Germany]. Then channels were etched 5.2 μm deep into the quartz for 4 hr in a radio frequency-powered RIE machine (made in-house), using CHF3 (15 sccm) with a power of 200 W at 15 mTorr, yielding an etch rate of 22 nm/min. With an etch selectivity of 10, the remaining Al layer had a thickness of 1.5 μm. Finally, the coverslips were cleaned in an ultrasound bath with acetone for 5 min, followed by iso-propanol for 1 min.
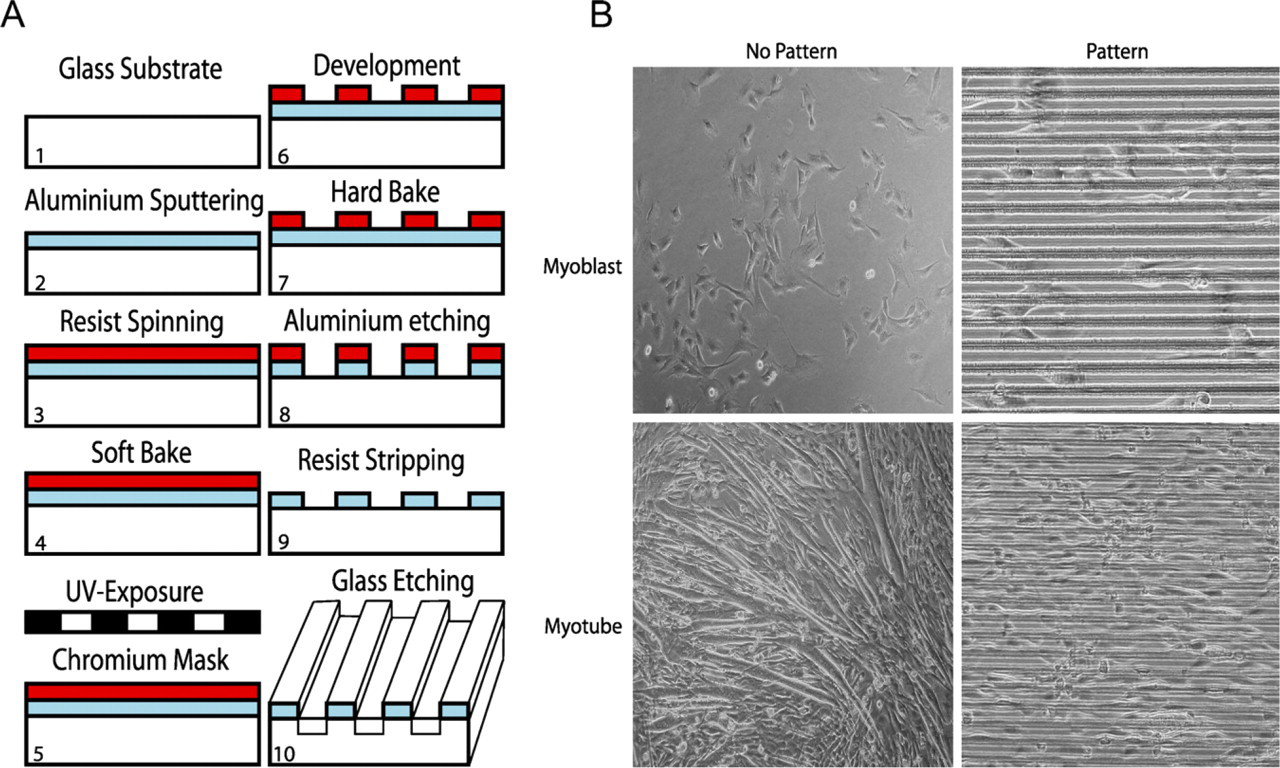
Preparation of glass coverslips for the two-dimensional muscle syncytia (2DMS) technique and a comparison of myoblast cultures grown on non-patterned and patterned glasses.
Microscopy
Phase contrast microscopy was performed with an Olympus microscope (IMT-2), equipped with a digital camera (C-4040ZOOM; Olympus Sverige AB, Solna, Sweden).
For immunofluorescence microscopy, the cells were washed with PBS and fixed in 4% formaldehyde in PBS at 37C, followed by permeabilization with 0.1% Triton-X100 in PBS for 10 min at room temperature. After washing, the specimens were incubated with primary antibodies for 12 hr at 4C. GLUT1 (Ab-652; Abcam, Cambridge, UK) and GLUT4 antibodies (sc-1606; Santa Cruz Biotechnology, Santa Cruz, CA) were used at 1:200 dilution, Myf5 antibodies (Sc-302; Santa Cruz Biotechnology) were diluted 1:100, and MyoD antibodies (sc-304; Santa Cruz Biotechnology) were diluted 1:50. The primary antibodies were detected by incubating the cell with Texas-red-conjugated anti-goat secondary antibodies (1:200 dilution; sc-2783, Santa Cruz Biotechnology) for 40 min at room temperature or tetramethyl rhodamine isothiocyanate-conjugated anti-rabbit secondary antibodies (1:200 dilution; 711–025–152, Jackson Immuno Research, West Grove, PA). Filamentous actin (F-actin) was stained with FITC-conjugated phalloidin (Sigma-Aldrich; St. Louis, MO), and for labeling of the nuclei, 4′-6-diamidino-2-phenylindol (DAPI) was used. In both cases, the labeling was performed at room temperature for 20 min. The specimens were observed with a Leica DMLB epifluorescence microscope, equipped with a DC350F camera and using IM500 software (Leica Microsystems AB; Kista, Sweden). Specificity of all primary antibodies was established by Western blotting against an extract of C2C12 cells.
Electrical Stimulation of Myotubes
For depolarization of the myotube membrane, agarosegel electrodes (4% agarose in HBSS) were cast in 200-μl pipette tips containing a core of silver wire. The cells were connected in series to a Grass S48 stimulator (Astro-Med; West Warwick, RI); pulse polarity was switched 16 times/min during the experiment. The duration was set to 20 ms, and voltage was increased between 0 and 50 V to determine the threshold value for contraction. Cells were stimulated for a maximum of 5 min with a delay of 340 ms.
Results
Muscle Cells on Micro-patterned Glass
Borosilicate glass coverslips were micro-patterned using UV lithography (see Materials and Methods), yielding 6.7-μm-deep channels with widths ranging from 5 to 120 μm (Figure 1A). C2C12 muscle cells were cultured on these glass surfaces and observed by phase-contrast microscopy. Cell proliferation on these surfaces was similar to proliferation on conventional culture plastics (data not shown). With channels of the optimal width of 20 μm, the cells become neatly arranged in parallel arrays (Figure 1B), leading to extensive fusion of the myoblasts into myotubes in a muscle-like arrangement suitable for further studies.
Subcellular and Nuclear Organization During Formation of Ordered Myotubes
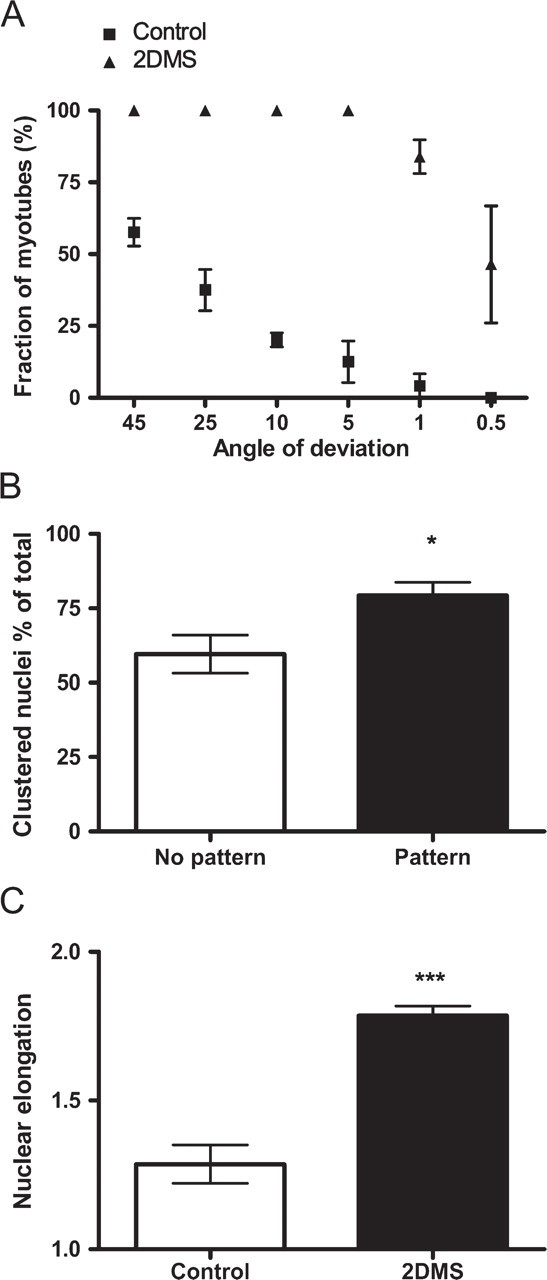
Having established a system for ordered formation of muscle syncytia in vitro, we proceeded with a visualization of F-actin by fluorescence microscopy (Figure 2). At low magnification, the density of the microfilament system, and hence intensity of fluorescence staining, readily visualized the elongated morphology and ordered growth pattern of the cells with the new technique (from now on referred to as the 2DMS technique) compared with the organization seen on non-patterned glass. This ordering was emphasized at later stages of culturing, on myotube formation, which began after 2-3 days (Figure 2A). As a measure of the cell order, we determined the angle of deviation from an arbitrary reference myotube. With the 2DMS technique, ∼85% of the myotubes were parallel (deviating <1 degree), whereas in control cultures, only 4% of the myotubes were organized in parallel (Figure 3A).
Double staining of F-actin and double-stranded DNA (nuclei) showed that bundles of actin filaments extended for long distances through the syncytial myotubes more or less in parallel with their length axis (Figures 2B and 2C). On control glass, this was not as evident because the myotubes often were arranged in layers forming a crisscross pattern. Furthermore, in striking contrast to the 2DMS technique, the myotubes on control glass often branched, forming several different extensions (Figure 2B). Myotubes grown with the 2DMS technique were organized in parallel and separated from each other (Figure 2C). Interestingly, bundles of F-actin fused into thicker assemblies and often the staining intensity displayed regular variations, suggesting that their amount or packing of F-actin was altered into a repetitive pattern along the bundle (Figure 2D), in agreement with previous observations of a sarcomere-like arrangement in developing myotubes (Lloyd et al. 2004; Sanger et al. 2005).
Spontaneous contractions of myotubes were observed on both control and 2DMS glass, albeit in a fraction of the cells only. To test if the contractile capacity of 2DMS-cultured myotubes was different from control cultures, electrical stimulation was performed. This increased the number of contracting cells (Day 6, data not shown), with no difference between the two systems. However, with the 2DMS technique, the electrically stimulated contractions were synchronized, making the parallel myotubes operate as a unit.
Visualization of the nuclei by DAPI showed an extensive clustering of this organelle after fusion (Figure 2B). Scrutinizing this phenomenon and defining clustering as the situation when two or more nuclei were located closer to each other than one nuclear diameter showed that ∼60% (59 ± 6%) of the nuclei on control glass appeared in clusters compared with 80% (79 ± 4%) with the 2DMS technique (Figure 3B). We also observed that the nuclei in myotubes cultured with the new technique were more elongated than those in the control cells (Figure 3C).
Molecular Changes During Myotube Formation Seen With the 2DMS Technique
Antibody staining of cells cultured with the 2DMS technique showed high levels of GLUT1 expression in myoblasts, whereas distinctly lower levels were seen in the myotubes (Figure 4A). In contrast, the myoblasts showed no staining with GLUT4 antibodies, whereas the myotubes were labeled, congruent with previous observations of GLUT1 as a typical component of undifferentiated cells and GLUT4 as being expressed in differentiated muscle cells (Guillet-Deniau et al. 1994). Simultaneous staining of GLUT4, F-actin, and nuclei in myotubes showed that perinuclear GLUT4 accumulated in larger entities, which lined up close together and in parallel with the length axis of the myotubes (Figures 4B and 4C).
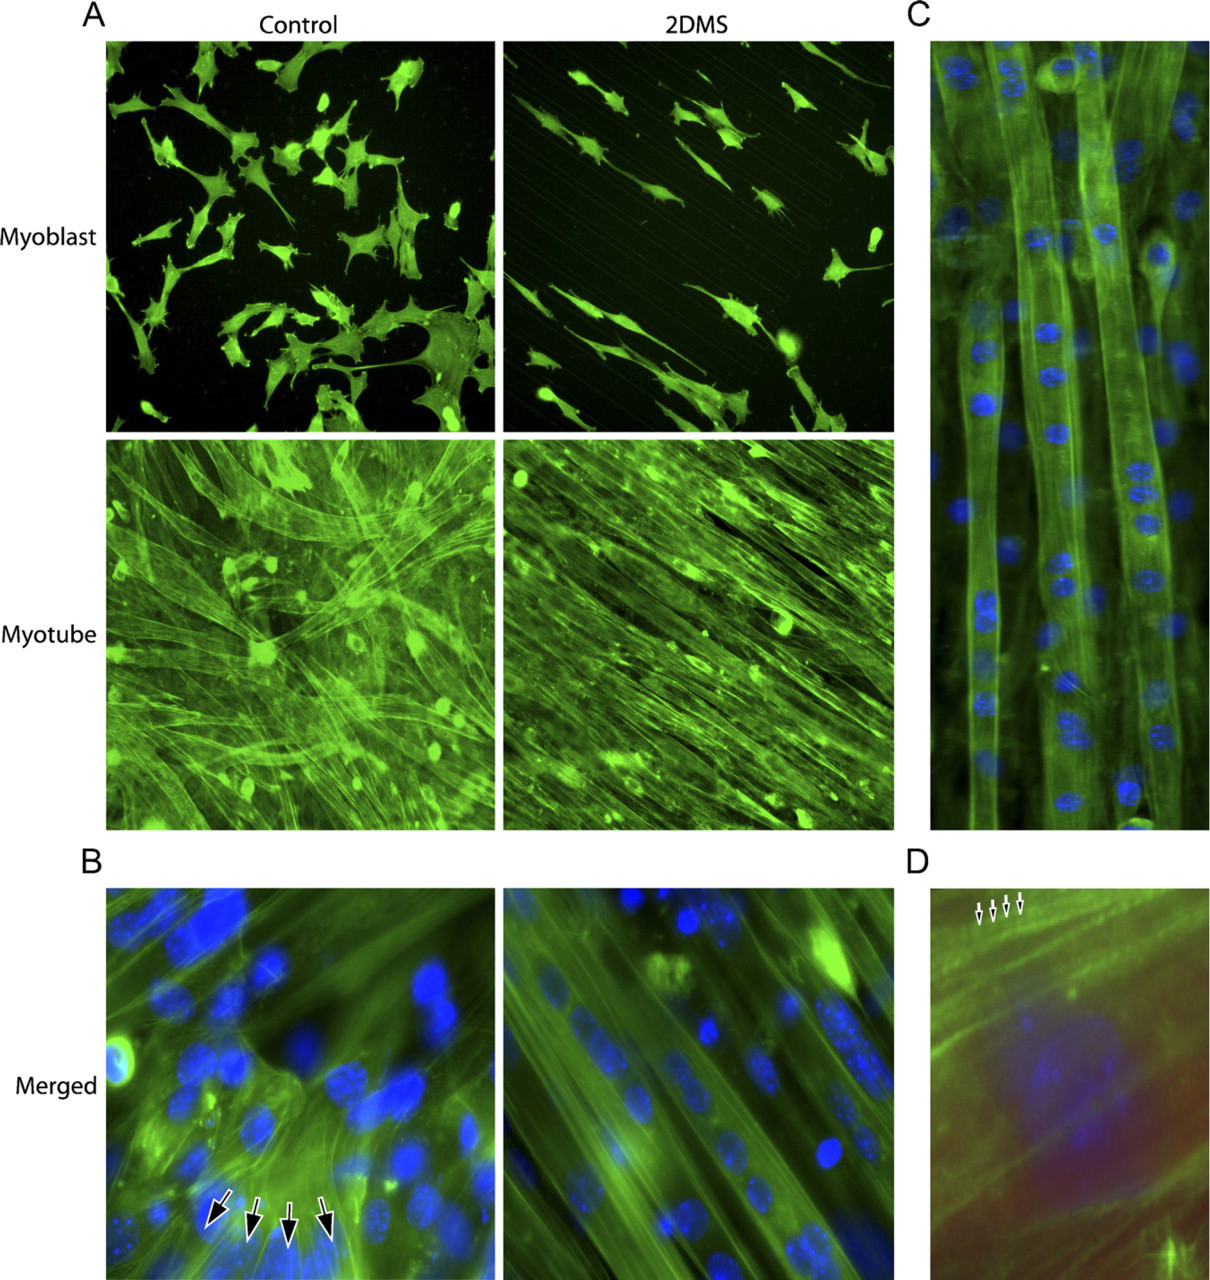
Fluorescence microscopy of filamentous actin in C2C12 cells during differentiation. (
Myotubes grown with the 2DMS technique show a well-ordered organization and distinct nuclear morphologies. (
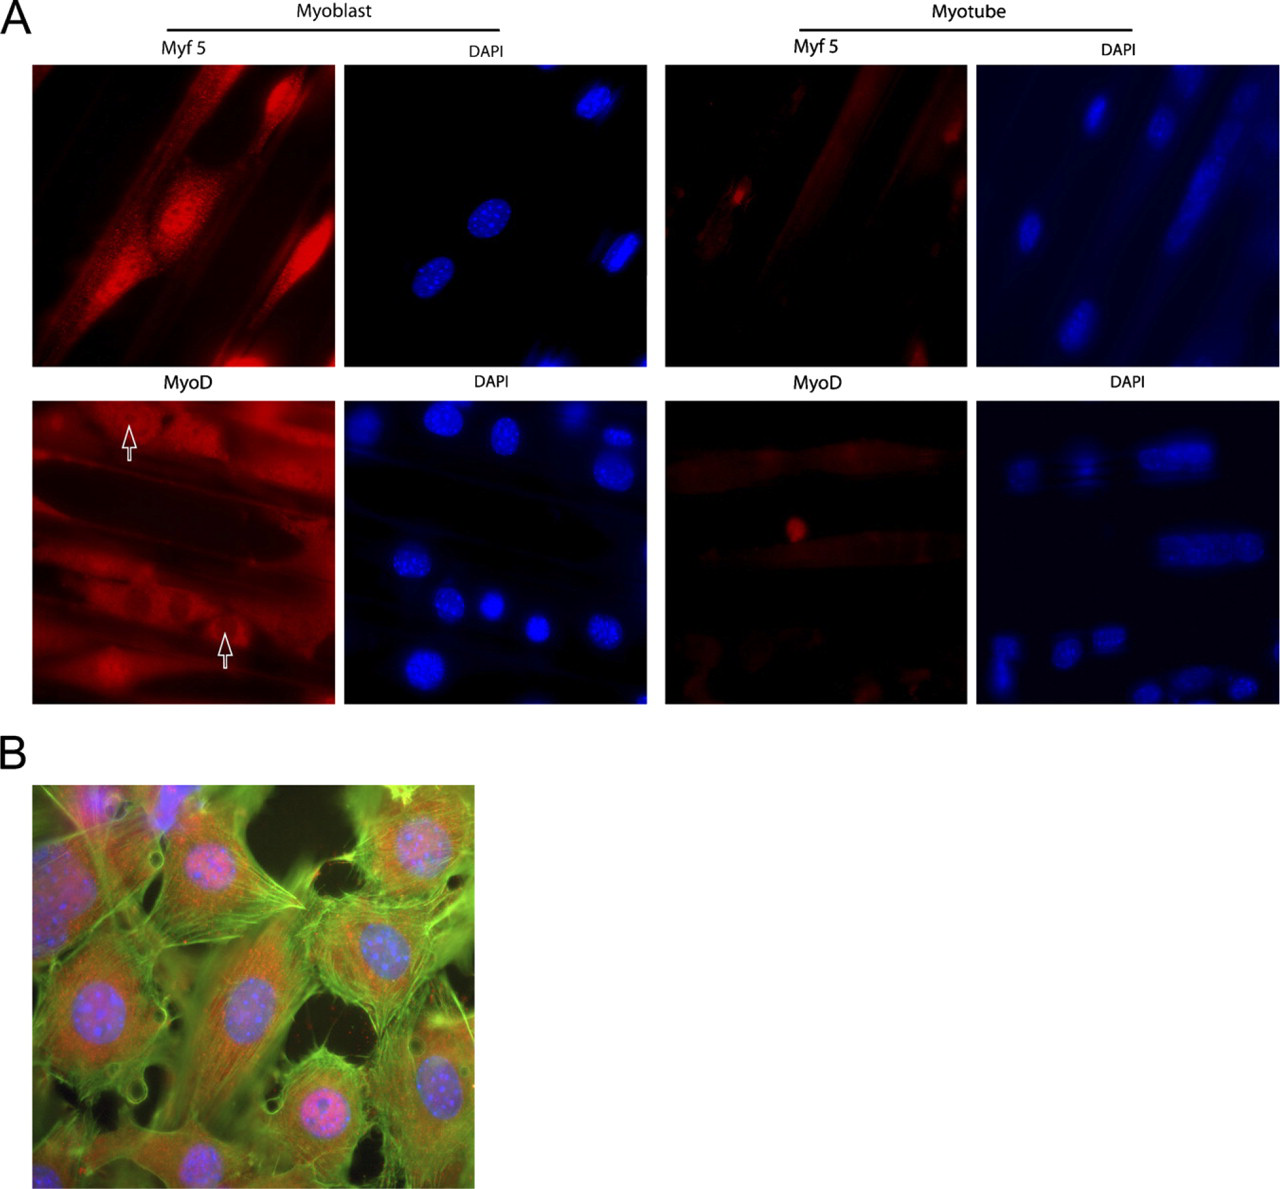
To follow muscle differentiation, we studied the distribution of the two different transcription factors Myf5 and MyoD, which are known to operate at different stages of myogenesis (Braun et al. 1989; Rudnicki et al. 1992). Both proteins were most prominently expressed in the myoblasts compared with the myotubes (Figure 5A), essentially in agreement with results reported by others (Berkes and Tapscott 2005).
We used the 2DMS technique in combination with fluorescence microscopy to study MyoD protein expression and localization at three different stages of myogenesis: mononucleated myoblasts (Day 1), intermediate fusion stage (Day 3), and mature myotubes (Day 6). We found that MyoD but not Myf5 was heterogeneously distributed in myoblasts. Concentrating on MyoD, all mononucleated myoblasts displayed cytoplasmic MyoD protein expression. However, the mononucleated myoblast population was separated into two subgroups: one with cells showing an intense nuclear staining (MyoD+) and one with nuclei virtually devoid of MyoD (MyoD-; Figure 5).
The variation in nuclear MyoD expression was observed in myoblasts after 1 day in culture and led us to analyze the MyoD content also in intermediate and mature myotubes. The developing myotubes each contained several nuclei both positive and negative for MyoD (i.e., MyoD+ and MyoD-). Thus, the variation of MyoD expression in mononucleated myoblasts was also observed in -nucleated myotubes. However, after continued differentiation, all myotube nuclei became MyoD-, but MyoD staining was observed in perinuclear regions of the cytoplasm (Figure 6). Furthermore, at the intermediate stage, MyoD+ and MyoD- nuclei were regularly occurring closely together in the same nuclear cluster, and occasionally, puncta of cytoplasmic MyoD staining were seen to colocalize with actin filament bundles in the perinuclear area (Figure 7).
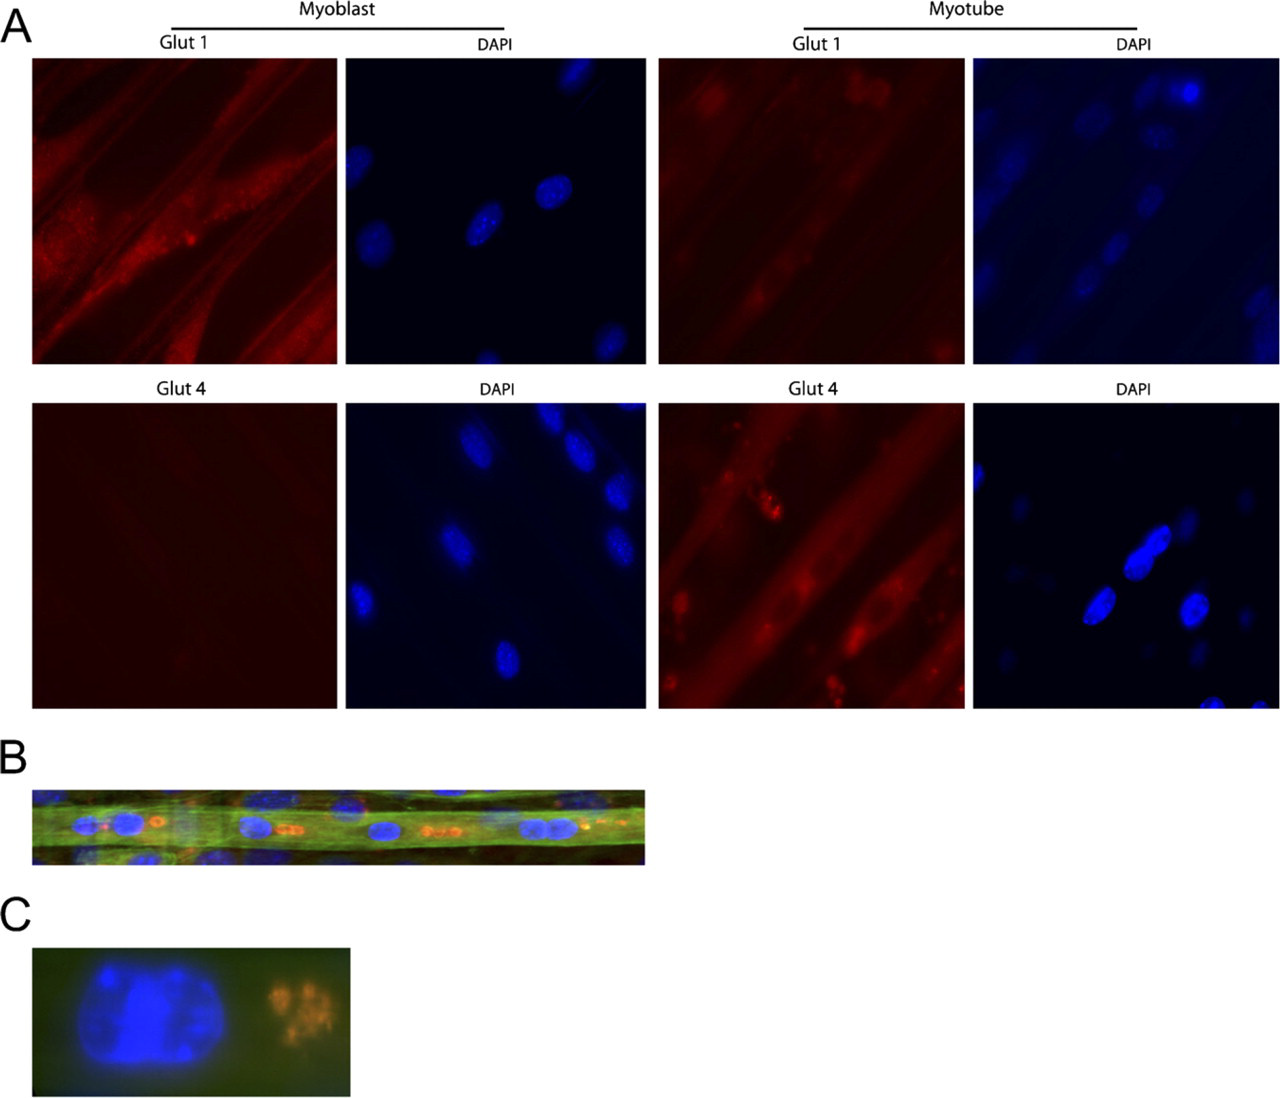
Glucose transporter (GLUT) proteins in muscle cells cultured with the 2DMS technique. (
Discussion
Here we showed the usefulness of micro-patterned glass to study myoblast fusion and subsequent phenomena coupled to muscle differentiation. The etched surface caused the cells to organize into a pattern reflecting the parallel arrangement of muscle fibers in vivo, resulting in the formation of an in vitro 2DMS. The myotubes on these glass substrates, with no use of special coating or special media, are separated from each other, making this technique particularly suitable for microscopy and also allowing for micro-manipulation of individual -nucleated cells, thereby extending the usefulness of previous techniques (Clark et al. 1997; Evans et al. 1999; Engler et al. 2004; Feng et al. 2007; Yan et al. 2007). Furthermore, with the 2DMS technique the extensive formation of non-physiological branched myotubes often seen on ordinary glass did not occur.
After having established that C2C12 myoblasts proliferated and fused into myotubes on the etched glasses without introduction of special culture conditions, we used the 2DMS technique to characterize the distribution of a set of functionally distinct proteins. Visualization of the microfilament system by phalloidin-staining of filamentous actin showed that stress fibers in newly formed myotubes fuse into larger assemblies. As judged from their fluorescence intensity, these bundles extended through the myotubes for long distances largely in parallel with their length axis and apparently contained repetitively organized segments of highly concentrated actin filaments. This could reflect initial stages in myofibrillogenesis, supporting the idea that stress fibers act as templates for the final organization of sarcomer-containing myofibrils (Lloyd et al. 2004; Sanger et al. 2005; Hotulainen and Lappalainen 2006). The fact that the myotubes were capable of both spontaneous and electrically induced unidirectional contractions showed that the 2DMS technique is suitable for combining further studies of the contractile apparatus in muscle tissue with direct observation of force generation.
Myogenic factors Myf5 and MyoD in C2C12 muscle cells cultured with the 2DMS technique. (
The nuclei in myotubes cultured with the 2DMS technique had an elongated morphology compared with the more rounded form found in myotubes cultured on control glass. The reason for this is unclear but could result from tension generation, either as a consequence of contractile forces developed during myofibril formation or during nuclear translocation by the microtubule and/or microfilament systems. The nuclei in myotubes cultured with the 2DMS technique more often appeared in clusters. In vivo studies have shown that nuclear clustering occurs near neuro-muscular junctions (Bruusgaard et al. 2006). The 2DMS technique may thus prove advantageous to elucidate molecular mechanisms associated with nuclear clustering, perhaps related to initial stages of the formation of the neuromuscular junctions.
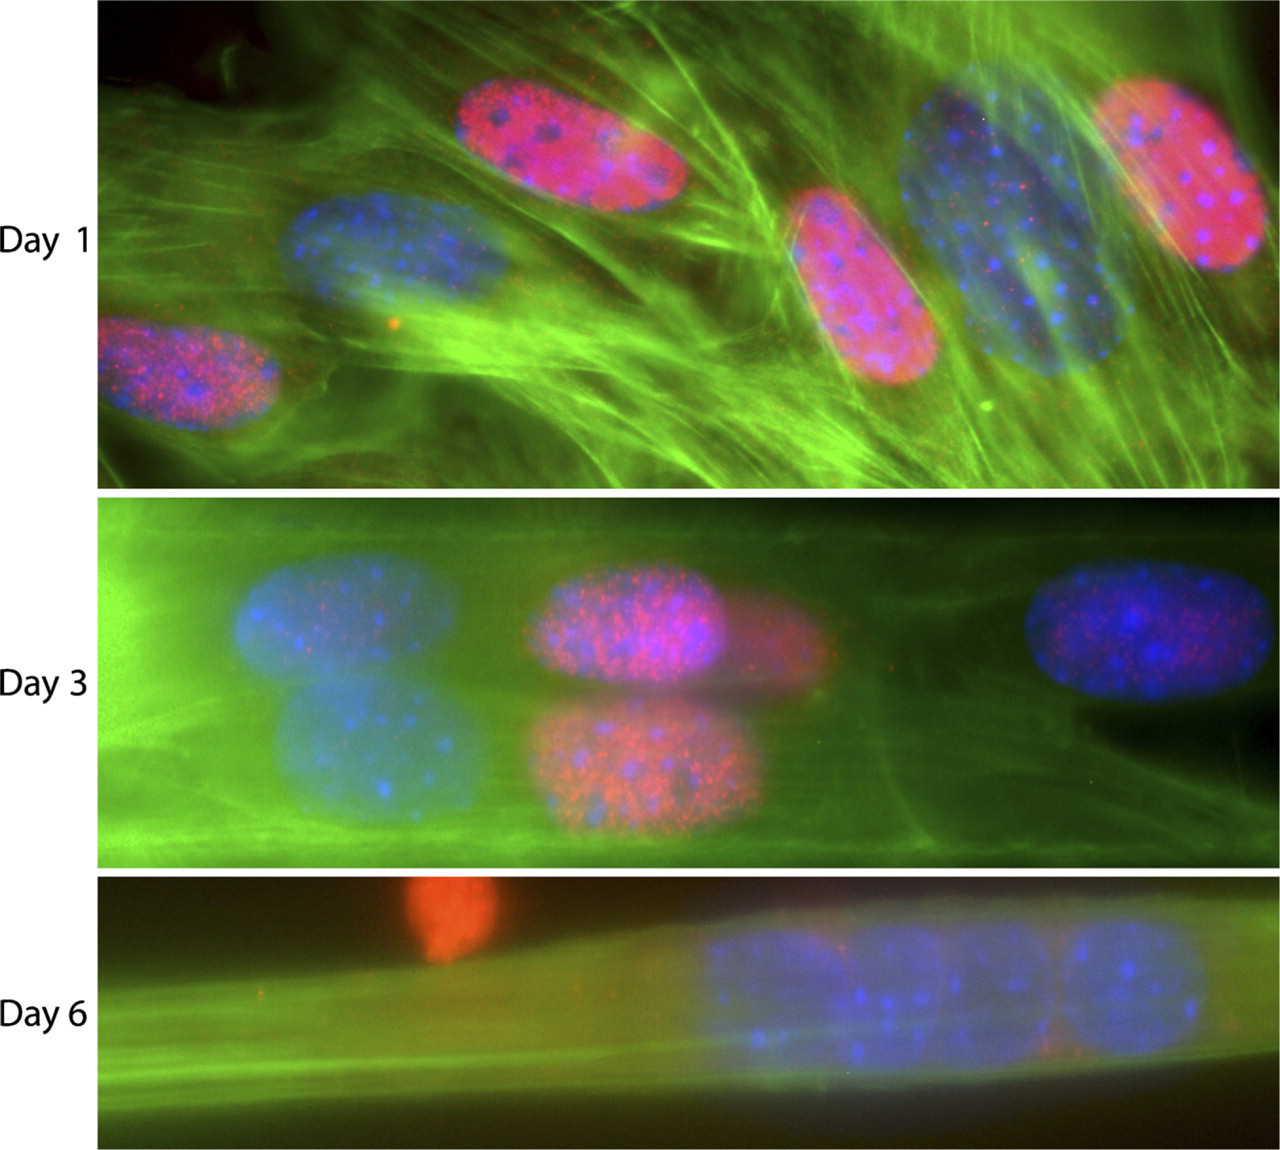
Variation in MyoD protein expression during differentiation of C2C12 muscle cells seen with the 2DMS technique. Antibody labeling of MyoD (red) shows the presence of MyoD+ and MyoD- nuclei. The specimen was also stained with FITC-phalloidin (F-actin; green) and DAPI (nuclei; blue). Panels show proliferating myoblasts (Day 1), multinucleated myotubes during an intermediate stage of differentiation (Day 3), and myotubes at a later stage of differentiation (Day 6).
Examining the protein expression pattern of the glucose transporters GLUT1 and GLUT4 by antibody staining showed that GLUT1 mainly was present in myoblasts and GLUT4 was seen preferentially in myotubes in agreement with previous observations (Guillet-Deniau et al. 1994). In vivo, GLUT4 is enriched in membrane structures in the triad region of muscle fibers where the t-tubules, terminal cisternea, and sarco-plasmatic reticulum meet, as well as in the sarcolemma, subsarcolemma vesicles, and perinuclear Golgi-like membrane structures (Wang et al. 1996; Ploug et al. 1998). We observed that differentiating C2C12 cells often accumulated the GLUT4 transporter in distinct puncta close to the nuclei. The significance of these perinuclear arrangements of GLUT4 is unclear but points to an interesting organization of the protein not previously observed with other in vitro systems but could represent a Golgi-associated distribution as reported from studies of adult muscle in vivo (Wang et al. 1996; Ploug et al. 1998).
During the differentiation of the C2C12 cells, we observed a variation in the nuclear content of MyoD. In later stages of myotube formation (Day 6), all nuclei were negative for MyoD, (MyoD-). However, after fusion (Day 3), we observed that the multinucleated myotubes contained both MyoD+ and MyoD- nuclei. Because we noted that, before fusion, the cultures of myoblasts (Day 1) were heterogeneous with respect to MyoD expression, as also reported by Yoshida et al. (1998), it seems that cells of both categories participate in the fusion event. Because it seems that both MyoD+ and MyoD- myoblasts contribute to the fusion event, we suggest that the presence of MyoD indicate a fusion competent stage of the myoblast. In support of this conjecture, Drosophila skeletal muscle is formed by fusion of a heterologous population of muscle progenitor cells (Chen and Olson 2004), characterized by different expression of basic helix-loop-helix bHlH transcription factors, which are related to the mammalian MyoD proteins (Berkes and Tapscott 2005).
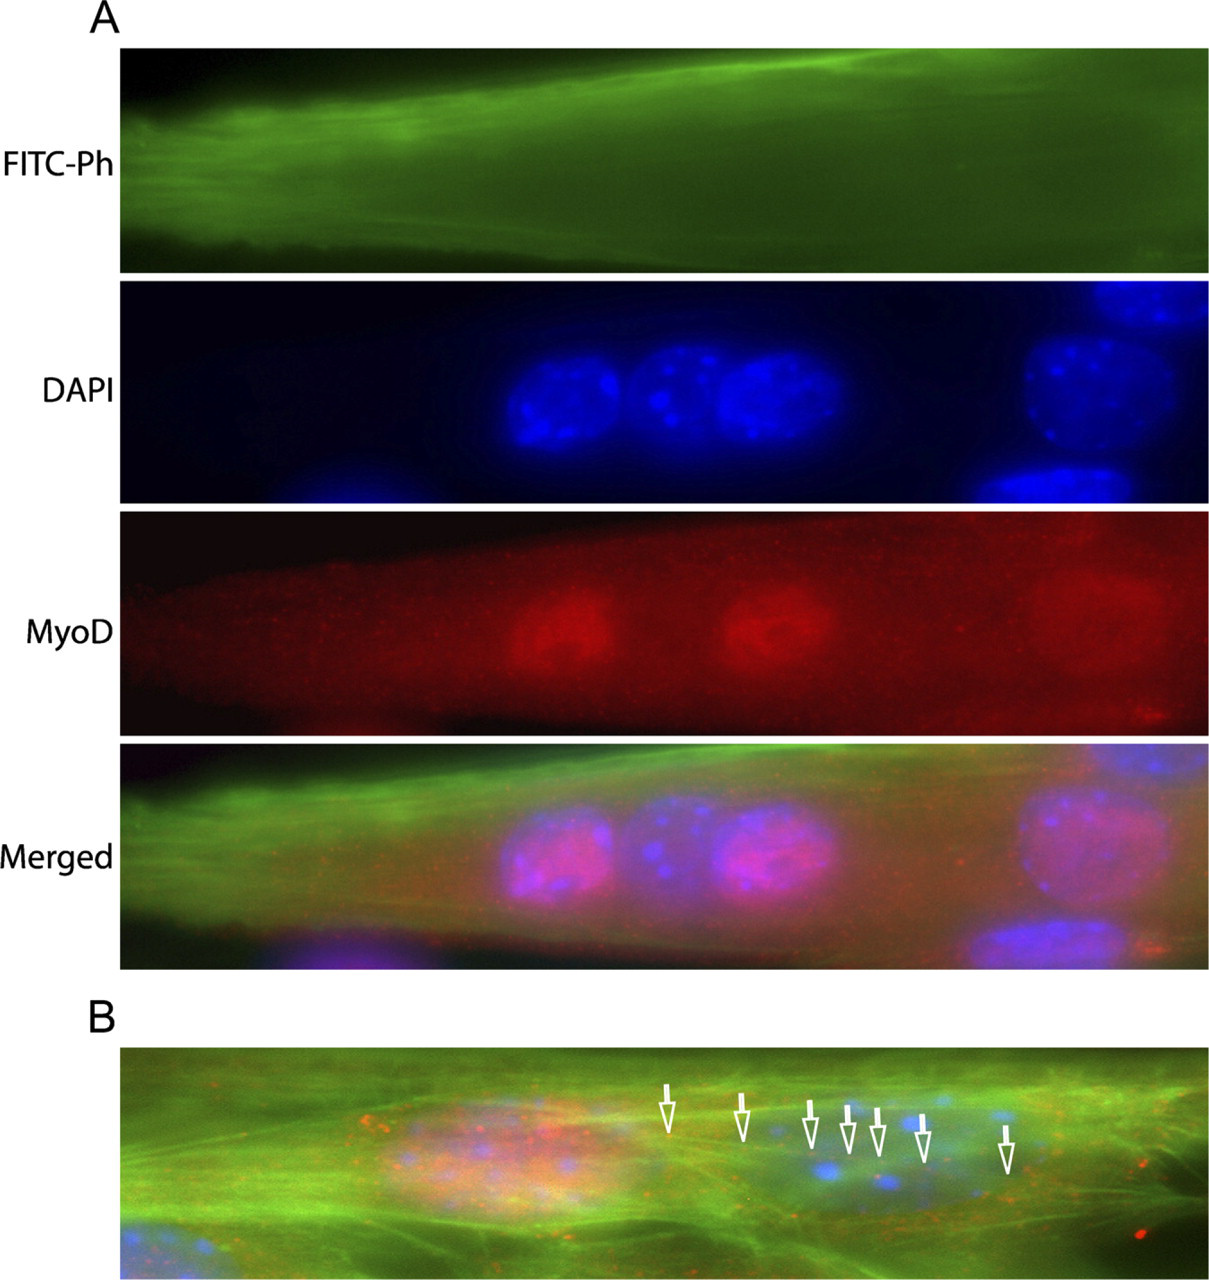
MyoD protein expression during fusion (Day 3). (
The role of MyoD in transcriptional control of myogenesis has been extensively studied (Berkes and Tapscott 2005). Mice that lack functional MyoD develop normally (Rudnicki et al. 1992), but experimentation with grafted MyoD-/- fibers and MyoD-/- cells in culture has shown that MyoD-/- cells display delayed onset of the fusion event and are developmentally stalled (Cornelison et al. 2000; White et al. 2000). Considering the heterogeneous MyoD expression seen here, it is interesting that MyoD is not expressed in quiescent satellite cells (Grounds et al. 1992) but activated during muscle repair. When returning to the quiescent state, the expression of MyoD is again down-regulated in the cells (Zammit et al. 2004). It is thus possible that the MyoD expression per se is not needed for fusion but that it could be seen as a marker for the state of the fusion machinery in the cell.
The fact that, at later stages of myogenesis, all myotube nuclei became MyoD negative, poses interesting problems concerning coordinated gene regulation and MyoD turnover within the myotubes, which will be further addressed with this system. The colocalization of MyoD-containing puncta with actin bundles tentatively points to an actomyosin-dependent trafficking of the transcription factor between the nuclear and cytoplasmic compartments, and it is plausible that such transportation is part of this regulation of MyoD. Congruent with such a view, nucleo-cytoplasmatic shuttling of MyoD has been proposed (Lingbeck et al. 2003), and it seems that its nuclear import is under protein kinase A control (Vandromme et al. 1994). Similarly, Myf5 has also been observed to distribute to the cytoplasm in addition to its nuclear localization (Nordquist et al. 2007).
Although shown here for skeletal muscle cells, the 2DMS technique should be advantageous for studies of other syncytia-forming cells as well. We further conclude that combining the 2DMS technique with live cell imaging will enable detailed studies of protein expression and dynamic processes during and after such syncytia formation.
Footnotes
Acknowledgements
This work was supported by grants to T.B. and R.K. from the Swedish Research Council, to T.B. from Novo-nordiskfonden (Novo Nordisk Foundation) and Stiftelsen Svenska Diabetes-förbundets Forskningsfond (Foundation of the Research Fund of the Swedish Diabetes Association), to R.K. from Carl Tryggers Foundation, and to G.S. from the European Commission (MC-RTN “CELLION”). We thank Dr. Anna-Stina Höglund, Uppsala University, for fruitful discussions.