
Abstract
Chromaffin cells cultured for 2 days were incubated in the absence or presence of 10 μM nicotine for 40 sec. Resting and stimulated cells were fixed and either prepared for fluorescence microscopy or treated with Triton X-100 to obtain cytoskeletons for ultrastructural studies. Electron microscopy of cytoskeletons revealed the presence of polygonal areas devoid of actin filaments only in nicotinic receptor-stimulated cells. Staining of these cytoskeleton preparations with rhodamine–phalloidin, a probe for filamentous actin, produced fluorescent patterns and three-dimensional images similar to those obtained from resting or stimulated intact cells prepared directly for fluorescence microscopy. Moreover, the percentage of stimulated cells showing disrupted cytoskeleton at the electron microscopic level was similar to the percentage of stimulated cells showing patched rhodamine fluorescence at the fluorescence microscopic level. In addition, cells stimulated with nicotine for 40 sec showed a fivefold increase in amine output and a significant decrease in F-actin levels. These results provide the first ultrastructural evidence for nicotinic receptor-evoked chromaffin cell F-actin disassembly and show that the rhodamine–phalloidin-unstained areas observed in fluorescence microscopy represent the areas devoid of filamentous actin observed at the electron microscopic level.
C
Chromaffin vesicles interact with F-actin through anchoring proteins, such as α-actinin (Jockush et al. 1977; Bader and Aunis 1983; Trifaró et al. 1984) and fodrin (Aunis and Perrin 1984), promoting actin filament crosslinking, stabilizing the actin network (Fowler and Pollard 1982; Trifaró et al. 1984), and preventing chromaffin vesicles from reaching exocytotic sites at the plasma membrane (Trifaró et al. 1984). Thus, the cortical actin microfilament network acts as a barrier (negative clamp) to the movement of secretory vesicles, blocking their access to exocytotic sites at the plasma membrane (Trifaró et al. 1982,1984; Cheek and Burgoyne 1986,1987; Burgoyne and Cheek 1987; Burgoyne et al. 1989; Trifaró and Vitale, 1993). It has been suggested that nicotinic receptor stimulation evokes chromaffin cell cortical F-actin disassembly, allowing the free movement of secretory vesicles to release sites at the plasma membrane (Vitale et al. 1991). The assumption of transient disassembly of cortical F-actin networks on stimulation is based on (a) results from cytochemical experiments with rhodamine–phalloidin, showing a fragmentation of the cortical fluorescence ring on nicotinic receptor stimulation (Vitale et al. 1991) and (b) a decrease in the amount of F-actin recovered with the Triton X-100-insoluble (cytoskeleton) protein (Burgoyne et al. 1989; Trifaró et al. 1989). However, there is no ultrastructural evidence for the formation of areas or zones of F-actin network disassembly during chromaffin cell stimulation.
The present study was undertaken to demonstrate at the electron microscopic level whether nicotinic receptor stimulation evokes the formation of areas of F-actin disassembly. The electron microscopic experiments described here clearly demonstrated that nicotinic receptor stimulation induces the formation of areas of F-actin disassembly and that these areas correspond to zones free of rhodamine–phalloidin staining observed at the fluorescence microscopic level on chromaffin cell stimulation. Furthermore, a similar conclusion is reached from analysis and comparison between the three-dimensional images obtained from chromaffin cell cytoskeletons prepared for electron microscopy and those obtained from intact cells prepared for fluorescence microscopy.
Materials and Methods
Chromaffin Cell Culture
Bovine adrenal glands were obtained from a local slaughterhouse and chromaffin cells were isolated by collagenase digestion and further purified using a Percoll gradient (Trifaró and Lee 1980). Cells were plated on three different surfaces: (a) collagen-coated plastic Petri dishes at a density of 0.5 × 10⁶ cells/35-mm dish for catecholamine release studies; (b) collagen-coated glass coverslips contained within plastic Petri dishes at a density of 0.3 × 10⁶ cells/35-mm dish for fluorescence microscopy; and (c) collagen-coated coverslips containing Formvar-coated gold grids at a density of 0.3 × 10⁶ cells/35-mm dish for electron microscopic studies (see below). Cells were grown at 37C in a humidified incubator under a 5% CO2 + air atmosphere for 48 hr as previously described (Trifaró and Lee 1980).
Source of Antibodies
Polyclonal antibodies were raised in rabbits against purified chicken gizzard γ-actin. These antibodies have been previously characterized and used to detect actin in chromaffin cells (Lee and Trifaró 1981).
Fluorescence Microscopy
Cultured cells were rinsed three times with regular Locke's solution (in millimolar: NaCl 154; KCl 2.6; K2HPO4 2.15; KH2PO4 0.85; MgCl2 1.2; CaCl2 2.2; and glucose 10, pH 7.2). Cells were incubated for 40 sec in the absence (control) or presence of 10 μM nicotine. Chromaffin cells were then fixed in 3.7% formaldehyde in Locke's solution for 20 min and processed for fluorescence microscopy as described previously (Lee and Trifaró 1981). Briefly, cells were permeabilized by three successive exposures of 5 min each to 50, 100, and 50% ice-cold acetone. Preparations were then washed several times with PBS (in millimolar: NaCl 130; Na-phosphate 100, pH 7.0) and then were stained for F-actin with rhodamine–phalloidin (0.25 U/ml; Molecular Probes, Eugene, OR) for 40 min in the dark at room temperature. Finally, coverslips were rinsed with PBS and mounted in glycerol-PBS (1:1).
Cytoskeletons prepared from cells grown on Formvar-coated gold grids (see below) and fixed overnight with 2.5% glutaraldehyde were washed six times with PBS. Preparations were then treated with 50, 100, and 50% acetone as indicated above, washed with PBS, and incubated with rhodamine-labeled phalloidin as described above. The preparations containing the chromaffin cell cytoskeletons attached to grids were rinsed with PBS and mounted in glycerol-PBS. Cells and rhodamine–phalloidin-stained cytoskeletons were observed with a Leitz Ortholux fluorescence microscope equipped with a 100-W high-pressure lamp and a Ploempack II incident light illuminator (Vitale et al. 1991). Photographs were taken with Kodak-Tri-X pan films (400 ASA). To study the effects of nicotine stimulation on the percentage of cells or cell cytoskeletons showing F-actin disassembly, 100 single-round cells per coverslip or 10 single-cell cytoskeletons per grid were examined. Each cell or cell cytoskeleton was classified as having either a “continuous” or “discontinuous” cortical rhodamine (F-actin) fluorescent ring. The percentage of chromaffin cells or cell cytoskeletons showing F-actin disassembly (discontinuous rhodamine fluorescent ring) was calculated for each experimental condition. To avoid personal bias, code numbers were given to each coverslip. The cells were examined and classified without knowing whether they were from control or nicotine-treated preparations. Only after all preparations were examined and the results recorded were the codes revealed to identify the experimental conditions used (single-blind design).
Video-enhanced Image Processing
Quantitative analysis of cortical rhodamine fluorescence (F-actin) was performed by using a Hamamatsu Photonic KK Argus 50/CL Image Processor (Hamamatsu Photonic Systems; Bridgewater, NJ) as previously described (Vitale et al. 1995). Briefly, the fluorescence microscope was coupled to a video camera (Carl Zeiss, TV3M model; Oberkochen, Germany) which was connected to an Argus 50 image processor. Video camera control parameter (i.e., gain, offset, and sensitivity) were adjusted by using the image of a resting chromaffin cell on the monitor. Control parameters were set up to obtain a clear image of the cell on the monitor and a fluorescence intensity of 250 (arbitrary units) in the cortical region of the cell. Image analysis of other cells was carried out without modifying the video camera control parameters. The three-dimensional graphic analysis represents the coordinates of the equatorial plane of the cell as the × and Y axes and the fluorescence intensity of this plane as the Z axis. The image stored in the memory is constructed of 16 bits containing 512 horizontal pixels by 483 vertical pixels.
Catecholamine Release
Catecholamine output from cultured chromaffin cells was assessed by measuring [3H]-norepinephrine ([3H]-NE) output as described previously (Trifaró and Lee 1980). Under these conditions, there is a parallel and concomitant release of endogenous catecholamines and [3H]-NE on stimulation of the cells (Trifaró and Lee 1980; Vitale et al. 1992). After labeling with 0.1 μmol [3H]-NE (Amersham, Toronto, Ontario, Canada; specific activity 40 Ci/mmol) (Kenigsberg and Trifaró 1980), each culture dish was incubated with six changes of 1 ml regular Locke's solution over a 60-min period before the experiments were commenced. Cells were then incubated with 1 ml regular Locke's solution with or without 10 μM nicotine for 40 sec. After this incubation time, the entire (1 ml) incubation medium was removed and radioactivity determined. [3H]-NE cell content was determined by treating the cells with 1 ml 10% TCA for 10 min, followed by two washes of 0.5 ml 6% TCA. The three aliquots were combined and the radioactivity was measured in a liquid scintillation spectrometer (Beckman Instruments; Fullerton, CA). Total [3H]-NE cell content was calculated by adding the [3H]-NE released into the medium to the [3H]-NE extracted with TCA. The assay allowed the determination in a 1-ml sample of a level of [3H]-NE equivalent to 0.3% of the total cell catecholamine content (Vitale et al. 1991).
Determination of Actin in Cultured Chromaffin Cells
Cells were incubated in Locke's solution in the absence or presence of 10 μM nicotine for 40 sec. Cells were then washed with Locke's solution and resuspended in lysis buffer as described by Sheterline et al. (1984). G-actin and total actin were determined by the DNase I inhibition assay (Sheterline et al. 1984). F-actin was calculated by the subtraction of values for G-actin from those obtained for total actin.
Electron Microscopy
Preparation of Gold Grids
Formvar films were prepared on glass microscope slides. The slides were immersed in a solution of 0.3% Formvar in ethylene dichloride (Bell et al. 1987c). When the films were dried, they were cut into 1-cm squares with a razor blade and floated onto the surface of a jar containing distilled water. Three to five cleaned gold grids (grids were soaked with 100% acetone overnight, rinsed with absolute ethanol, and dried on filter paper) were placed onto a Formvar film square and these were deposited upside down on the surface of coverslips so that the grids (200-mesh hexagonal pattern) were sandwiched between the glass and the film. After drying, the Formvar film was coated with a layer of carbon under vacuum. The preparations were then sterilized by exposure to UV light for 72 hr. Before chromaffin cell plating, the coverslips containing the Formvar–carbon–coated gold grids were transferred into 35-mm plastic Petri dishes (Falcon) and coated with collagen. Dishes were placed under UV light for another 24 hr before chromaffin cell plating. Chromaffin cells were plated on coated grids and cultured as described above.
Preparation of the Cytoskeleton
Two-day-old chromaffin cells grown on Formvar-carbon–collagen-coated grids were washed three times with Locke's solution. Cells were then incubated in Locke's solution for 40 sec in the absence (control) or presence of 10 μM nicotine. At the end of the incubation period, the medium was quickly removed and preparations were incubated with 0.02% Na-azide in PBS for 15 min. Preparations were washed five times with PBS and then incubated with 1 mM of the crosslinking reagent disuccinimidyl suberate (DSS; Pierce Chemical, Rockford, IL) for 15 min. It has been previously shown that prefixation with homobifunctional N-hydroxy succinimide ester (homobifunctional crosslinker) before Triton X-100 extraction gives excellent preservation of cytoskeletal structures and increases the amount of actin retained in the cytoskeleton (Bell et al. 1988). Preparations were extracted with 0.6% Triton X-100 in 1 mM DSS for 5 min. This treatment was repeated one more time and preparations were washed once with 1 mM DSS for 5 min. Preparations were washed twice with PBS and fixed overnight with 2.5% glutaraldehyde (in 0.1 M sucrose and 0.1 M cacodylate buffer) and then subjected to successive treatments (5 min each) with 20, 30, 50, 70, 90, 95, and 100% acetone. Finally, the preparations were dried by critical point drying and carbon-coated for viewing under a Phillips 300 electron microscope at 40 kV. Micrographs were taken and the percentages of cells with disrupted cytoskeletons was determined from the photographs. To avoid personal bias and as with fluorescence microscopy, areas with disrupted cytoskeletons were counted without knowing whether cells were from control or treated preparations (single-blind design; see above).
Immunogold Labeling
Actin was identified by immunogold labeling. After blocking the cytoskeleton-containing grid preparations with 10% normal rabbit serum, the preparations were incubated with rabbit-raised antibodies against chicken gizzard γ-actin (dilution 1:200) for 60 min at 37C. The preparations were washed extensively with PBS and incubated with 5-nm colloidal gold-labeled goat anti-rabbit IgG (Janssen Pharmaceutics; Beerse, Belgium) in Tris-buffered saline (pH 8.2). The preparations were then washed several times with PBS. Preparations were dried by critical point drying and carbon-coated for viewing under a Phillips 300 electron microscope at 40 kV.
Results
Effect of Nicotinic Receptor Stimulation on Chromaffin Cell F-actin Networks
Treatment of cells with Triton X-100 removed many cellular proteins, leaving behind cytoskeletal structures (Vitale et al. 1991). This treatment was applied to chromaffin cells grown on electron microscopy grids for 48 hr. The preparations containing Triton X-100-insoluble material were then processed for electron microscopy as described in Materials and Methods. Resting chromaffin cells showed a compact network of filaments (Figures 1A and 1B), which in cortical subplasmalemmal areas had the tendency to run parallel to the plasma membrane. This particular arrangement of filaments can be observed better at higher magnifications (Figures 1A' and 1C-1E). Filaments in cortical areas had diameters between 6 and 7 nm. Forty-sec stimulation with 10 μM nicotine produced a disruption in the compact array of filaments seen in control resting cells, and polygonal areas in which filaments were few or absent appeared (Figures 2A-2E). These areas induced by nicotinic receptor stimulation could be better observed at higher magnifications (Figures 2A′, 2A″, 2D, and 2E). In some cases the filament-free areas were localized to a cell pole (Figure 2A) and in some others were more evenly distributed over the entire cytoskeleton surface (Figures 2B and 2C). Each area showing few or no filaments occupied an average surface of 0.46 ± 0.01 μm2 (n = 53; four or five areas per cell were measured in 11 cells). The frequency distribution of these areas is shown in Figure 3. The compact network of filaments observed, especially in subplasmalemmal areas, is formed by F-actin microfilaments, because they were decorated by gold particles after treatment of the specimens with antibodies raised against actin and colloidal gold-labeled goat anti-rabbit IgG (Figures 4A and 4B). The areas induced by stimulation, showing few or no microfilaments, were demarcated by actin microfilaments, as experiments with gold immunostaining demonstrated (Figure 4B). The shortest distance between two gold particle-decorated filaments was 51 ± 1.5 nm (n = 104) in control preparations, whereas in the areas of filament disruption shown in nicotine-stimulated cells the shortest distance between actin filaments was 12.7 times greater (649 ± 22 nm; n = 53).
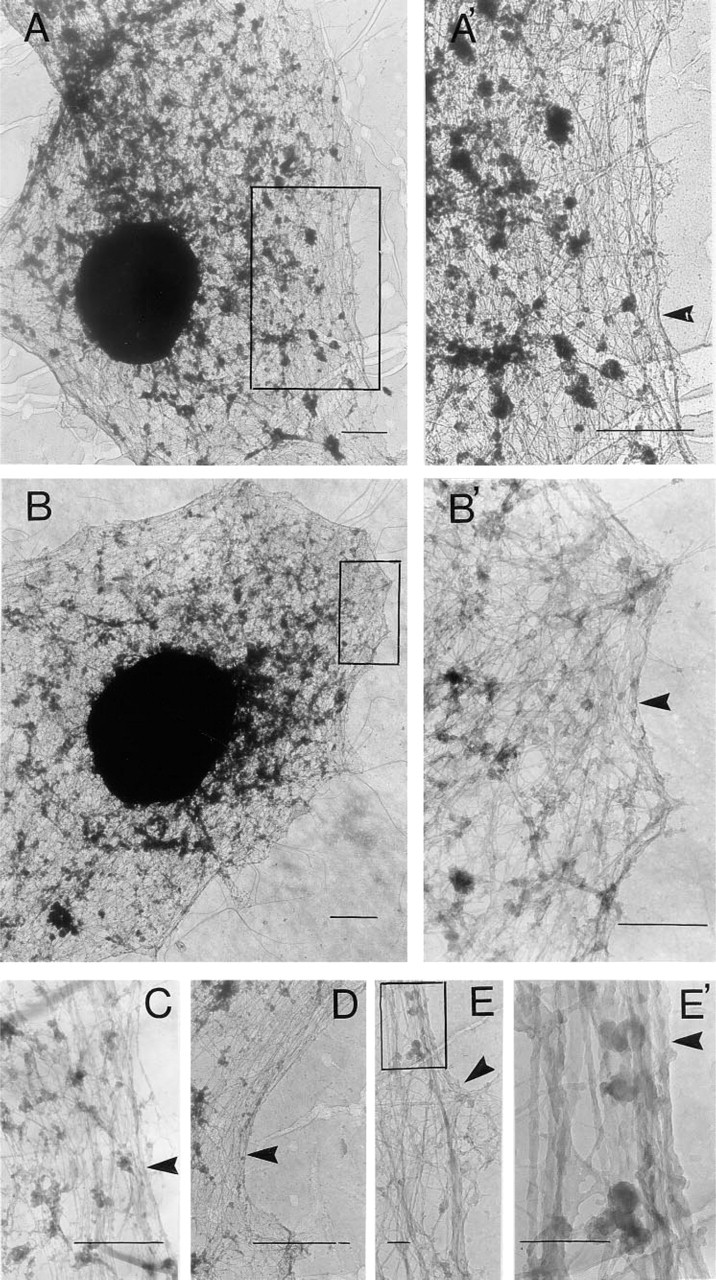
Electron micrographs of microfilament networks in resting chromaffin cells. Chromaffin cells were cultured on Formvar-coated grids for 48 hr and then incubated with Locke's solution for 40 sec. After this period, the preparations were treated with 0.02% Na-azide in PBS, prefixed with a bifunctional protein crosslinking reagent, and cytoskeletons were prepared by Triton X-100 extraction as described in Materials and Methods. (
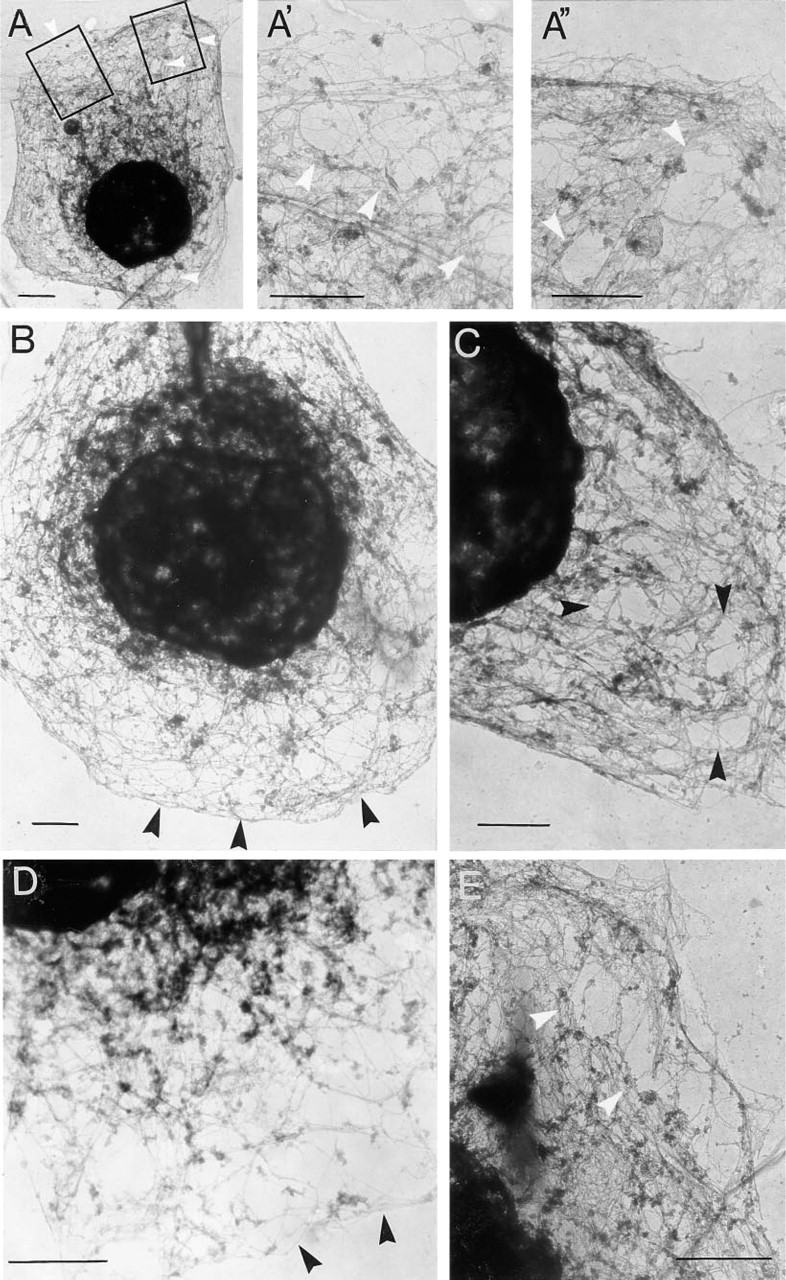
Electron micrographs of microfilament networks of chromaffin cells after nicotinic receptor stimulation. Chromaffin cells were cultured on Formvar-coated grids for 48 hr and then incubated with Locke's solution in the presence of 10 μM nicotine for 40 sec. After the stimulation period, cells were treated with 0.02% Na-azide in PBS, prefixed with a bifunctional protein crosslinking reagent, and cytoskeletons were prepared by Triton X-100 extraction as described in Materials and Methods. (
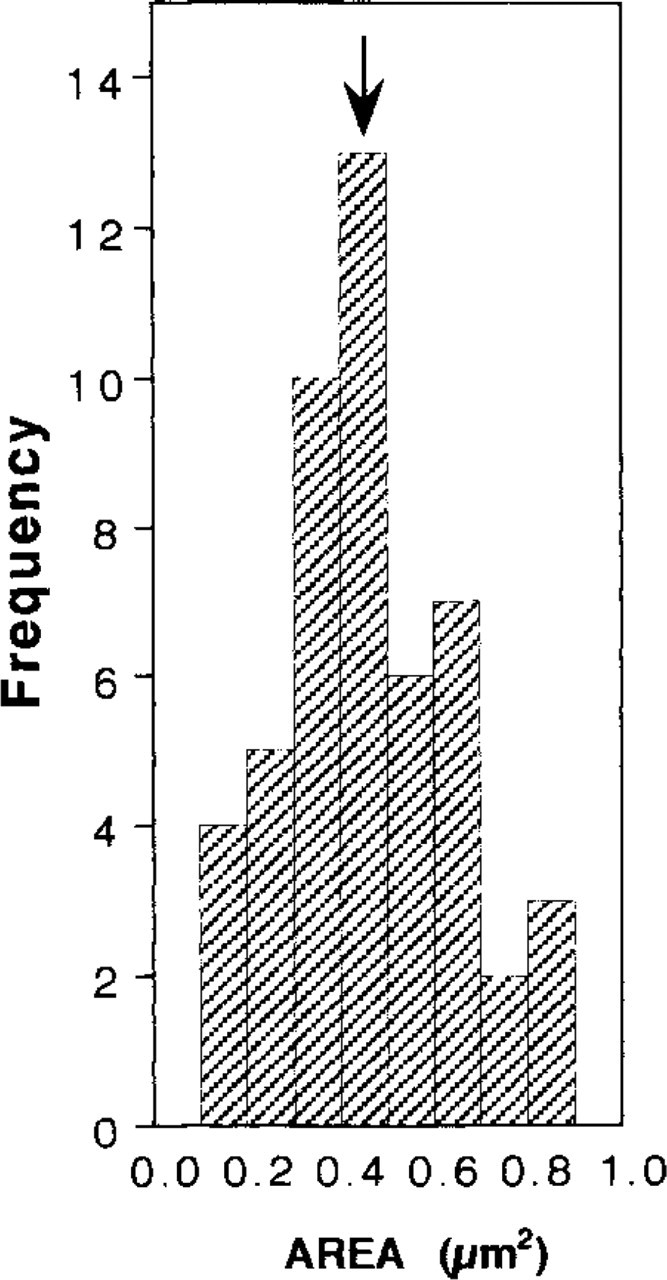
Frequency histogram of surface areas showing actin filament disruption in nicotine-stimulated chromaffin cells. Cells were cultured, stimulated, and treated as indicated in legend to Figure 2. The graph shows the distribution of 53 surface areas (4–5 areas/ cell) from 11 stimulated cells. The arrow indicates the average surface area.
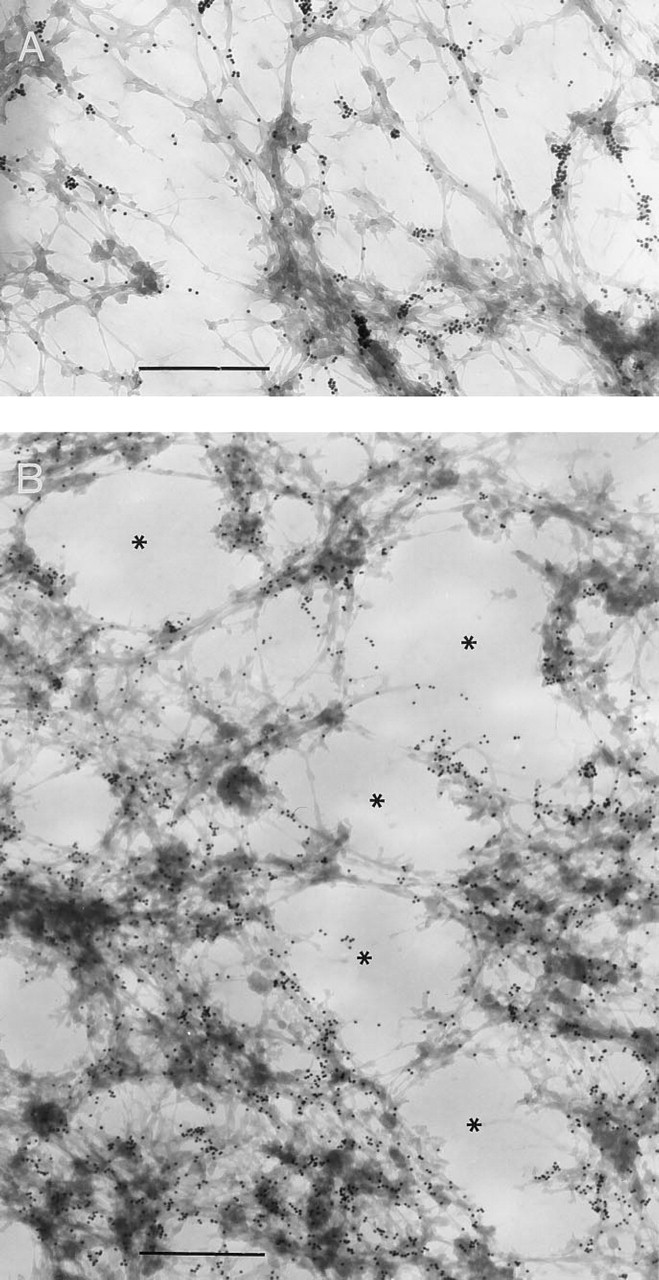
Electron micrographs of chromaffin cell microfilament networks immunostained with actin antibodies. Chromaffin cells were cultured on Formvar-coated grids for 48 hr and then incubated with Locke's solution for 40 sec in the absence (
Image Analysis of Nicotine-evoked F-actin Network Disassembly
Previous work from our laboratory at the fluorescence microscopic level has demonstrated that when resting chromaffin cells are stained with rhodamine-labeled phalloidin (a probe for filamentous actin), a cortical and continuous fluorescent ring of rhodamine fluorescence is observed (Vitale et al. 1991) (Figure 5A). Three-dimensional image analysis of this ring shows a uniform cortical fluorescent intensity pattern (Figure 5A). Stimulation of cells for 40 sec with 10 μM nicotine induced disruption of the uniform ring fluorescence (Figure 5A′). The cortical surface of stimulated cells showed patches of fluorescence. These patches appeared as peaks separated by valleys in the three-dimensional analysis (Figure 5A′). The valleys correspond to areas of F-actin disassembly, whereas the peaks represent areas in which the F-actin network remains intact (Figure 5A′).
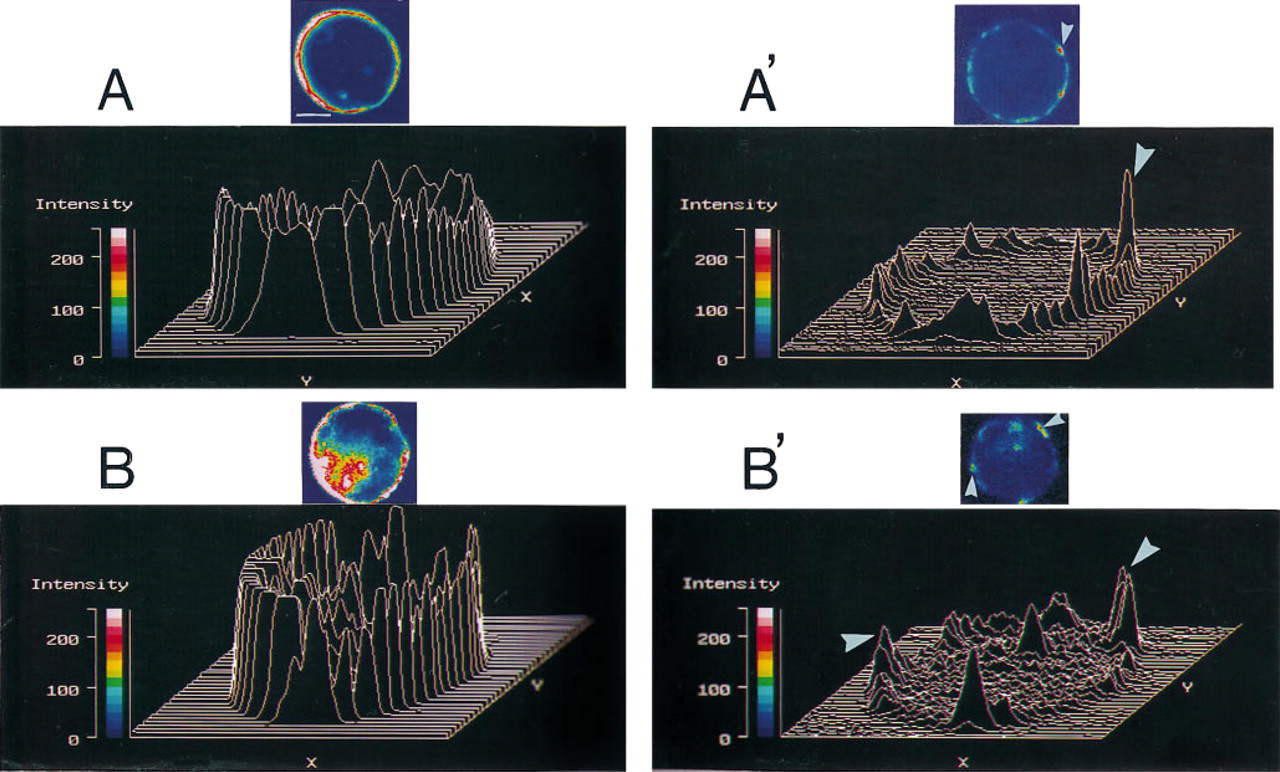
Comparison between rhodamine–phalloidin fluorescence patterns obtained from chromaffin cell cytoskeletons prepared for electron microscopy and those from intact chromaffin cells processed directly for fluorescence microscopy under resting and nicotinic receptor-stimulated conditions. Chromaffin cells were cultured for 48 hr on either Formvar-collagen-coated electron microscopic grids or collagen-coated coverslips. Preparations were incubated for 40 sec with Locke's solution in the absence (
To determine whether the valleys (areas of F-actin disassembly) observed in this three-dimensional analysis correspond to the polygonal areas showing either decrease or absence of microfilaments observed at the electron microscopic level, resting and stimulated cells previously cultured on grids were treated with Triton X-100, cytoskeletons were prepared as indicated in Materials and Methods, and the preparations were then processed for fluorescence microscopy using rhodamine-labeled phalloidin. Fluorescence microscopic patterns as well as the three-dimensional images obtained from these electron microscopic preparations were similar (Figures 5B and 5B′) to those observed when cells were grown on coverslips and processed directly for fluorescence microscopy, thus suggesting that the polygonal areas devoid of microfilaments observed at the electron micoscopic level correspond to the areas unstained by rhodamine–phalloidin. This idea gained support when the percentage of chromaffin cells that showed disrupted microfilament networks at the electron microscopic level (Figure 6A) were compared to the percentage of cells showing discontinuous (F-actin disassembly) rhodamine-fluorescent rings (Figure 6B) under control and stimulated conditions. Under these conditions, similar values were obtained when discontinuous fluorescent rings (fluorescence microscopy) or disrupted cytoskeleton areas (electron microscopy) were measured (Figures 6A and 6B).
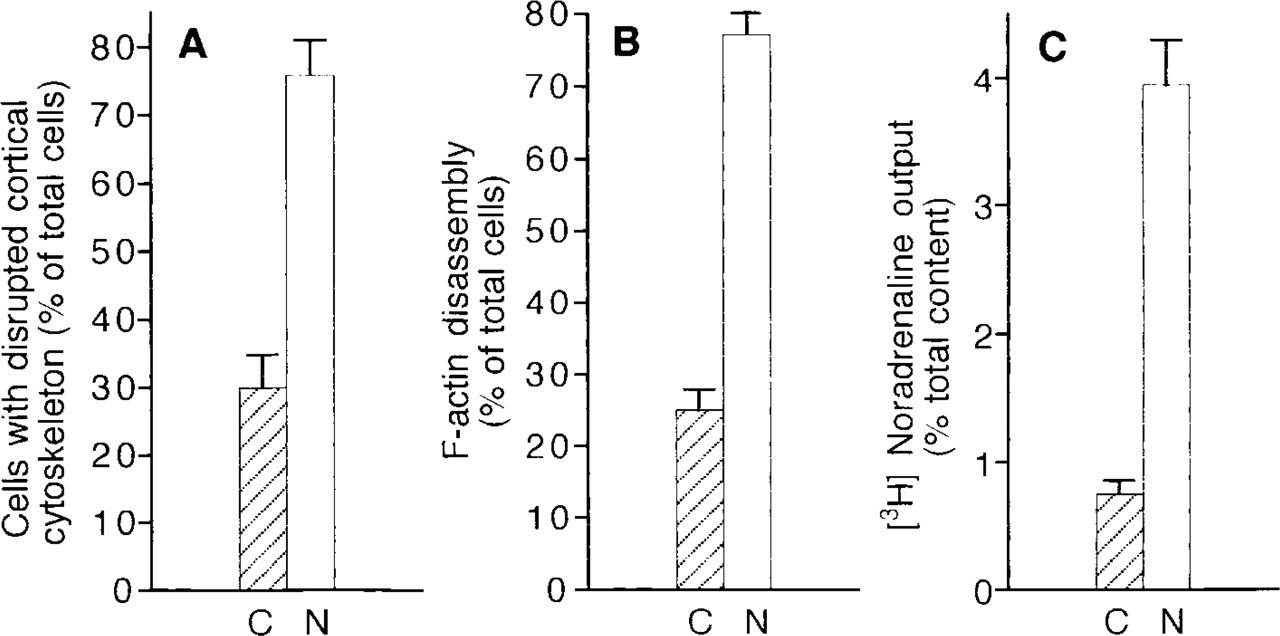
Effect of nicotinic receptor stimulation on chromaffin cell catecholamine release and F-actin dynamics: comparison between results obtained at electron microscopy and fluorescence microscopic levels. (
Nicotinic Receptor Stimulation Induces a Decrease in Chromaffin Cell F-actin Levels
The results described above were obtained from cells stimulated for 40 sec with 10 μM nicotine. Under similar experimental conditions, the cellular content of F-actin was measured by DNase-I inhibition assay. The F-actin content decreased by 38% in stimulated cells (Figure 7), thus showing once again the triggering of F-actin disassembly by nicotinic receptor stimulation. It should be also noted that under resting conditions F-actin represents 35 ± 6% of the total (G + F) chromaffin cell actin.
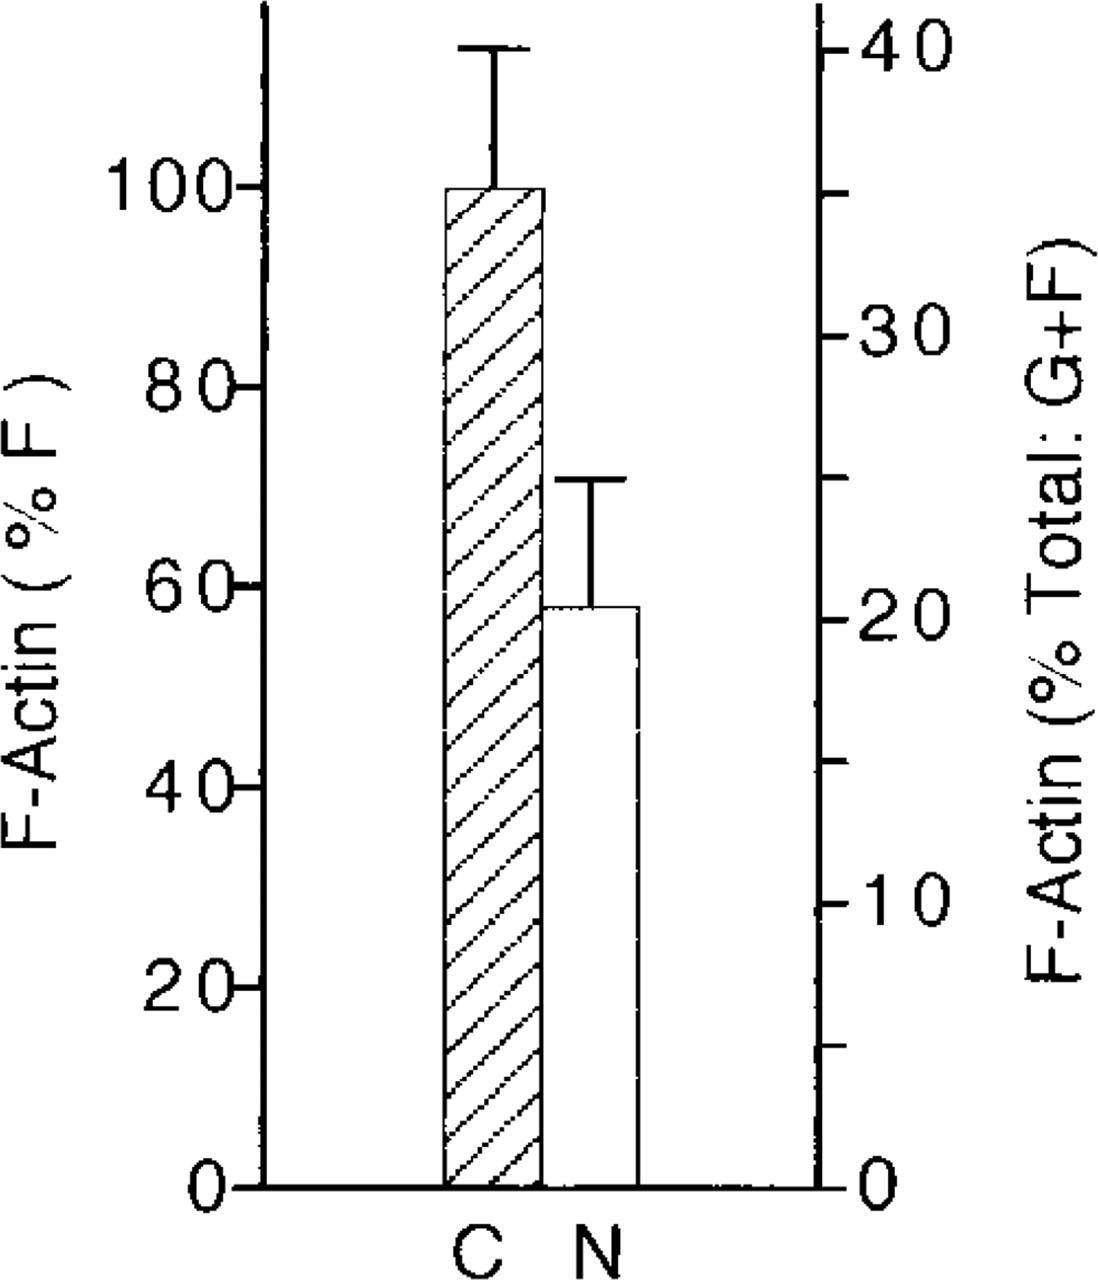
Effect of nicotinic receptor stimulation on chromaffin cell F-actin levels. Chromaffin cells were cultured on collagen-coated 35-mm Petri dishes (106 cells/dish) and then incubated for 40 sec with Locke's solution in the absence (C) or presence of 10 μM nicotine (N). At the end of the incubation period, cells were homogenized and actin was determined by the DNase I inhibition assay as described in Materials and Methods. Bars represent mean ± SEM of 12 different measurements.
Nicotinic Receptor Stimulation Increases [3H]-norepinephrine Output
Chromaffin cells previously labeled with [3H]-NE and stimulated with 10 μM nicotine for the same period of time (40 sec) showed a fivefold increase in [3H]-NE output (Figure 6C). Therefore, the fluorescence and electron microscopic results described above for stimulated cells came from cells fixed after a robust exocytotic discharge.
Discussion
Earlier work from our laboratory has demonstrated at the fluorescence microscopic level that resting chromaffin cells stained with rhodamine–phalloidin (a probe for filamentous actin) showed a bright and continuous cortical fluorescent ring and that this fluorescence pattern was disrupted by either nicotinic receptor stimulation or high K+-induced depolarization (Vitale et al. 1991). The lack of rhodamine–phalloidin staining in several cortical areas of stimulated chromaffin cells was interpreted as representing zones of F-actin disassembly (Vitale et al. 1991). However, no ultrastructural demonstration of F-actin network disassembly was provided in these earlier studies (Vitale et al. 1991). The present studies show that nicotinic receptor stimulation induces disruption of chromaffin cell F-actin networks. Electron microscopic examination of cytoskeletons prepared from cells stimulated by nicotine for 40 sec revealed polygonal areas with few or no actin filaments present. These areas are located in cellular zones occupied by F-actin filaments, as the immunogold experiments demonstrate. Furthermore, one of the most important findings in these studies is the demonstration that F-actin-free polygonal areas correspond to (a) the cellular cortical rhodamine–phalloi-din unstained areas observed at the fluorescence microsopic level and (b) the valleys (low fluorescence intensity zones) observed in three-dimensional image analysis. This assumption is based on the following observations: (a) after 40-sec nicotinic receptor stimulation, the percentage of cells showing disrupted F-actin cytoskeletons (polygonal areas) at the electron microscopic level was similar to the percentage of cells showing rhodamine–phalloidin patched fluorescence (discontinuous cortical fluorescent rings) at the fluorescence microscopy level; and (b) when cytoskeletons from the stimulated cells previously prepared for electron microscopic studies were stained with rhoda-mine–phalloidin, the cortical fluorescent patterns as well as the three-dimensional images (peaks and valleys) obtained were similar to those obtained from fluorescence microscopic studies of intact stimulated cells. The polygonal areas in which F-actin filaments are scarce or absent might be the result of stimulation-induced F-actin depolymerization, as the results obtained with the DNAse I inhibition assay showing a decrease in F-actin levels in stimulated cells indicate.
The observation at the electron microscopic level of areas with either intact (control) or disrupted (stimulated) microfilament patterns was possible by the use of specimen preparation techniques that allowed preservation of microfilament networks (Bell et al. 1988). Components of the cytoskeleton varied greatly in their solubility (Fey et al. 1984; Bell et al. 1987a,b). Cortical actin microfilaments appear to be less stable than those present in bundles or stress fibers. Therefore, prefixation helps to stabilize molecules and structures that will otherwise be lost from the cytoskeleton. The bifunctional protein crosslinking reagents used as prefixative in these experiments have the advantage that they can be used before and/or simultaneously with detergents. These agents are water-soluble and are active at physiological pH. Therefore, these crosslinkers not only preserve cytoskeleton components better but also allow the performance of co-relative morphological and biochemical studies.
The F-actin-severing activity induced by nicotine stimulation of chromaffin cells is due to activation of scinderin, a Ca2+-dependent severing protein present in chromaffin cells (Rodríguez Del Castillo et al. 1990; Vitale et al. 1991). Incubation of digitonin-permeabilized chromaffin cells with recombinant scinderin not only increased Ca2+-evoked F-actin disassembly but also enhanced Ca2+-dependent [3H]-NE output (Zhang et al. 1996). The effects of recombinant scinderin were blocked by scinderin-derived actin binding peptides (Zhang et al. 1996), suggesting again that F-actin disassembly is required for secretion. In this regard, the present results show that, under the experimental conditions in which the electron and fluorescent microscopic studies were performed, there was a fivefold increase in [3H]-NE output on nicotinic receptor stimulation. Previous studies, also from our laboratory, have demonstrated that when cortical F-actin disassembly is prevented, about 90% inhibition of stimulation-evoked [3H]-NE release is observed (Zhang et al. 1995). This observation, taken together with the finding that stimulation-evoked F-actin disassembly precedes stimulation-induced amine release (Vitale et al. 1991), strongly suggests a crucial role for F-actin in secretion.
The small [3H]-NE secretion in terms of percentage of total amine content (3–4%) induced by 40-sec nicotinic receptor stimulation can be considered unimportant. However, it should be pointed out that only 1–2% of the total number of secretory vesicles (1–2% total amine content) is available for immediate release (release-ready pool) (Neher and Zucker 1993; Vitale et al. 1995) and that only after cortical F-actin disassembly are additional secretory vesicles available for exocytosis (Vitale et al. 1995). Therefore, it is clear that the cortical F-actin network acts as a barrier to the secretory vesicles by blocking their movement towards the plasma membrane (Trifaró et al. 1982,1984; Cheek and Burgoyne 1986; Burgoyne and Cheek 1987; Son-tag et al. 1988). Therefore, 98–99% of the chromaffin vesicles form a reserve pool and remain in the resting cells behind a barrier of cortical F-actin (Vitale et al. 1995). Consequently, cortical actin network dynamics control the size (number of vesicles) of the release-ready vesicle pool and the rate of exocytosis (Vitale et al. 1995).
In conclusion, the results presented here provide ultrastructural evidence of the presence of areas of F-actin disassembly in stimulated chromaffin cells. These results, together with previous biochemical and fluorescence microscopic studies, strongly suggest a role for cortical F-actin networks in secretion.
Footnotes
Acknowledgements
Supported by a grant from the Medical Research Council of Canada to J-MT.
We are grateful to Ms L. Ohannessian-Barry for technical assistance and to Ms S. J. Dunn for typing the manuscript.