
Abstract
Experimental prevention of basal lamina (BL) thickening of retinal capillaries ameliorates early vascular changes caused by diabetes. Connective tissue growth factor (CTGF) is upregulated early in diabetes in the human retina and is a potent inducer of expression of BL components. We hypothesize that CTGF is causally involved in diabetes-induced BL thickening of retinal capillaries. To test this hypothesis, we compared the effects of streptozotocin (STZ)-induced diabetes on retinal capillary BL thickness between wild-type mice (CTGF+/+) and mice lacking one functional CTGF allele (CTGF+/-). Differences in BL thickness were calculated by quantitative analysis of electron microscopic images of transversally sectioned capillaries in and around the inner nuclear layer of the retina. We show that BL thickening was significant in diabetic CTGF+/+ mice compared with control CTGF+/+ mice, whereas diabetes did not significantly induce BL thickening in CTGF+/- mice. We conclude that CTGF expression is necessary for diabetes-induced BL thickening and suggest that reduction of CTGF levels may be protective against the development of diabetic retinopathy.
Keywords
D
Experimental prevention of BL thickening ameliorated early retinal vascular changes caused by diabetes (Roy et al. 2003; Oshitari et al. 2006). In galactose-fed rats, a model for type 2 diabetes, downregulation of fibronectin synthesis partly prevented retinal BL thickening but also reduced pericyte and endothelial cell loss (Roy et al. 2003). Combined downregulation of the mRNA levels of the extracellular matrix components fibronectin, collagen type IV, and laminin not only prevented the increase in their protein levels but also reduced vascular leakage in the retinas of rats with streptozotocin (STZ)-induced diabetes (Oshitari et al. 2006). These findings suggest that BL thickening is not just an epiphenomenon of the diabetic state but may be instrumental in the further development of sight-threatening DR. Modulation of BL thickening in humans may therefore have a preventive effect on the development of DR.
Connective tissue growth factor (CTGF), a potent pro-fibrotic factor, has been shown to induce production of collagen, fibronectin, and tissue inhibitors of matrix metalloproteases (TIMPs) under diabetic conditions in vitro (Riser et al. 2000; Wahab et al. 2001, 2005; Twigg et al. 2002; Gore-Hyer et al. 2003; McLennan et al. 2004). CTGF expression in the retina was found to be upregulated in rats treated with vascular endothelial growth factor (Kuiper et al. 2007a), after STZ-induced diabetes (Tikellis et al. 2004; Hughes et al. 2007), as well as in mice repeatedly infused with advanced glycation end products (AGEs) (Hughes et al. 2007). CTGF is expressed in vascular cells in the retina of diabetic humans with early diabetic microangiopathy (Kuiper et al. 2004) and is associated with fibrosis in the human diabetic eye (Kuiper et al. 2006).
Based on these findings, we hypothesize that CTGF plays a role in the early pathogenesis of DR by inducing capillary BL thickening and that reduction of CTGF levels is protective against diabetes-induced BL thickening as has been found recently in glomeruli in diabetic nephropathy in mice (Nguyen et al. in press). Therefore, we compared the effects of diabetes on retinal capillary BL thickness in wild-type mice (CTGF+/+) and mice lacking one functional CTGF allele (CTGF+/-).
Materials and Methods
Genetically Modified Mice
Animal experiments were performed in compliance with the Association for Research in Vision and Ophthalmology (ARVO) statement for the Use of Animals in Ophthalmic and Vision Research. Male BALBc/129Sv CTGF+/- mice (Ivkovic et al. 2003) were crossbred with CTGF+/+ female C57Bl/6J mice (Harlan; Horst, The Netherlands). The females of the F1 offspring (CTGF+/- and CTGF+/+ mice) were used for this study. The mice were genotyped and divided into four groups: control CTGF+/+, diabetic CTGF+/+, control CTGF+/-, and diabetic CTGF+/-. Diabetes was induced at 16 weeks of age by means of a single IP injection of STZ (Sigma; St. Louis, MO), 200 mg/kg dissolved in 100 mM sodium citrate buffer (pH 4.6). Control animals were injected with sodium citrate buffer alone. All animals were housed in a room with constant temperature and a 12-hr light/12-hr dark cycle and were allowed standard pellet laboratory chow and water ad libitum. Induction of diabetes was determined at 3 days after injection by measurement of blood levels of glucose (Medisense Precision Xtra; Abbott, Bedford, IN) and the marker of glycemic control, hemoglobin (Hb)A1c, by an immuno-turbidimetric assay (TinaQuant; Roche Diagnostics, Mannheim, Germany). Slow release insulin pellets (Linshin; Scarborough, Ontario, Canada) were used in diabetic mice to stabilize the condition of the animals for at least 17 weeks.
Because the principal aim of this experiment was to study the role of CTGF in diabetes-induced nephropathy (Nguyen et al. in press), urine samples were taken at 2, 4, 6, and 9 weeks after induction of diabetes. Because albuminuria, the main characteristic of nephropathy, was still absent at 9 weeks of diabetes, unilateral nephrectomy was performed on all animals to accelerate the development of nephropathy. Urine samples were taken at 17 weeks after induction of diabetes before the animals were killed. Blood was collected using EDTA as anticoagulant, and plasma was stored at −80C until analysis. The eyes were enucleated and snap frozen in liquid nitrogen and stored at −80C until analysis.
Measurements of CTGF and Transforming Growth Factor-β1 Levels
CTGF ELISA. CTGF levels in plasma and urine were determined by means of sandwich ELISA using two specific antibodies directed against distinct epitopes in the NH2-terminal half of the CTGF protein (FibroGen; South San Francisco, CA) as described previously (Roestenberg et al. 2006).
Quantitative RT-PCR. The mRNA levels of CTGF and transforming growth factor β1 (TGF-β1) in total renal cortex were quantified by real-time quantitative PCR. For this purpose, RNA was isolated from frozen sections of renal cortex using the RNeasy minikit (Qiagen; Hilden, Germany). cDNA synthesis was performed on 3 μg of RNA using oligo-dT12-18 and Superscript reverse transcriptase (Invitrogen; Carlsbad, CA).
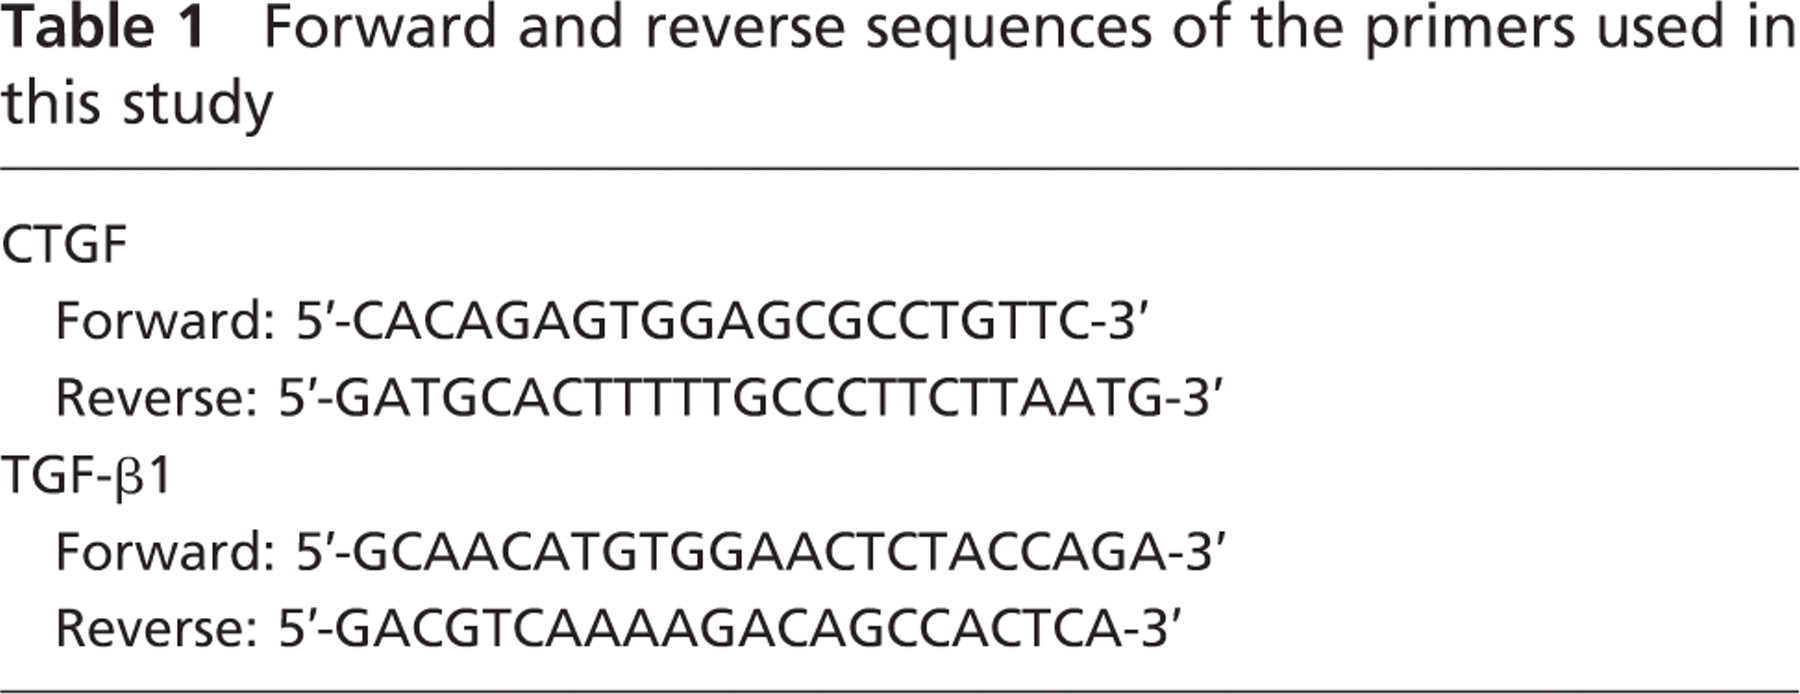
Quantitative RT-PCR was performed using a SYBR Green kit (Applied Biosystems; Foster City, CA) and analyzed on an ABI PRISM 7700 Sequence Detector System (Applied Biosystems). Genes and primer sequences are presented in Table 1. The thermal cycling comprised a denaturation step at 95C for 10 min, followed by 45 cycles of 95C for 15 sec and 60C for 1 min. To confirm that only one single PCR product was detected, the PCR products were analyzed using a heat dissociation protocol. Quantitative values were obtained from the threshold PCR cycle number, at which the increase in signal associated with an exponential growth of PCR product can be detected. The relative mRNA level in each sample was normalized using mRNA of the TATA box-binding protein.
Tissue Samples and Processing of the Mouse Eyes
In total, eyes of 17 mice were collected: 4 control CTGF+/+, 5 diabetic CTGF+/+, 5 control CTGF+/-, and 3 diabetic CTGF+/-. To study whether there was a possible effect of nephrectomy on BL thickness, the group of control CTGF+/+ mice consisted of two mice that underwent nephrectomy and two mice that were not nephrectomized. The number of animals in each group was low because of the limited availability of CTGF+/- mice. Therefore, we applied two different methods for measurement and statistical analysis (see below).
Forward and reverse sequences of the primers used in this study
Electron Microscopy
One eye of each mouse was cut in half and defrosted and fixed in Peter's fixative containing 1% paraformaldehyde (Sigma; Zwijndrecht, The Netherlands) and 1.25% glutaraldehyde (Sigma) buffered in 0.1 M sodium cacodylate (Sigma), pH 7.4, for 2 hr. Retinas were extracted and washed in Peter's buffer (sodium cacodylate 0.1 M, pH 7.4). The retinas were postfixed in osmium tetroxide (Merck; Haarlem, The Netherlands) supplemented with 1% potassium ferricyanide in Peter's buffer for 1 hr, subsequently dehydrated, and embedded in Epoxy resin (Epon 8.12; Merck). Ultrathin sections were cut from the resin block on a Reichert-Young ultramicrotome (Leica Microsystems; Nussloch, Germany) equipped with a Diatome diamond knife. Sections were mounted on 200-mesh naked copper grids.
Of each retina, 20–30 images of transversal sectioned capillaries in and around the inner nuclear layer were photographed at a magnification of ×40,000 using an EM 201 electron microscope (Philips; Eindhoven, The Netherlands) with a final on screen resolution of 3.7 nm. The images were analyzed with a validated software package (Cap-Image; Dr. H. Zeintl Engineering, Heidelberg, Germany).
Determination of BL Thickness
Two independent approaches to measure BL thickness were applied because of the low number of animals included in the experimental groups caused by the limited availability of CTGF+/- mice. For the first approach, 10 images of capillaries were randomly selected from the 20–30 images per retina, and measurements were made blindly. Images were projected against “a sun” with 20 equally spaced radial lines as described by Cuthbertson and Mandel (1986). Where the radial lines intersected the BL, BL thickness was measured. Both “inner” and “outer” BLs were defined according to Fischer and Gärtner (1983). The “inner” BM is positioned in between endothelial cell and pericyte as joint BL (jBL). The “outer” BL is positioned outside either endothelial cell (eBL) and/or pericyte (pBL) adjacent to surrounding glial tissue, respectively (Figure 1). Measurements were taken only when the cell membranes adjacent to the BL were visible as sharp dark lines. Capillaries were excluded from the study when <12 measurements could be made.
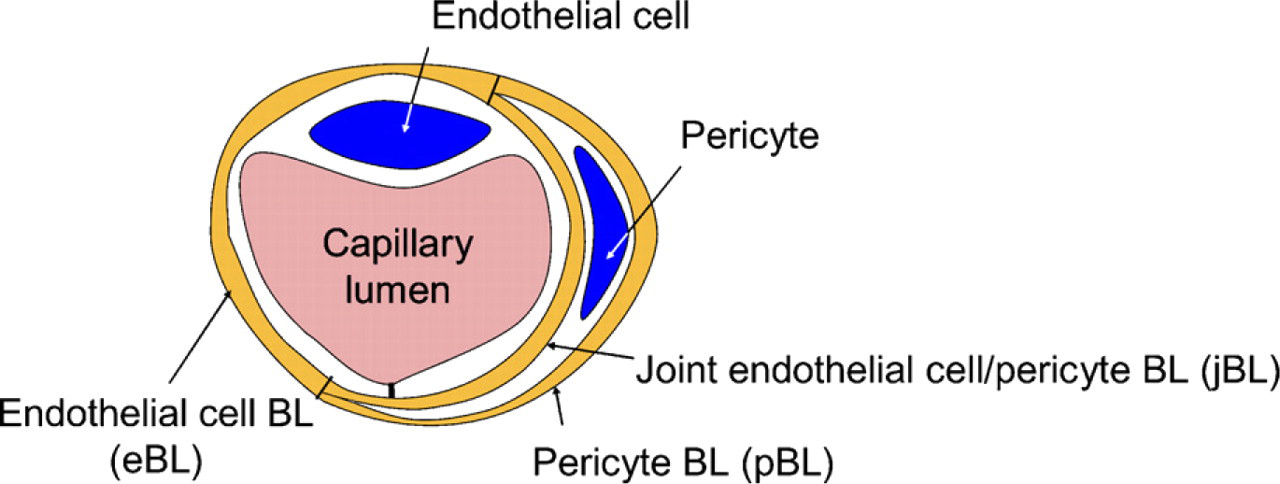
Schematic representation of a retinal capillary with an endothelial cell, a pericyte, and the basal lamina (BL) of the endothelial cell (eBL), the pericyte (pBL), and the joint BL between both cell types (jBL).
In addition, a second approach was followed to blindly measure the BL thickness in the same 10 randomly selected images of capillaries as described above according to Fischer and Gärtner (1983). In this case, the BL of each capillary was divided into three regions: BL of the endothelial cell (eBL), BL of the pericyte (pBL), and joint BL of both endothelial cell and pericyte (jBL) (Figure 1). The images were rastered, and in each raster, BL thickness was measured twice by drawing computer lines. Lines were drawn only when the cell membranes bordering the BL were visible as sharp dark lines. In this way, 10–20 measurements per region (30–60 per capillary) were made.
Statistical Analysis
Mean jBL thickness and mean eBL + pBL thickness were calculated per capillary (first method). Differences between jBL and eBL + pBL thickness among groups were analyzed using ANOVA with the repeated measurements option (SPSS 12.02; SPSS, Chicago, IL). In this way, individual mean values per capillary were used during analysis instead of mean values per mouse. For the second method, all data were transformed into rank cases because of a skewed distribution. ANOVA with repeated measurements was performed to calculate differences between the three capillary regions among the experimental groups; p<0.05 was considered statistically significant.
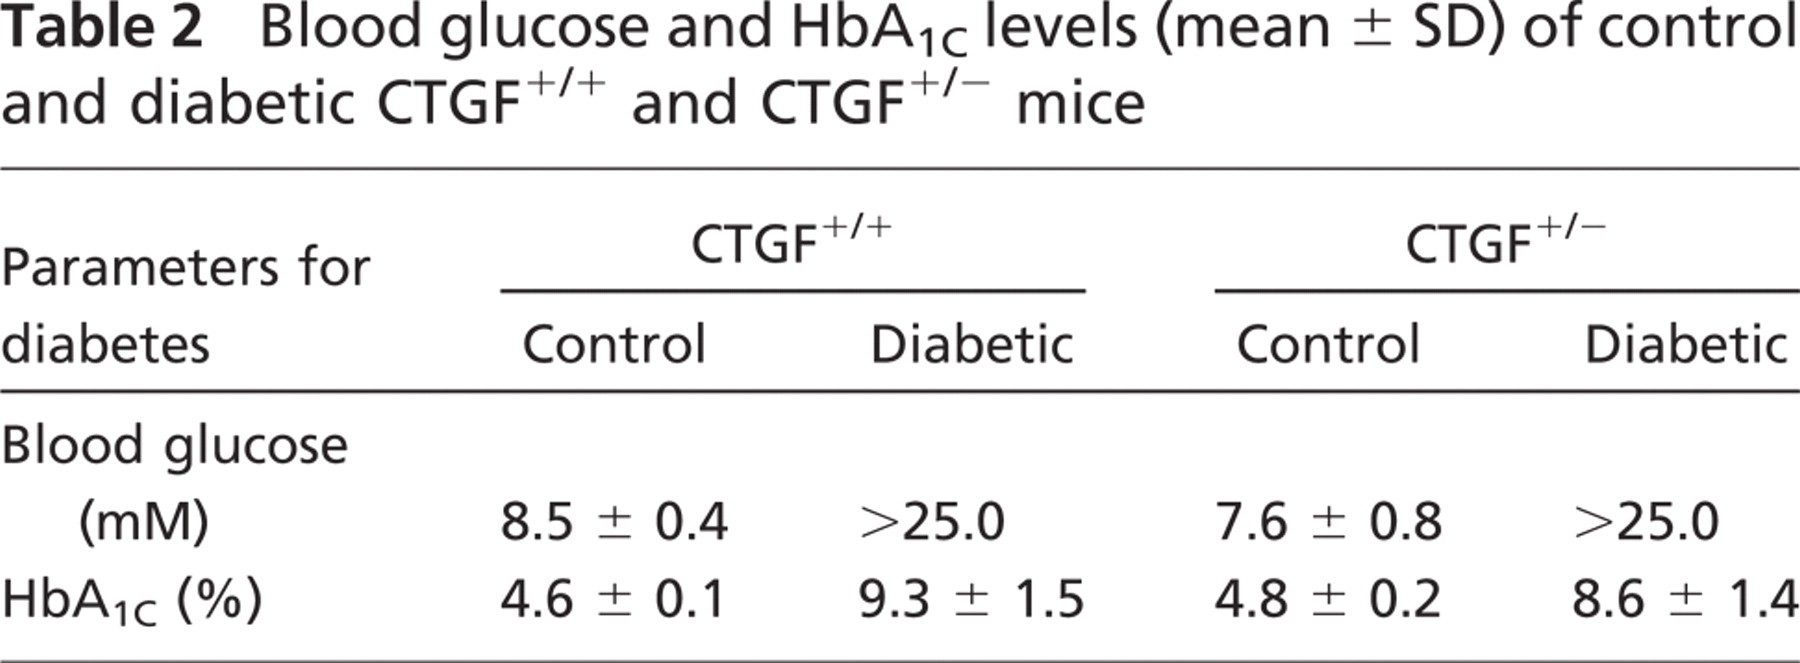
Blood glucose and HbA1C levels (mean ± SD) of control and diabetic CTGF+/+ and CTGF+/- mice
Results
Effect of Nephrectomy on BL Thickness of Retinal Capillaries
Nephrectomy did not affect the BL thickness in capillaries of the mouse retina (mean eBL + pBL thickness of control CTGF+/+ mice without nephrectomy was 0.148 μm and mean eBL + pBL of control CTGF+/+ mice with nephrectomy was 0.149 μm; p=0.875). Moreover, blood glucose and HbA1c levels were also similar in control CTGF+/+ mice as is shown by the small SD (Table 2). Therefore, control mice with and without nephrectomy were taken together in one control CTGF+/+ groux.
Induction of Diabetes
Diabetes was established in mice by measurement of blood glucose and HbA1c levels (Table 2). The difference in blood glucose and HbA1c levels between control animals and diabetic animals was highly significant (p<0.001), whereas the blood glucose and HbA1c levels did not differ between control CTGF+/+ and control CTGF+/+ mice and between diabetic CTGF+/+ and diabetic CTGF+/- mice.
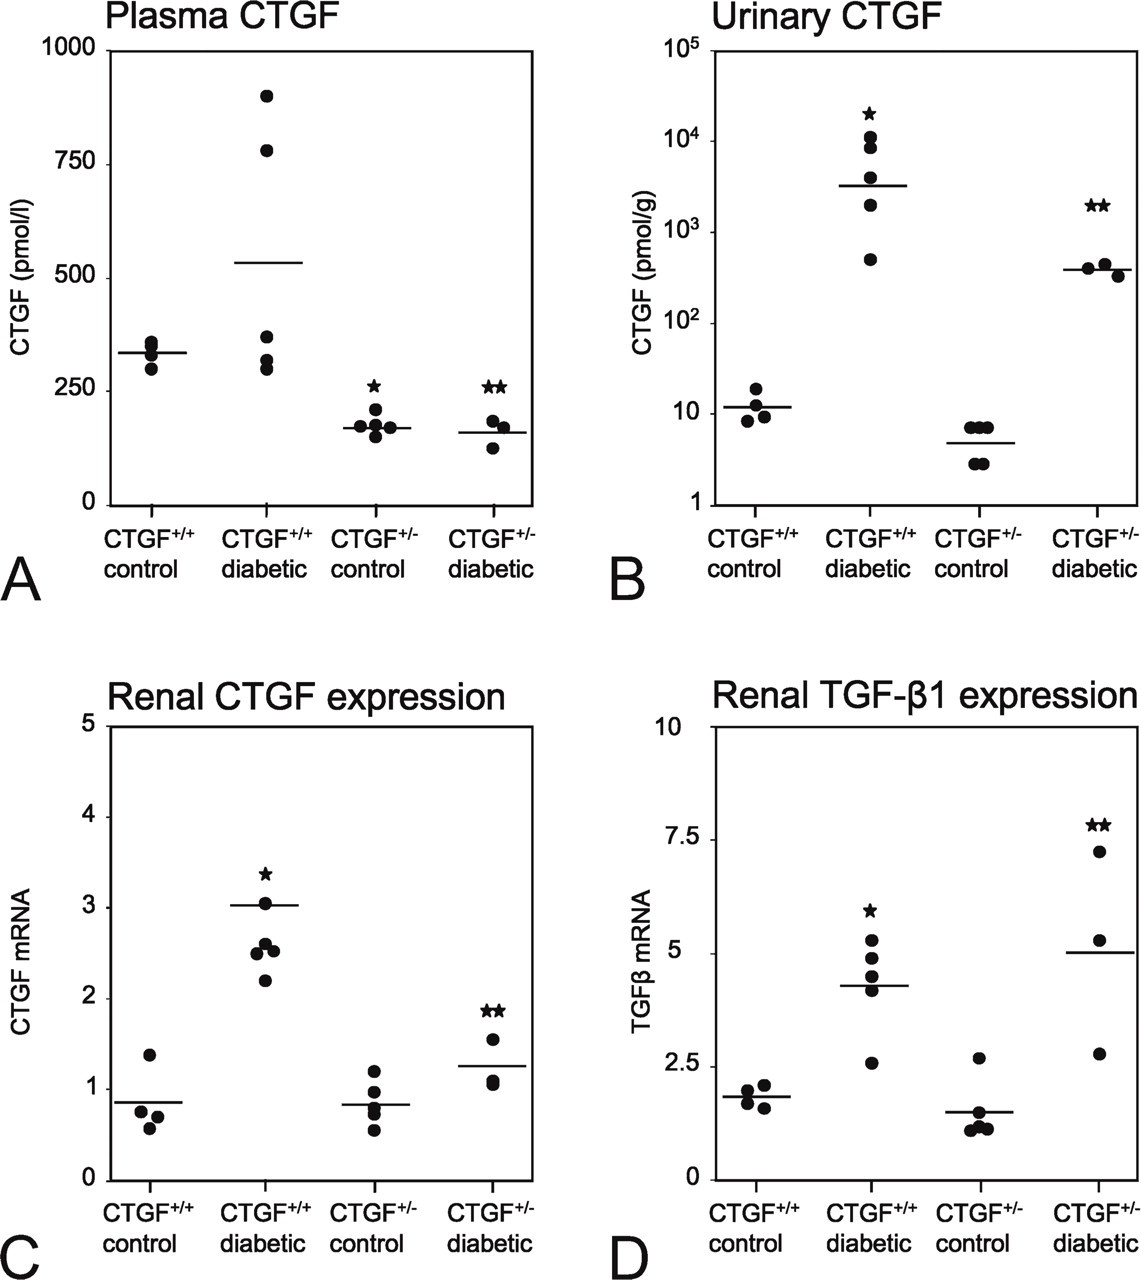
Connective tissue growth factor (CTGF) protein levels in plasma (
CTGF Gene-dose Effect
The gene-dose effect of the lack of one functional allele coding for CTGF was established in plasma and urine at the protein level (Figures 2A and 2B). In control mice, CTGF levels in plasma and urine were significant lower (∼50%) in CTGF+/- mice compared with CTGF+/+ mice. In diabetic mice, CTGF levels in plasma and urine in CTGF+/- mice were lower compared with CTGF+/+ mice, albeit not significant.
CTGF mRNA levels in the total renal cortex (Figure 2C) were not significantly different in control CTGF+/+ and CTGF+/- mice. However, in diabetic animals, there was a 3-fold increase in CTGF mRNA expression in total renal cortex of CTGF+/+ mice compared with control CTGF+/+ mice, whereas the increase in CTGF mRNA levels in diabetic CTGF+/- mice was only 1.5-fold compared with control CTGF+/+ mice. TGF-β1 mRNA levels in the total renal cortex (Figure 2D) were affected only by induction of diabetes and not by the CTGF genotype.
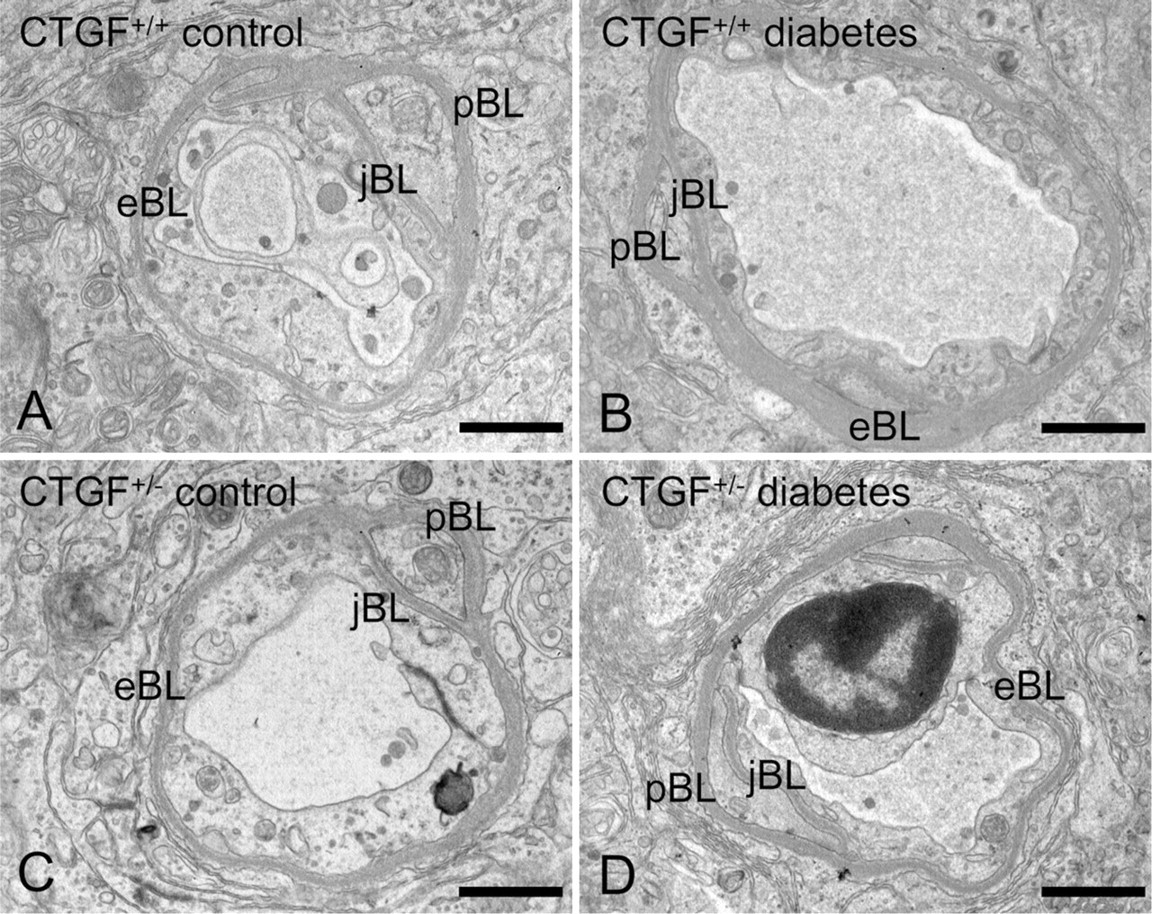
Examples of retinal capillaries analyzed qualitatively for BL thickness. The BLs are identified as endothelial BL (eBL), pericyte BL (pBL), and joint endothelial cell and pericyte BL (jBL). Note the diabetes-induced BL thickening in diabetic CTGF+/+ mice (
Effect of Diabetes on BL Thickness of Retinal Capillaries
Figures 3A and 3B show the effect of diabetes on the BL of endothelial cells and pericytes and their joint BL in CTGF+/+ mice. In particular, the eBL is thicker because of diabetes. Quantitative analysis of the BL thickness confirmed this. All regions of the BL as determined with the two quantitative methods showed increased BL thickness caused by diabetes in CTGF+/+ mice (Figure 4). This increase in thickness was significant of the eBL + pBL (p=0.03) as determined by the quantitative method of Cuthbertson and Mandel (1986) and the eBL (p=0.03) as determined by the quantitative method of Fischer and Gärtner (1983).
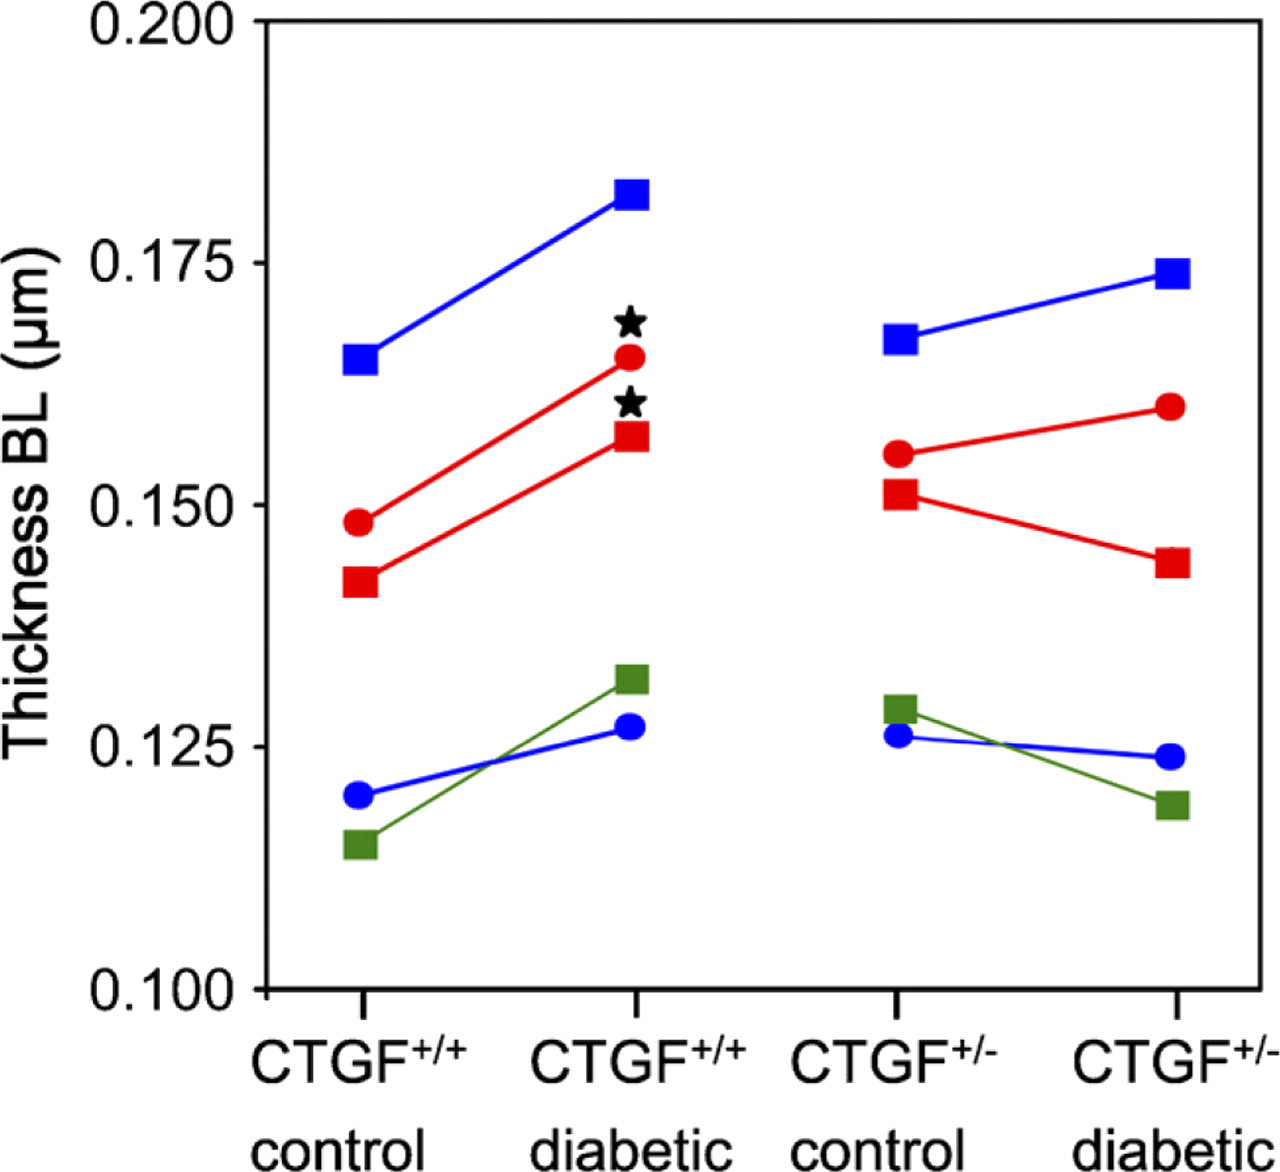
Quantitative analysis of the thickness of the BL in micrometers of retinal capillaries in control and diabetic CTGF+/+ and CTGF+/- mice. Thickness was measured and analyzed statistically using two different methods. The first method discriminated between the joint BL of endothelial cells and pericytes (jBL; blue circles) and that of either endothelial cells or pericytes (eBL + pBL; red circles). The second method discriminated three domains of the BL: eBL (red squares), pBL (blue squares), and jBL (green squares). Thickening of the BL caused by diabetes was significant only in CTGF+/+ mice in the eBL + pBL (red circles) and eBL (red squares). In the CTGF+/+ mice, diabetes resulted in thicker mean BL irrespective the domain, whereas the BL thickness was similar in control and diabetic CTGF+/- mice. SDs are omitted from the figure for reasons of clarity but varied between 10% and 20% of the mean thickness values in all groups. ∗, p<0.05.
In CTGF+/- mice, thickness of the BL was not affected by diabetes (Figures 3C and 3D). Quantitative analysis of the BL thickness (Figure 4) confirmed this lack of effect of diabetes in CTGF+/- mice.
Discussion
Our study showed that mice lacking one allele of the CTGF gene failed to develop capillary BL thickening in mouse retina after 4 months of diabetes. Our findings indicated that CTGF is necessary for BL thickening and identified CTGF as a possible therapeutic target to prevent this early change in the retina caused by diabetes. That this may be a clinically relevant approach is indicated by recent studies that have shown that prevention of BL thickening can ameliorate the subsequent development of acellular capillaries in rodent models of diabetes (Roy et al. 2003; Oshitari et al. 2006).
We detected a significant increase in particularly the endothelial cell BL in diabetic CTGF+/+ mice compared with control CTGF+/+ mice. Both independent quantitative methods showed similar results despite the limited number of CTGF+/- mice that were available. The observed thickening of the eBL and pBL but not the joint BL caused by diabetes in mice has been noted previously (Fischer and Gärtner (1983). Remarkably, the effect of diabetes on BL thickness was absent in the CTGF+/- mice.
BL thickness of retinal capillaries was quantified in EM micrographs. Ideally, the specimens should have been physically fixed using rapid high-pressure freezing (Hohenberg et al. 1996) instead of chemical fixation that we applied. However, rapid high pressure freezing can only be performed on small pieces of tissue, whereas we needed larger pieces to find sufficiently enough capillaries to analyze. The ultrastructure of the BLs that have been analyzed was good (Figure 3). Moreover, the preparation procedures for EM have resulted in high-quality ultrastructure in previous studies (Blaauwgeers et al. 1999; Hofman et al. 2000).
The diabetic state of these CTGF+/- mice was comparable with that of CTGF+/+ mice, as indicated by similar blood glucose and HbA1c levels. However, there was a clear genotype effect on CTGF expression in the CTGF+/- mice. The lack of one functional allele coding for CTGF was associated with ∼50% lower CTGF protein expression levels in plasma and urine of control animals. Although the CTGF mRNA levels were not different in control CTGF+/+ and control CTGF+/- mice, a genotype effect on CTGF mRNA levels was evident in diabetic mice. Renal CTGF mRNA levels in diabetic CTGF+/- mice were only 50% of those in diabetic CTGF+/+ mice. Local ocular CTGF mRNA and protein levels were not analyzed in this study. However, the above-mentioned renal and systemic levels of CTGF suggest that the lower levels of circulating and possibly also retinal CTGF protein in our CTGF+/- mice may have prevented diabetes-induced BL thickening in retinal capillaries. Moreover, a similar genotypic effect was found in BL of mouse glomeruli during diabetic nephropathy (Nguyen et al. in press).
This finding is in line with the known function of CTGF as a potent inducer of synthesis of the extracellular matrix components (Paradis et al. 2001; Riser and Cortes, 2001; Twigg et al. 2001, 2002; Wahab et al. 2001; Wang et al. 2001; Gore-Hyer et al. 2003; McLennan et al. 2004; Zhou et al. 2004; Hughes et al. 2007; Kuiper et al. 2007a). In general, CTGF exerts these effects as a downstream mediator of TGF-β on cell proliferation, differentiation, and production of extracellular matrix components (Grotendorst, 1997; Duncan et al. 1999; Leask and Abraham 2003). However, CTGF itself is also capable of exerting these functions (Blom et al. 2001; Brigstock 2003), whereas it also has been shown that CTGF is not involved in angiogenesis (Kuiper et al. 2007b).
A causal role of TGF-β in the induction of capillary BL thickening has already been shown in brain capillaries in the mouse, as well as in diabetes-induced BL thickening of glomerular capillaries in the kidney (Wyss-Coray et al. 2000; Fujimoto et al. 2003; Wolf et al. 2005; Nguyen et al. in press). However, inhibition of TGF-β to prevent BL thickening, thereby ameliorating early retinal vascular changes caused by diabetes, may have severe adverse effects because of its important physiological functions in tumor suppression and dampening of inflammation (Leask and Abraham 2004). Because CTGF can also be upregulated independently of TGF-β by high glucose levels through activation of the renin-angiotensin system (Ruperez et al. 2003; Rodriguez-Vita et al. 2005; Ko et al. 2006), by AGEs (Wang et al. 2001; Hughes et al. 2007) and by vascular endothelial growth factor (Kuiper et al. 2007a), CTGF could be a more attractive therapeutic target to attenuate diabetes-induced BL thickening of retinal capillaries.
Footnotes
Acknowledgements
This study was supported by Diabetes Fonds Nederland Grant 2001.042 and the Edmond and Marianne Blaauwfonds. The funding organization had no participation in the design or conduct of this study, collection of data, management, analysis, interpretation, preparation, review, or approval of this manuscript.
The authors thank Jan Klooster, Ilse Vogels, Jan van Marle, and Michael Tanck for sharing their expertise.