
Abstract
Early retinal vascular changes in the development of diabetic retinopathy (DR) include capillary basal lamina (BL) thickening, pericyte loss and the development of acellular capillaries. Expression of the CCN (connective tissue growth factor/cysteine-rich 61/nephroblastoma overexpressed) family member CCN2 or connective tissue growth factor (CTGF), a potent inducer of the expression of BL components, is upregulated early in diabetes. Diabetic mice lacking one functional CTGF allele (CTGF+/−) do not show this BL thickening. As early events in DR may be interrelated, we hypothesized that CTGF plays a role in the pathological changes of retinal capillaries other than BL thickening. We studied the effects of long-term (6-8 months) streptozotocin-induced diabetes on retinal capillary BL thickness, numbers of pericytes and the development of acellular capillaries in wild type and CTGF+/− mice. Our results show that an absence of BL thickening of retinal capillaries in long-term diabetic CTGF+/− mice is associated with reduced pericyte dropout and reduced formation of acellular capillaries. We conclude that CTGF is involved in structural retinal vascular changes in diabetic rodents. Inhibition of CTGF in the eye may therefore be protective against the development of DR.
Keywords
Introduction
The vision-threatening clinical manifestations of diabetic retinopathy (DR) are preceded by a long pre-clinical phase (PCDR). During the 5–15 years of PCDR, hyperglycemia induces a number of pathological changes in the retinal vasculature (Frank 2004), such as diffusely increased permeability, thickening of the retinal capillary basal lamina (BL), loss of pericytes, degeneration of endothelial cells and neurons, and the development of acellular capillaries (Roy et al. 2010). The acellular capillaries eventually develop into expanding areas of capillary non-perfusion, retinal ischemia and other clinical signs of DR.
The exact sequence of the pre-clinical events, their interrelation and their relative importance in the development of DR are not clear yet. Pericytes that maintain capillary stability and regulate homeostasis of the endothelium (Hammes et al. 2002) are lost early in the diabetic retina. This loss is associated with altered activity of factors, such as platelet-derived growth factor (PDGF)-β and transforming growth factor (TGF)-β, which control survival and differentiation of pericytes in their interaction with the endothelium (Hammes et al. 2004; Hammes 2005). The angiopoietin (Ang)/Tie-2 system is also involved, as Ang-2 is upregulated early in diabetes and is associated with pericyte dropout in retinal capillaries in DR (Feng et al. 2007; Pfister et al. 2008, 2010). The loss of pericytes leads to reduced numbers of endothelial cells and contributes ultimately to the formation of non-perfused acellular capillaries (Hammes et al. 1995; Hammes 2005; Feng et al. 2007; Pfister et al. 2008, 2010).
In addition to pericyte loss, another early structural change is thickening of the BL of capillaries in the inner retina. This is the result of extracellular matrix (ECM) remodeling which leads to increased deposition of BL components, such as collagen type IV, laminin and fibronectin (Nishikawa et al. 2000), and occurs in both diabetic animals and humans (Friedenwald and Day 1950; Mansour et al. 1990; Gardiner et al. 1994; Stitt et al. 1994; Curtis et al. 2009). Inhibition of diabetes-induced BL thickening in rodent models brought about by modulation of BL components has been shown to prevent diabetic vascular changes, such as retinal pericyte loss, formation of acellular capillaries and vascular leakage (Roy et al. 2003, 2011; Oshitari et al. 2006). These findings suggest that BL thickening may be critical in the further development of DR into the clinical phase.
Connective tissue growth factor (CTGF) is a member of the connective tissue growth factor/cysteine-rich 61/nephroblastoma overexpressed (CCN) family of matricellular proteins and is also known as CCN2 (Leask and Abraham 2003). It is a potent pro-fibrotic factor involved in ECM synthesis, and its levels are increased under diabetic conditions (Twigg et al. 2001; Wahab et al. 2001). CTGF functions as a downstream mediator of TGF-β signaling and may act as a co-factor for the pro-fibrotic actions of TGF-β (Duncan et al. 1999; Khankan et al. 2011), but can also induce ECM synthesis independently (Zhou et al. 2004).
Increasing evidence points to an important role of CTGF in the pathogenesis of both PCDR and proliferative DR (PDR) (Kuiper et al. 2004, 2006, 2007, 2008a, 2008b; Hughes et al. 2007; Van Geest et al. 2012, 2013). In the retina of rodents, CTGF is upregulated in streptozotocin (STZ)-induced diabetes, as well as after intravitreal injection of VEGF and after systemic infusion with advanced glycation end-products (AGEs) (Hughes et al. 2007; Kuiper et al. 2007). CTGF protein is expressed in pericytes in the retina of diabetic humans with early DR but not in normal retina (Kuiper et al. 2004). In cultured retinal vascular cells, CTGF expression is induced by VEGF in pericytes and endothelial cells and by TGF-β in pericytes but not in endothelial cells (Kuiper et al. 2007; Van Geest et al. 2010). Moreover, in vitreous of diabetic patients without clinical signs of DR, CTGF levels are increased (Van Geest et al. 2013). In patients with PDR, CTGF is associated with fibrosis and, in a critical balance with VEGF, with the induction of the angio-fibrotic switch (Kuiper et al. 2006, 2008a; Van Geest et al. 2012).
The role of CTGF in angiogenesis remains unclear. This is because, in some circumstances, it acts as a proangiogenic factor (Chintala et al. 2012), whereas, in other circumstances, it acts as an antiangiogenic factor (Inoki et al. 2002). We have previously reported that, in a rodent model of PCDR, mice lacking one functional CTGF allele (CTGF+/−) did not show the BL thickening observed in diabetic wild type mice after 17 weeks of experimentally-induced diabetes (Kuiper et al. 2008b). A recent study in CTGF−/− mice embryos suggests that CTGF is required for normal levels of fibronectin expression and also for pericyte recruitment during development, in part by potentiating PDGF signaling (Hall-Glenn et al. 2012); thus, we hypothesized that elevated CTGF levels may not only have a role in BL thickening in PCDR, but also in pericyte loss and other pathological changes in PCDR. Therefore, we studied the effects of CTGF haploinsufficiency on retinal capillary BL thickness, numbers of pericytes and endothelial cells in retinal capillaries, and on the development of acellular capillaries in long-term experimentally-induced diabetes in wild type (CTGF+/+) mice and CTGF+/− mice.
Methods
Animal Experiments
Animal experiments were performed with the approvalof the Animal Ethics Committee of the University of Amsterdam and in compliance with the Association for Research in Vision and Ophthalmology (ARVO) statement for the Use of Animals in Ophthalmic and Vision Research.
CTGF+/− mice, in which exon 1 of one of the CTGF alleles was replaced by a neomycin-resistance gene, were crossed back on a C57BL/6 background (Harlan, Horst, The Netherlands) (Ivkovic et al. 2003). Male and female mice of the eighth generation or later were used in the present study, and were compared with male and female wild type littermates. Each group contained approximately as many males as females. Genotyping was performed with 100 ng DNA isolated from ear punches following a standard procedure using the following primers: 5’-TGTGTAGGACTTCATTCAGTTCT-3’, 5’-GTCTGTGATCGCAGCTCACTC-3’ and 5’-ATGGCCGCTTTTCTGGATTC-3’.The resulting products yielded a 400-bp product for the wild type and a 560-bp product for the CTGF-neomycin construct.
Diabetes was induced by means of a single intraperitoneal injection of 200 mg/kg STZ (Sigma-Aldrich, St. Louis, MO), dissolved in 100 mM sodium citrate buffer, pH 4.5. Control animals were injected with buffer alone. Hyperglycemia was determined at 3 days after injection by measuring blood glucose levels (Medisense Precision Xtra; Abbott, Bedford, IL). Non-responders were injected with a second dose of STZ. Slow-release insulin pellets (Linshin, Scarborough, ON, Canada) were implanted to stabilize the condition of the diabetic animals at 5 days after STZ injection. Mice were monitored daily for weight loss and their clinical condition. Blood was withdrawn by cheek puncture for glucose measurements at 1, 3, 6 and 8 months after induction of diabetes and on indication. Blood glucose levels >20 mmol/l warranted re-implantation of a slow-release insulin pellet. In general, mice received an insulin pellet each 4–6 weeks. Glycosylated haemoglobin (HbA1C) was measured on an automated HA8140 HPLC analyzer (Menarini Diagnostics, Florence, Italy). Animals were fed a standard laboratory chow with a daily addition of mash food. All mice were housed in a temperature- and humidity-controlled room with a 12-hr light/dark cycle.
Mice were killed at 6–8 months after induction of diabetes by a ketamine-xylazine-atropine injection. One eye from each animal was enucleated and snap-frozen in liquid nitrogen and stored at -80C until analysis, and the other eye was immediately fixed for electron microscopy (EM). The numbers of animals in each experimental group are shown in Table 1.
Control and Diabetic CTGF+/+ and CTGF+/− Mice Have Similar Characteristics and the Same Degree of Diabetes.
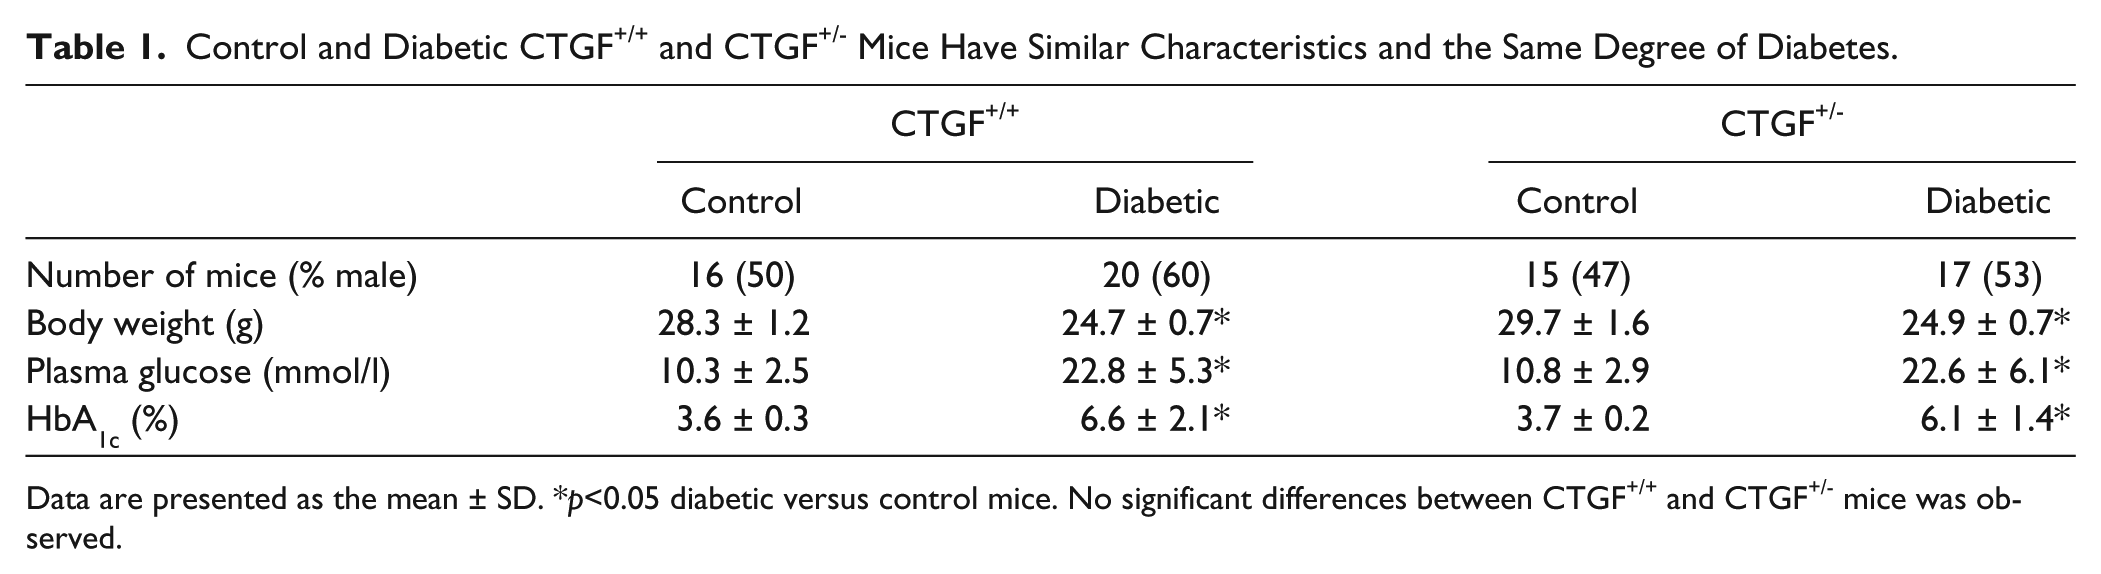
Data are presented as the mean ± SD. *p<0.05 diabetic versus control mice. No significant differences between CTGF+/+ and CTGF+/− mice was observed.
Western Blot Analysis
Retinas of 2–4 diabetic and non-diabetic wild type and CTGF+/− mice were isolated at 8 months after induction of diabetes and pooled in 100 μl lysis buffer (1% Triton X-100, 50 mM HEPES, 150 mM NaCl, 10% glycerol, 1.5 mM MgCl2, 1 mM EGTA, 1× phosphatase inhibitors and 1× Complete Protease Inhibitors; Roche Biochemicals, Almere, The Netherlands). Samples were homogenized with a pestle, vigorously vortexed and frozen overnight. Samples were thawed and vortexed and then centrifuged at 4C for 20 min at 14,000 ×g. Supernatants were collected in new vials and stored at -80C. The protein concentration of each sample was determined with a Bradford Assay Kit (Bio-Rad, Hercules, CA).
Western blots were performed as described previously (Van Geest et al. 2010). Briefly, 60 µg of protein was separated on a 12.5% SDS-PAGE gels and staining was performed using a rabbit polyclonal anti-CTGF antibody (ab6992; Abcam, Cambridge, UK), diluted 1:1000, overnight at 4C. Rabbit anti-β-actin antibody (1:10,000; Sigma-Aldrich) was used on the same blots as a loading control. A horseradish peroxidase-conjugated secondary anti-rabbit antibody (Sigma-Aldrich) was used to visualize protein bands, and imaging was performed using digital scanning of the enhanced chemiluminescence (ECL) signal (Roche) with an image-capturing device (LAS-3000; Fujifilm Corporation, Tokyo, Japan). All western blot experiments were performed in duplicate.
Electron Microscopy
Eyes for EM were prepared as described previously(Kuiper et al. 2008b). Briefly, eyes were incubated in freshly-prepared McDowell’s fixative in 0.1 M sodium cacodylate buffer, pH 7.4, directly after enucleation. The retinas were then further incubated in a fresh solution of McDowell’s fixative in 0.1 M sodium cacodylate buffer, pH 7.4. Then, the retinas were washed in 0.1 M sodium cacodylate buffer, pH 7.4, and were post-fixed in 1% osmium tetroxide (Merck, Haarlem, The Netherlands) in double-distilled water for 1 hr, subsequently dehydrated, and embedded in Epoxy resin (Epon LX-812; Merck). Ultrathin sections were cut from the resin block on a Reichert-Young ultramicrotome equipped with a diamond knife (Reichert, Depew, NY). Sections were mounted on copper slot grids.
Images were taken of transversally sectioned capillaries in and around the inner nuclear layer, and in the middle sector of the retina between the optic disc and the peripheral retina. Approximately 20 images were taken of each retina at a magnification of ×11,500 on a Technai 12 EM (FEI, Eindhoven, The Netherlands).
Measurement of BL Thickness
Measurements of BL thickness of retinal capillaries were performed as described previously (Kuiper et al. 2008b). Twelve EM images of capillaries were randomly selected per individual retina and a grid with 20 equally spaced radial lines was overlaid (Fig. 1A) (Cuthbertson and Mandel 1986). Where the radial lines intersected the BL, BL thickness was measured using a validated software package (CapiScope; KK Technology, Devon, England).
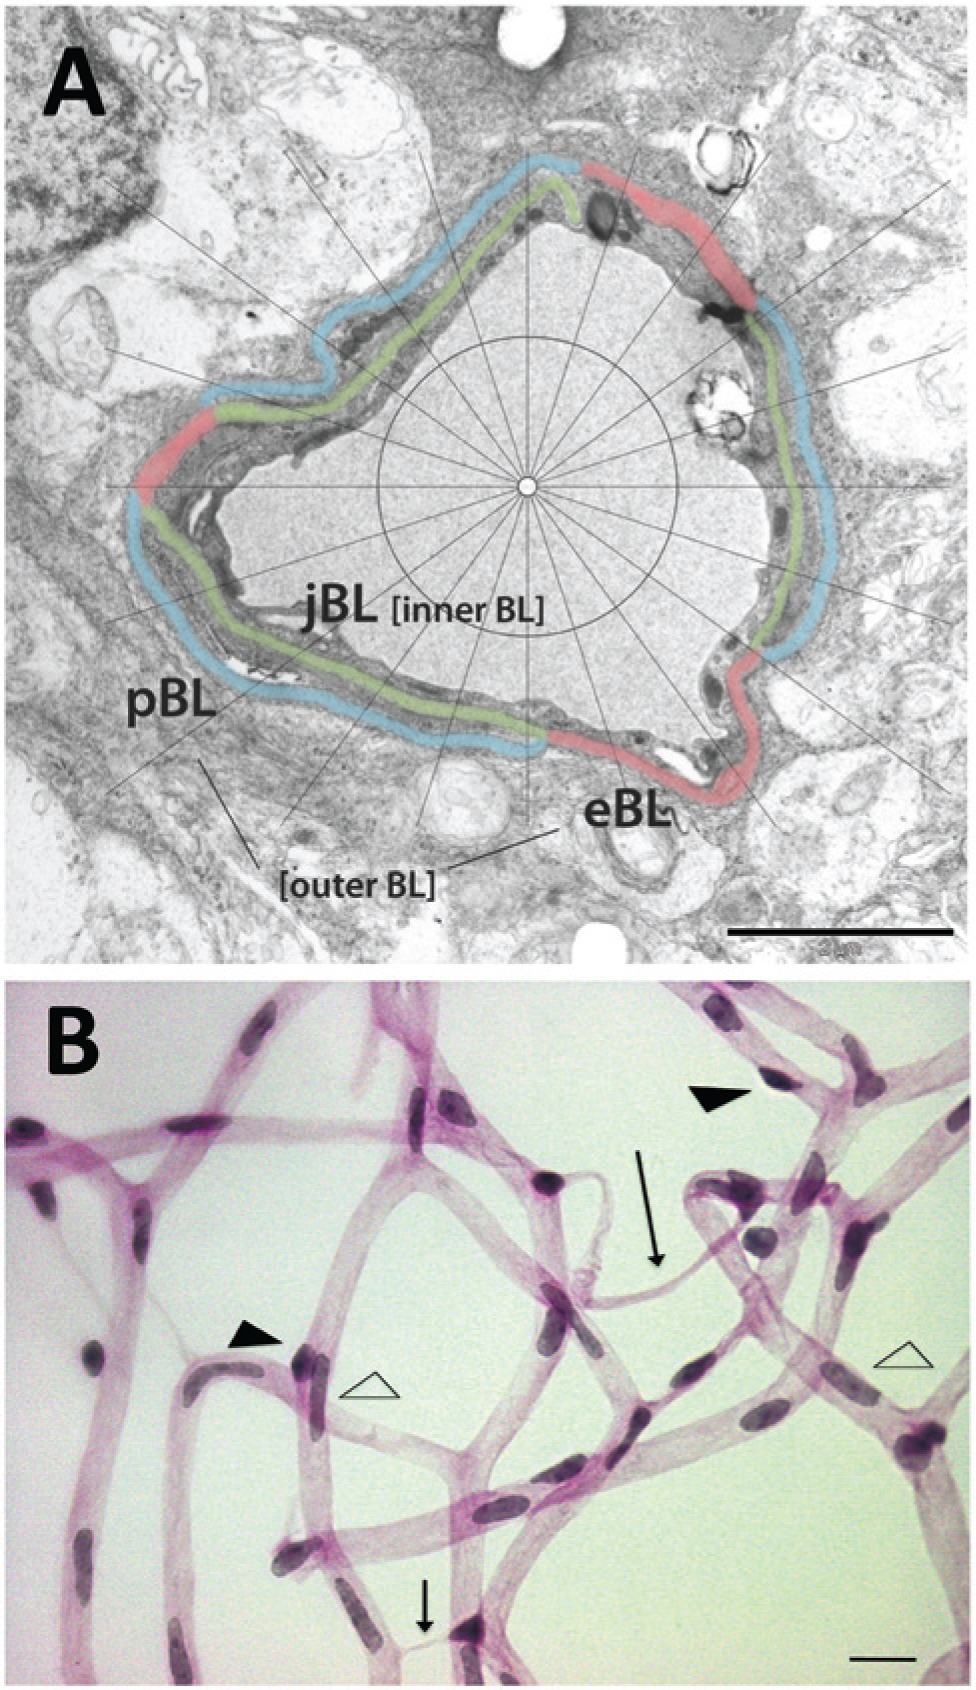
(A) Electron micrograph of a retinal capillary analyzed for basal lamina (BL) thickness. The different layers are defined as outer BL, consisting of an endothelial BL domain (eBL; red) and a pericyte BL domain (pBL; blue), and as inner BL or joint BL (jBL; green) in between the endothelial cells and pericytes. Bar = 2 µm. (B) Light microscopy image of the retinal vasculature in a digest preparation. Arrow, acellular capillary; open arrow head, endothelial cell; closed arrow head, pericyte. Bar = 4 µm.
The BL of the capillaries was divided into domains (Fig. 1A). The “outer” and “inner” domains were defined as previously described (Fischer and Gartner 1983). The “outer” BL is positioned outside the endothelial cell (eBL) and/or pericyte (pBL) adjacent to surrounding glial tissue. The “inner” BM is positioned in between the endothelial cell and pericyte as a joint BL (jBL). Measurements were taken by a blinded observer only when the cell membranes adjacent to the BL were visible as distinct dark lines.
Retinal Digest Preparations
The number of endothelial cells and pericytes in capillaries of the inner retinal vasculature were determined as described previously (Pfister et al. 2010). Retinas of diabetic and non-diabetic wild type and CTGF+/− mice were fixed in 4% paraformaldehyde for 24–48 hr at room temperature. Then, retinas were washed in double-distilled water for 30 min and incubated in a solution of 3% trypsin dissolved in 0.2 M Tris buffer, pH 7.4, for 2–3 hr at room temperature. The retinas were washed in double-distilled water, and isolated retinal vasculature was flat mounted on glass slides. The samples were stained with periodic acid Schiff base and hematoxylin (Fig. 1B; Pearse 1985).
Quantitative Retinal Cytometry
Quantitative image cytometry in retinal sections was performed according to Chieco et al. (2013). Analyses of pericyte coverage of the retinal vasculature and numbers of endothelial cells present in the vasculature were carried out using the retinal digest preparations (Fig. 1B) (Hammes et al. 2004). In brief, total numbers of pericytes and endothelial cells were counted in 10 randomly selected fields of the retina using an image analyzing system (CUE-2; Olympus Opticals, Hamburg, Germany), and their numbers were normalized to the relative capillary density (numbers of cells per mm2 of capillary area).
For analysis of vasoregression profiles, numbers of acellular capillary segments were counted according to an established method in 10 randomly selected fields, as described previously (Hammes et al. 2004). Samples were evaluated in a blinded fashion.
Statistical Analysis
Data are presented as the mean ± SD. Differences between experimental groups were analyzed by one way-ANOVA with the Bonferroni post-hoc method for multiple comparisons. For BL measurements, mean BL thickness was first calculated per capillary and then averaged per mouse. Statistical analysis was performed using GraphPad Prism software version 5.02 (GraphPad Software, San Diego, CA). For all comparisons, a value of p<0.05 was considered to indicate a significant difference (two-tailed).
Results
Clinical Characteristics of Mice with Long-term STZ-induced Diabetes
Body weight, blood glucose levels and HbA1C levels did not differ between wild type and CTGF+/− mice (Table 1). Experimentally induced diabetes using STZ in both wild type and CTGF+/− mice resulted in persistent hyperglycemia, increased HbA1C levels and decreased body weight.
Analysis of Retinal CTGF Protein Levels
Total retinal CTGF protein levels, as determined by western blotting (Fig. 2A), were higher in diabetic wild type mice than in non-diabetic wild type mice at 8 months of diabetes (Fig. 2B). In CTGF+/− mice, retinal CTGF protein levels were not altered at 8 months of diabetes (Fig. 2B).
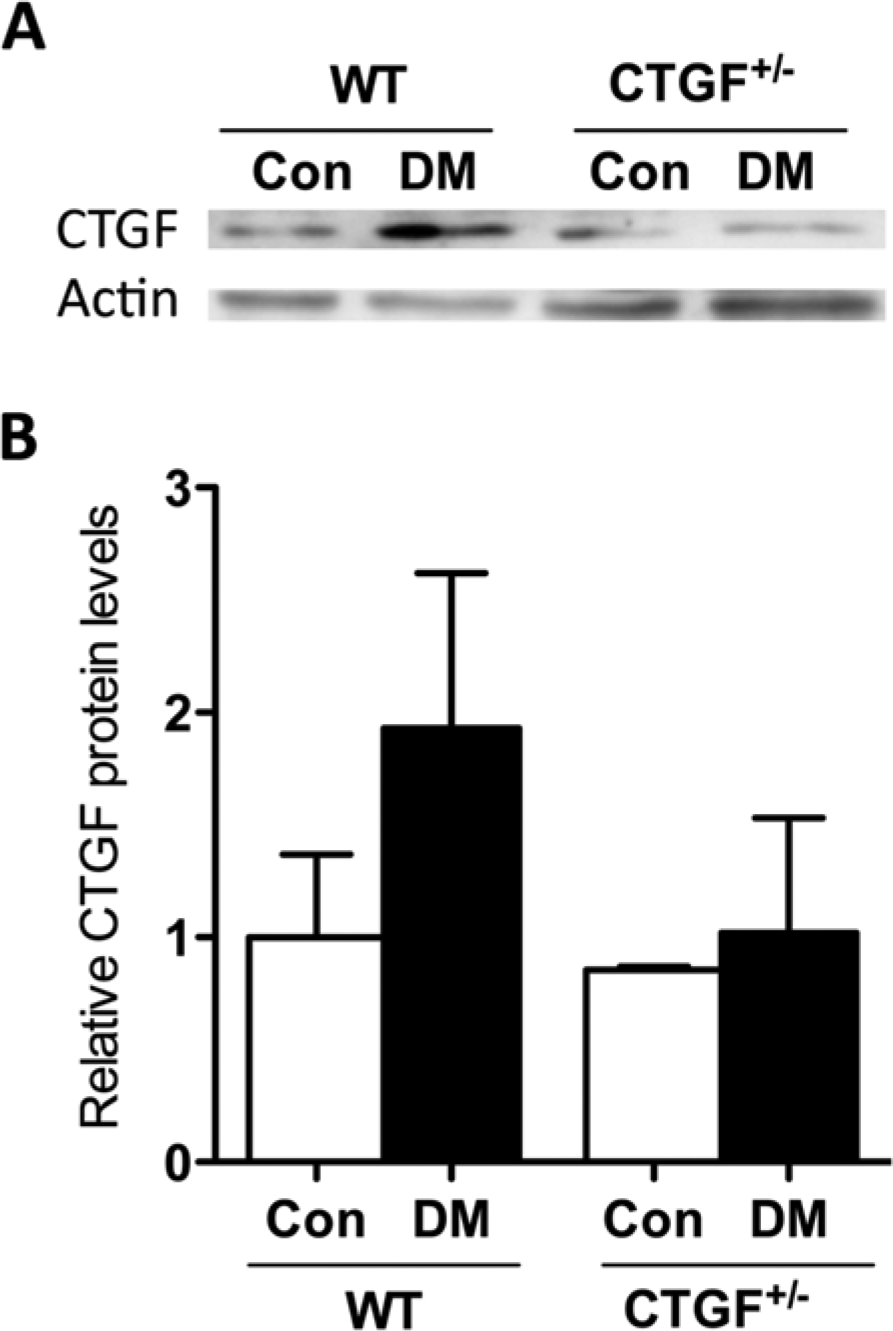
(A) Representative western blot of CTGF and β-actin of diabetic (DM) and non-diabetic control (Con) wild type (WT) and CTGF+/− mice after 8 months of diabetes. (B) Relative quantitative western blot analysis of retinal CTGF protein in DM and Con WT and CTGF+/− mice after 8 months of diabetes, using β-actin as a loading control. n=2–4 animals pooled per group. Data presented are the mean of two repeated experiments relative to WT Con.
CTGF Haploinsufficiency Is Associated with Reduced Diabetes-induced BL Thickening of Retinal Capillaries
Examples of retinal capillaries in diabetic and control wild type and CTGF+/− mice are shown in Fig. 3A. In diabetic wild type mice, the thickness of the retinal capillary BL was significantly increased after 6 to 8 months of STZ-induced diabetes as compared with the non-diabetic wild type mice (Fig. 3). More specifically, the outer BL thickness was increased (Fig. 3B), which was solely caused by increased thickness of the eBL (Fig. 3C). The pBL and the jBL were not significantly thickened (data not shown).
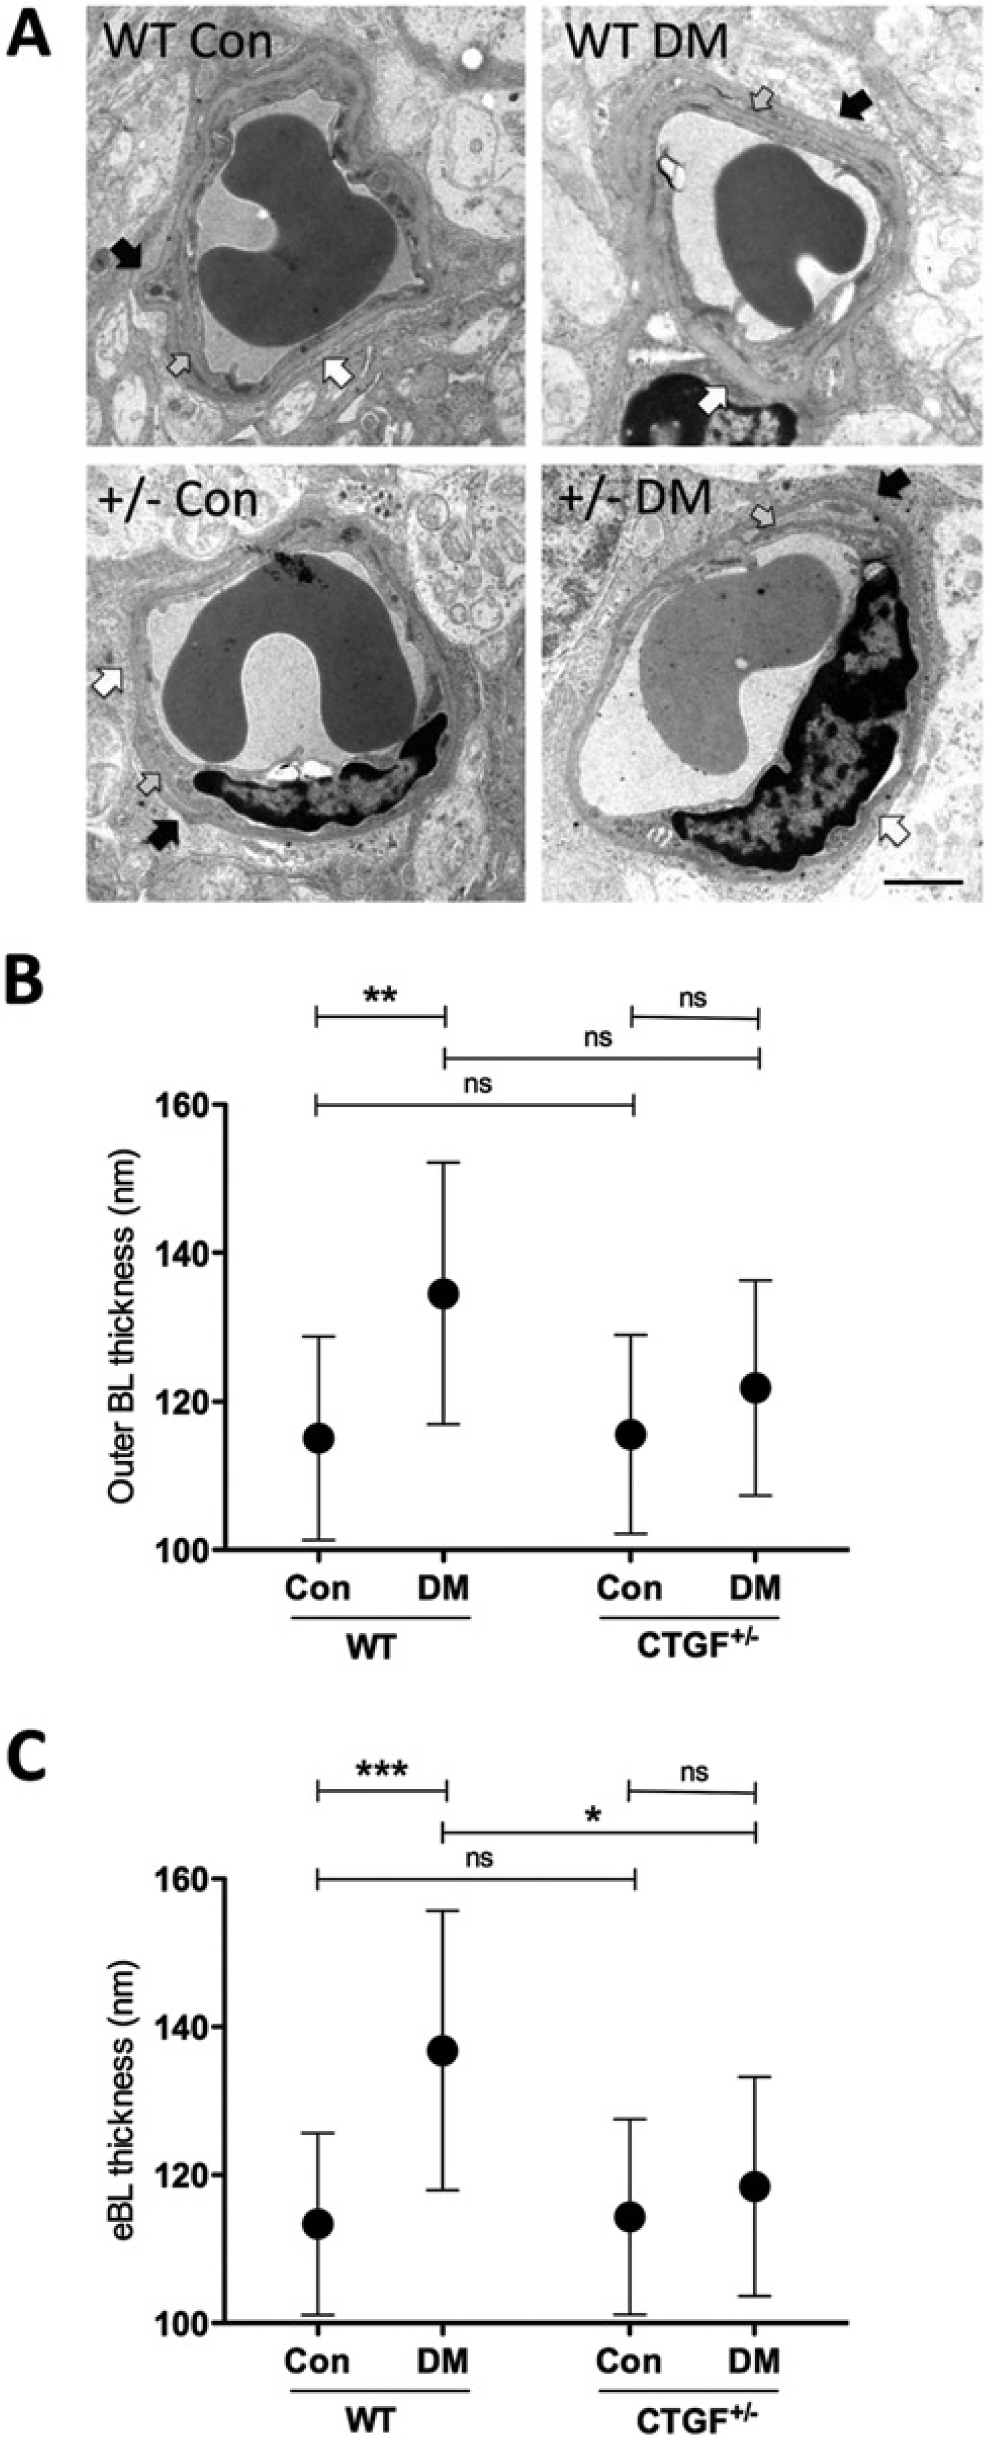
CTGF haplo-insufficiency is associated with a reduction in diabetes-induced BL thickening. (A) Electron micrographs of retinal capillaries of diabetic (DM) and control (Con) wild type (WT) and CTGF+/− (+/−) mice showing the basal lamina (BL) of pericytes (black arrow), endothelial cells (white arrow) and their joint BL (grey arrow). Bar = 2 µm. (B, C) BL thickness measurements in nanometers of retinal capillaries in DM and Con WT and CTGF+/− mice after 6 to 8 months of diabetes. (B) Thickness of the outer BL, as defined by the BL outside the endothelial cell and/or pericyte. (C) Endothelial cell BL (eBL) thickness. n=14–15 animals per group. Data are the mean ± SD. *p<0.05, **p<0.01, ***p<0.001; ns, not significant.
In contrast, BL thickness was similar in diabetic CTGF+/− and non-diabetic CTGF+/− mice. The difference between the eBL in diabetic wild type and CTGF+/− mice was significant (Fig. 3B). BL thickness did not significantly differ between non-diabetic wild type mice and CTGF+/− mice.
CTGF Haploinsufficiency Is Associated with Reduced Pericyte Loss and Reduced Formation of Acellular Capillaries
The numbers of pericytes per mm2 of capillary area were similar in non-diabetic wild type and CTGF+/− mice. After 8 months of diabetes, a significant 15% loss in pericyte number was observed in diabetic wild type mice as compared with non-diabetic wild type mice (Fig. 4A). However, the number of pericytes was unaffected by diabetes in CTGF+/− mice.
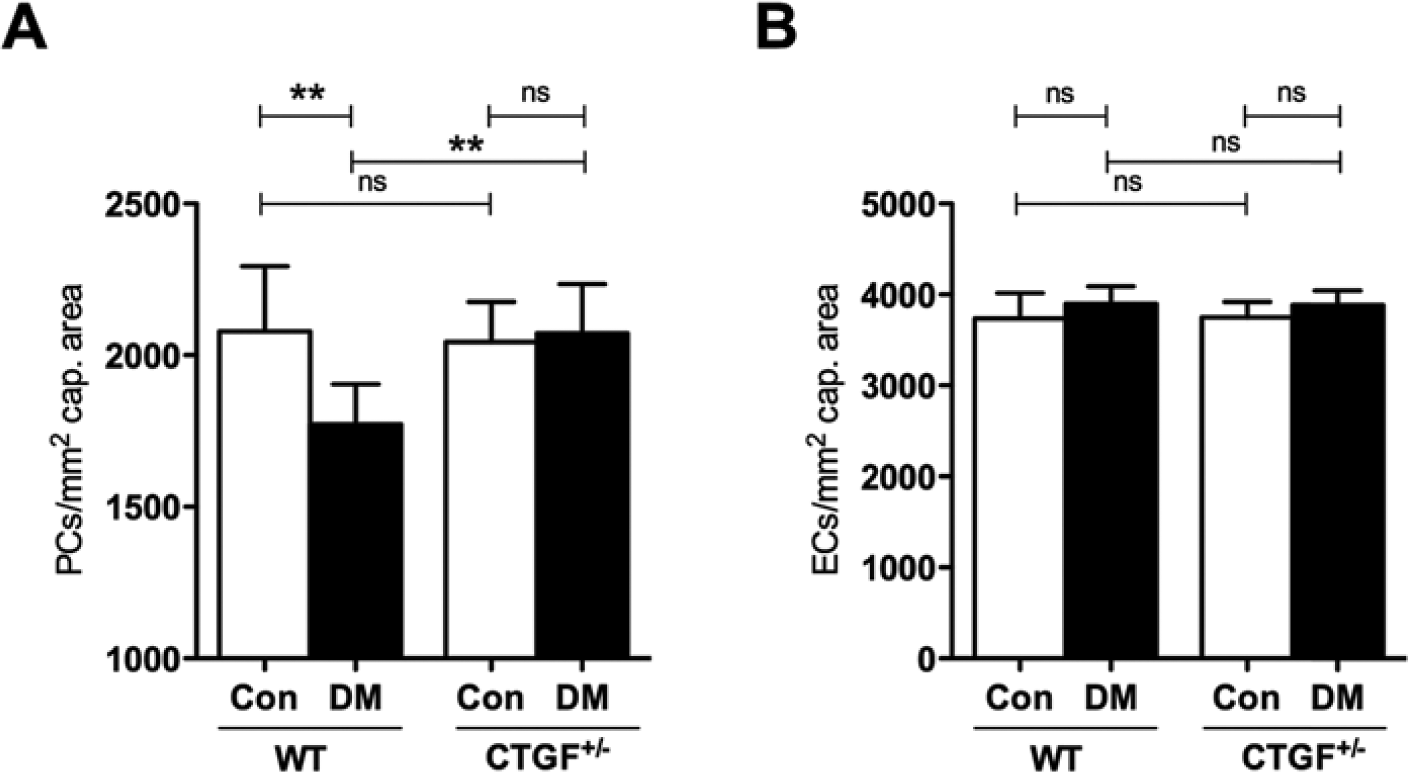
CTGF haplo-insufficiency is associated with reduction in diabetes-induced pericyte loss. Numbers of pericytes (PCs; A) and endothelial cells (ECs; B) per unit area of retina (mm2) in diabetic (DM) and non-diabetic control (Con) wild type (WT) and CTGF+/− retinas after 8 months of diabetes. Pericyte coverage was reduced by 15% in diabetic wild type mice but was not altered in diabetic CTGF+/− mice. Endothelial cells numbers were not affected by diabetes or genotype. n=7–9 animals per group. Data are the mean ± SD. **p<0.01; ns, not significant.
In areas without vasoregression, endothelial cell numbers did not differ between wild type and CTGF+/− mice and diabetes had no effect on endothelial cell proliferation (Fig. 4B).
Examples of capillaries in retinal digests are shown in Fig. 5A. The number of acellular capillaries was significantly increased in diabetic versus non-diabetic wild type mice, whereas diabetes did not have a significant effect in CTGF+/− mice (Fig. 5B).
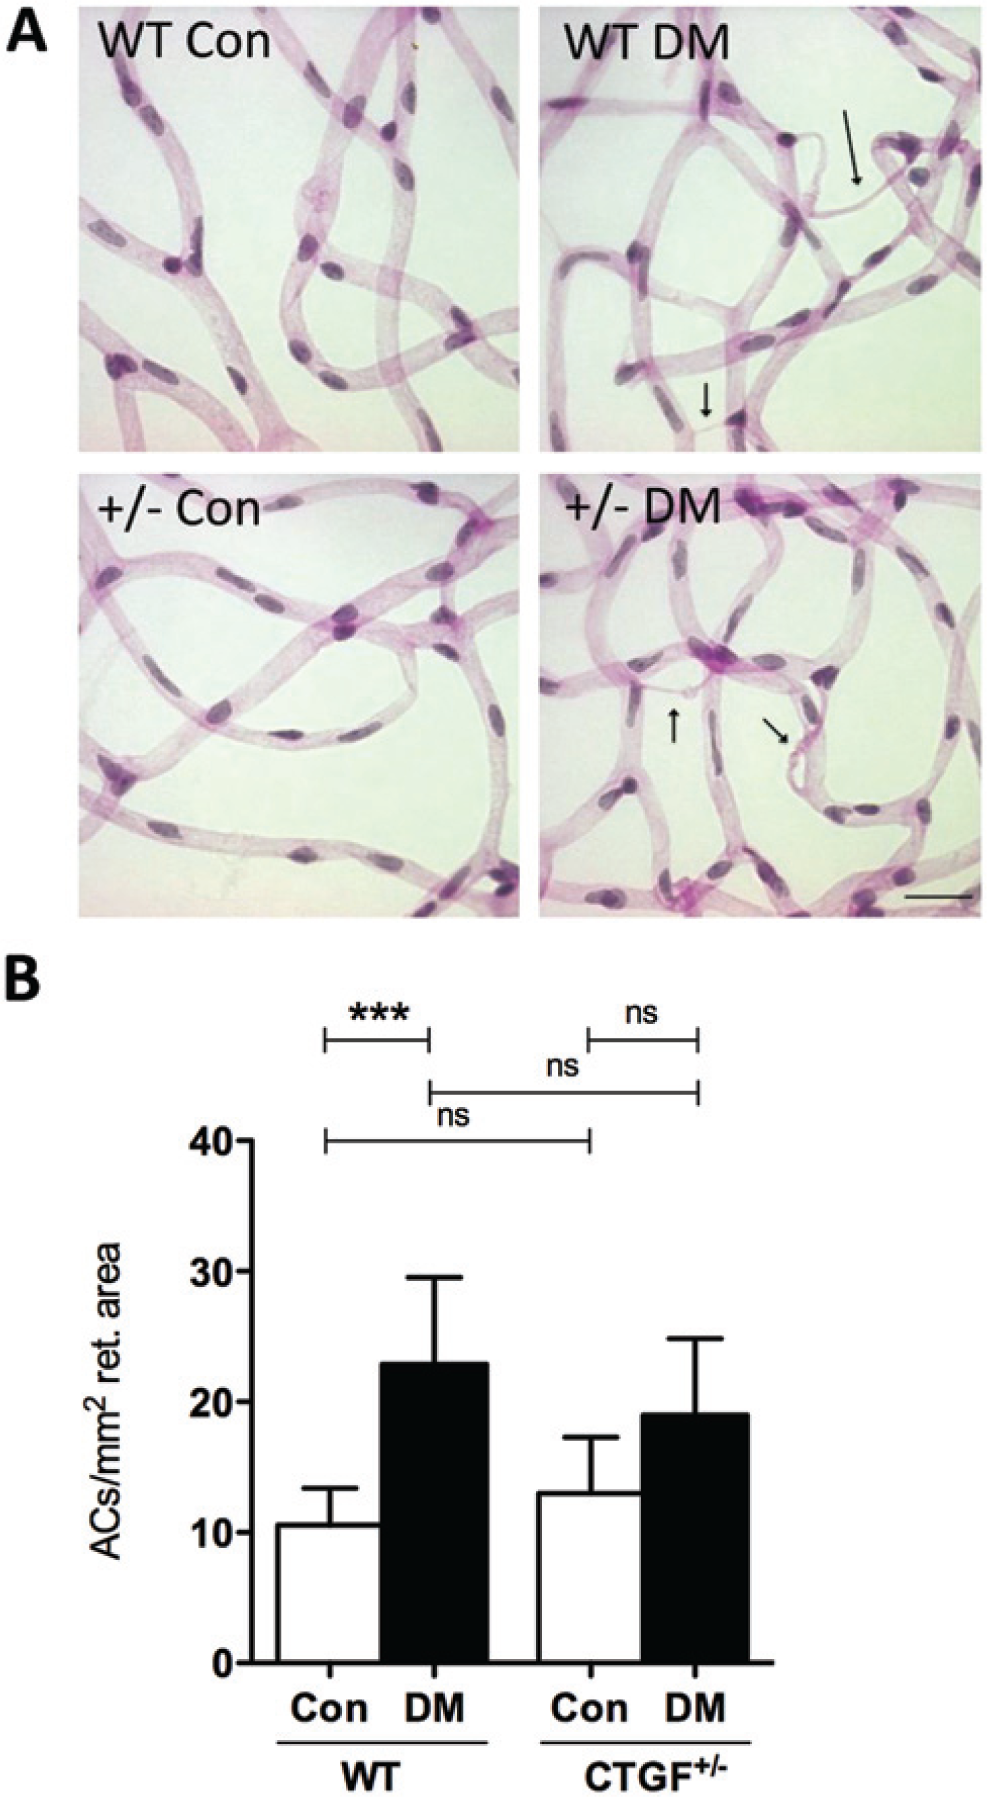
Diabetes-induced formation of acellular capillaries is altered by CTGF haploinsufficiency. (A) Light microscopy images of the retinal vasculature in digest preparations of diabetic (DM) and control (Con) wild type (WT) and CTGF+/− mice. Arrows, acellular capillaries. Bar = 4 µm. (B) Acellular capillaries (ACs) in DM and Con WT and CTGF+/− retinas after 8 months of diabetes expressed as numbers per unit area of retina (mm2). n=7–9 animals per group. Data are the mean ± SD. ***p<0.001.
Discussion
The present study shows that long-term experimental diabetes induces thickening of the BL of mouse retinal capillaries and that CTGF haploinsufficiency prevents BL thickening, as was shown by us before with shorter periods of experimental diabetes (Kuiper et al. 2008b). Moreover, we also show for the first time that diabetes-induced pericyte loss is prevented, and that the formation of acellular capillaries is decreased in CTGF+/− mice. Our findings indicate a major role for CTGF in these structural changes in PCDR.
The diabetic state of CTGF+/− mice in this study was comparable with that of diabetic wild type mice, as indicated by similar blood glucose and HbA1c levels. Diabetic wild type mice appeared to have higher CTGF protein levels than non-diabetic wild type mice, as was shown before (Tikellis et al. 2004). However, a genotype effect on retinal CTGF protein levels in diabetes is suggested, as CTGF+/− mice did not show higher CTGF levels under diabetic conditions. This prevention of the increase in CTGF levels can explain the observed absence of BL thickening in long-term diabetes in CTGF+/− mice.
The observed thickening of specifically the eBL and not the pBL after short-term and long-term diabetes may be explained by the observation that, under diabetic conditions in vitro, CTGF induces the expression of fibronectin (Twigg et al. 2002), and that incorporation of fibronectin into the ECM by endothelial cells is higher than that achieved by pericytes (Mandarino et al. 1993). However, this explanation may be too simple. We have previously found that at 6 and 12 weeks of STZ-induced diabetes in rats, fibronectin gene expression was not different in retinas of diabetic and control rats (Hughes et al. 2007). On the other hand, VEGF treatment of rat eyes resulted in a transient upregulation of fibronectin gene expression at 24 hr after VEGF administration (Kuiper et al. 2007). Moreover, fibronectin gene expression levels in the retinas of long-term diabetic mice were not elevated, irrespective their genotype (data not shown). Therefore, we conclude that BL thickening in diabetic retinas cannot be linked directly to increased incorporation of fibronectin in the BL of the blood-retinal barrier. Further research is needed here. Recently, it was demonstrated that intravitreal administration of CTGF-specific small interfering RNA (siRNA) in diabetic rats reduced the expression of retinal ECM proteins at 3 days after siRNA administration (Winkler et al. 2012). siRNA treatment reduced the expression of various BL compounds except for fibronectin. These findings suggest that fibronectin expression is regulated by another route than via the effects of CTGF.
However, CTGF has been shown to be involved in structural and functional ECM alterations after long-term diabetes, including BL thickening in other organs than the retina, which lead to microvascular diabetic complications such as nephropathy (Twigg et al. 2001; Khan et al. 2003; Roestenberg et al. 2004; Nguyen et al. 2006; Umezono et al. 2006).
Several experimental rodent studies have demonstrated the relevance of abnormal ECM synthesis and BL thickening in the development of DR, showing associations between the inhibition of BL thickening and prevention of pericyte loss and acellular capillary formation (Oshitari et al. 2006; Chronopoulos et al. 2011; Roy et al. 2011). CTGF haploinsufficiency not only inhibited BL thickening, but also prevented diabetes-induced pericyte loss. We observed previously that in early DR in humans, a shift in CTGF protein occurs from a predominantly microglial location in the normal human retina to a predominantly pericyte location in diabetic patients (Kuiper et al. 2004). Taken together, these observations suggest that CTGF has a role in pericyte loss in PCDR. This role may be either direct, by causing pericyte apoptosis or by allowing pericyte migration (Hammes et al. 2011), or indirect, via CTGF-induced changes in the ECM. The latter possibility is supported by a study that shows that CTGF is involved in pericyte detachment and anoikis, a form of apoptosis resulting from the loss of cell-ECM interactions under diabetic conditions in vitro (Liu et al. 2008). Furthermore, pericyte recruitment was impaired in association with decreased fibronectin levels in the developing vasculature in mouse embryos lacking the CTGF gene (Hall-Glenn et al. 2012).
CTGF haploinsufficiency was also associated with reduced development of acellular capillaries in our long-term diabetic model. However, this reduction in acellular capillary formation was only partial in contrast with its effects on BL thickening and pericyte loss. It implies that factors other than CTGF are involved in endothelial cell loss in diabetic conditions, such as formation of AGEs, the adherence of leukocytes, or disruption of the retinal neurovascular unit by neuronal apoptosis (Brownlee 2001; Joussen et al. 2004; Hughes et al. 2007; Antonetti et al. 2012).
In conclusion, our studies identify CTGF as a possible modifier of DR incipience in rodents after short-term and long-term experimental diabetes. These findings may be relevant for human DR as is supported by our recent observation of increased vitreous levels of CTGF in human diabetic patients without any clinical signs of DR (Van Geest et al. 2013). We show that BL thickness, the number of pericytes, endothelial cells and acellular capillaries were not different in non-diabetic wild type and CTGF+/− mice. These findings suggest that a functional vascular network is established, even when only one functional CTGF allele is present, and imply that lowered CTGF levels in the eye by itself is probably not harmful. Thus, targeting of CTGF may be a safe and effective way to prevent structural changes in DR, which may contribute to the prevention of the asymptomatic preclinical stage of DR.
Footnotes
Declaration of Conflicting Interests
The author(s) declared no potential conflicts of interest with respect to the research, authorship, and/or publication of this article.
Funding
The author(s) disclosed receipt of the following financial support for the research, authorship, and/or publication of this article: This study was financially supported by grant 2005.00.042 from the Diabetes Fonds Nederland. JWL was supported by the Dutch Kidney Foundation (grant C05.2144). FP was supported by the Deutsche Forschungsgemeinschaft (DFG GRK 880 ‘Vascular Medicine’).