
Abstract
Melatonin plays a major role in regulating the sleep-wake cycle and enhancing testosterone production. We investigated the short-term effects of melatonin treatment for 14 consecutive days in the cryptorchidism model. We categorized experimental mice into Sham (S), Orchiopexy (O), Melatonin (Mel), and Orchiopexy + Melatonin (OMel) groups. Surgery involved inducing cryptorchidism in the left testis for seven days, followed by orchiopexy. The Mel group’s testes did not descend, but they received melatonin injections after seven days of cryptorchidism. The OMel group underwent both orchiopexy and melatonin treatment. Both O and Mel groups exhibited decreased sperm and round-headed sperm in the epididymis. Significant increases were observed in the numbers of giant cells and negative Nectin-3 cells at p-value<0.05. The pattern of Cadm1 expression changed, and Nectin-2 and Nectin-3 co-expression was lacking in abnormal spermatids. Sertoli cell cytoplasm in both O and Mel groups exhibited autophagosomes and multivesicular bodies, which correlated with increased cyclooxygenase-2 expression. However, Terminal deoxynucleotidyl transferase dUTP nick end labeling (TUNEL)-positive cell numbers increased significantly in all treatment groups compared to the S group. Our study found that the combination of orchiopexy and melatonin positively influenced the expression of cell adhesion molecules (Cadm1, Nectin-2, and Nectin-3) involved in spermatogenesis, while reducing giant cells, autophagosomes, and apoptosis.
Introduction
Melatonin is a small neuro-hormone, as well as a major secretory product of the pineal gland, and plays a key role in regulating the sleep–wake cycle. In addition, melatonin is also involved in influencing male reproduction in mammalian species. Melatonin is released from the pineal gland, enters the bloodstream, and acts through several specific receptors, including binding to specific G protein–coupled membrane melatonin receptors (MT1 and MT2). The expression MT1 and MT2 has been reported in Leydig cells, Sertoli cells, germ cells,1,2 and testicular immune cells. 3 In vitro study reported that melatonin promoted testosterone production through the retinoic acid receptor–related orphan receptor alpha (RORα), which was localized in the perinuclear region of the Leydig cells. 4 Melatonin, known for its efficacy as a free-radical scavenger and antioxidant, demonstrates the ability to traverse all physiological barriers and permeate every cell and subcellular compartment. 5 In cellular respiration, mitochondria utilize oxygen to produce adenosine 5′-triphosphate (ATP), resulting in the generation of free radicals. 6 In the testes, melatonin acts as a cellular protector and antioxidant to reduce mitochondrial-related apoptosis and mitigate reactive oxygen species (ROS)-induced mitochondrial damage, 7 including inducing the proliferation and promoting differentiation of spermatogonial stem cells. 8 In the patient, the low levels of melatonin in the serum of blood and seminal plasma in semen have been associated with infertile men characterized by reducing sperm motility, leucocytospermia, varicocele, and non-obstructive azoospermia. 9 The effects of daily oral melatonin supplementation were studied in the testicular biopsies of infertile men with condition, including hypospermatogenesis and Sertoli cell–only syndrome. The patient had taken a daily oral dose of 3 mg of melatonin in the evening for at least three months before undergoing the testicular biopsy. The results showed a statistically significant decrease in the expression of antioxidant enzymes—superoxide dismutase (SOD1), peroxiredoxin 1, catalase (CAT)—and the expression of inflammatory markers—cyclooxygenase-2 (COX2), interleukin 1β (IL1β), and tumor necrosis factor alpha (TNFα)—and a reduction in the thickness of the tubular wall in testes of infertile patients. 10 Testicular heat stress is one major factor that causes impaired spermatogenesis and also induces inflammation in the testis. Several previous studies described the potential of melatonin as a free radical scavenger, protecting the testis against heat-induced damage by decreasing ROS3,11,12 and upregulating antioxidant enzymes.10,13,14 Furthermore, melatonin suppressed autophagy markers (LC3B, BECN1) and also decreased the expression of apoptosis markers (B-cell lymphoma 2, cleaved caspase-3).12,15 However, melatonin is an activator of Sirtuin 3 (SIRT3), and overexpression of SIRT3 has been shown to rescue cadmium-induced autophagy and apoptosis in proliferating TM3 mouse Leydig cells. 15
Cryptorchidism is a condition involving infertility and testicular cancer. Surgery-induced cryptorchidism serves as an experimental model used to study the effect of high abdominal temperature on spermatogenesis, thereby contributing to the development of appropriate treatment strategies for male infertility and testicular cancer. The previous studies have demonstrated the effectiveness of melatonin in improving testicular weight, epididymal sperm concentration, and sperm motility, using rat cryptorchidism models.16,17 In 2020, Zhang and their research team reported that the intraperitoneal injection of melatonin at a dose of 20 mg/kg body weight for 14 consecutive days after a 42C heat-induced testis injury helped maintain the integrity of Sertoli cell tight junctions and promoted the histological recovery of the testes. 12 However, there is still limited information and unclear understanding of the molecular pathway associated with melatonin treatment in cryptorchidism. Therefore, our investigation focused on a short-term treatment of melatonin administration in mouse model for 14 consecutive days after cryptorchidism surgery. We examine the impact of melatonin treatment on the expression of cell adhesion molecules involved in spermatogenesis in the testes.
Materials and Methods
Animals and Experiment Design
The mouse cryptorchidism model was performed using a surgical procedure for unilateral cryptorchidism. A total of 24 adult male Slc: Institute of Cancer Research mice, 10 weeks old (Japan SLC, Inc., Shizuoka, Japan) were divided into four groups (six mice per group): Sham (S), Orchiopexy (O), Melatonin (Mel), and Orchiopexy + Melatonin (OMel). The mice were housed with bedding materials and allowed free access to food and water in the cages. The cages were kept in the room with a setting of continuous 12-hr alternating light–dark cycle and a controlled temperature of 25C. The mice were allowed to rest for three days in a cage before the surgical process. All experiments were conducted in compliance with the ethical guidelines and were approved by the Animal Care and Use Committee, Kumamoto University (No. A2019-145).
Most of the mice underwent unilateral cryptorchidism on the left testis for a duration of seven days. The mice that underwent only abdominal incisions were categorized as S group. The mice with unilateral surgical cryptorchidism received treatment on the seventh day through either O or Mel. Some mice received a combination treatment of Omel. On day 21 after the unilateral cryptorchidism surgery, all mice received the intraperitoneal injection with sodium pentobarbital (100 mg/kg body weight) and were euthanized by transcardial perfusion with 25 ml of normal saline for each individual.
Mouse Cryptorchidism Model and Melatonin Treatment
The intraperitoneal injection anesthesia regimen consisted of medetomidine (0.3 mg/kg), midazolam (4.0 mg/kg), and butorphanol (5.0 mg/kg). 18 The unilateral surgical cryptorchidism was performed on the left testis by pushing it into the peritoneal cavity and fixed with a clip. After operation, skin was closed with a 4–0 nylon suture, and medetomidine antagonist (0.75 mg/kg) was administered for speedy recovery from general anesthesia. On day 7 after the surgery, the mice were anesthetized again to relocate the cryptorchid testis to move down into the scrotal sac. The surgical procedure of relocating the abdominal testis to the scrotal sac is analogous to orchiopexy in humans. The surgical procedure for orchiopexy used both anesthetic and rapid recovery drugs in the same protocol of surgical cryptorchidism. To investigate the effect of melatonin treatment, the mice were immediately injected with 20 mg/kg body weight melatonin (M5250; Sigma-Aldrich, St. Louis, MO) after orchiopexy by intraperitoneal injection once a day for 14 consecutive days. 12 Thus, the OMel group received surgical orchiopexy treatment to relocate the abdominal testis into the scrotal sac on the seventh day post-operatively of unilateral surgical cryptorchidism and received immediate melatonin injections until the 20th day post-operatively. Meanwhile, in the Mel group, the abdominal testis was not relocated, and the mice received melatonin treatment on the 7th to 20th day post-operatively of unilateral surgical cryptorchidism.
Histological Analysis
At the endpoint of the experiment, three mice from each group were euthanized with sodium pentobarbital (100 mg/kg body weight) by intraperitoneal injection. Once the mice were under deep anesthesia, they were sacrificed by transcardial perfusion with 25 ml of normal saline and 4% paraformaldehyde. Then testes and epididymis were preserved in 4% paraformaldehyde at 4C overnight. Subsequently, they underwent processes of dehydration, clearing, and paraffin infiltration. The paraffin blocks were cut at a thickness of 4 µM. All sections were stained by the hematoxylin and eosin (H&E) staining and periodic acid-Schiff hematoxylin (PAS-H) staining. The histomorphology of the testes and epididymis was analyzed using an Olympus BX51 microscope (Nagano Olympus Co., Ltd., Nagano, Japan).
The Number of Giant Cells per 100 Seminiferous Tubules
The giant cell is an abnormally large cell consisting of more than one nucleus. The left testicular cross-sections from paraffin-embedded tissue were stained with PAS-H. Ten sections from each group were observed under the bright field of an Olympus BX51 microscope. Digital photographs of the sections were captured at a magnification of 40×. One hundred tubules were randomized, and the giant cells were counted from these tubules in each group.
Immunofluorescence Analysis
The sections were prepared for the immunofluorescence staining through a process of deparaffinization and dehydration. After that, the sections were incubated in an antigen-retrieval solution (20 mM Tris-HCl buffer, pH 9.0) at 95C for 15 min, helping to enhance the ability of a primary antibody to bind a specific protein. After incubation and cooling, the sections were washed in phosphate-buffered saline (PBS) twice, each time for 3 min, and nonspecific protein binding was blocked with 1% bovine serum albumin in PBS for 30 min at room temperature. The primary antibodies were incubated overnight at 4C. We used the following primary antibodies and dilutions: rabbit polyclonal anti-Cadm1 (1:400, in house production of Wakayama et al.),19–23 rat monoclonal anti-Nectin2 (1:200; ab16912, Abcam, Cambridge, UK), rabbit polyclonal anti-Nectin3 (1:200; ab63931, Abcam), and rabbit monoclonal anti-COX2 (1:1,000; ab16701, Abcam). For the detection of target antigens by binding to the primary antibody, the sections were incubated for 1 hr at room temperature with the following secondary antibodies: goat anti-rabbit IgG conjugated to Alexa Fluor 594 (1:400; ab150080, Abcam), goat anti-rat IgG conjugated to Alexa Fluor 488 (1:400; ab150157, Abcam), and mouse anti-rabbit IgG conjugated to Alexa Fluor 594 (1:400; BioLegend, San Diego, CA). The acrosomes were visualized by incubating them for 30 min with peanut agglutinin (PNA) conjugated to Alexa Fluor 488 (1:500; Molecular Probes, Eugene, OR). Nuclei were visualized by incubating them with bisbenzimide H33258 (Hoechst 33258, Sigma-Aldrich) at a dilution of 1:2000 for 10 min at room temperature. The fluorescence signals were detected using an Olympus BX51 microscope (Nagano Olympus Co., Ltd.).
The Number of Negative Nectin-3 Cells per One Seminiferous Tubules
The presence of Nectin-3 in cells indicates Nectin-3-positive cells. In our investigation of abnormal conditions, we designed to quantify the number of Nectin-3-negative cells from 100 tubules per group. PNA lectin was utilized for acrosome staining to determine the stages (I–XII) of the tubules and to identify the types of cells, including the steps of spermatid. Left testicular sections from each group were examined under an Olympus BX51 microscope, and digital images of the sections were captured at a magnification of 40×. Subsequently, the calculation to determine the average number of negative Nectin-3 cells per tubule was performed.
TUNEL Apoptotic Cells Detection
The detection of apoptotic cells in the testis was carried out using the indirect TUNEL method (ApopTag Fluorescein In Situ Apoptosis Detection Kits, S7110; Sigma-Aldrich). The process started with deparaffinized tissue sections which were washed in PBS for 5 min. Next, 20 µg/ml of proteinase K was applied directly on the slide, and this was left to incubate for 15 min. After washing with PBS twice, 75 µl/5 cm2 of an equilibration buffer was applied directly to the specimens, and these were incubated for at least 10 sec at room temperature. Then, 55 µl/5 cm2 of working-strength terminal deoxynucleotidyl transferase (TDT) enzyme was applied to the sections and incubated in a humidified chamber for 1 hr at 37C. Subsequently, the glass slides were put in a jar containing stop-wash solution for 15 min and incubated for 10 min at room temperature. Finally, to avoid light exposure, 65 µl/5 cm2 of an anti-digoxigenin conjugate was applied to the slides, and this was left to incubate in a humidified chamber for 30 min. All glass slides were mounted and covered by coverslips before being stored at −20C in the dark.
Transmission Electron Microscopy
The testes of three mice from each group were dissected into sections measuring 2 mm3 in size and fixed immediately in ½ Karnovsky (2% paraformaldehyde/2.5% glutaraldehyde/0.1 M phosphate buffered (PB, {pH 7.4}) for 2 hr at 4C. They were then post-fixed in 1% osmium tetroxide (OsO4) for 1 hr at 4C. Next, the specimens were incubated in 1% uranyl acetate, followed by a dehydration process. Finally, the small pieces of testis were placed in a mold filled with liquid resin and cured into a solid block using the incubator. The epoxy resin blocks were cut in the transverse plane at a thickness of 1 µm for the semi-thin sections using the ultramicrotome (Leica EM UC7; Leica Microsystems CMS GmbH, Wetzlar, Germany) and then were stained with 1% toluidine blue. To study the ultrastructure, the resin blocks were cut at a thickness of 0.1 µm using a diamond knife, and the ultrathin sections were stained with 1% uranyl acetate. The ultrastructure of testis was observed by a Transmission Electron Microscope HT7700 (Hitachi, Ltd., Tokyo, Japan)
Scanning Electron Microscopy
The semen was collected from the cauda epididymis of three mice from each group to study the morphology of mature sperm. The collected semen was mixed with 80 µl of mHTF and covered with liquid paraffin into a dish and kept them in an incubator for 30 min at 37C. Then sperm suspension was transferred to the small tube and washed in 0.2M PB (pH 7.4) at 4C. The first fixation was done by 2.5% glutaraldehyde/0.1 M PB (pH 7.4) for 30 min and then post-fixed in 1% OsO4 for 15 min. The series of dehydration was done with 50%, followed by 70%, 80%, 90%, 95%, and 100% ethanol. The sample was kept in 100% ethanol overnight. Afterward, the sample was placed on an adhesive glass slide and dried up. The slides were coated with platinum before the observation under a scanning electron microscope JSM-7200F (JEOL Ltd, Tokyo, Japan).
Statistical Analysis
The data of this study are presented as the mean ± standard error of the mean. Statistical analysis for the significant difference between multiple group means was tested using one-way ANOVA and followed by Tukey’s honestly significant difference post-hoc test. In statistical comparisons, the differences were considered on conditions at p-value<0.05 and p-value<0.01.
Results
Histopathology of Cryptorchid Testis
The mice underwent left unilateral cryptorchidism, resulting in the empty scrotal sacs on the left side. On the seventh day of the experiment, the mice were anesthetized, and their abdomens were opened to reveal the fixed left testis in the abdominal cavity (Fig. 1). This surgical procedure can confirm the condition of the cryptorchidism model. The testes were collected at the end point of an experiment. The cross-section of cryptorchid testes in the O and Mel groups revealed histopathology features, including the presence of giant cells in the seminiferous epithelium, detached germ cells in the lumen, and vacuolization. Moreover, some tubules had excess residual cytoplasm which had detached from spermatids and was eliminated in the lumen. In addition, some abnormally elongating spermatids failed to release and dropped in the seminiferous epithelium. However, the size of tubules was not different between groups, and the abnormal appearance was not observed in the OMel group, similar to the S group (Fig. 1).
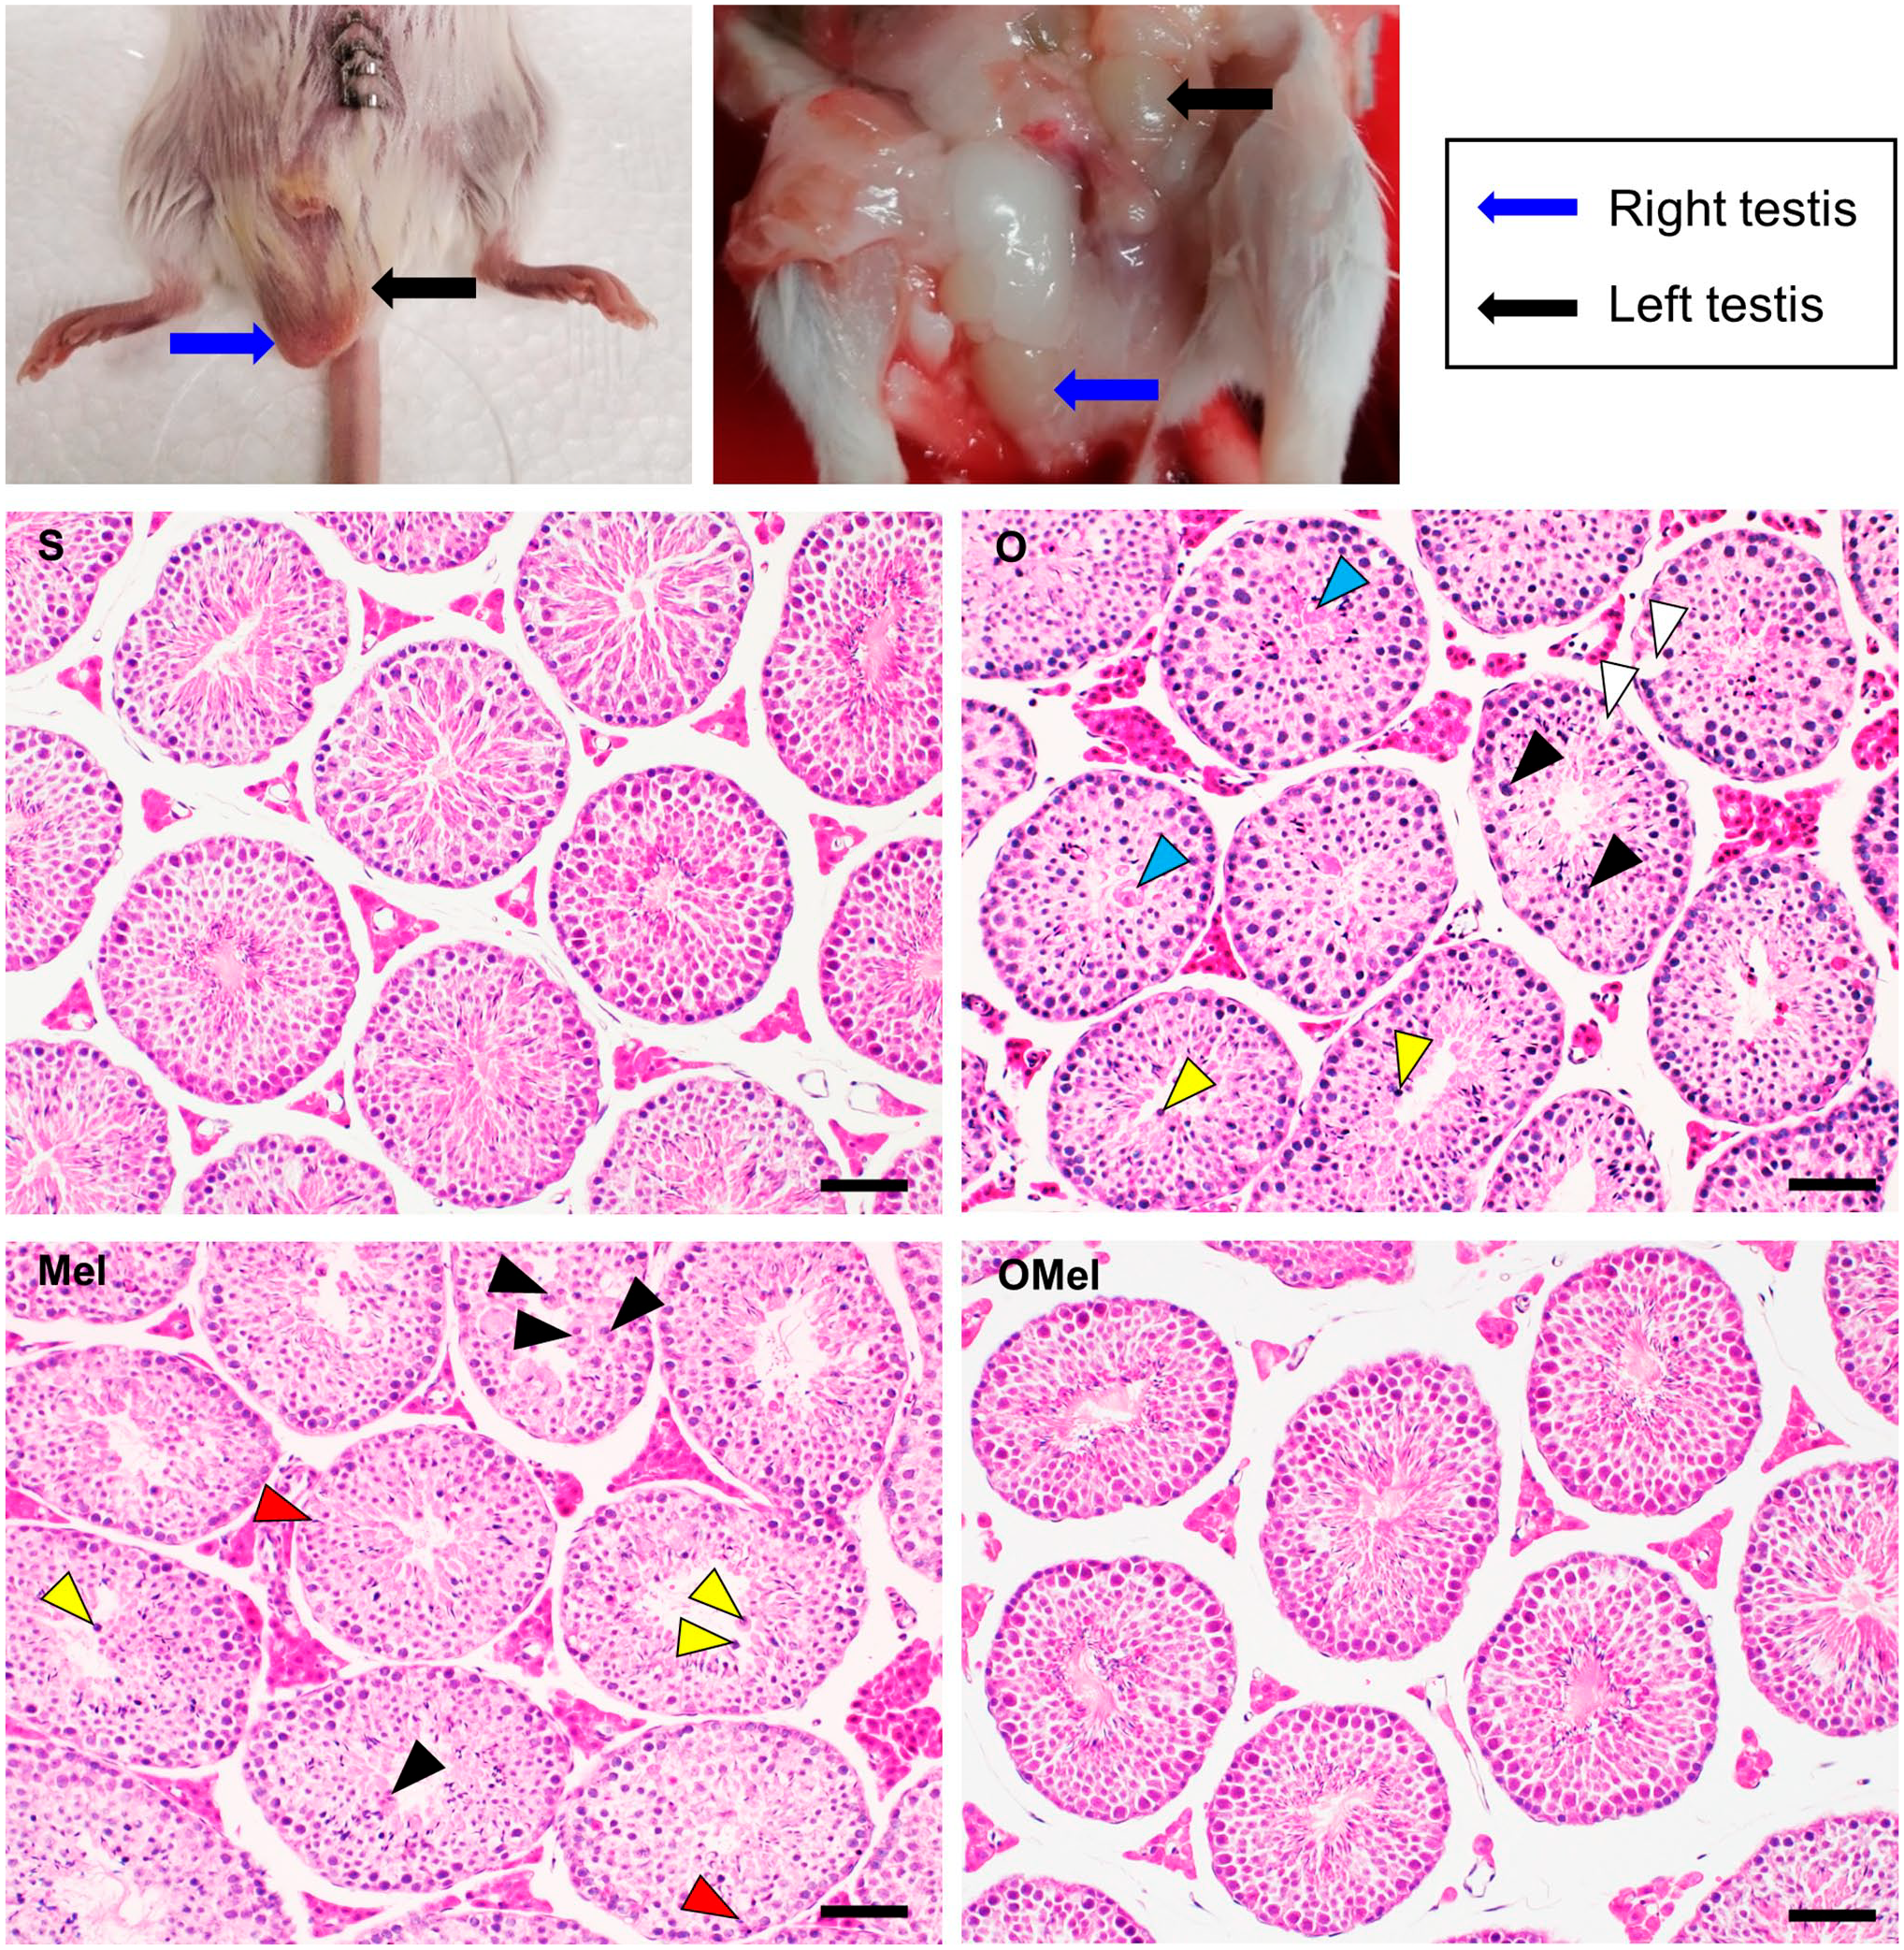
The mouse cryptorchidism model has an empty left scrotal sac. The left side of the abdominal incision was made, and the abdomen opened to show the fixed left testis with the fat pad. The cross-sections of testes with H&E staining are as follows: sham (S), Orchiopexy (O), Melatonin (Mel), and Orchiopexy + Melatonin (OMel). The O group appeared with giant cells (back arrowhead) and vacuolization (white arrowhead) in the seminiferous epithelium and also had excess residual cytoplasm (blue arrowhead) and detached germ cells (yellow arrowhead) in the lumen. The Mel group appeared with a lot of giant cells (back arrowhead), detached germ cells (yellow arrowhead), and also had a failure of sperm released (red arrowhead). In contrast, histological appearance of the OMel group was almost identical to the S group. Scale bars = 50 µm.
Histology of Epididymis and Morphology of Mature Sperm
We collected both right and left epididymides from three mice per group. Each epididymis was cut into 5-µm-thick sections. The first part of the epididymis that stores sperm traveling from the testis is called caput. The normal microscopic appearance of caput epididymis is lined by a pseudostratified columnar epithelium with stereocilia and is circumscribed by smooth muscle. We observed sperm from 10 sections per epididymis at 20× and 40× magnification. Sperm in the lumen of epididymis decreased in both O and Mel groups. In addition, the detached germ cells and debris in the lumen were also present. On the other hand, the epididymis of the OMel group had a lot of sperm that appeared to be similar in appearance to those in the S group (Fig. 2).
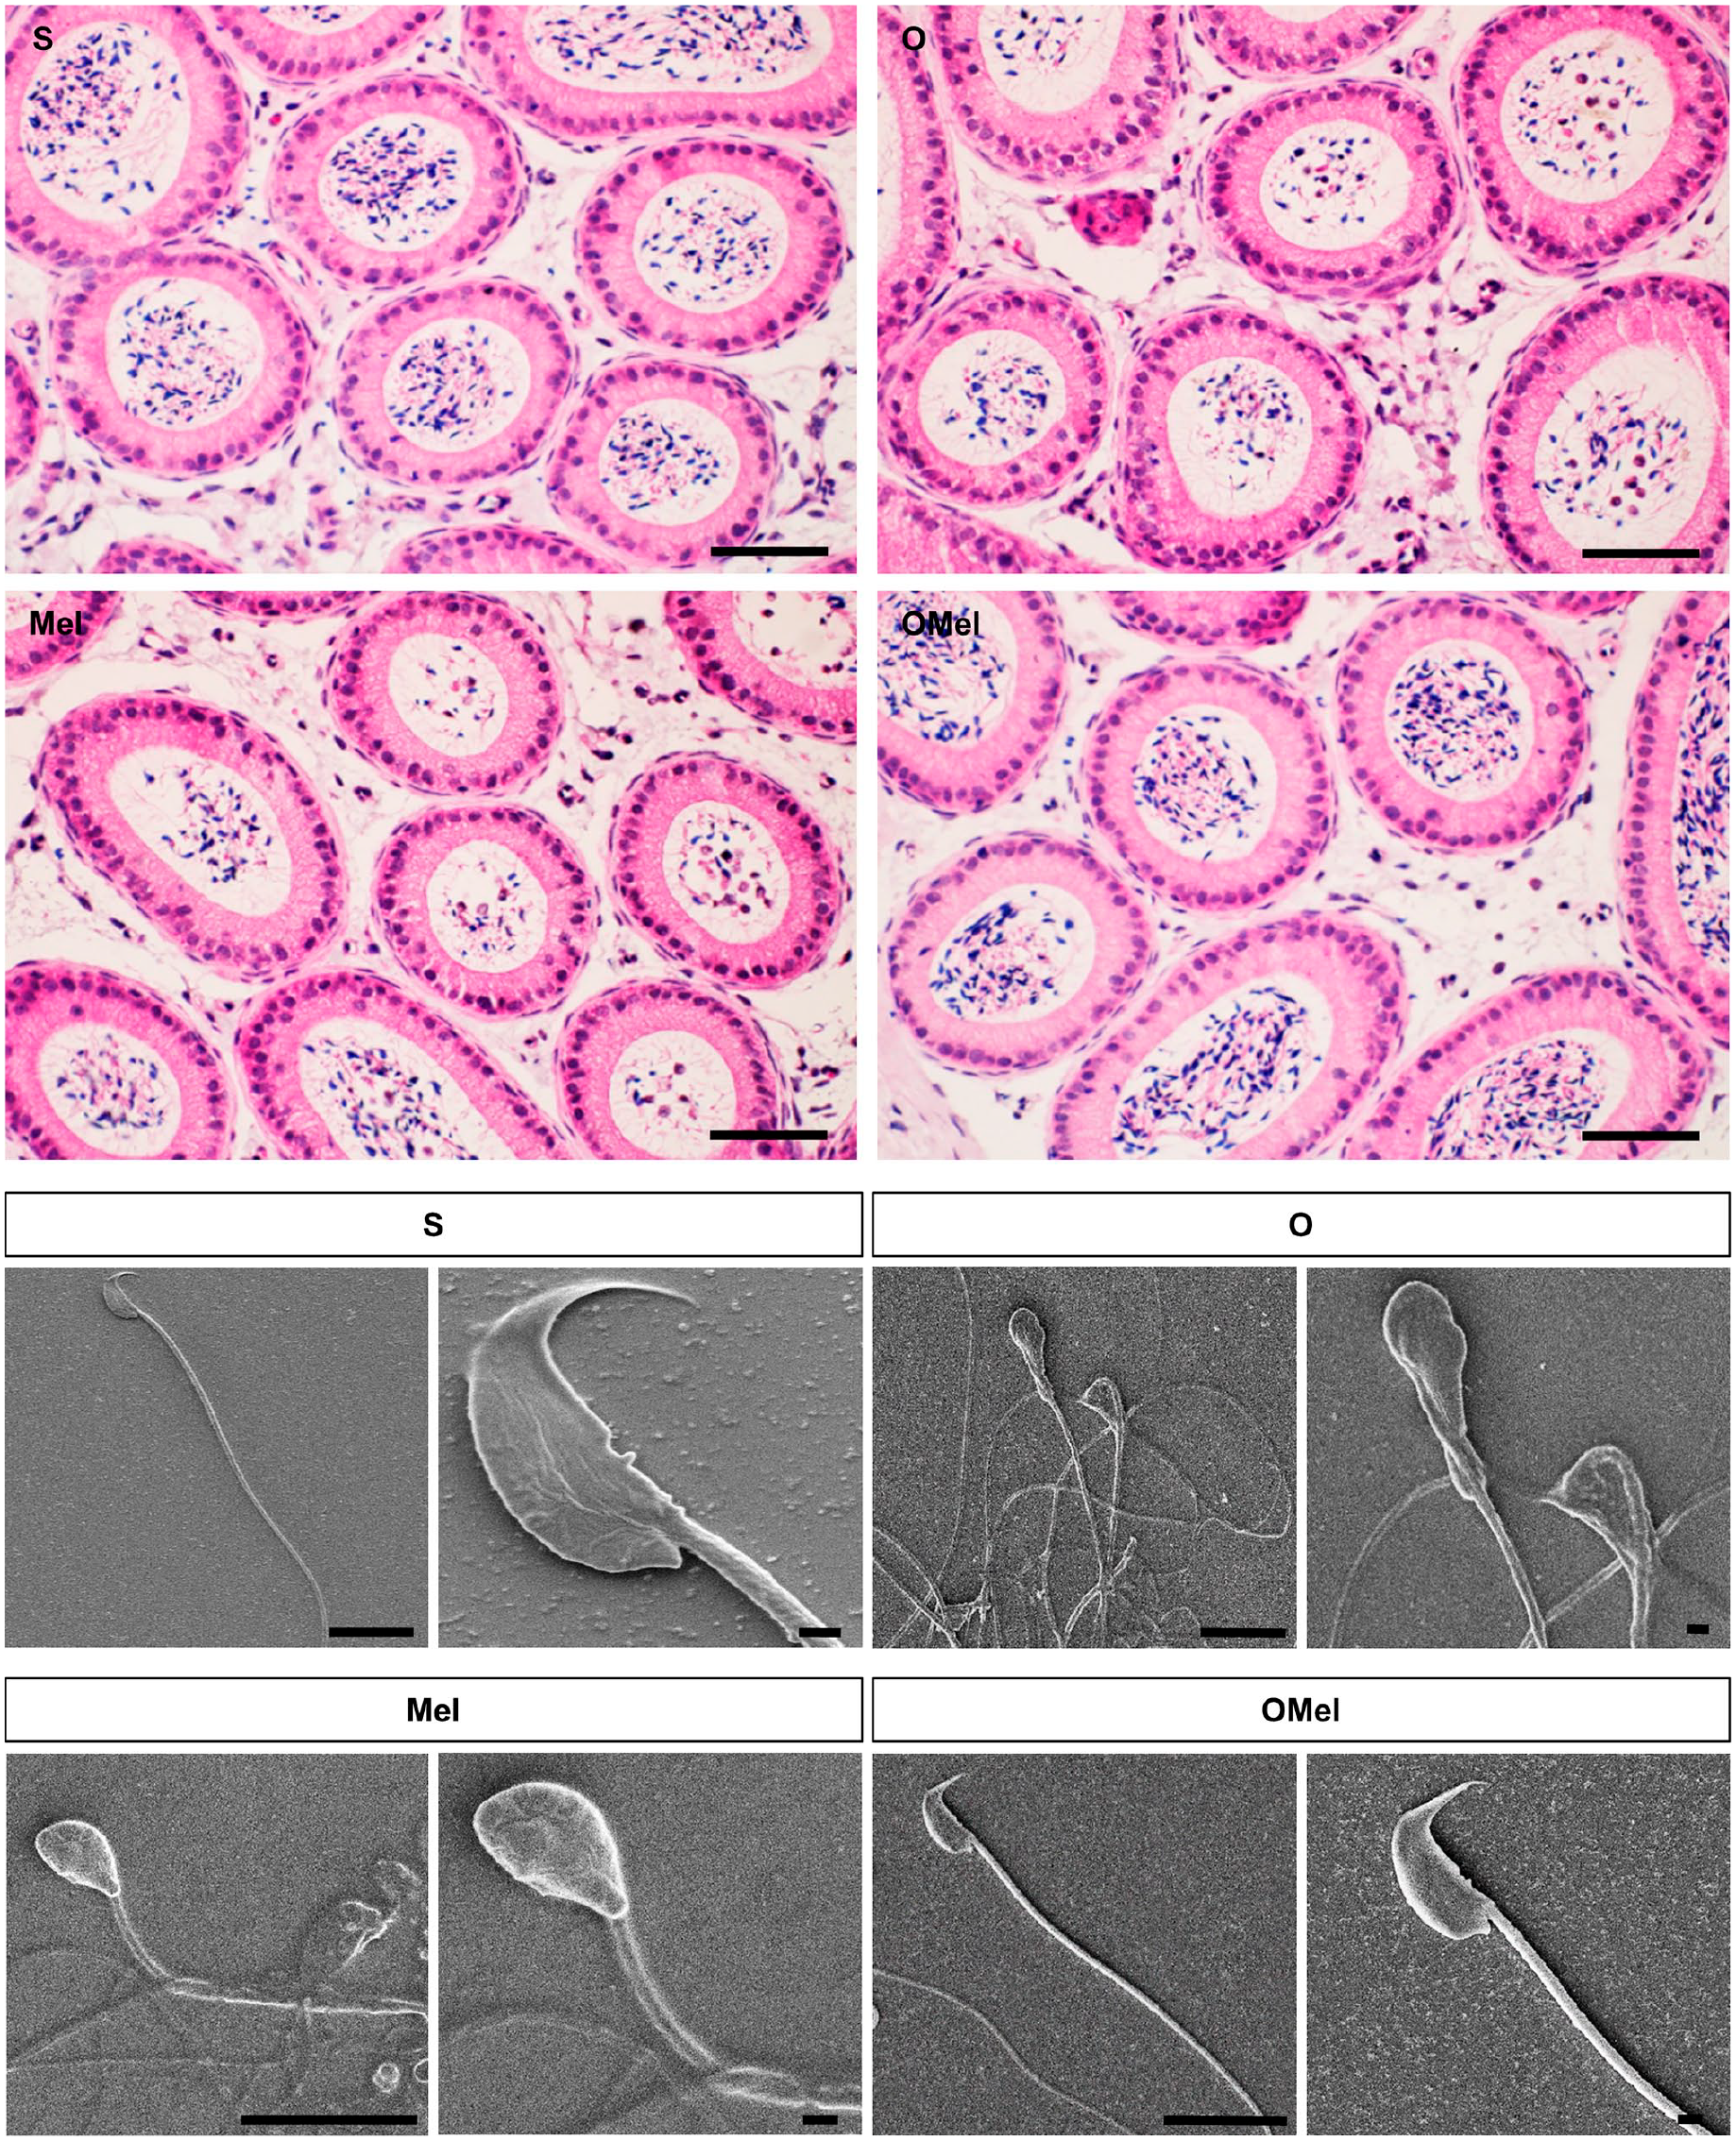
Light microscopic images of the caput of epididymis with H&E staining and SEM image of the mature sperm. Histological study of epididymis showed a lot of sperm in the lumen in the S group. Sperm in the left epididymis decreased by the seventh post-operative day of the cryptorchidism model. Sperm in the left epididymis of O and Mel groups were less than those in the S group and also revealed the detached germ cells and debris in the lumen. Nevertheless, the epididymal sperm of the OMel group was similar to that in the S group. The SEM image of the sperm head revealed an apical hook shape and presented a ventral spur on the ventral side both in the S and OMel groups. However, the hook-shape head of the OMel group appeared slightly flexed at the origin of the curve and close to the terminal end of the hook. Sperm of the O and Mel groups presented a round-shaped head, and some sperm head had a slight projection. Scale bars (H&E images) = 50 µm. Scale bars (SEM images): S group (10 µm and 1 µm), O group (10 µm and 1 µm), Mel group (10 µm and 1 µm), OMel group (10 µm and 1 µm).
The scanning electron microscope (SEM) was used to examine sperm morphology, especially the shape of the sperm head. SEM image of the epididymal sperm head revealed an apical hook shape in both the S and Omel groups. The curved hook projected from an anterior margin and the terminal end of the hook pointed to the ventral surface of the nucleus. The ventral side also presented a ventral spur close to the base of the head where the midpiece originated. However, a hook head of the sperm in the OMel group did not form a smooth curve like the S group. It appeared slightly flexion at the origin of the curve and close to the terminal end of the hook. Conversely, some sperm of the O and Mel groups presented a round-shaped head, while others had a slight projection but did not form the hook shape (Fig. 2).
Expression of Spermatogenic Immunoglobulin Superfamily
This study observed the expression of cell adhesion molecule 1 (Cadm1) in the plasma membrane of spermatogonia, spermatocytes, spermatids, and the caudal portion of elongating spermatids. However, the expression of Cadm1 was not found in round spermatids, mature spermatozoa, and Sertoli cells. Stage XI of the seminiferous tubule revealed the development of spermatogonia, zygotene, and diplotene spermatocytes, and step 11 involved elongating spermatids. The PNA lectin was used for visualizing acrosomes that can be used to classify the stage of the tubule. Despite the strong expression of Cadm1 presented, the pattern of expression had changed and was different in the experimental groups, especially in the luminal area of the seminiferous tubules.
We observed the immunofluorescence reaction combined with the H&E staining and found the abnormal expression of Cadm1 in the caudal portion of elongating spermatids, including the absence of PNA reaction related to this event. Stage XI of O and Mel groups was found in the meiotic cell division in the seminiferous epithelium. The spermatids lacking PNA-positive acrosomes revealed a decreased expression of Cadm1. In addition, the failure to release sperm and detached germ cells also showed the absence of both PNA and Cadm1 reactions. The combined treatment of relocating the testis with melatonin injection improved the expression of Cadm1 in the OMel group. However, the excess residual cytoplasm had strong expression of Cadm1, and this was also revealed in all experimental groups (Fig. 3).
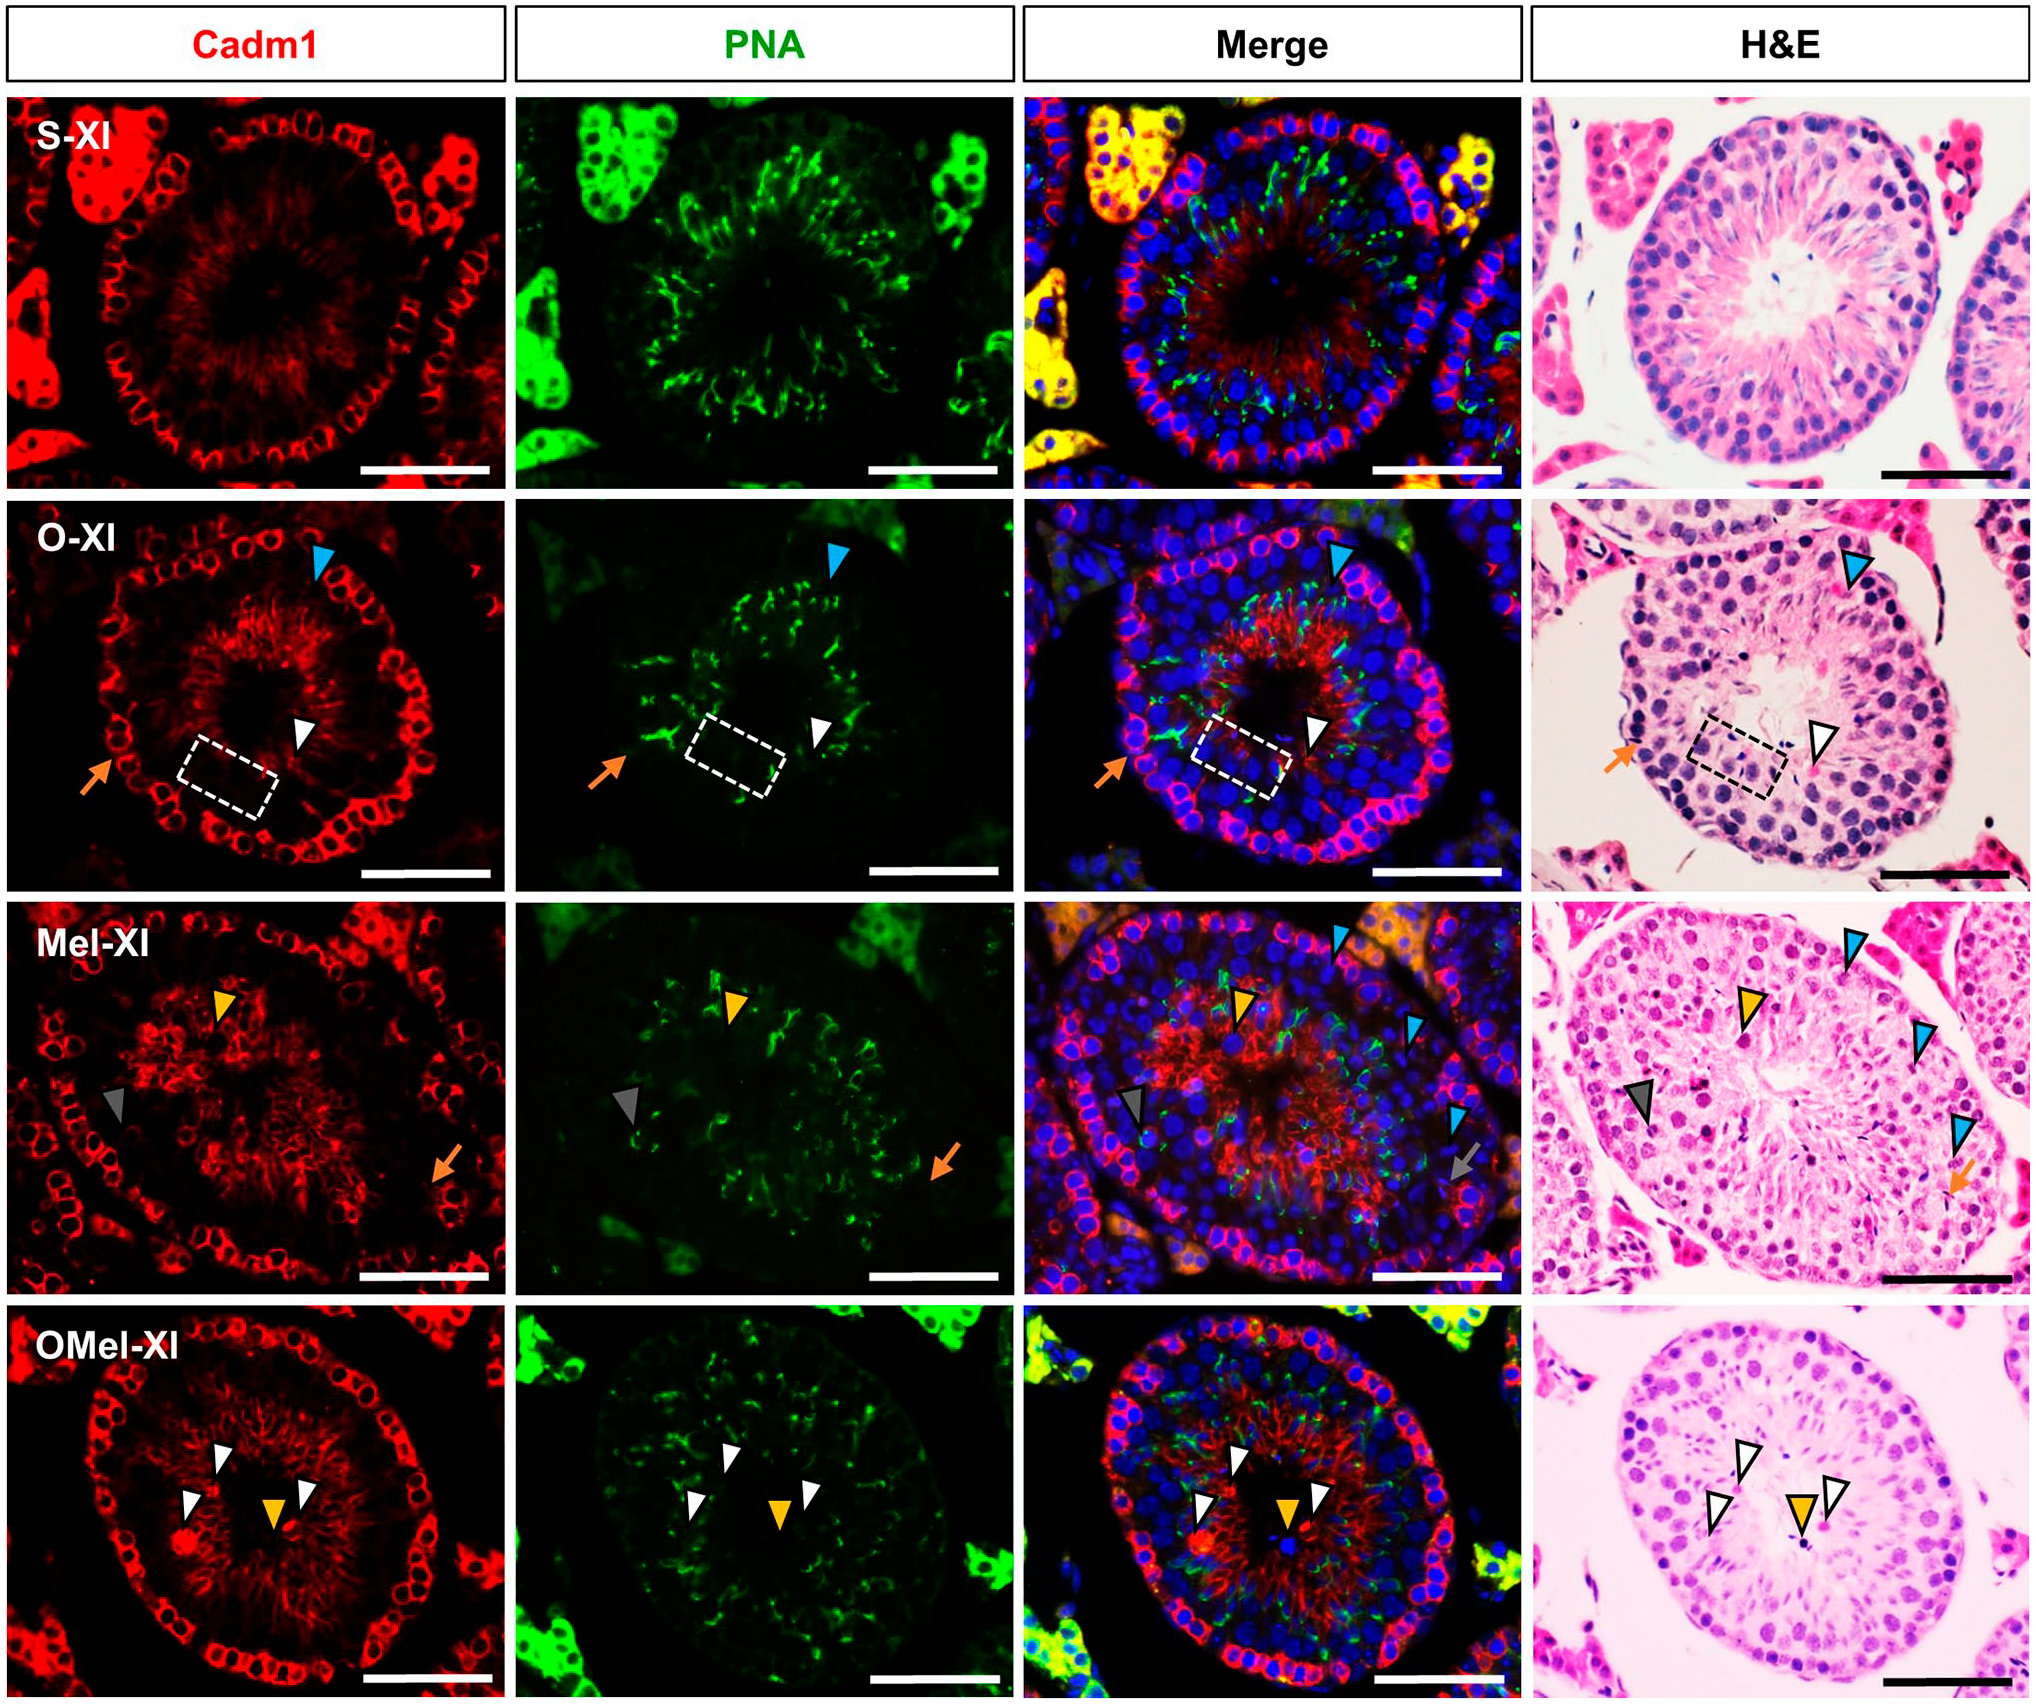
Fluorescence and H&E staining images of stage XI of seminiferous tubules. Cadm1 (red) was expressed in both the basal and luminal parts of the tubule. PNA (green) was used to identify the acrosome. Hoechst (blue) was used for specifically staining of the nuclei. O and Mel groups appeared with the meiotic cell division (light blue arrowhead), failure of releasing sperms (orange arrow), and detached germ cells (yellow arrowhead). The white rectangle dash in the O group presented a group of cells that disappeared from both PNA and Cadm1 reactions. The OMel group appeared with a few detached germ cells (yellow arrowhead) and also had excess residual cytoplasm (white arrowhead) in the lumen. However, Cadm1 was strongly expressed in all experimental treatment groups (O, Mel, and OMel). Scale bars = 50 µm.
Expression of Ca2+-Independent Immunoglobulin-Like Cell–Cell Adhesion Molecules
The interplay between spermatogenic cells and Sertoli cells is an essential process in the development of germ cells into spermatozoa. Nectin-2 and Nectin-3, Ca2+-independent immunoglobulin-like adhesion molecules, are situated in the plasma membrane of Sertoli cells and spermatids, respectively. Nectin-2 was found localized at the basal regions of the Sertoli–Sertoli junctions and the luminal region of the Sertoli–spermatid junctions. Nectin-3 was expressed at the head of spermatids and interacted with Nectin-2.
Nectin-2 and Nectin-3 had strongly expressed in all groups. However, all experimental treatment groups (O, Mel, and OMel) still exhibited the non–co-expression between Nectin-2 and Nectin-3 in the abnormal spermatids. H&E staining was used to observe and found some abnormal cells such as giant cells and failure-releasing sperm. The sperm that dropped into the seminiferous tubule also had absent Nectin-2 and Nectin-3 expression (Fig. 4).
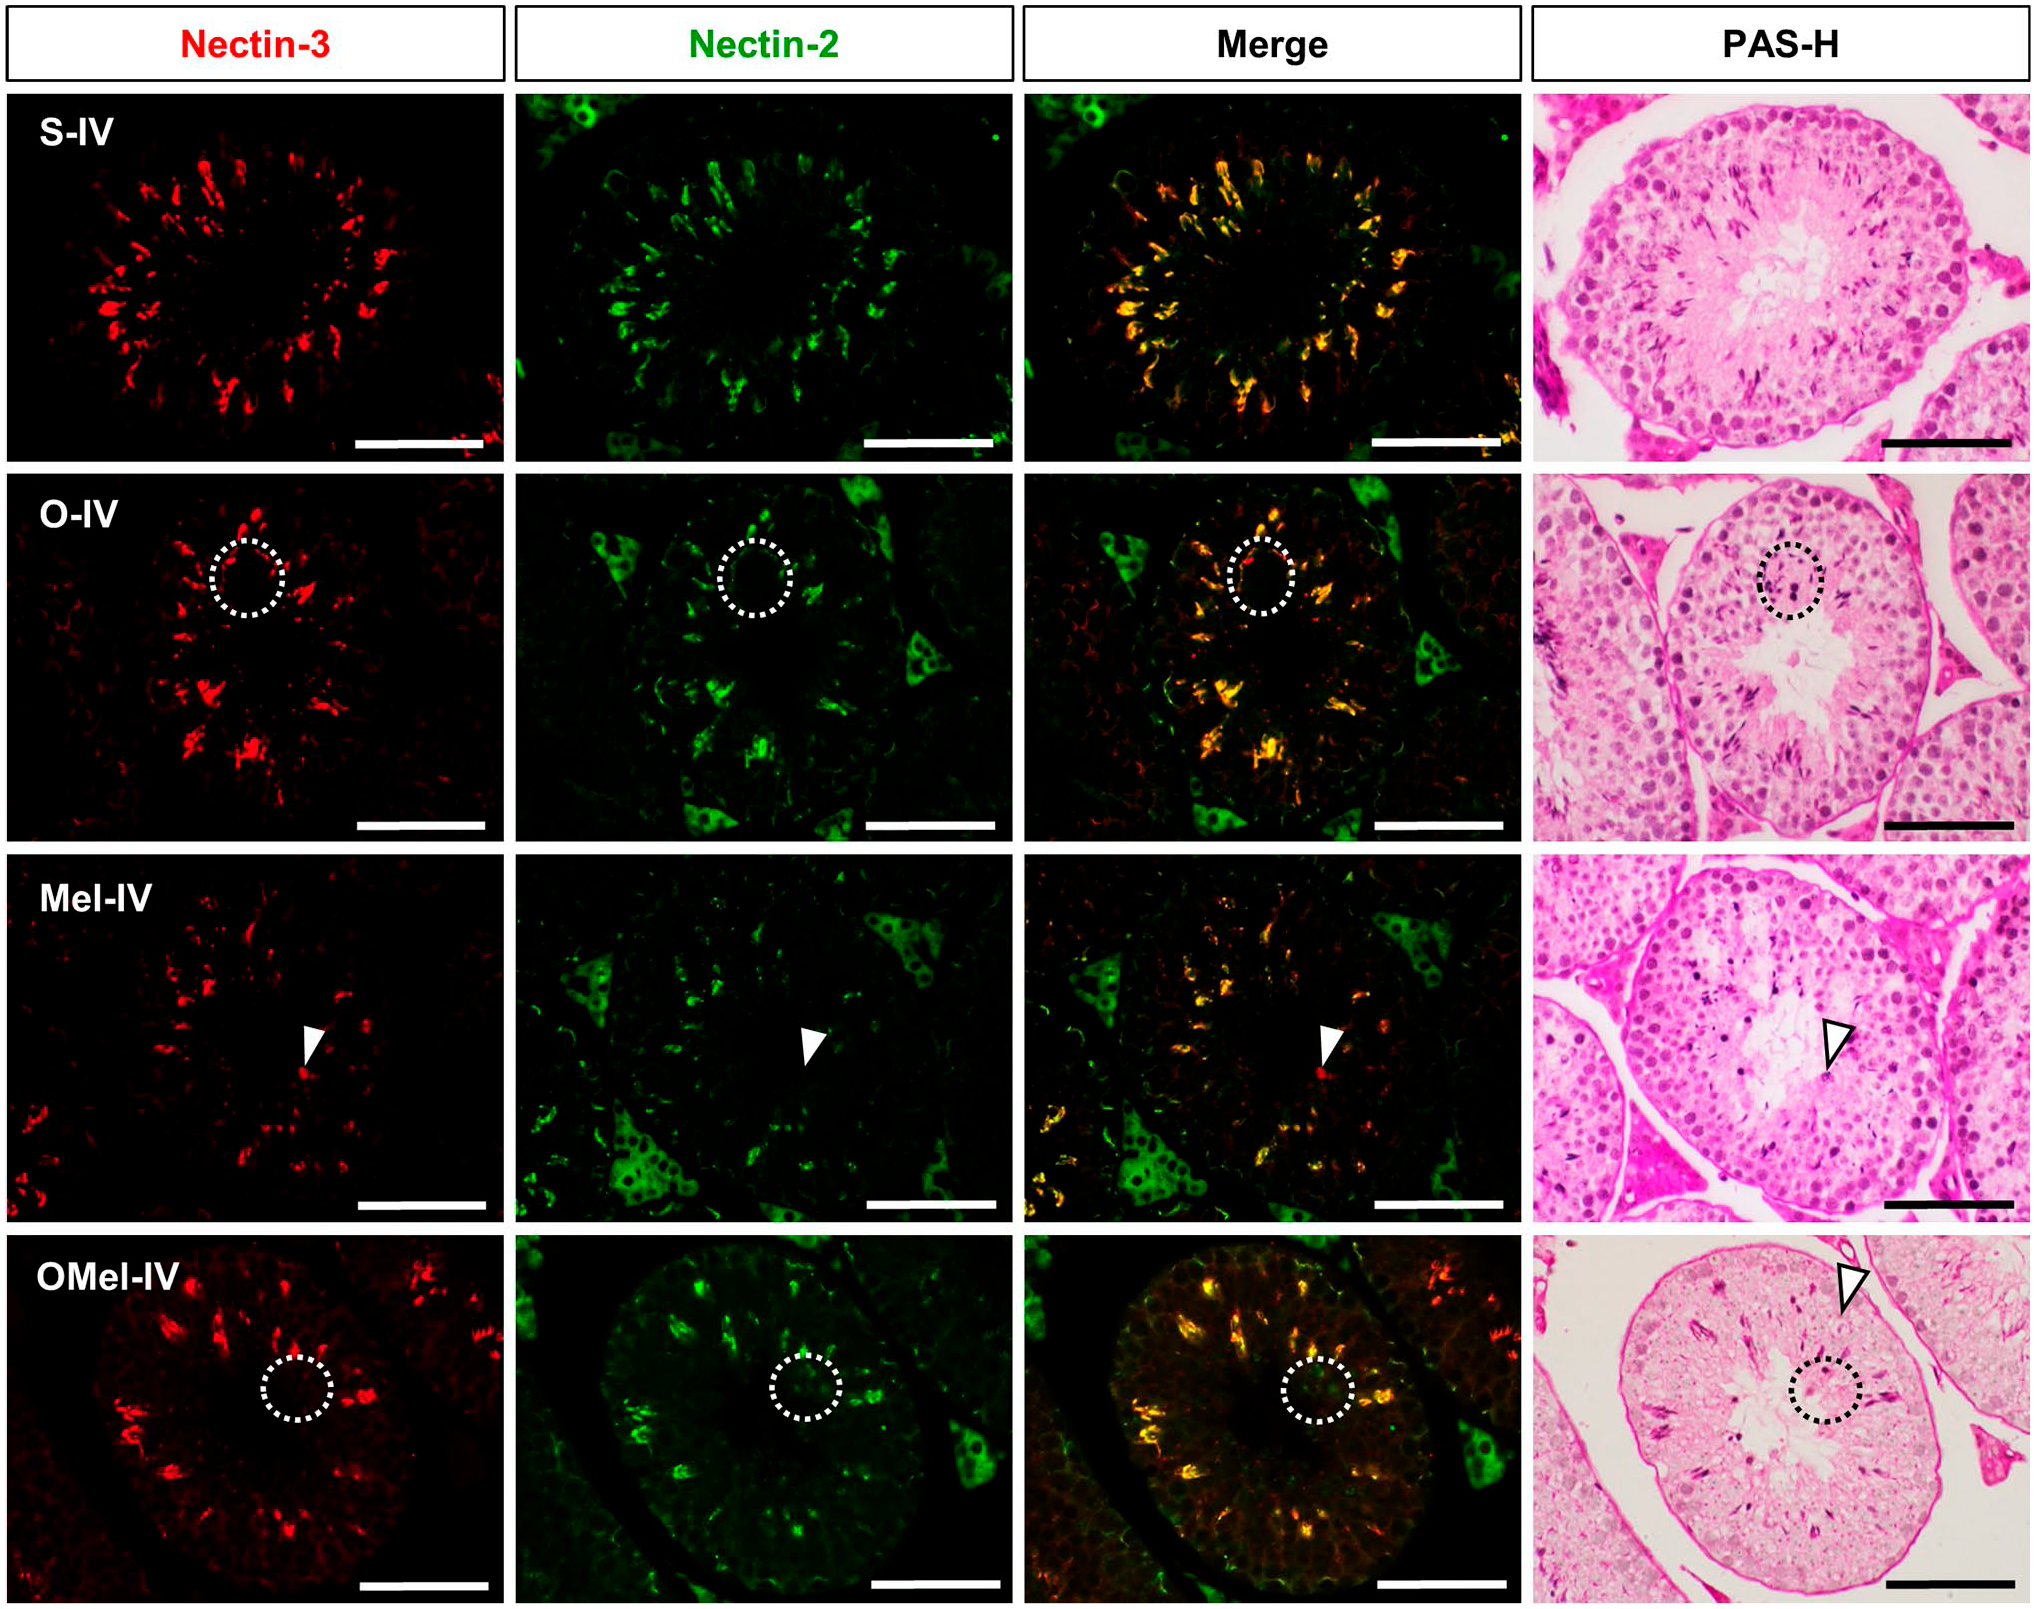
Fluorescence and H&E staining images of stage IV of seminiferous tubules. Nectin-3 (red) was expressed at the head of spermatids. Nectin-2 (green) was expressed in both the basal and luminal parts of the tubule. Hoechst (blue) was used to identify the nuclei. The co-expression of Nectin-2 and Nectin-3 (yellow) was revealed in the luminal region. O, Mel, and OMEl groups showed a strong expression of Nectin-2 and Nectin-3. The white oval dash in the O group presented an abnormal giant cell associated with the co-expression of Nectin-2 and Nectin-3. The Mel group had an abnormal spermatid that lost Nectin-2 and expressed only Nectin-3. The white oval dash in the OMel group showed an abnormal spermatid that had lost Nectin-3 expression. In addition, H&E staining of the OMel group found the failure-releasing sperm that had lost both Nectin-2 and Nectin-3. Scale bars = 50 µm.
Negative Nectin-3 Cells
Nectin-3 was situated in the plasma membrane of the sperm head and also influenced the shape of the sperm head. The abnormal spermatids did not express Nectin-3 and are referred to as negative Nectin-3. The normal development of spermatids in stages VII through VIII will be retained in the spermatid heads within the seminiferous epithelium and interacted with the Sertoli cell at the luminal region. Therefore, negative Nectin-3 which lost the interaction with the Sertoli cell had a high possibility of undergoing phagocytosis by the Sertoli cell. The negative Nectin-3 cells have the highest number in stage VIII of the seminiferous tubule, especially in O and Mel groups. In addition, in most stages of the tubule, there also was a significant increase in the number of negative Nectin-3 cells in both O and Mel groups when compared to the S group. On the other hand, expression of Nectin-3 in the OMel group was similar to that in the S group and showed significant numbers of negative Nectin-3 in stages II–III, VI, and IX (Fig. 5).
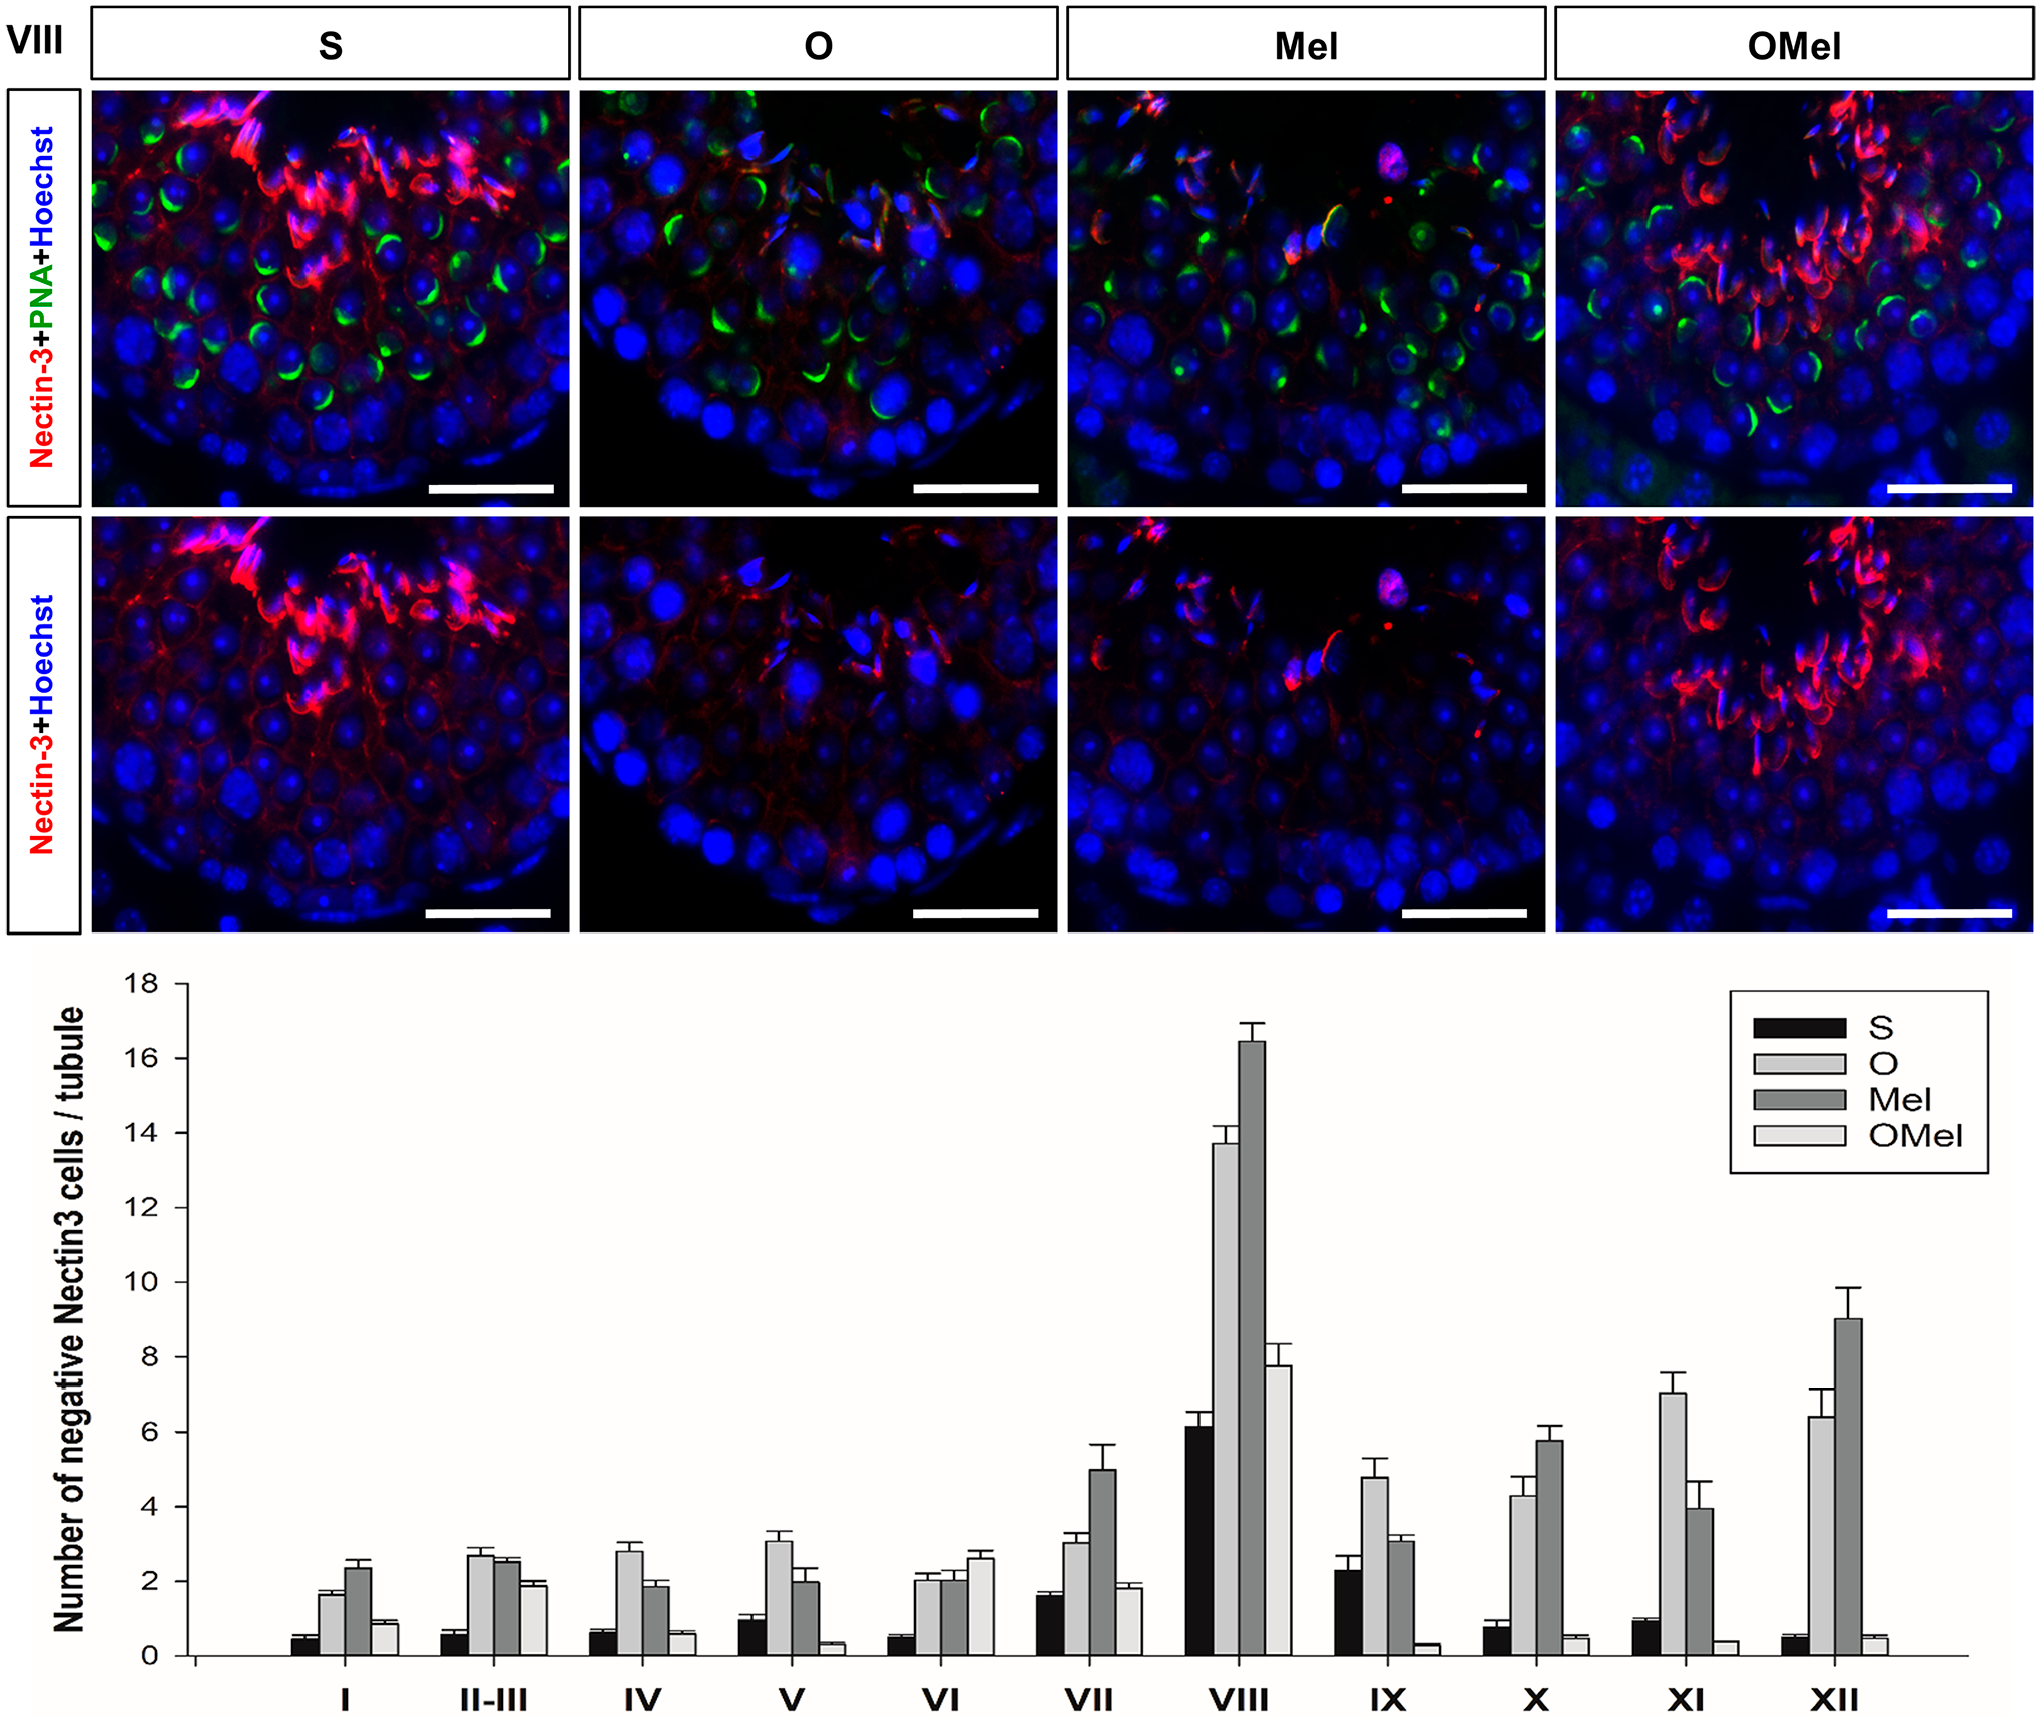
Nectin-3 expression and negative Nectin-3 cells. Nectin-3 (red) was expressed in the plasma membrane of the spermatid head. PNA (green) and Hoechst (blue) were used to identify acrosome and nuclei, respectively. Stage VIII of the seminiferous tubule revealed the decreasing expression of Nectin-3 in the luminal region of O and Mel groups. On the other hand, OMEl groups revealed a strong expression of Nectin-3, similar to the S group. The graph showed the highest number of negative Nectin-3 in stage VIII of the seminiferous tubule, especially in O and Mel groups. The recorded number of negative Nectin-3 was significant in almost all stages of the tubule both in O and Mel groups when compared to the S group. OMel group also showed significant numbers of negative Nectin-3 in stages II–III, VI, and IX. Scale bars = 50 µm.
Giant Cells and Autophagosomes in Testis
The multinucleated giant cell resulted from the damaged cells lacking the intercellular bridge, which caused them to fuse into one large cell. Our previous study explained the effect of higher abdominal temperature disrupting spermatogenesis, leading to the formation of these giant cells. The number of giant cells in the O (16.667 ± 2.539) and Mel (31.667 ± 2.155) groups exhibited a significant increase compared to the sham group (0.000 ± 0.000), while the Mel group also showed significant differences when compared to the O and Omel groups (5.333 ± 0.843). However, the number of giant cells in the OMel did not show significant differences compared to the sham group (Fig. 6).
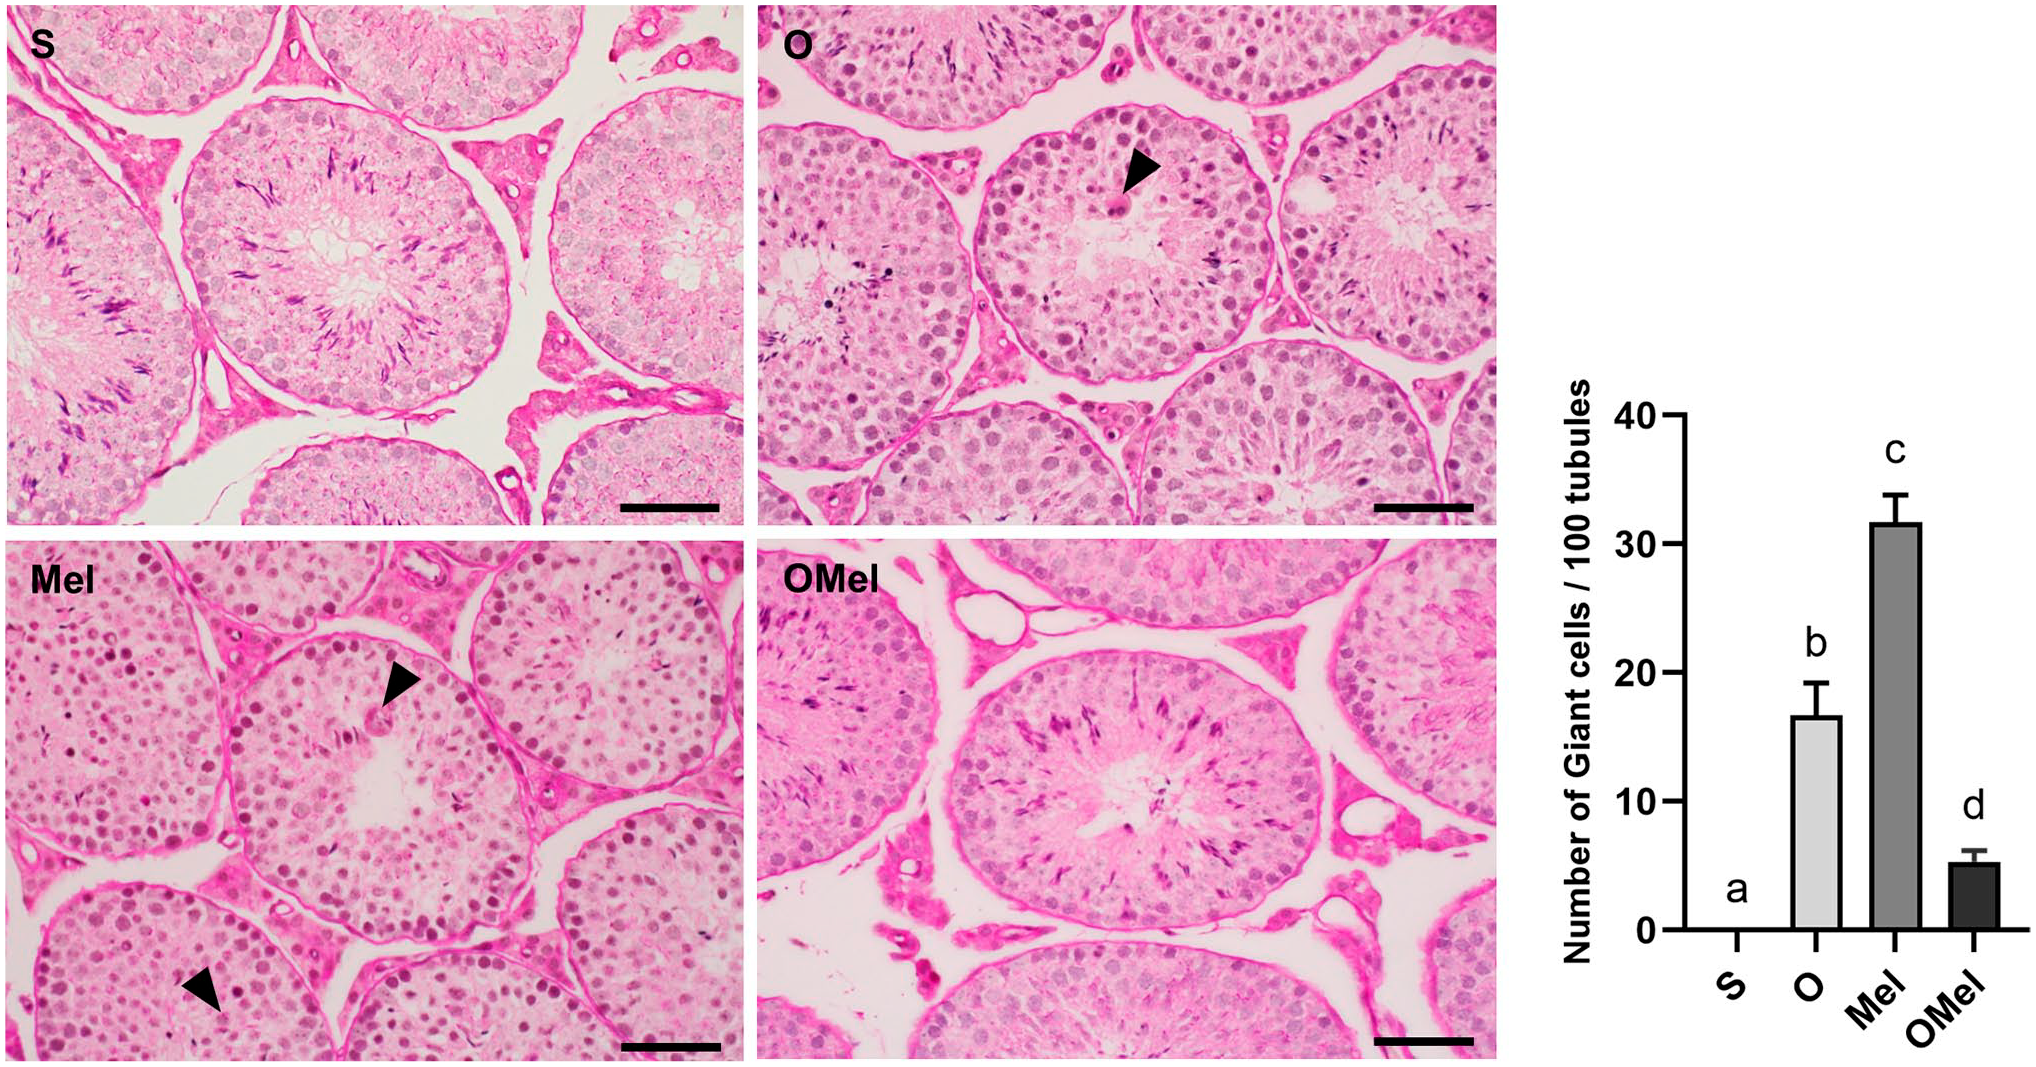
Giant cells are observed in the cross-section of testes with PAS-H staining. Multinucleated giant cells are identified using black arrowheads. The higher abdominal temperature disrupted spermatogenesis, leading to the formation of these giant cells. The seminiferous tubule of O, Mel, and OMel groups exhibited giant cells near the luminal area. The graph shows that the number of giant cells per tubule in both the O and OMel groups exhibited a significant increase compared to the sham group. However, the number of giant cells in the treatment OMel group did not show significant differences when compared with the sham group. The different letters (a vs. b; a vs. c; b vs. c; c vs. d) on the graph of the number of giant cells per 100 tubules indicate statistically significant differences at p<0.05. Scale bars = 50 µm.
Autophagy is a well-recognized lysosomal degradation pathway and a significant contributor to cellular clearance mechanisms. The concept of autophagy comprises three primary mechanisms: macroautophagy, microautophagy, and chaperone-mediated autophagy. Macroautophagy is a process where a double- or multi-membraned autophagosome fuses with a lysosome, facilitating nonspecific degradation, such as autophagosomes and autolysosomes. 24 We carefully examined the cytoplasm of Sertoli cells and observed that both the O and Mel groups exhibited autophagosomes, multivesicular bodies, as well as degenerating cells in the seminiferous tubule. In contrast, the ultrastructure of the OMel group displayed only a few instances of autophagosomes, similar to the sham group (Fig. 7).
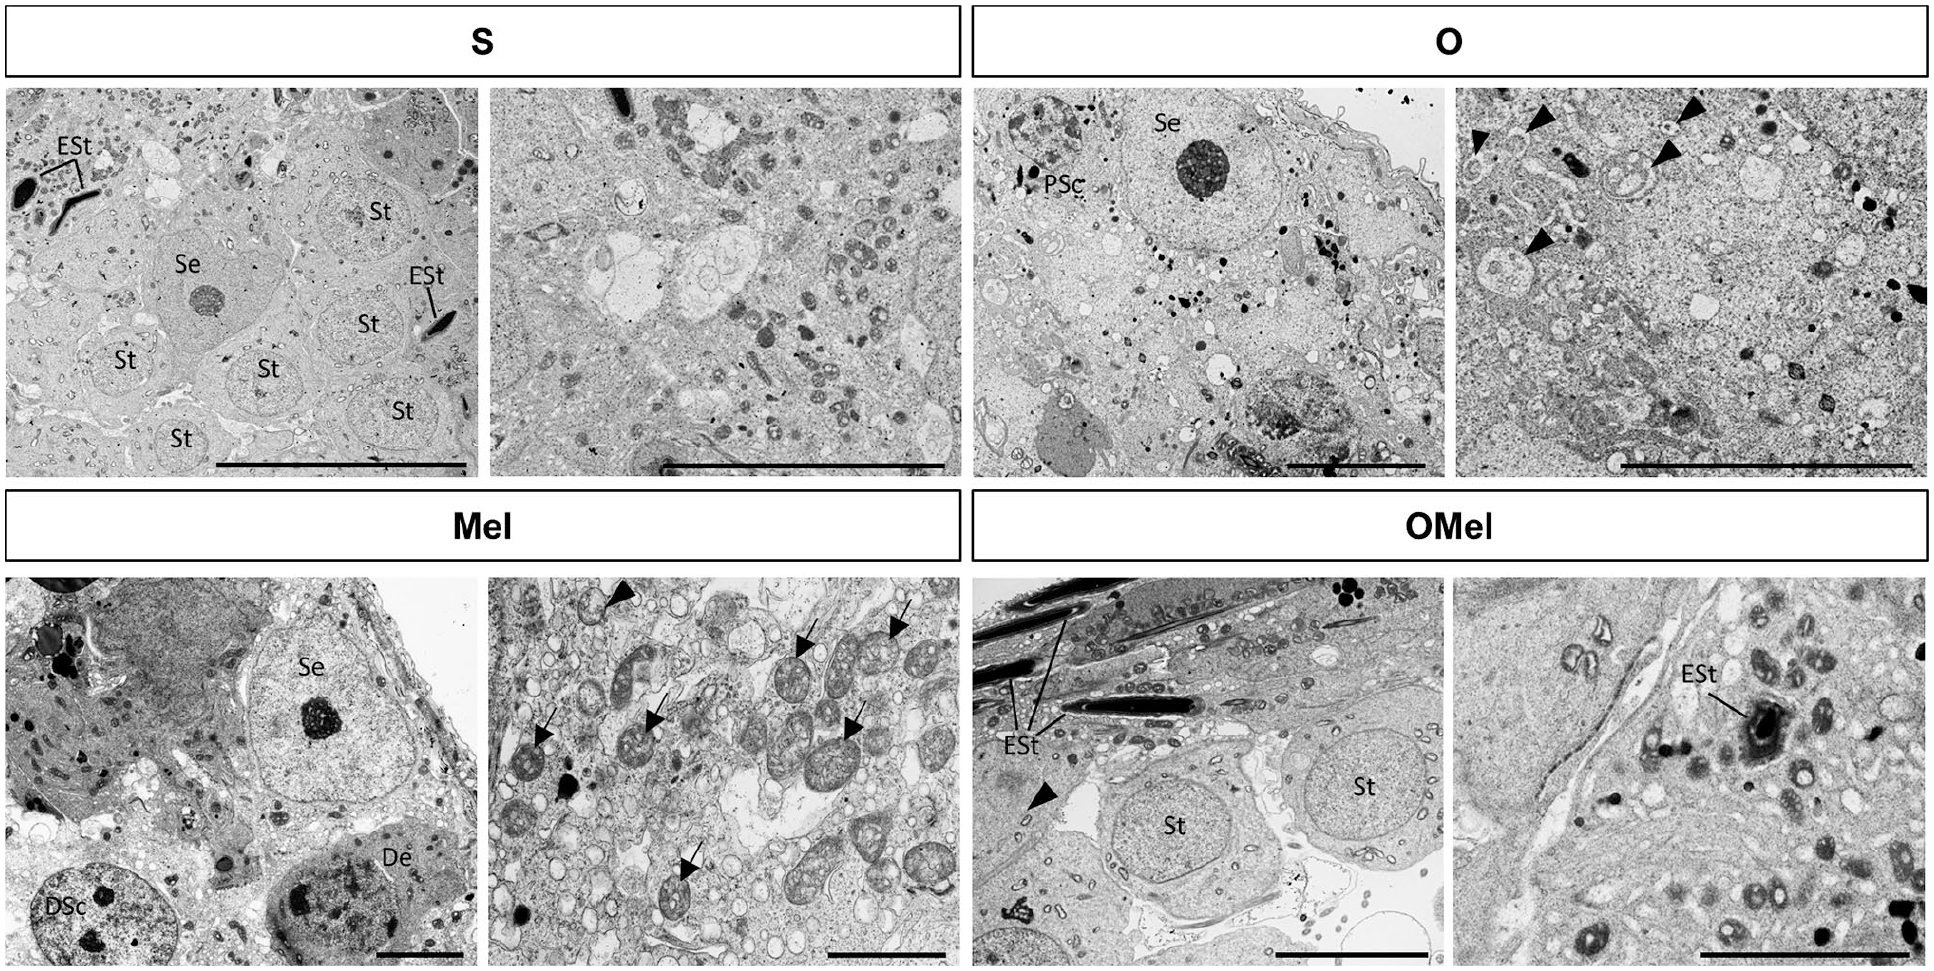
The ultrastructure of the testis revealed the presence of autophagosome in the seminiferous tubule. Testis in the sham group showed the normal ultrastructure in the seminiferous tubule. In both the O and Mel groups, degenerating cells, including autophagosome (arrowhead) and multivesicular bodies (arrow), were found in the cytoplasm of Sertoli cells. The ultrastructure of the OMel group showed a few instances of autophagy, resembling the sham group. Abbreviations: ESt, elongating spermatid; PSc, preleptotene spermatocyte; Se, Sertoli cell; St, spermatid. Scale bars: S group (5 µm and 2 µm), O group (2 µm), Mel group (2 µm and 500 nm), OMel group (2 µm and 1 µm).
COX2 Expression and TUNEL-Positive Apoptotic Cells
COX2 serves as a modulator of inflammatory pathways and is expressed in the cytoplasm of cells. It plays a role in the inflammatory process, cell proliferation, growth, and transformation. The immunofluorescence analysis of COX2 revealed its presence in the cytoplasm of spermatogonia and Sertoli cells within the basal compartment of seminiferous tubules. In addition, there was slight expression of COX2 in the cytoplasm of some elongating spermatids. These results were observed in the testis of the S group. Overexpression of COX2 was observed in spermatogonia, Sertoli cells, and round and elongating spermatids in both the O and Mel groups. The graph representing the threshold area (µm²) of COX2 expression in both the O (3624.244 ± 205.22) and Mel (3113.496 ± 178.754) groups exhibited a significant increase compared to the S group (1165.097 ± 63.52). However, COX2 expression in the OMel group (2074.548 ± 141.71) did not show a significant difference when compared with the S group (1165.097 ± 63.52) (Fig. 8).
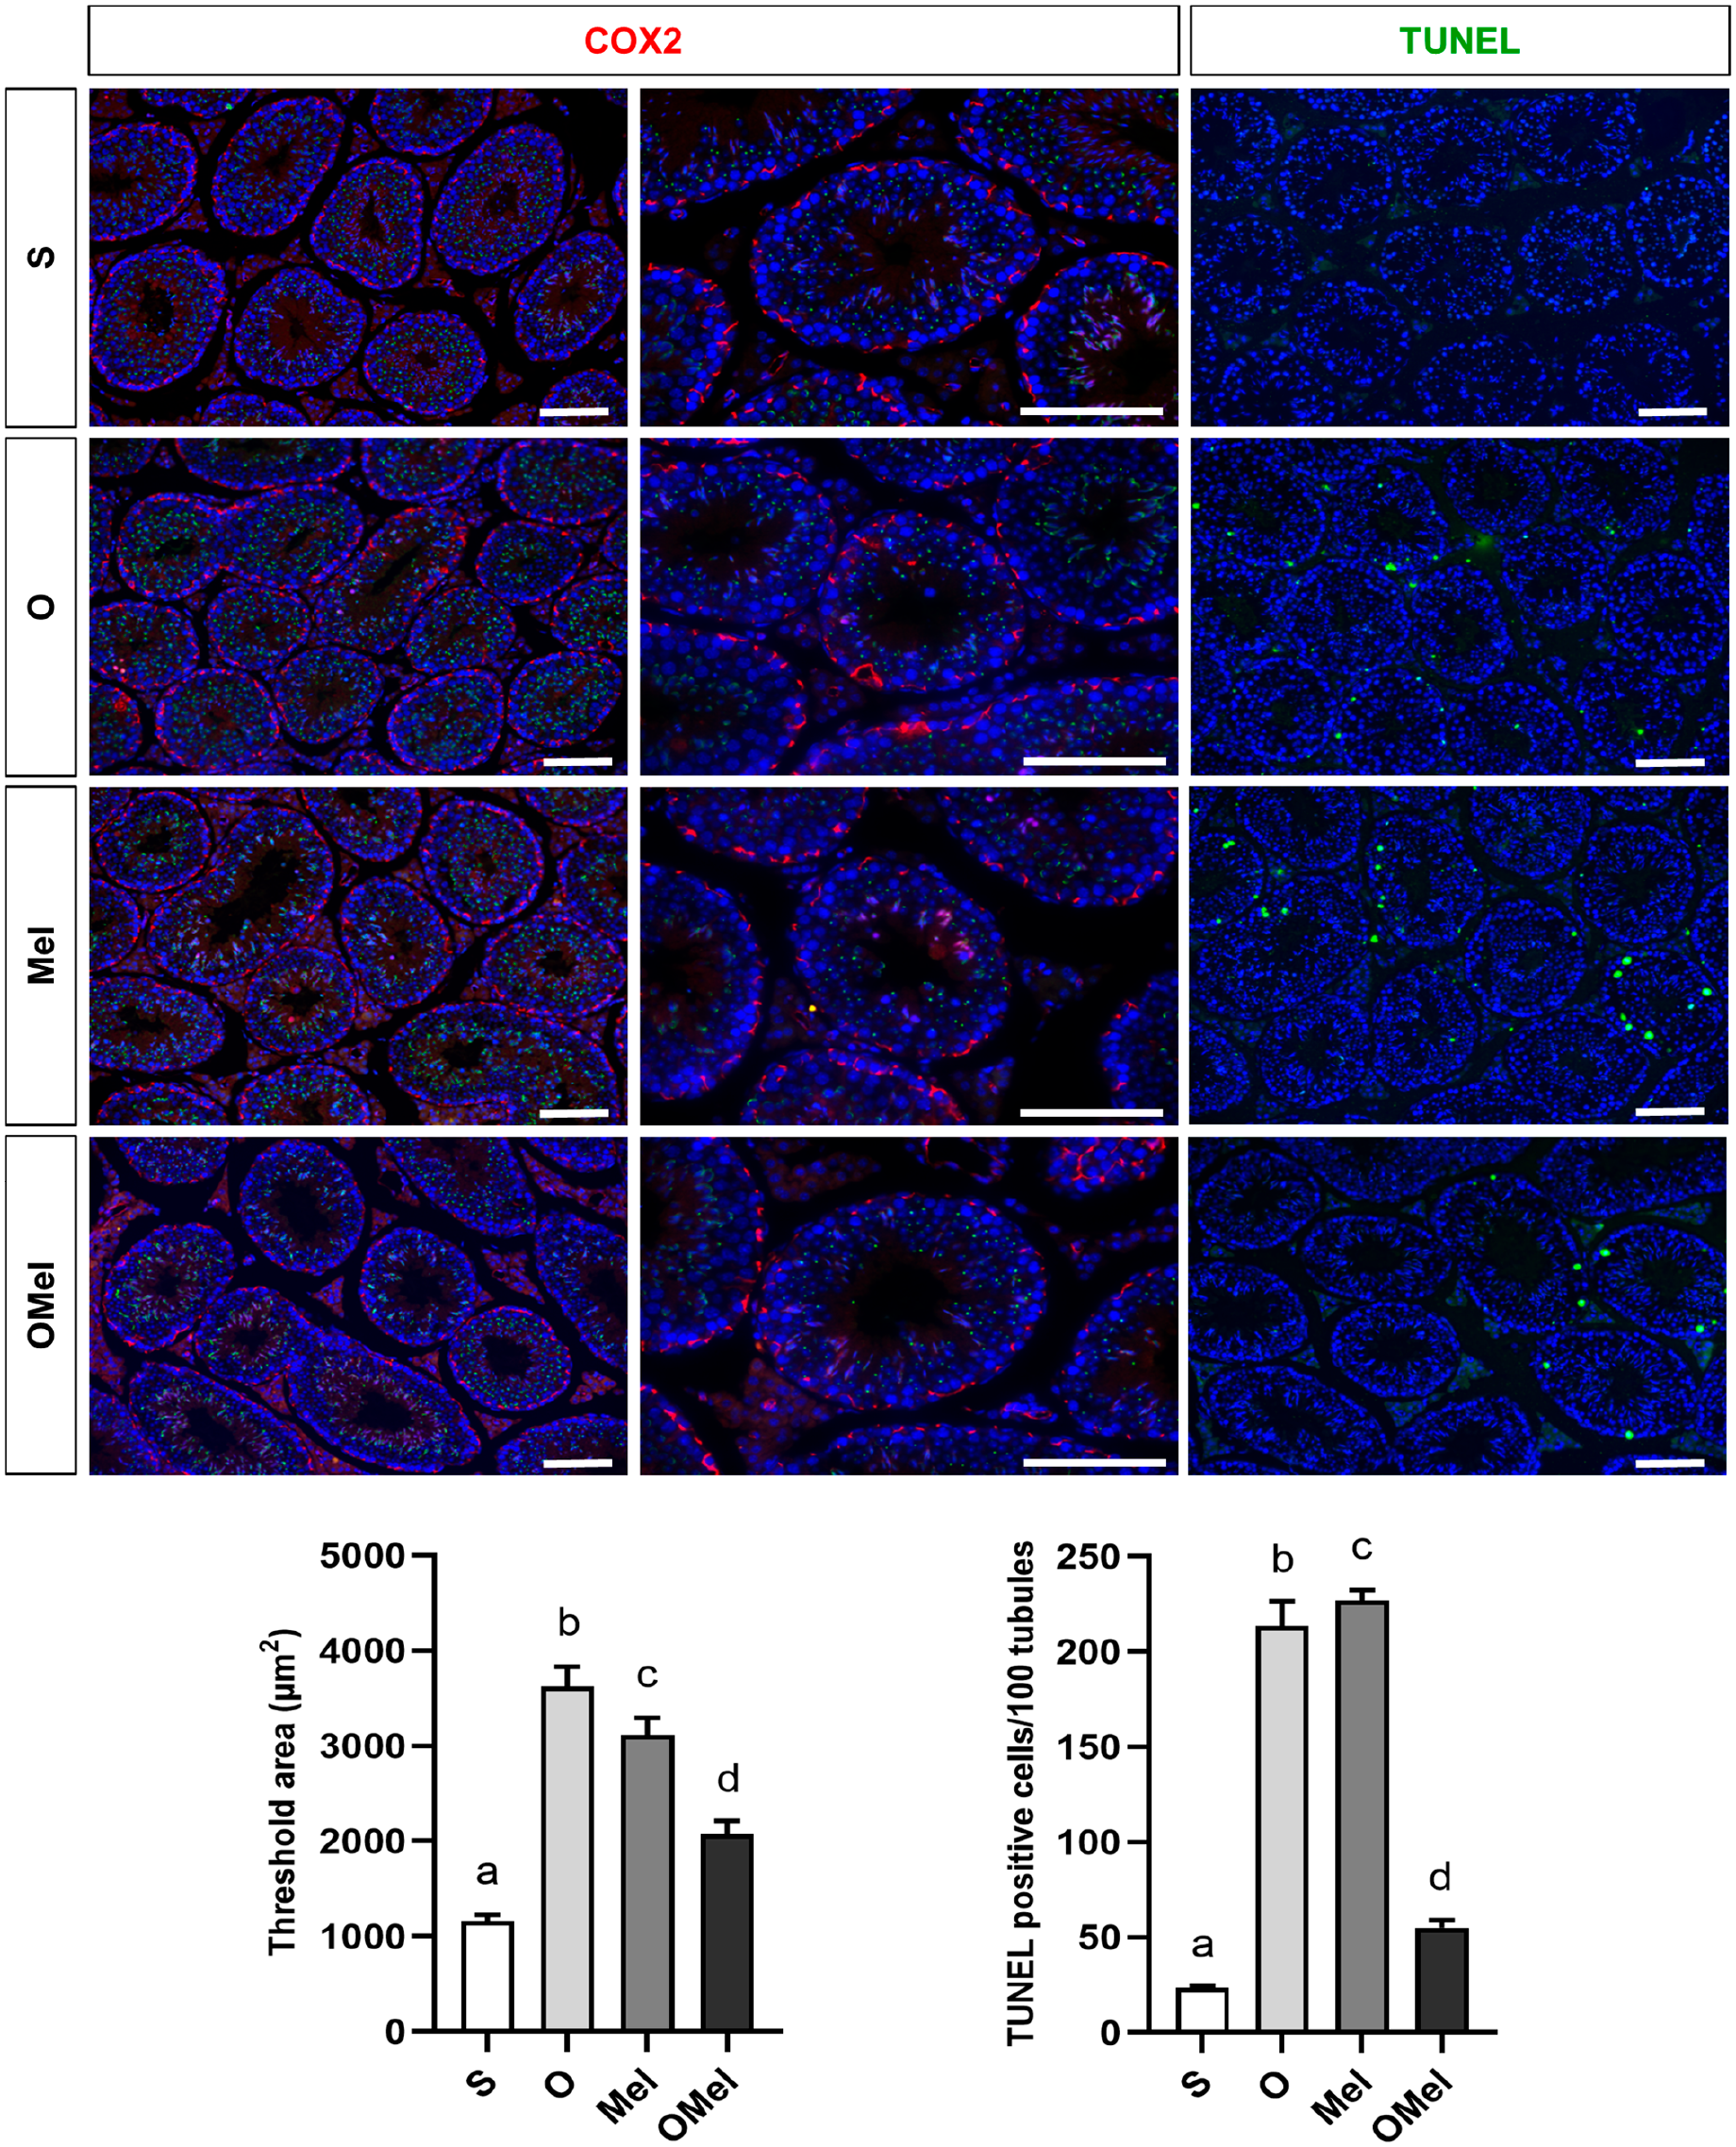
Immunofluorescence analysis of COX2 expression and TUNEL-positive cells was performed. In the S group, COX2 was strongly expressed in the cytoplasm of cells in the basal compartment of the seminiferous tubules, and it was slightly expressed in some elongating spermatids. In both the O and Mel groups, COX2 exhibited a stronger expression in some elongating spermatids, was strongly expressed in some round spermatids, and persisted in the basal compartment of the tubules. The OMel group displayed COX2 expression similar to that of the S group. The number of TUNEL-positive cells was low in the S group but increased in the treatment groups. A high number of positive cells were observed in both the O and Mel groups, while the number decreased in the OMel treatment group. The different letters (a vs. b, a vs. c, b vs. d) on the graph of threshold area (μm²) indicate statistically significant differences at p<0.01. The different letters (a vs. b, a vs. c, a vs. d, b vs. d, c vs. d) on the graph of TUNEL-positive cells per 100 tubules indicate statistically significant differences at p<0.05. Scale bars = 100 µm and 50 µm.
We performed the TUNEL assay to detect apoptotic cells within the treatment groups. Both the O and Mel groups exhibited a substantial number of TUNEL-positive cells in the tubules. In contrast, the OMel group displayed a lower number of TUNEL-positive cells. The graph represented the number of TUNEL-positive cells per 100 tubules. The number of positive cells within all treatment groups (O group {213.5 ± 13.051}, Mel group {227 ± 5.398}, OMel group {55.167 ± 3.936}) significantly increased when compared to that in the S group (23.5 ± 0.957). Furthermore, when comparing all treatment groups, a significant difference was also evident in the OMel group (Fig. 8).
Discussion
The elevated temperature in testes under the cryptorchidism model induced abnormal sperm development. Our results revealed that the cross-sections of testes in the O and Mel groups exhibited characteristics such as giant cells, detached germ cells, excessive residual cytoplasm in the luminal region, vacuolization in the seminiferous epithelium, and a failure of sperm release. Exposure of testes to abdominal temperature resulted in damage to spermatogenic cells, causing them to lack intercellular bridges and leading to their fusion into large cells known as multinucleated giant cells. Simultaneously, some spermatogonia lost interaction with their supporting Sertoli cells, resulting in detachment from the seminiferous epithelium into the lumen. Furthermore, vacuolization was observed in the cytoplasm of Sertoli cells, leading to a decreased ability of these cells to support the movement of developing sperm cells. 25 The previous study reported that the effects of melatonin oral administration with single doses of 0.05 and 0.01 mg/kg body weight led to germ cells with abnormal morphologies, the presence of giant cells, and vacuolization in the cytoplasm of Sertoli cells. The ultrastructure further supported the findings of the light microscopic study, revealing widened intercellular bridges and a dilated endoplasmic reticulum in the multinucleated giant cells. 26 In addition, successful orchidopexy to treat cryptorchidism during childhood, before the age of six months, does not guarantee normal fertility in adulthood. Following puberty, some patients may develop secretory azoospermia, leading to potential infertility in up to 35% of boys as they grow older.27,28 Hence, one treatment alone cannot improve the completed spermatogenesis in cryptorchidism. Our study has shown that the combined treatment of orchidopexy and melatonin in the OMel group can enhance the histological features of the testes, including the size of tubules, similar to the S group.
In classical understanding of melatonin function, melatonin binds to its receptors, which are MT1 or MT2, and interacts with secondary messengers such as adenylyl cyclase (cAMP), phospholipase A2, and phospholipase C. Melatonin regulates various physiological processes by reducing cAMP and cyclic guanosine monophosphate levels, while concurrently increasing diacylglycerol and inositol triphosphate production. 29 Melatonin potentially exerts direct effects on the male reproductive system through interactions with its receptors located in the testes and epididymis.2,30 Several studies have reported on the effects of melatonin treatment in improving sperm parameters. The subcutaneous melatonin implantation in rams during the non-breeding season increased the progressive motility rate of sperm, modified sperm motility, and the number of spermatozoa bound to the zona pellucida of immature oocytes, resulting in improved fertilization parameters. 31 In a study on human spermatozoa, incubating spermatozoa with 1 mM of melatonin for 30 min in seminal fluid revealed an increase in the percentage of motile spermatozoa and a reduction in the number of static cells, thereby enhancing the number of rapidly progressive cells. 32 A recent in vitro study on human spermatozoa reported that melatonin treatment for 60 min improved sperm parameters (sperm motility, sperm morphology, and sperm count) after exposure to toxic elements such as cadmium and also decreased the level of DNA fragmentation. 33 Our study showed that spermatozoa in the caput epididymis of the OMel group appeared to be similar to that in the S group, while detached germ cells and debris in the lumen were present in both the O and Mel groups. Moreover, melatonin treatment improved sperm head morphology, as represented by SEM images (Fig. 2).
Cadm1 consists of a structure that includes three extracellular immunoglobulin-like loops, a signal peptide located at the N-terminal, a transmembrane domain, and a brief intracellular domain. The second Ig-like domain of Cadm1 facilitates the formation of a cis-dimer, while its first Ig-like domain contributes to the creation of a trans-dimer. Within the intracellular domain, there are two motifs that bind to proteins and interact with actin. 19 Cadm1, which is found on spermatogenic cells, engages in heterophilic binding with the poliovirus receptor on Sertoli cells and homophilic binding with other spermatogenic cells. Cadm1 is expressed in the plasma membrane of intermediate spermatogonia through early pachytene spermatocytes, with steps 7–16 elongating spermatids, including the caudal portion of elongating spermatids in the mouse testis. 23 The high abdominal temperature disrupted Cadm1 expression and led to abnormal or delayed development of spermatogenic cells. Our previous study showed that Cadm1 expression decreased significantly in both spermatogonia and spermatocytes after inducing surgical cryptorchidism for 21 and 28 days. 25 In stage XI of the seminiferous tubules in both the O and Mel groups, meiotic cell division was observed in the seminiferous epithelium, resulting from delayed spermatid development. Wakayama et al. classified spermatogenic cell types relative to the stage of the seminiferous tubule in mice using immunofluorescent techniques. In stage XI of the normal seminiferous tubules, only one type of spermatid, the elongated spermatid, is observed. When cell division is evident, the tubule is classified as being in stage XII. 34 In addition, we found spermatids that had lost PNA expression in the acrosome, revealing decreased Cadm1 expression in their plasma membrane. However, the combined treatment of relocating the testis with melatonin injection improved the expression of Cadm1 in the OMel group. The surgical relocation of the cryptorchid testis to the scrotum creates an optimal environment for spermatogenesis.35,36 Studies have indicated that melatonin administration regulates lactate metabolism in Sertoli cells, where lactate serves as a vital nutrient, preventing apoptosis. 37 Earlier in vitro research showcased lactate from Sertoli cells as a critical energy source for round spermatids 38 and pivotal for the activity and survival of pachytene spermatocytes. 39 Melatonin receptors (M1 and M2) have been identified in the plasma membrane of Sertoli cells and germ cells.1,2 Melatonin can permeate the cell plasma membrane and also bind to nuclear receptors such as the retinoic acid receptor (ROR) and retinoid Z receptor (RZR). 40 Furthermore, the nucleus of Sertoli cells is known to contain binding sites for the RORα, 41 suggesting that melatonin treatment can impact Sertoli cell function, crucial for supporting normal spermatogenic cell development. In addition, melatonin supplementation significantly increased testosterone production and promoted the differentiation of cultured spermatogonial stem cells into haploid germ cells during spermatogenesis. Melatonin suppressed the level of cAMP in the early stage of differentiation and promoted cAMP production in the later stage. 42 The transcription factor cAMP-response element modulator (CREM) plays a pivotal role in initiating the differentiation of germ cells into spermatozoa. 43 Therefore, the improvement in Cadm1 expression in germ cells in the Mel and OMel groups represented the effect of melatonin treatment aimed at promoting germ cell development directly and indirectly through the Sertoli cells.
The systematic review and meta-analysis reported the effects of melatonin on preserving Sertoli cells against injuries, leading to an improvement in the level of inhibin-B, which is a potential marker of testicular function and spermatogenesis. 44 Furthermore, melatonin increased the expression of inhibin-B through its MT1 and MT2 receptors in bovine Sertoli cells. 45 Sertoli cells are the sole somatic cells within the seminiferous tubules that directly interact with spermatogenic cells through apical ectoplasmic specializations (ES). They also engage with neighboring Sertoli cells through basal ES.46,47 The basal ES consist of overlapping and incorporated tight, gap, and desmosome-like junctions. Within these complexes, the tight junctions form the blood–testis or blood–Sertoli barrier, 46 which serves as a physical barrier controlling the onset of meiosis and segregating spermatogonia in the basal part from spermatocytes and spermatids in the apical part. 47 Nectin-2 is the Ca2+-independent immunoglobulin-like cell–cell adhesion molecules that is localized both in the Sertoli–Sertoli junctions of the basal ES and also interacts with Nectin-3 at the Sertoli–spermatid junctions of the apical ES.48,49 In our study, we observed normal Nectin-2 localization at the basal ES across all experimental groups. However, the treatment groups (O, Mel, and OMel) continued to display the lack of co-expression between Nectin-2 and Nectin-3 in abnormal spermatids. In addition, the spermatozoa that had been released into the adluminal region tubule exhibited the absence of both Nectin-2 and Nectin-3 expression. Nectin-3 is found in the plasma membrane of the head portion of spermatids and interacted with Nectin-2 in the apical region of the seminiferous epithelium.25,48 Our immunofluorescent results revealed the highest number of negative Nectin-3 cells, found in stage VIII of the seminiferous tubule, particularly in O and Mel groups. The Nectin-3 negativity, which has lost interaction with Sertoli cells, has a high probability of being phagocytosed by Sertoli cells. The quantitative analysis of spermatogenic cells in nectin-2-/- and nectin-3-/- mutants within the seminiferous tubules highlighted that the absence of interaction between elongating spermatids and Sertoli cells, mediated by these cell adhesion molecules, could compromise spermatid maturation, consequently causing their gradual detachment from Sertoli cells. 50 Kanzaki et al. delved into the role of nectin–afadin complex in platelet-derived growth factor–induced cell survival, revealing the ability of Nectin-3 to prevent apoptosis by regulating the activation of the phosphatidylinositol 3-kinase–Akt survival signaling pathway. 51 The results from the OMel groups showed a decrease in the number of negative Nectin-3 cells, presenting a similar appearance to the S group. Thus, the combined treatment may have effectively improved the function of cell adhesion molecules, thereby maintaining normal spermatogenesis.
Furthermore, Nectin-3 expression had correlated with normal sperm head shape. 52 The SEM image of epididymal sperm heads also confirmed the abnormality in sperm head morphology when they lost the co-expression of Nectin-2 and Nectin-3. An apical hook shape was observed in both the S and OMel groups. However, in the OMel group, the sperm head morphology displayed a slight flexion at the starting point of the curve and near the hook’s terminal end. Conversely, some spermatozoa in the O and Mel groups exhibited round-shaped heads, while others showed a slight protrusion but did not form the characteristic hook shape. The plasma membrane covering the acrosome of the sperm head contains a combination of glycosphingolipids, cholesterol, and protein receptors organized in glycolipoprotein lipid microdomains known as lipid rafts.53,54 During fundamental physiological processes like spermatogenesis, sperm capacitation, and the acrosome reaction, there is a general increase in ROS production, resulting in oxidative stress. 55 Lipid peroxidation occurs when ROS interact with susceptible lipids on cell membranes. All lipid constituents within the spermatozoa membrane are susceptible targets for lipid peroxidation. 56 This means that lipid peroxidation within the plasma membrane of sperm head disrupts the typical expression of Nectin-3, potentially causing abnormal head shape development.
Several studies have reported the effect of melatonin in reducing ROS, including lipid peroxidation in male reproduction.3,11,12 In an in vitro study, human spermatozoa were incubated with 2 mM of melatonin, which reduced nitric oxide induced by bradykinin through an upstream mechanism. 57 Melatonin and its metabolites, including cyclic 3-hydroxymelatonin, N1-acetyl-N2-formyl-5-methoxykynuramine, and N1-acetyl-5-methoxykynuramine, have the capability to scavenge free radicals. This is achieved through successive dehydrogenations, the formation of stable radical adducts, and by enhancing their properties as electron donor acceptors. 58 In addition, melatonin raised the levels of the antioxidant glutathione and increased the activities of antioxidant enzymes, such as glutathione peroxidase, SOD, and CAT. 59 Our previous study found that the cryptorchid testis, in which the testis remained fixed in the abdominal cavity for 21 days, exhibited giant cells in the seminiferous epithelium. The testicular ultrastructure of the group at 21 days post-operatively revealed numerous degenerating cells, autophagosome, and multivesicular bodies, including apoptotic cells. 25 We observed the presence of autophagy and multivesicular bodies in the cytoplasm of Sertoli cells in both the O and Mel groups. However, in contrast, the ultrastructure of the OMel group showed only a few instances of autophagosome, which were similar to those observed in the S group. ROS can oxidize and impair lipids, proteins, and DNA, leading to mitochondrial dysfunction, a state commonly referred to as oxidative stress. 60 Oxidative stress could encourage the formation of autophagy, which might help reduce oxidative damage by engulfing and breaking down oxidized substances. This initiation of autophagy due to oxidative stress leads to a subsequent reduction in ROS through autophagy. 61 Hence, the overproduction of ROS could amplify cell damage, whereas the role of autophagy might demonstrate dual effects.62,63
We found the COX2 overexpression in spermatogonia, Sertoli cells, and round and elongating spermatids in both the O and Mel groups. The O and Mel groups displayed a significant number of TUNEL-positive cells in the tubules compared to the S group, while the OMel group had a lower count of positive cells. The COX and lipoxygenase pathways play crucial roles in resolving inflammation by metabolizing arachidonic acid and other fatty acid precursors. 64 In response to inflammation, COX2 is activated and then induces the synthesis of pro-inflammatory prostaglandins (PGs). 65 These PGs regulate steroidogenesis in Leydig cells and the uptake of glucose in Sertoli cells. Consequently, the COX2/PG system within Leydig and Sertoli cells acts as a localized regulator of testicular activity, potentially impacting spermatogenic efficiency. 66 Regarding the effects of daily oral melatonin supplementation in infertile men, a decrease in inflammatory markers such as COX2, nucleotide-binding oligomerization domain, leucine-rich repeat, pyrin domain-containing-3, IL1β, and TNFα was observed. 5 Moreover, heat-induced stress in the testis resulted in the translocation of the heat shock protein family A (Hsp70) member 2HSPA2 into nuclei, correlating with cell apoptosis. Melatonin may have a potential in protecting the testis against heat-induced damage. 7 In an in vitro study, melatonin has been shown to facilitate self-renewal in spermatogonia 67 and promote the development of haploid germ cells. 42 In addition, a systematic review and meta-analysis on melatonin’s safety in adults over 30 years of age concluded that doses ≥10 mg are safe. However, higher doses over longer durations require comprehensive reporting on adverse events to confirm safety. 68
In summary, our findings indicate that immediate post-surgical administration of melatonin subsequent to orchiopexy enhances the histological characteristics of the testis and ameliorates sperm head morphology probably by normalizing the expression of pivotal cell adhesion molecules essential for spermatogenesis, particularly Cadm1, Nectin-2, and Nectin-3. Melatonin, recognized for its antioxidative properties and ability to scavenge free radicals, plays a pivotal role in antioxidation and has the potential to reduce inflammation induced by high abdominal temperatures. However, this study does not elucidate the specific pathway or mechanism underlying the melatonin-induced enhancement of cell adhesion molecule expression in heat-induced testis. Moreover, our investigation solely targeted three specific types of cell adhesion molecules and did not encompass an examination of all varieties present in the testis. Nevertheless, the data presented in this study suggest that combining orchiopexy with melatonin holds promise as a viable approach for further exploration to advance patients’ treatment.
Footnotes
Acknowledgements
I am grateful to Mae Fah Luang University for providing me with the opportunity to conduct research in Japan. I extend my sincere appreciation to Prof. Tomohiko Wakayama and the members of the research team in the Department of Histology at Kumamoto University for their continuous support in improving laboratory processes and providing research materials. I would like to express my gratitude to Dr. Roger Timothy Callaghan for his assistance with grammatical accuracy and English manuscript refinement. Finally, I offer my heartfelt thanks to Prof. Seiji Okada from the Center for AIDS Research at Kumamoto University for critically reviewing the manuscript and providing invaluable comments.
Competing Interests
The author(s) declared no potential conflicts of interest with respect to the research, authorship, and/or publication of this article.
Author Contributions
AW and TW designed research; AW, KN, TW performed the experiments; AW, KN, TS, KaS, and TW analyzed data; all authors reviewed the results; AW wrote the manuscript; AW and KeS edited and approved the manuscript.
Funding
The author(s) received no financial support for the research, authorship, and/or publication of this article.