
Abstract
Icing interventions on the injured skeletal muscle affect the macrophage-related regenerative events and muscle repair. However, despite its importance for the practice in sport medicine, the influence of different icing protocols on muscle regeneration remains unclear. Here, using a rodent model of mild muscle injury with necrosis in a small fraction of myofibers, the injured animals were allocated to four groups: non-icing control (Con) and a single treatment (Ice-1), three treatments (Ice-3), or nine treatments (Ice-9) with a 30-min icing each time within two days following injury. Muscle regeneration was compared between the groups on post-injury days 1, 3, 5, and 7. The results showed that compared with the Con group, muscle regeneration was faster in the Ice-9 group (but not in the Ice-1 and Ice-3 groups), as indicated by more rapid accumulation of satellite cells within the regenerating area and enlarged size of regenerating myofibers (p<0.05, respectively). There was also less macrophage accumulation (p<0.05) and a trend toward early removal of necrotic myofibers in the damaged/regenerating area in the Ice-9 group (p=0.0535). These results demonstrate that in the case of mild muscle damage, more frequent icing treatment is more effective to stimulate muscle regeneration.
Introduction
Accumulating evidence demonstrates that icing, which is a traditional mainstay treatment following musculoskeletal injury, is often detrimental to muscle repair in animal experiments.1–4 However, a recent study using an experimental animal model of mild muscle injury demonstrated that icing assists muscle regeneration in conditions where necrosis is limited to a small fraction of myofibers (4.0 ± 0.5%). 5 Still, there remains a possibility that the effectiveness of post-injury icing depends not only on the extent of muscle damage but also on the icing protocol, given the various durations and/or repetitions of icing conducted in earlier investigations,1–6 as in clinical settings. 7 Therefore, further research is required to compare the effects of different icing protocols on muscle repair following mild muscle injury.
Skeletal muscle regeneration relies on resident muscle stem cells, known as satellite cells, that are activated upon injury.8–10 Satellite cells proliferate and migrate to the site of injury where they differentiate to form new myofibers that replace the damaged/necrotic myofibers.9,10 During the initial phase of the muscle regeneration process, macrophages accumulate in the damaged myofibers, mount an inflammatory response, phagocytose necrotic muscle debris, and secrete pro-myogenic factors. 11 Icing, applied either once or repeatedly following muscle damage, attenuates macrophage accumulation in the injured muscles and affects the efficiency of muscle regeneration.1,3–5,12,13 In the case of mild muscle injury, repeated icing interventions diminish macrophage infiltration. 5 This effect occurs in parallel with an early accumulation of myogenic cells within the area that is regenerating. 5 However, it remains unknown whether a difference in the icing protocol affects the macrophage distribution and subsequent myogenic events during muscle regeneration.
The aim of the present study was to investigate the effects of different icing protocols on the regenerative process of skeletal muscles following mild muscle injury in rats. A single application or repeated applications of ice pack for 15–30 min within a few days after injury or exercise have been used in both human14,15 and experimental animal1,5,6 research. In the present study therefore, we conducted an icing application for 30 min with varying repetitions (i.e., once, three times, and nine times) to elucidate their effects on macrophage accumulation and the myogenic process following muscle damage.
Materials and Methods
Animals
A total of 62 eight-week-old male Wistar rats (Japan SLC Inc., Shizuoka, Japan) were used. Rats were given free access to food (CE-2; CLEA Japan, Inc., Tokyo, Japan) and water throughout the experiments. All animals were housed in a controlled environment, at 22°C ± 2°C and with a 12:12-hr light/dark cycle. This study was approved by the Institutional Animal Care and Use Committee and conducted according to the Kobe University Animal Experimentation Regulations (approval number: P200906).
Induction of Muscle Injury
Mild muscle injury was induced by crushing the extensor digitorum longus (EDL) muscle according to a method previously described. 5 First, with the animal under isoflurane anesthesia (induction: at 4% in air, maintenance: at 2.5% in air, gas flow: 400 ml/min), the anterolateral surface of the hindlimb was shaved, and a longitudinal, approximately 20-mm-long incision was made to expose the EDL muscle. Next, the anterolateral skin surface was marked halfway along the 20-mm-long longitudinal incision with a fine-point marker to ensure a consistent induction of muscle injury. The muscle belly was crushed at the marked point by clamping it for 30 s with forceps to which a 250-g weight was attached, causing necrosis in only 4.0 ± 0.5% of myofibers. 5 Both legs in each animal were injured on different days as conducted previously. 5 Specifically, a pair of injury was induced on day 1 (right leg) and day 5 (left leg) or on day 3 (right leg) and day 7 (left leg). In addition, four animals were purchased to obtain uninjured control muscles (right leg), while the other leg (left) was injured to be used as a sample on day 7 in each group.
Icing Protocols and Sample Collection
Following the induction of muscle injury, the rats were randomly divided into the following four groups: (1) no icing (Con), (2) 30-min icing immediately after injury (Ice-1), (3) 30-min icing immediately after injury and at 24 hr and 48 hr after injury (Ice-3), and (4) 30-min icing repeated three times over 90-min intervals immediately after injury and at 24 hr and 48 hr after injury (Ice-9). These icing protocols were designed based on previous reports.1,5,16 An ice pack was prepared by enclosing crushed ice in a polyethylene bag. The ice pack was then applied to the surface of the injured muscles with minimum compression, controlled just to touch the skin. Every icing treatment was performed under isoflurane anesthesia (induction: at 4% in air, maintenance: at 2.5% in air, gas flow: 400 ml/min). During the 30-min icing treatment, the muscle surface temperature, measured with a digital thermometer (model 3527A; Tsuruga Electric Co., Osaka, Japan), decreased by 15.9°C ± 0.5°C (29.7°C ± 0.3°C at the beginning to 13.8°C ± 0.6°C at the end) and returned to the initial level (30.4°C ± 0.7°C) by the start of the following treatment (these values are the mean ± standard error of the mean). 5 Animals in the Con group were also anesthetized during the same period, but no ice was applied to the injured muscles. On post-injury days 1, 3, 5, and 7, the animals were euthanized with an overdose of isoflurane (at 5% in air, gas flow: 400 ml/min). Samples of their injured EDL muscles were harvested and immediately frozen in dry-ice-cooled acetone and stored at −80°C until analysis.
Morphological Analysis
Transverse thin cryosections (10 μm) of frozen EDL muscles, obtained using a cryostat (CM-1850; Leica Microsystems, Nussloch, Germany), were mounted on glass slides (SCRE-02; Matsunami Glass Ind., Ltd., Osaka, Japan). All cryosections were prepared by a single investigator (IN) to minimize technical errors and data variations in the subsequent analyses. Sections were stained with hematoxylin and eosin (H&E) or used for immunohistochemistry, as described in the following section. The images of H&E-stained sections were taken with an Olympus BX50 microscope (Olympus, Tokyo, Japan) attached to a digital camera (DP20; Olympus) or with a BZ-X700 microscope (Keyence, Osaka, Japan).
Necrotic myofibers were identified on H&E-stained sections by their characteristic morphology, which included swollen and round shapes with the sarcoplasm faintly stained by eosin, and/or a disrupted sarcolemma. 12 Given these morphological features of necrotic myofibers, the quantification of necrotic myofibers was performed as described previously 4 with some modifications. Briefly, using the 20× objective lens, five non-overlapping injured areas of H&E-stained section were photographed per animal by an investigator who is blinded regarding the treatment and post-injury time points. The number of necrotic myofibers with and without infiltration of polymorphonuclear and/or mononuclear cells per field was counted and averaged over the five fields for each animal, and a single value was recorded per animal.
Muscle regeneration was evaluated by measuring the cross-sectional area (CSA) of regenerating myofibers (identified by the presence of centrally located nuclei), which are formed by myogenic precursor cells, 9 as previously reported.4,5,17 Briefly, for each specimen on day 7, in each of five H&E-stained sections separated by 50 μm or more, five non-overlapping areas of interest were digitally captured using a 20× objective lens, yielding a total of 25 images of the regenerating site per animal. The CSA of regenerating myofibers (at least 201 fibers per animal) was manually determined by a single investigator (ET) using ImageJ.
Immunohistochemistry
Cryosections mounted on glass slides were air-dried at room temperature for 15 min, fixed with 4% paraformaldehyde, washed in phosphate-buffered saline (PBS), and blocked and permeabilized with PBS containing 10% normal goat serum and 1% Triton X-100 at room temperature for 1 hr. They were then incubated with one of four primary antibodies at 4°C overnight.
The primary antibodies included the following: (1) mouse monoclonal anti-CD68 antibody (1:200, MCA341GA, lot# 0515; Bio-Rad, Hercules, CA, USA; RRID: AB_566872), (2) mouse monoclonal anti-Pax7 antibody (1:50, sc-81648, lot# G1916; Santa Cruz Biotechnology, Santa Cruz, CA, USA; RRID: AB_2159836), (3) mouse monoclonal anti-embryonic myosin heavy chain (eMHC) antibody (1:50, sc-53091, lot# J1817; Santa Cruz Biotechnology; RRID: AB_670121), (4) rabbit polyclonal anti-myogenic determination factor 1 (MyoD) antibody (1:100, 18943-1-AP, lot# 00025860; Proteintech, Chicago, IL; RRID: AB_10603467). These antibodies were diluted in PBS containing 5% normal goat serum.
After washing the sections three times with PBS, endogenous peroxidase activity was quenched with 0.3% hydrogen peroxide diluted in methanol for 30 min at room temperature in a Coplin staining jar. The sections were then washed three times in PBS and were incubated with a horseradish peroxidase (HRP)-conjugated anti-mouse secondary antibody (Simple stain MAX-PO [M]; Nichirei Biosciences Inc., Tokyo, Japan) for 30 min at room temperature. After washing with PBS, the sections were placed in the 3,3′-diaminobenzidine reaction solution and counterstained with hematoxylin or eosin. For immunofluorescence, after the sections were washed three times with PBS, the samples were incubated with the appropriate species-specific (anti-mouse or anti-rabbit) fluorescence-conjugated (Alexa Fluor 488 or 594) secondary antibodies (1:1000; Thermo Fisher Scientific, Waltham, MA), diluted in PBS containing 5% normal goat serum, at room temperature for 2 hr. After being washed with PBS, the sections were mounted using Vectashield mounting medium (Vector Laboratories, Burlington, ON, Canada) containing 4′-6-diamino-2-phenylindole to visualize the nuclei. The images of sections were captured using an Olympus BX50 microscope (Olympus) attached to a digital camera (DP20; Olympus) or a BZ-X700 microscope (Keyence).
Quantitative Analyses of Immunolabeled Cells
The CD68+ cells (monocytes/macrophages), Pax7+ cells (satellite cells), MyoD+ cells (myogenic cells), and eMHC+ cells (nascent myofibers) were counted as reported previously. 13 Briefly, using a 20× or 40× objective, five non-overlapping fields of interest were imaged per animal. The immunolabeled cells visible in each field were counted and averaged over the five fields for each animal, and a single value was recorded per animal. The image analysis was performed using ImageJ software for all animals by the same investigator who is blinded regarding the treatment and post-injury time points. The macrophage density was calculated as the number of macrophages per 100 μm2 of the injured/regenerating area (the total area of the field minus the intact myofiber area). The CSA of eMHC+ cells was manually determined by a single investigator (ET) using ImageJ.
Western Blot Analysis
Portions (30–40 mg) of frozen injured muscle samples were homogenized in PRO-PREP (iNtRON Biotechnology, Inc., Gyeonggi-do, Korea) using a Handy sonic UR-20P (TOMY SEIKO Co., Ltd., Tokyo, Japan). The homogenates were centrifuged at 15,000 × g and 4°C for 5 min, and the supernatants were collected. Proteins (30 μg/lane) were separated by 7.5% or 10% sodium dodecyl sulfate-polyacrylamide gel electrophoresis and transferred onto polyvinylidene difluoride membranes (ATTO Co., Tokyo, Japan). The membranes were stained with Ponceau S (Beacle, Inc., Kyoto, Japan) and scanned with a chemiluminescence imaging system (OptimaShot CL-420α; Fujifilm Wako Pure Chemical Co., Osaka, Japan). After washing with PBS containing 0.05% Tween-20 and blocking with the same solution containing 5% skim milk for 1 hr, the membranes were incubated with one of three primary antibodies at 4°C overnight.
The primary antibodies included the following: (1) rabbit polyclonal anti-inducible nitric oxide synthase (iNOS) antibody (1:500, ab3523, lot# GR3446437-2; Abcam, Cambridge, UK; RRID: AB_303872), (2) rabbit polyclonal anti-tumor necrosis factor-alpha (TNF-α) antibody (1:500, ab6671, lot# GR235155-43; Abcam, RRID: AB_305641), (3) rabbit polyclonal anti-arginase 1 (Arg1) antibody (1:500, ab91279, lot# GR3407194-1; Abcam; RRID: AB_10674215). These antibodies were diluted in Can Get Signal Immunoreaction Enhancer Solution 1 (NKB-201; TOYOBO Co., Ltd., Osaka, Japan).
The membranes were then incubated with an HRP-conjugated species-specific secondary antibody (1:1000, sc-2357, lot# G2622; Santa Cruz Biotechnology), diluted in Can Get Signal Immunoreaction Enhancer Solution 2 (NKB-301; TOYOBO Co., Ltd.), at room temperature for 1 hr. Blots were developed using the Luminata Forte Western HRP Substrate (WBLUF0100; Merck Millipore, Darmstadt, Germany) and recorded using a chemiluminescence imaging system (OptimaShot CL-420α; Fujifilm Wako Pure Chemical Co.). Band intensities were quantified using the ImageJ software. Ponceau S staining was used to verify equal loading for all lanes and normalize the targeted protein bands, as described previously.5,18
Statistical Analyses
Data are expressed as box and whisker plots. The Shapiro-Wilk test and Levene’s test were used to confirm the normality and equal variance. For comparisons among groups, the data with normal distribution and equal variance were analyzed using one- or two-way (group × time) analysis of variance (ANOVA), followed by Bonferroni’s post hoc test. Data that were not normally distributed and/or did not have equal variance data were analyzed using the Kruskal-Wallis test, followed by Dunn’s post hoc test. p Values <0.05 were considered statistically significant. Statistical analyses were performed using R software (version 4.1.1; R Foundation for Statistical Computing Platform, Vienna, Austria).
Results
Frequent Icing Facilitates the Muscle Regenerative Process
During the initial phase after muscle injury, damaged/necrotic myofibers can be typically identified on H&E-stained cross-sections as swollen and round cells with faintly stained sarcoplasm by eosin or cells with disrupted sarcolemma. 12 In the present study on day 1 after injury, necrotic myofibers, which are infiltrated by polynuclear cells (probably neutrophils) and/or mononuclear cells (probably macrophages), were observed in all groups (Fig. 1A–D). The cell infiltration was the most vigorous in the Con group, where the contour of necrotic myofibers was unrecognizable (Fig. 1A). By contrast, in the Ice-1, Ice-3, and Ice-9 groups, the shape of necrotic myofibers was still detectable (Fig. 1B–D). The least infiltration of polynuclear and/or mononuclear cells was seen in the Ice-9 group (Fig. 1D). On day 3, the invasion of mononuclear cells within the necrotic area remained robust in the Con group (Fig. 1E). Meanwhile, necrotic myofibers with the recognizable contour, scarcely detected on day 1 in this group (Fig. 1A), were evident at this time point (Fig. 1E), suggesting a secondary damage response. In addition, newly formed myogenic cells, confirmed by eMHC expression, were visible within the injured/regenerating site in all groups on day 3 (Figs. 1E–H and 2A–D). By day 5, necrotic myofibers were mostly replaced by centrally nucleated regenerating myofibers in all groups (Fig. 1I–L). However, despite the identical number of eMHC+ cells among groups (Fig. 2I, Table A1), two-way ANOVA indicated that the CSA of these cells was significantly different between the groups (p<0.05). The post hoc test showed a trend toward an increase in the size of eMHC+ cells in the Ice-9 group compared with the Con (p=0.0879) and Ice-1 (p=0.0930) groups (Fig. 2J). There was also a trend for faster removal of necrotic muscle debris in the Ice-9 group, as evidenced by fewer necrotic myofibers in the injured site, compared with the Con group (p=0.0535; Fig. 3, Table A2). On day 7, using H&E-stained sections, the CSA of regenerating myofibers with centrally located nuclei was measured (Fig. 4). The mean CSA of regenerating myofibers was significantly larger in the Ice-9 group than in the Con, Ice-1, and Ice-3 groups (Fig. 4E).
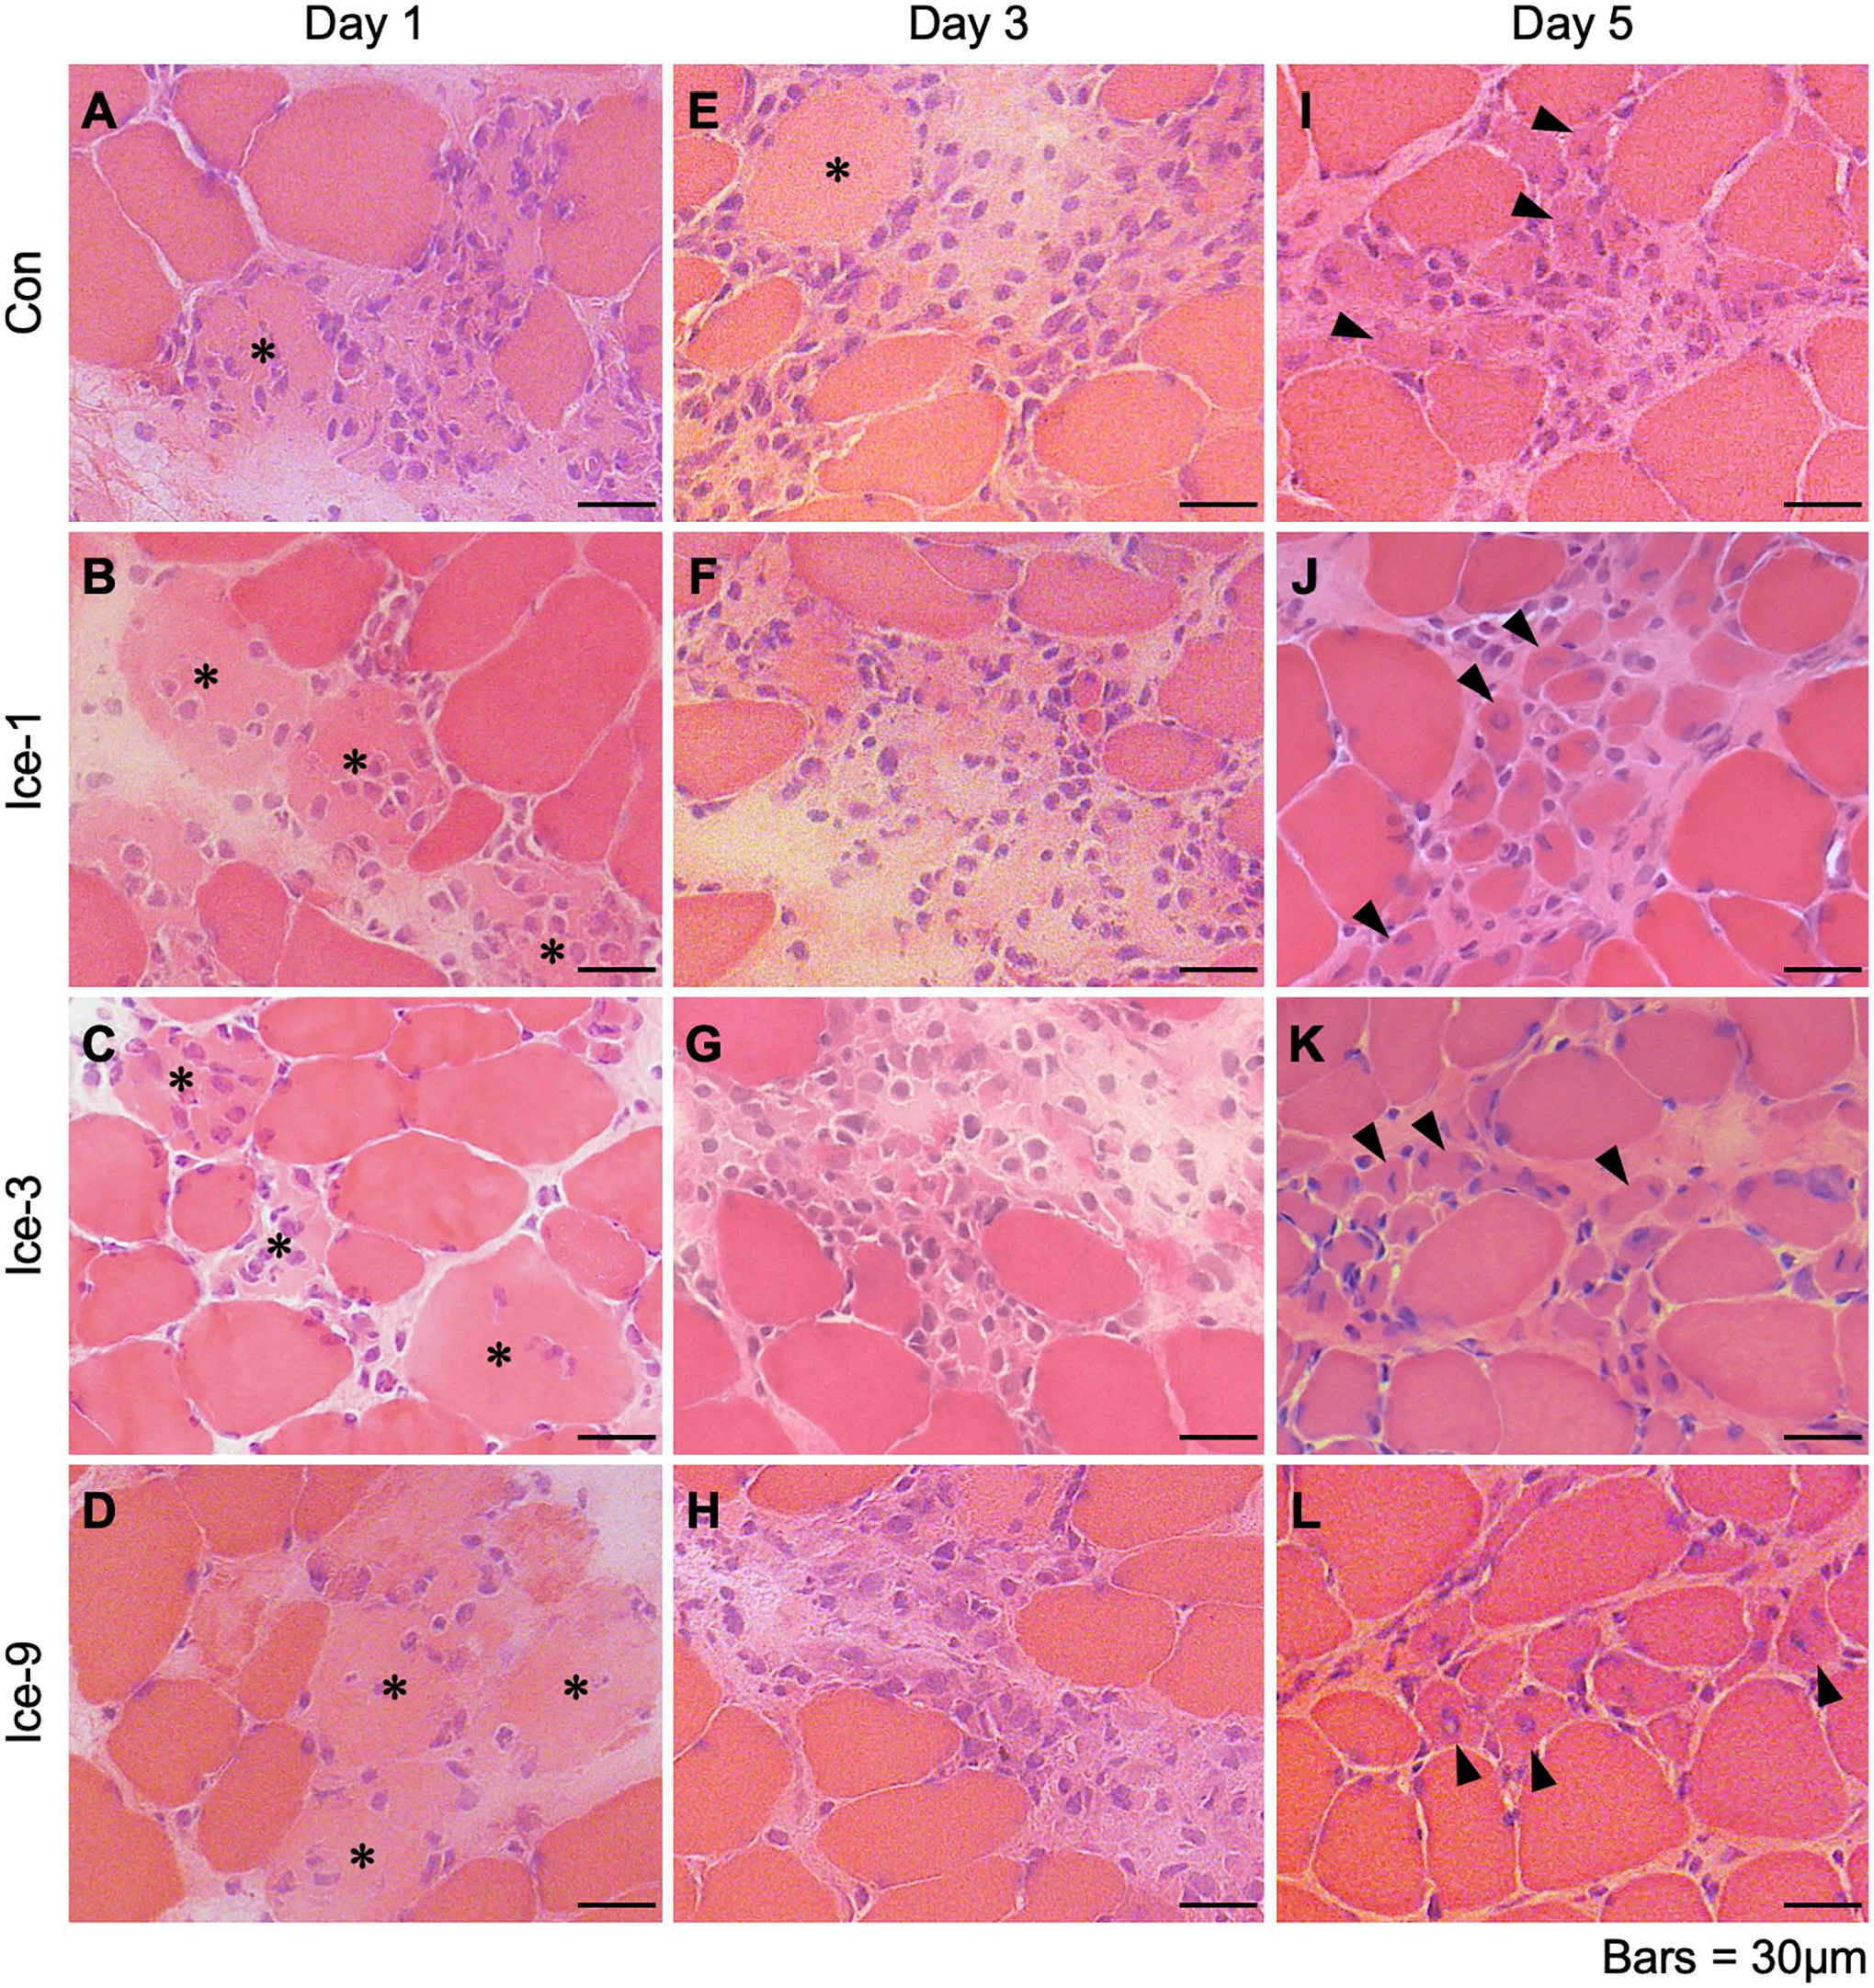
Morphological characteristics of muscle regeneration following muscle injury. A–L: Representative images of muscle cross-sections stained with hematoxylin and eosin from each group on days 1 (A–D), 3 (E–H), and 5 (I–L). Asterisks indicate necrotic myofibers. Arrowheads show newly formed myogenic cells with central nuclei. Scale bars = 30 μm.
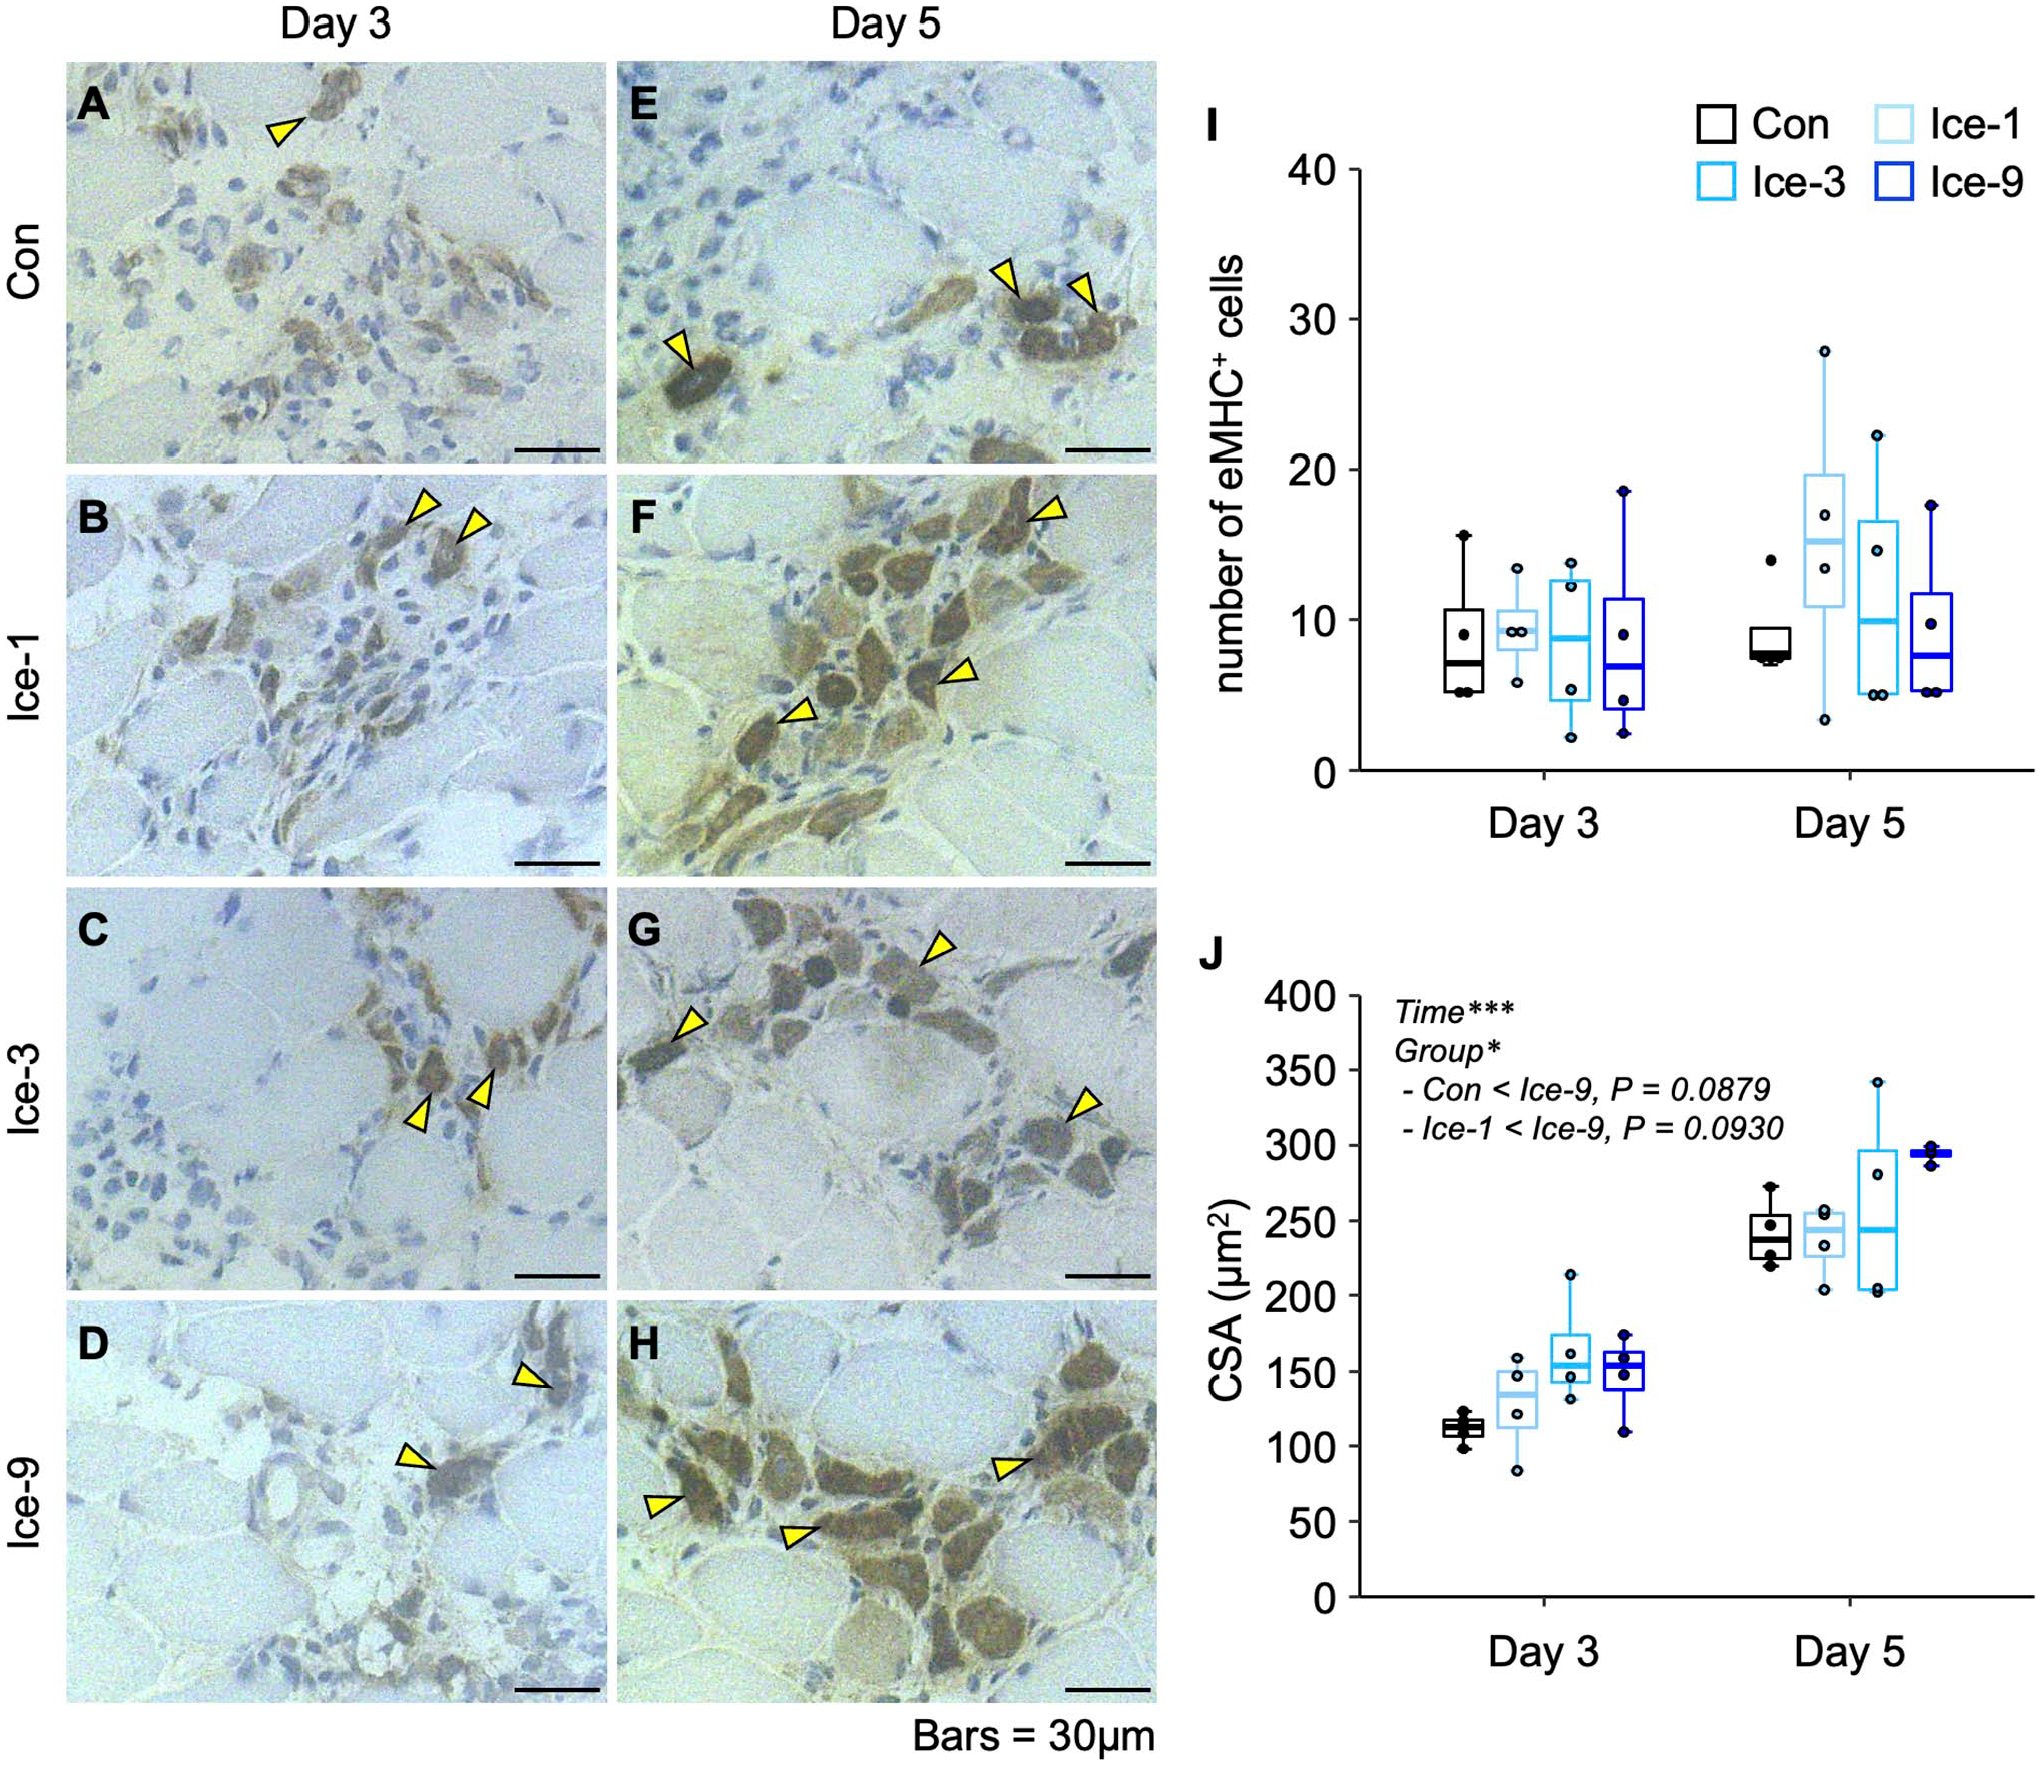
Distribution of embryonic myosin heavy chain-positive (eMHC+) cells following muscle injury. A–H: Representative images of eMHC+ cells within the regenerating area in each group on days 3 (A–D) and 5 (E–H). Transverse sections of injured muscles were analyzed by immunohistochemistry for eMHC, counterstained with hematoxylin. Arrowheads indicate eMHC+ cells. I and J: Chronological changes in the number (I) and cross-sectional area (CSA) (J) of eMHC+ cells. Five non-overlapping fields were counted and averaged per animal. Values are expressed as box and whisker plots (n=4 per group per time point). Statistical significance was assessed with two-way analysis of variance followed by Bonferroni’s post hoc test. The interaction between group and time was not significant in (I and J). There were significant main effects for time and group in (J). Data in the post hoc test for time are not shown. *p<0.05, ***p<0.001. Scale bars = 30 μm.
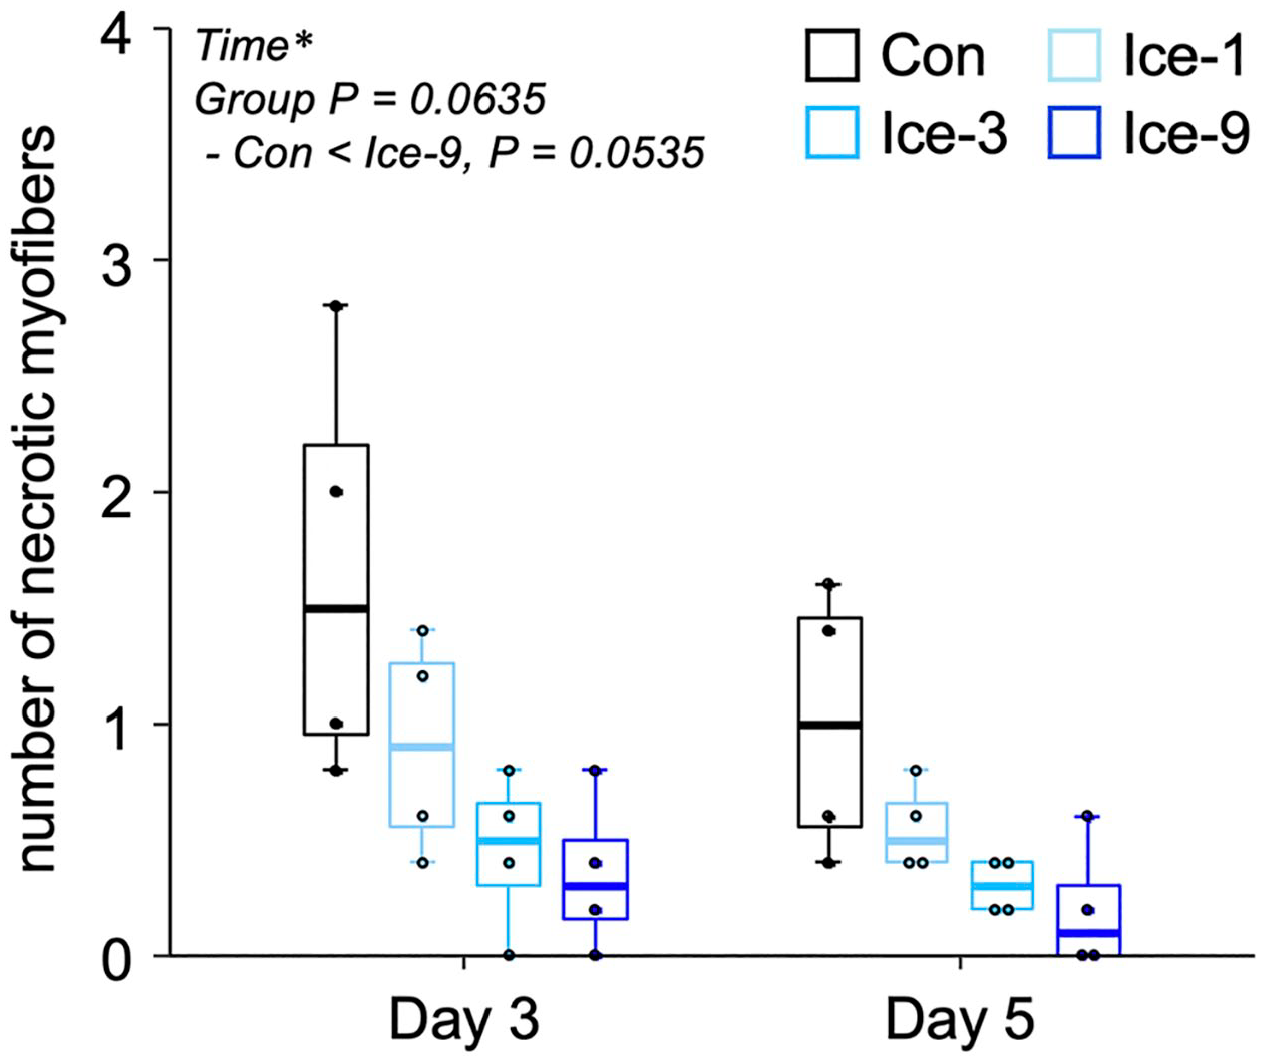
Quantification of the number of necrotic myofibers on days 3 and 5 following muscle injury. Five non-overlapping fields were counted and averaged per animal. Values are expressed as box and whisker plots (n=4 per group per time point). Statistical significance was assessed with two-way analysis of variance followed by Bonferroni’s post hoc test. The interaction between group and time was not significant. There was a significant main effect for time (*p<0.05) and a tendency for group (p=0.0635). Data in the post hoc test for time are not shown.
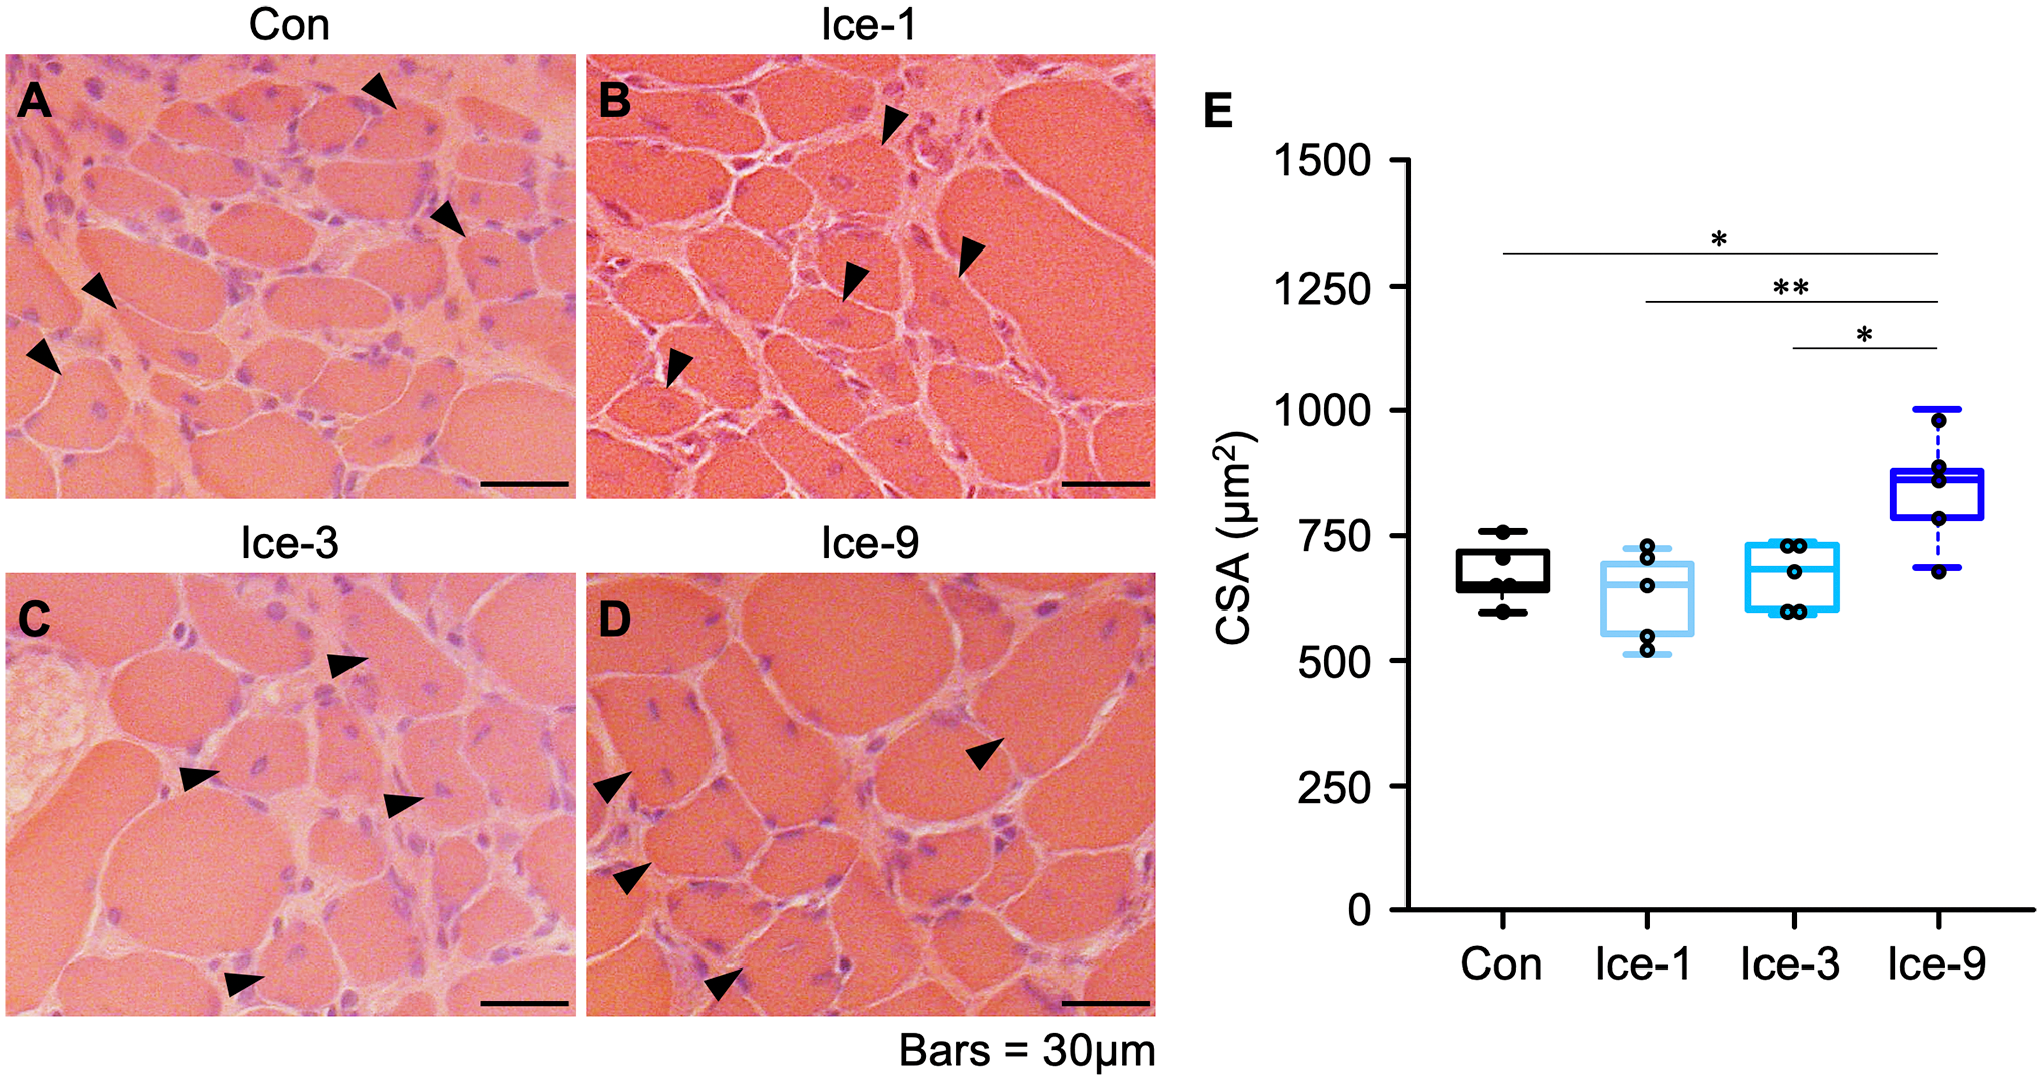
Comparison of regenerating myofiber size on day 7 following muscle injury. A–D: Representative images of muscle transverse sections stained with hematoxylin and eosin from each group. Arrowheads indicate regenerating myofibers with central nuclei. E: Mean cross-sectional area (CSA) of centrally nucleated regenerating myofibers. Values are expressed as box and whisker plots (n=5 per group per time point). Statistical significance was assessed with one-way analysis of variance followed by Bonferroni’s post hoc test. *p<0.05, **p<0.01. Scale bars = 30 μm.
Frequent Icing Reduces Macrophage Accumulation
To monitor the macrophage accumulation in the damaged muscles, we stained the muscle tissue for CD68 (a monocyte/macrophage marker) (Fig. 5). In the Con group, strong accumulation of macrophages was noted on days 1 and 3 (Fig. 5A and E), which is consistent with the substantial mononuclear cell infiltration in observations on H&E-stained sections (Fig. 1). By day 5, macrophage accumulation was less severe in this group (Fig. 5I). Macrophage infiltration was weaker in each Ice group (Ice-1, Ice-3, and Ice-9) than that in the Con group throughout the regenerative process (Fig. 5A–L). The least macrophage accumulation was noted in the Ice-9 group (Fig. 5D, H, and L). In a quantitative analysis, there were significant main effects for group and time, and the multiple comparison among groups showed that the number of macrophages in the Ice-1, Ice-3, and Ice-9 groups was significantly smaller than that in the Con group (Fig. 5M). Moreover, the Ice-9 group had fewer macrophages than the Ice-1 and Ice-3 groups, and macrophage accumulation was weaker in the Ice-3 group than in the Ice-1 group (Fig. 5M). The macrophage density in the Ice-9 group was significantly lower than that in the Con and Ice-1 groups (Fig. 5N).
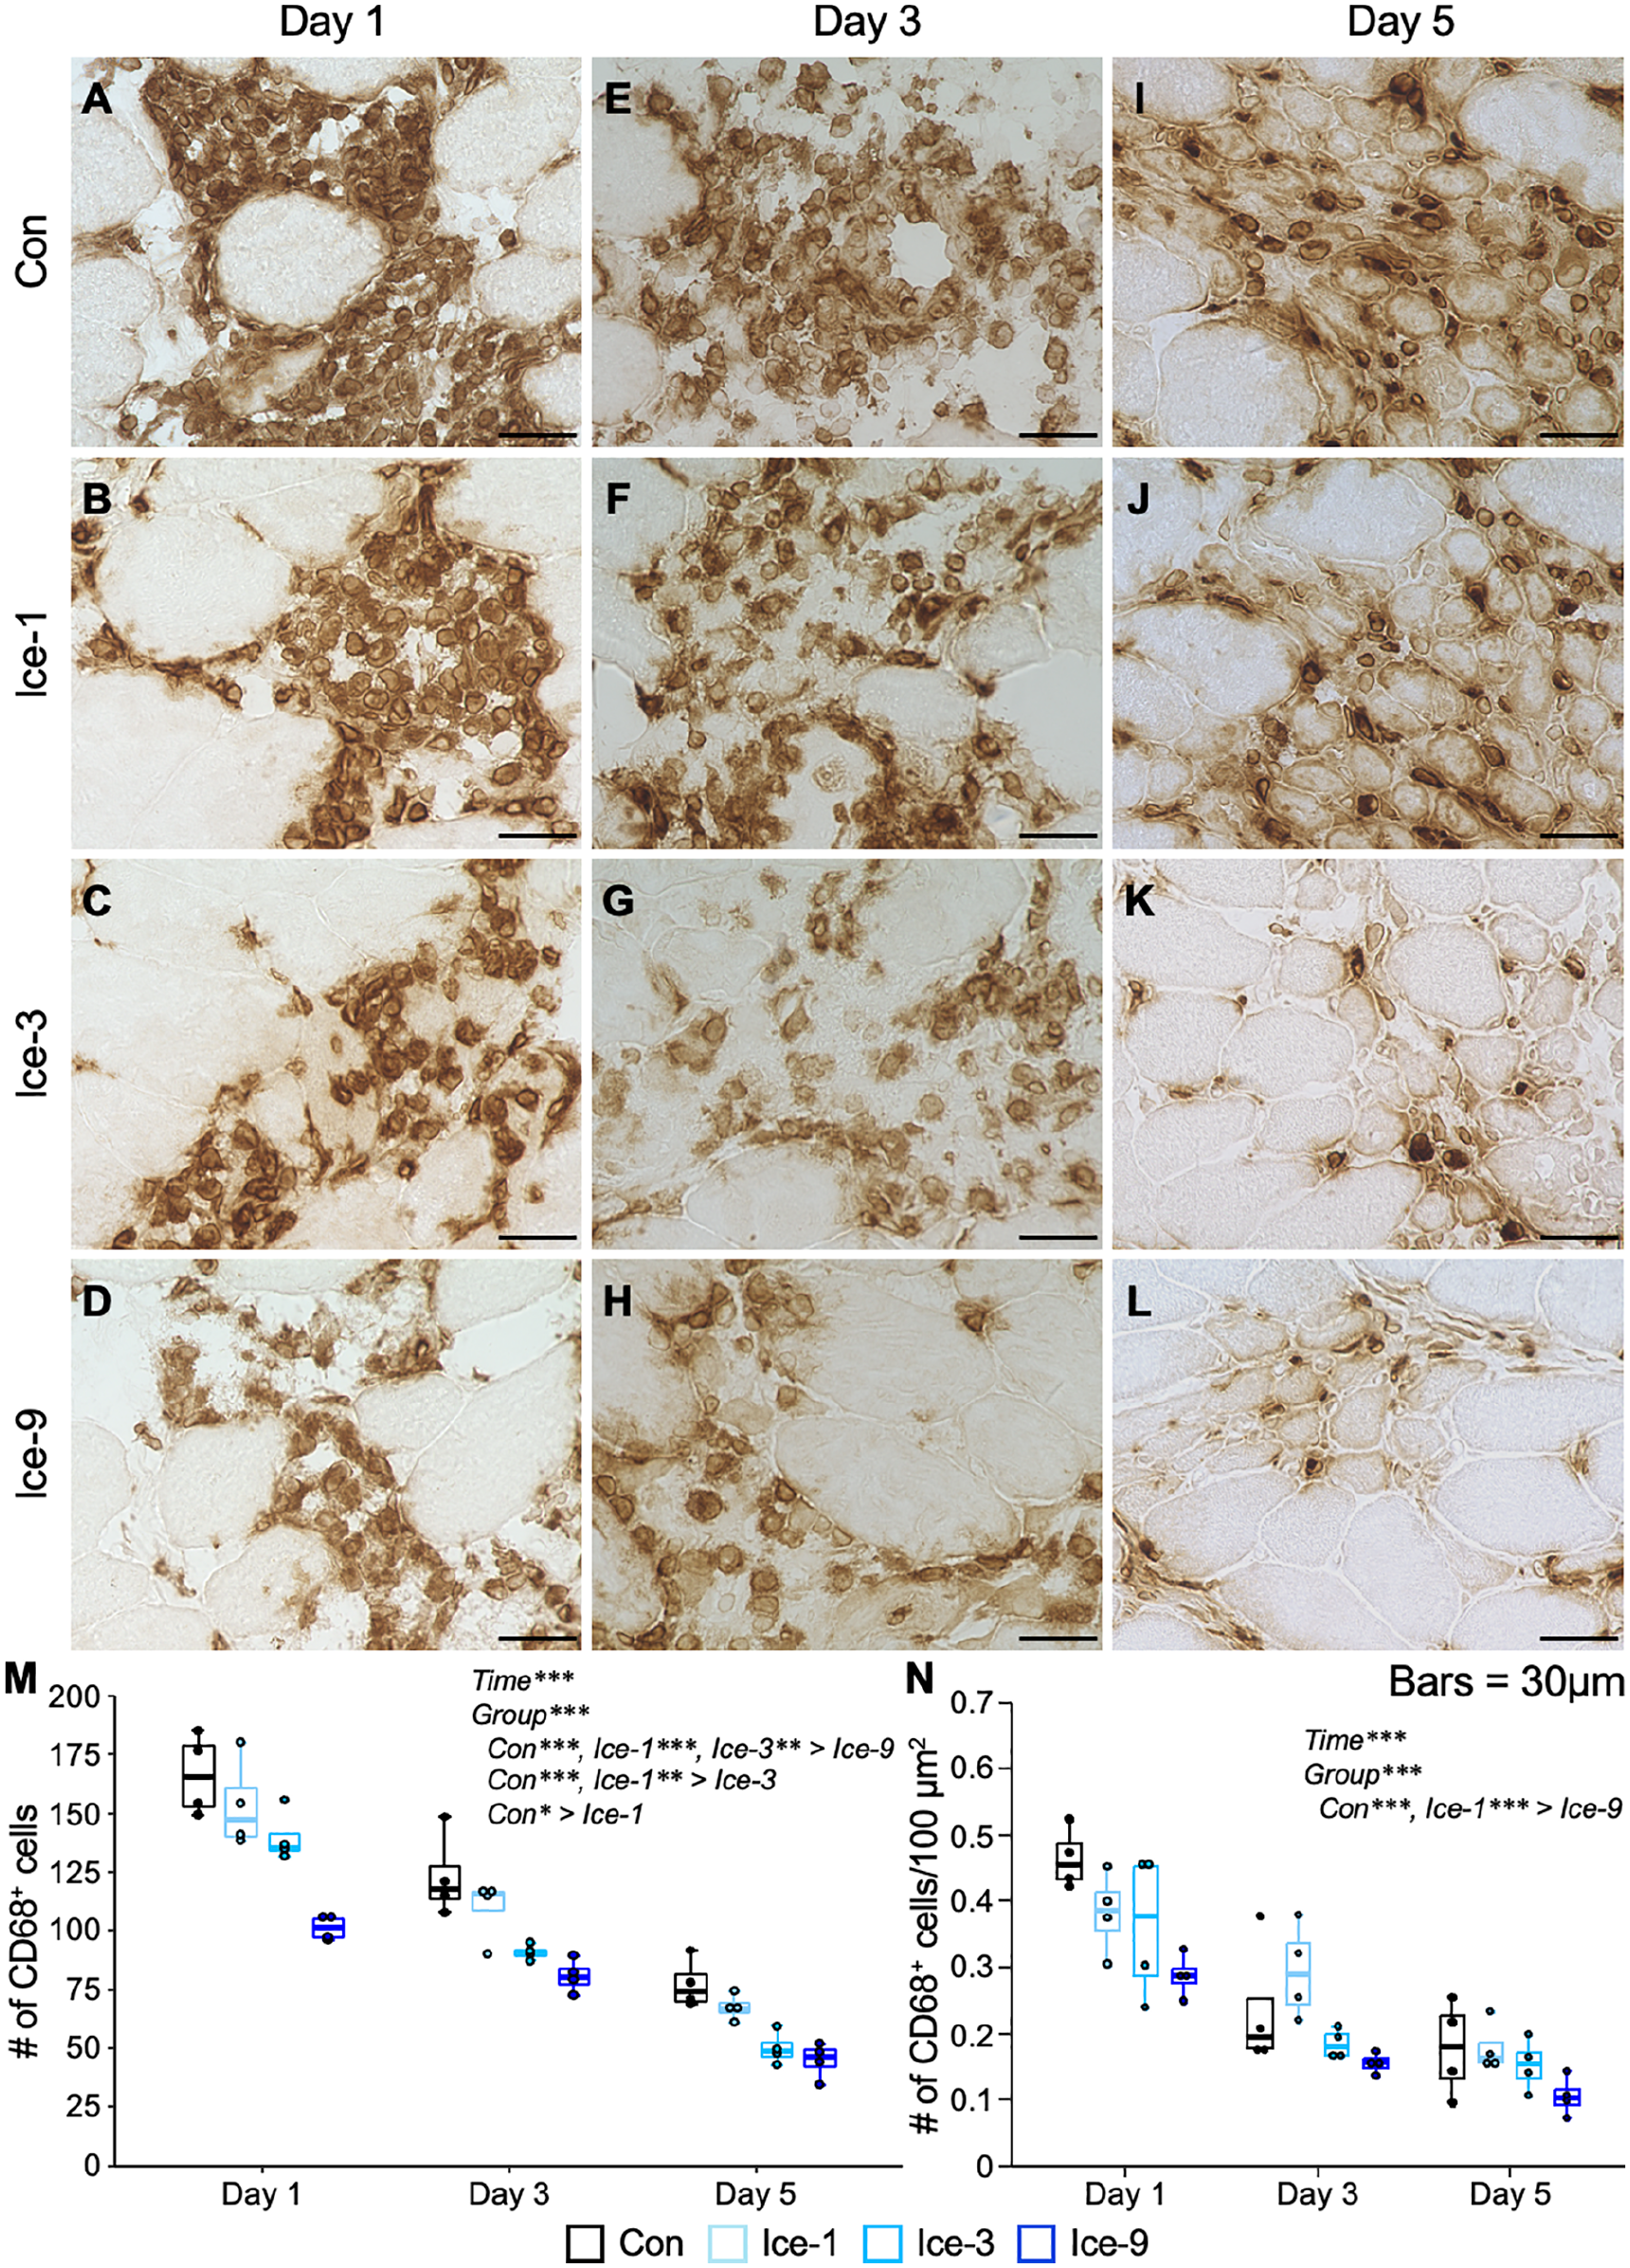
Macrophage accumulation following muscle injury. A–L: Representative images of CD68-positive macrophages from each group on days 1 (A–D), 3 (E–H), and 5 (I–L). Transverse sections of injured muscles were analyzed by immunohistochemistry for CD68. Macrophages are observed as brown-colored cells. M and N: Chronological changes in the number and density of macrophages. Five non-overlapping fields were counted and averaged per animal. Values are expressed as box and whisker plots (n=4 per group per time point). Statistical significance was assessed with two-way analysis of variance followed by Bonferroni’s post hoc test. The interaction between group and time was not significant in (M) and (N). There were significant main effects for time and group in (M) and (N). Data in the post hoc test for time are not shown. *p<0.05, **p<0.01, ***p<0.001. Scale bars = 30 μm.
Protein Expressions of iNOS, TNF-α, and Arg1 Are Unchanged by Any Icing Protocols
Using the same injury model as the present study, our previous study 5 has demonstrated that icing diminished the expression of iNOS, which is a mediator of cytotoxic activities in macrophages. This finding was supported by less iNOS+ macrophage accumulation and limited muscle damage expansion on day 3 after mild muscle injury. 5 In this context, the iNOS protein expression levels in the whole injured muscle on days 1, 3, and 5 were examined (Fig. 6, Table A3). Unexpectedly, no difference in iNOS expression was noted among groups on day 3 (Fig. 6A and B). Similarly, the expression of TNF-α, which is a representative proinflammatory marker, was also not obviously affected by any of the icing treatments (Ice-1, Ice-3, and Ice-9) on day 3 (Fig. 6C and D). In addition, we examined the expression levels of Arg1, which is expressed by macrophages and competes with iNOS for L-arginine, their common substrate. 19 The results showed no significant difference in the Arg1 expression among groups on day 3 (Fig. 6E and F).
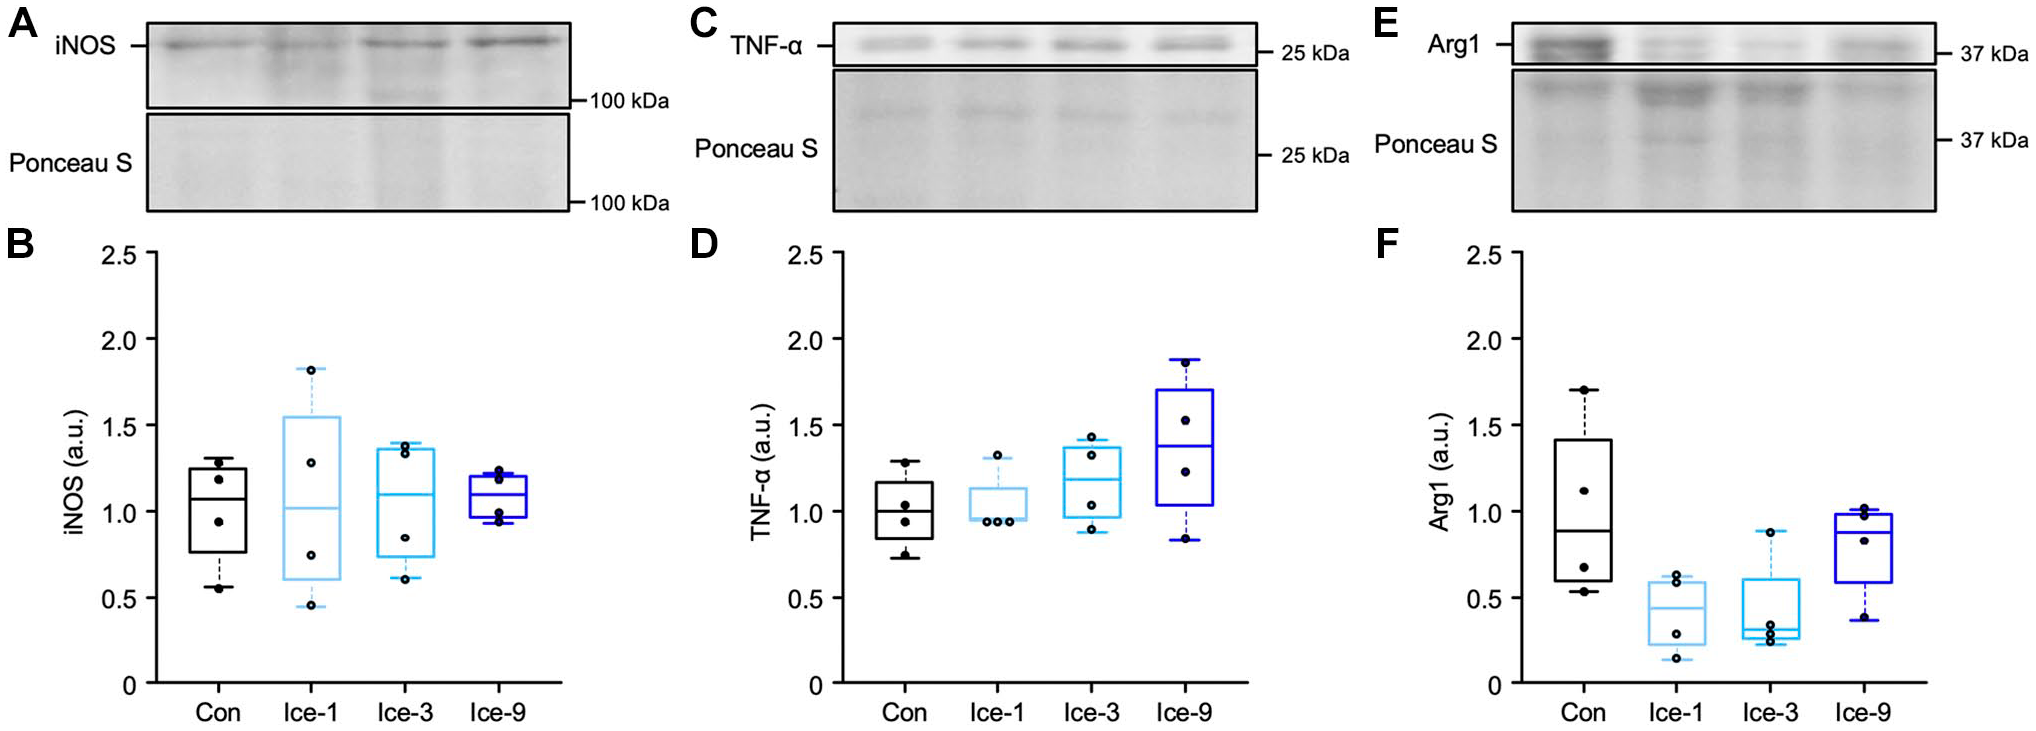
Protein expression levels of iNOS, TNF-α, and Arg1 on day 3 following muscle injury. Representative blots and quantifications of iNOS (A and B, detected band position: 135 kDa), TNF-α (C and D, detected band position: 25.6 kDa), and Arg1 (E and F, detected band position: 37 kDa) in injured muscles from each group. The expression levels of protein were normalized to the Ponceau S levels and expressed as the fold changes (arbitrary unit, a.u.) from the mean value in the Con group. Values are expressed as box and whisker plots (n=4 per group per time point). Statistical significance was assessed with two-way analysis of variance followed by Bonferroni’s post hoc test in (B) and (F), and with the Kruskal-Wallis test followed by Dunn’s post hoc test in (D).
Frequent Icing Accelerates Satellite Cell Accumulation
To investigate whether the different icing protocols affect satellite cell accumulation within regenerating area, we identified satellite cells with immunolabeling for Pax7 (Fig. 7A–D). On day 1 after injury, satellite cells could be detected at the periphery of uninjured myofibers, which is the normal position of satellite cells, but not within the damaged/regenerating area (Table A4). On day 3, in the Con, Ice-1, and Ice-3 groups, satellite cells remained hardly detectable (Fig. 7A–C), whereas a few satellite cells could be detected within the regenerating area in the Ice-9 group (Fig. 7D). A quantitative analysis showed a significant difference in the number of satellite cells on day 3 between the Ice-9 and Con groups (Fig. 7E). On day 5, the satellite cell accumulation was identical among groups (Table A4). In addition, in immunofluorescence assays for Pax7 and MyoD, MyoD+ cells were noted in every group on day 3 (Fig. 7F–I). In a quantitative analysis, although the Ice-9 group had a relatively larger number of MyoD+ cells, one-way ANOVA indicated no significant difference between the groups (Fig. 7J).
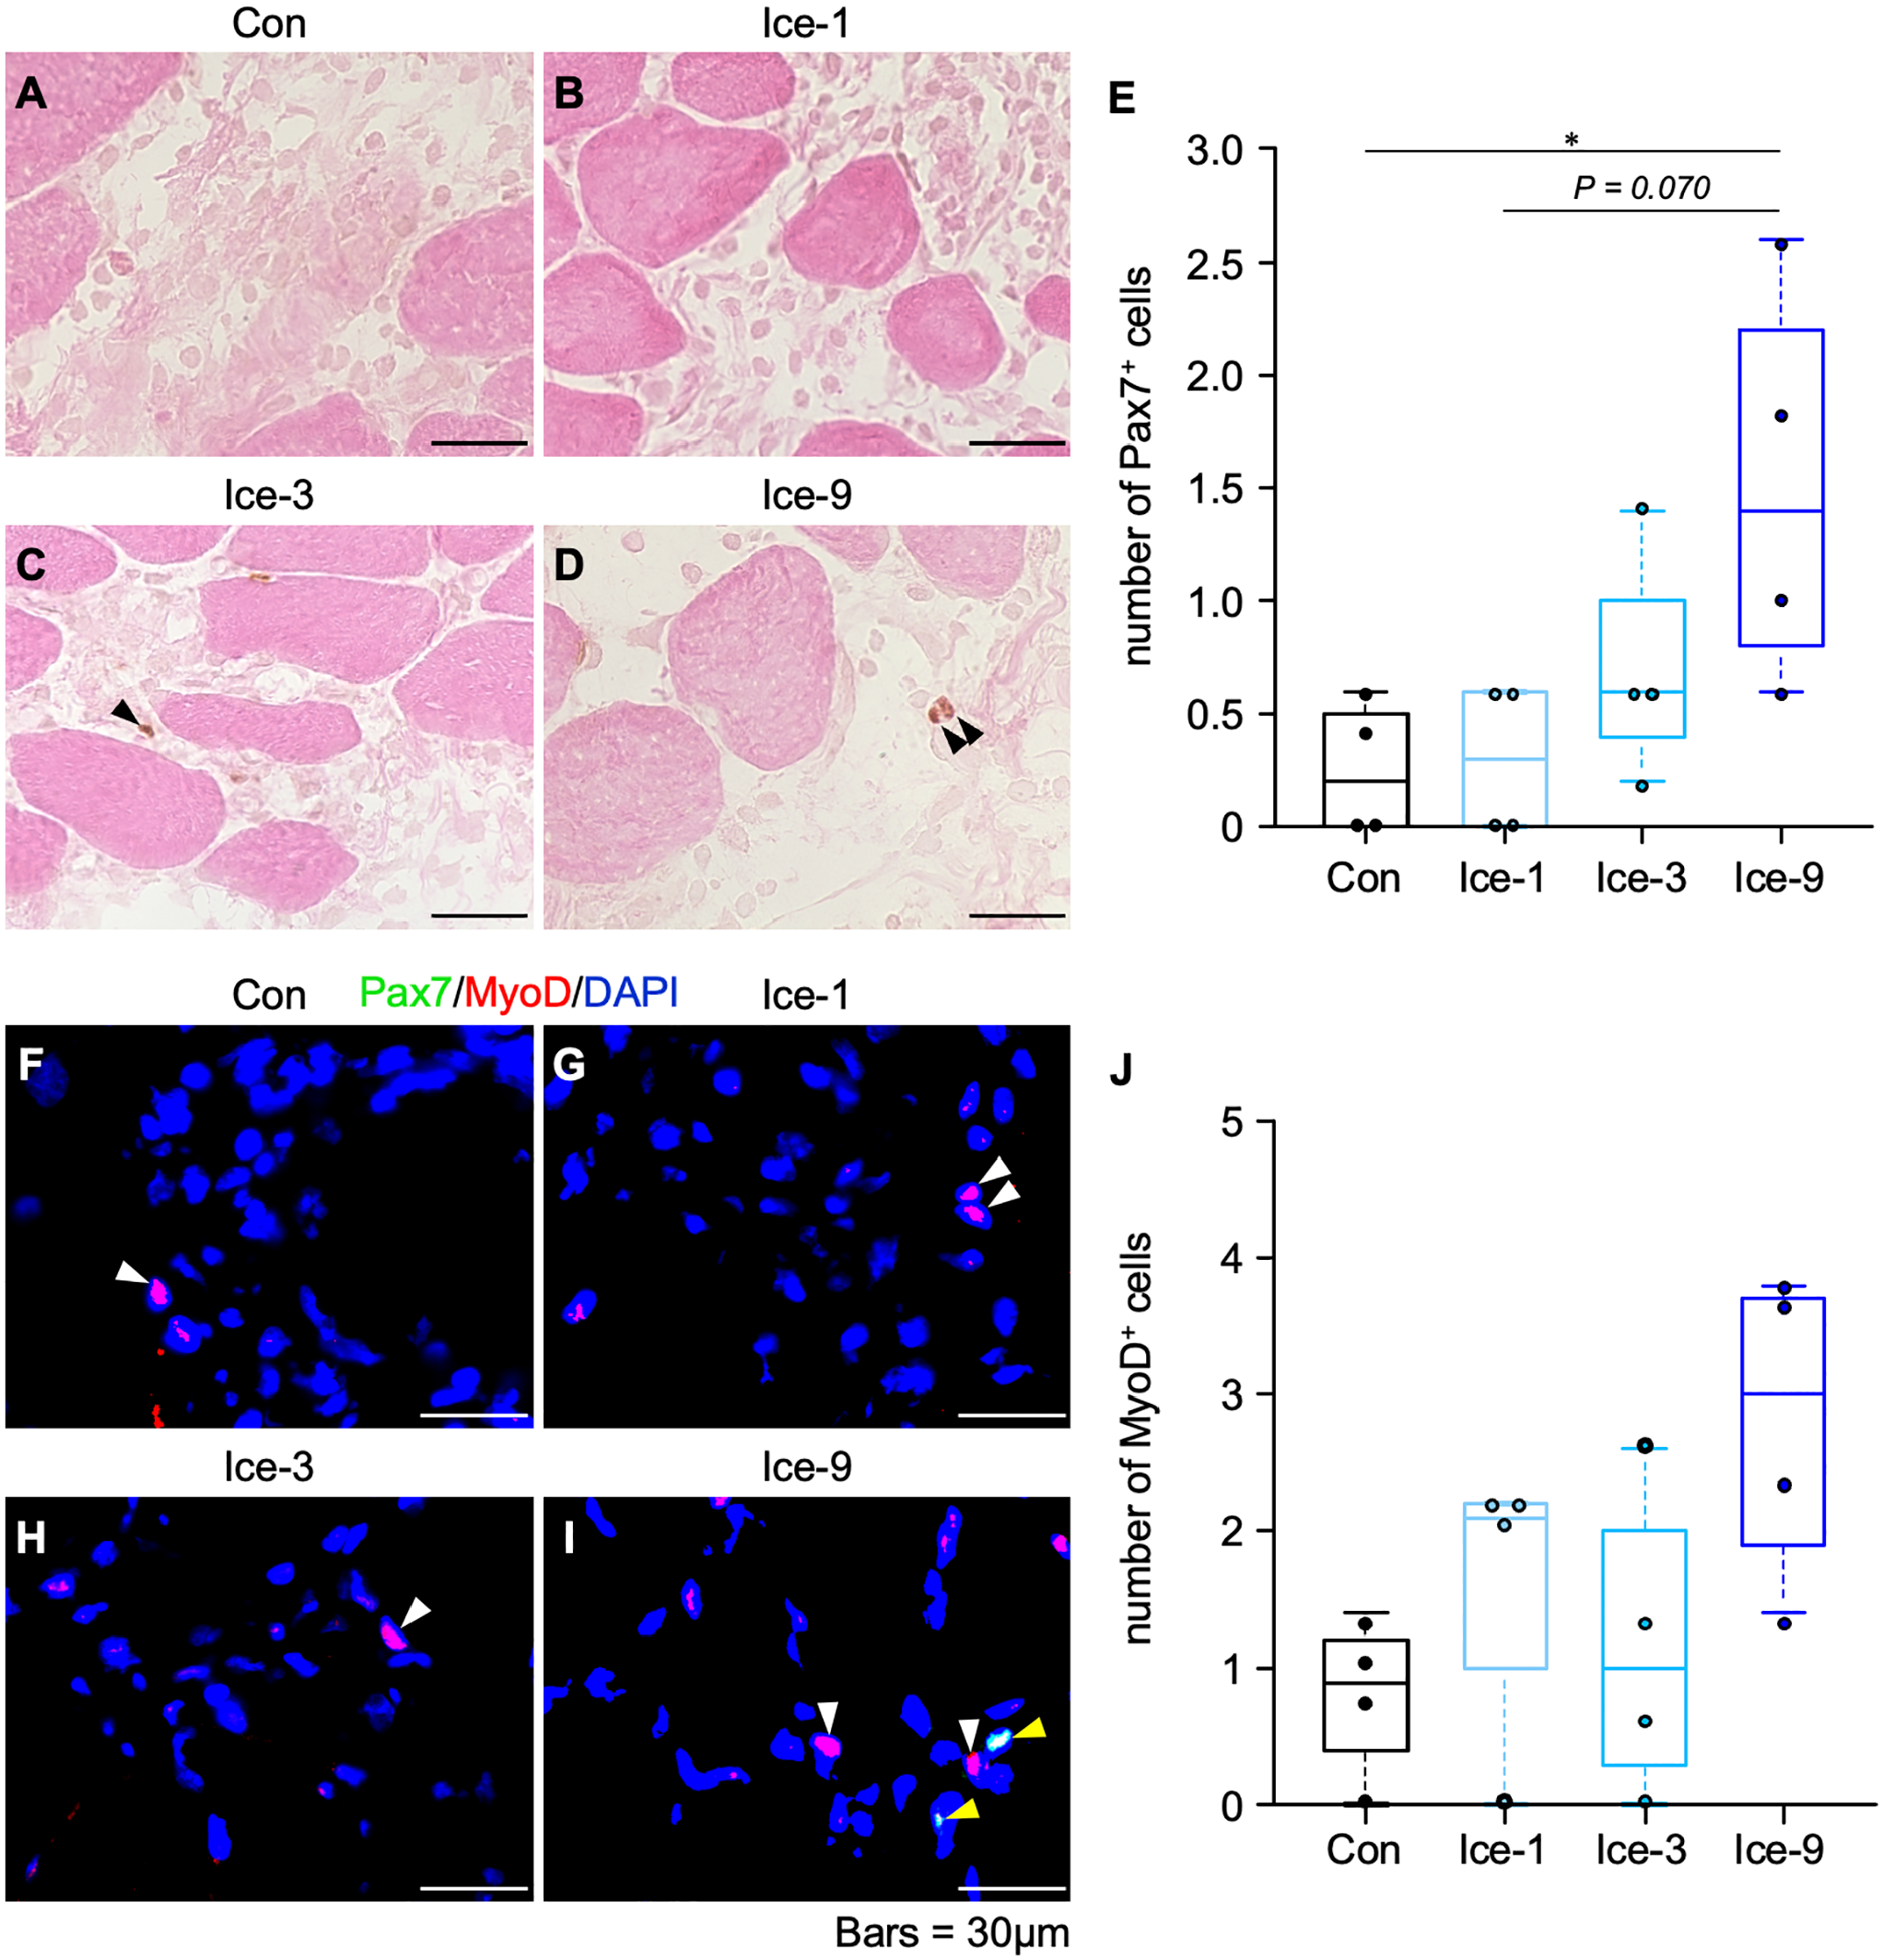
Myogenic cell accumulation within the regenerating area on day 3 following muscle injury. A–D: Representative images of Pax7-positive satellite cells from each group. Transverse sections of injured muscles were analyzed by immunohistochemistry for Pax7, counterstained with eosin. Black arrowheads indicate satellite cells. E: Quantification of the number of satellite cells. Five non-overlapping fields were counted and averaged per animal. Values are expressed as box and whisker plots (n=4 per group per time point). Statistical significance was assessed with the Kruskal-Wallis test followed by Dunn’s post hoc test. F–I: Representative images of Pax7- and/or MyoD-positive cells from each group. Transverse sections of injured muscles were analyzed by immunofluorescence for Pax7 (green) and MyoD (red). Nuclei were stained with 4′-6-diamino-2-phenylindole (DAPI, blue). Yellow arrowheads represent Pax7- and MyoD-positive cells. White arrowheads indicate MyoD-positive cells. J: Quantification of the number of MyoD-positive cells. Five non-overlapping fields were counted and averaged per animal. Values are expressed as box and whisker plots (n=4 per group per time point). Statistical significance was assessed with the Kruskal-Wallis test. *p<0.05. Scale bars = 30 μm.
Discussion
The present study examined the effect of different icing protocols on skeletal muscle regeneration, using an established mild muscle injury model. 5 Here, we found that icing treatments (i.e., Ice-1, Ice-3, and Ice-9 groups) reduced the number of macrophages in the site of injury compared with the Con group up to five days after injury (Fig. 5). However, only Ice-9 treatment was effective for reducing the number of necrotic myofibers (Fig. 3), increasing the accumulation of satellite cells within the damaged/regenerating area (Fig. 7), and accelerating the myogenic process, as evidenced by an enlarged size of eMHC+-nascent myofibers (Fig. 2) and centrally nucleated regenerating myofibers (Fig. 4). The present study thus revealed that icing applied very frequently within a few days following mild muscle injury is most effective to promote the regenerative process of skeletal muscles.
Macrophages play a pivotal role in skeletal muscle regeneration, whereas these cells exhibit the behavior to promote muscle damage in an iNOS/nitric oxide–mediated manner.19–21 A recent study demonstrated that repeated icing after mild muscle injury (which was the same protocol as the Ice-9 group in the present study) facilitates muscle regeneration. 5 During this regenerative process, icing suppressed the iNOS protein expression, in accordance with a decrease in the number of iNOS-expressing macrophages. 5 In the present study, although the Ice-9 group showed less macrophage accumulation (Fig. 5) and greater muscle regeneration (Fig. 4), no substantial alterations of iNOS protein expression levels in the whole injured muscle were observed (Fig. 6A and B). Furthermore, none of the icing protocols altered the expression of other inflammation-related factors (i.e., TNF-α and Arg1; Fig. 6C–F). Meanwhile, the Ice-9 group exhibited slightly faster removal of necrotic myofibers (Fig. 3), accompanied by rapid accumulation of satellite cells (Fig. 7) and a slight enlargement in the size of eMHC+ nascent myofibers (Fig. 2). Previous studies have reported that the clearance of necrotic cellular debris from the damaged area by phagocytes is critical for the formation of new myofibers.22,23 In line with this, we have discovered a spatiotemporal context in which satellite cells emerge within the damaged/regenerating area, concomitant with a reduction in the numbers of infiltrating macrophages and necrotic myofibers during muscle regeneration.5,13,24 Considering the previous reports4,5 indicating that repeated icing following injury has little or no effect on the expression levels of myogenic regulatory factors, our data suggest that greater muscle regeneration in response to frequent icing following mild muscle injury depends on the expedited replacement of damaged/necrotic tissue with regenerative tissue, which may not necessarily be reflected throughout the entirety of the damaged muscles.
Inflammation after soft-tissue injury or damaging exercise is both beneficial and detrimental, creating secondary damage through cytotoxic molecules released from neutrophils and macrophages, while also stimulating proper tissue repair.11,25,26 The regular or prolonged use of cryotherapy following muscle injury has been widely recommended to minimize inflammation and subsequent secondary muscle damage.27–29 Consistent with this, our previous report has suggested that the limited expansion of the injury area due to frequent icing after a mild muscle injury might be associated with accelerated muscle regeneration. 5 The results of the present study showed that all icing protocols (Ice-1, Ice-3, and Ice-9 groups) reduced the accumulation of macrophages, which have the potential to lyse muscle cells,19,20 in the damaged muscle compared with the Con group, and the reduction occurred in a dose-dependent manner (Fig. 5). In our previous investigation, the accumulation of neutrophils was unaffected by high-frequency icing following mild muscle injury. 5 Therefore, the inhibition of macrophage-related secondary damage response, which could lead to an excess of necrotic myofibers, might explain the difference in the icing protocols. Future studies will investigate whether icing affects the necrotic program of damaged myofibers and the cytotoxic and phagocytic features of macrophages to elucidate the key phenomena underlying the positive effects of icing on muscle regeneration. In addition, further research is needed to determine the optimum frequency and duration of icing to develop more effective treatments and facilitate translation from rodents to humans in the field of sports medicine.
A limitation of this study is that the iNOS protein expression in the damaged muscles was unaltered even with more frequent icing, despite the attenuation of iNOS-expressing macrophage accumulation (Fig. A1). These data are inconsistent with the previous report showing a reduction in both iNOS-expressing macrophages and iNOS protein expression due to frequent icing with the same injury model. 5 Based on these conflicting results, it is likely that the alteration in the targeted proteins within the injured/regenerating area was masked by proteins from the uninjured myofibers, as the majority of myofibers remained uninjured in the mild injury model. 5 Thus, to clarify whether icing affects the cytotoxic activity of macrophages and subsequent secondary muscle damage, a direct assay using isolated macrophages should be performed in further investigations. Another limitation is that we cannot rule out the possible influence of adaptive response in satellite cells to muscle injury, known as the G alert transition, 30 since both legs of the animals were injured on two different days in this study. A previous report demonstrated that severe muscle damage to a hindlimb muscle activates satellite cells in the contralateral uninjured muscle, making these cells capable of responding more rapidly to injury. 30 Therefore, future studies should consider the adaptive behavior of satellite cells when examining the effects of local icing on muscle regeneration.
In conclusion, the present study demonstrated that following mild skeletal muscle injury with necrosis in a small myofiber fraction, frequent icing appears to be more effective than single or occasional icing for enhancing the regenerative process of skeletal muscles.
Footnotes
Appendix
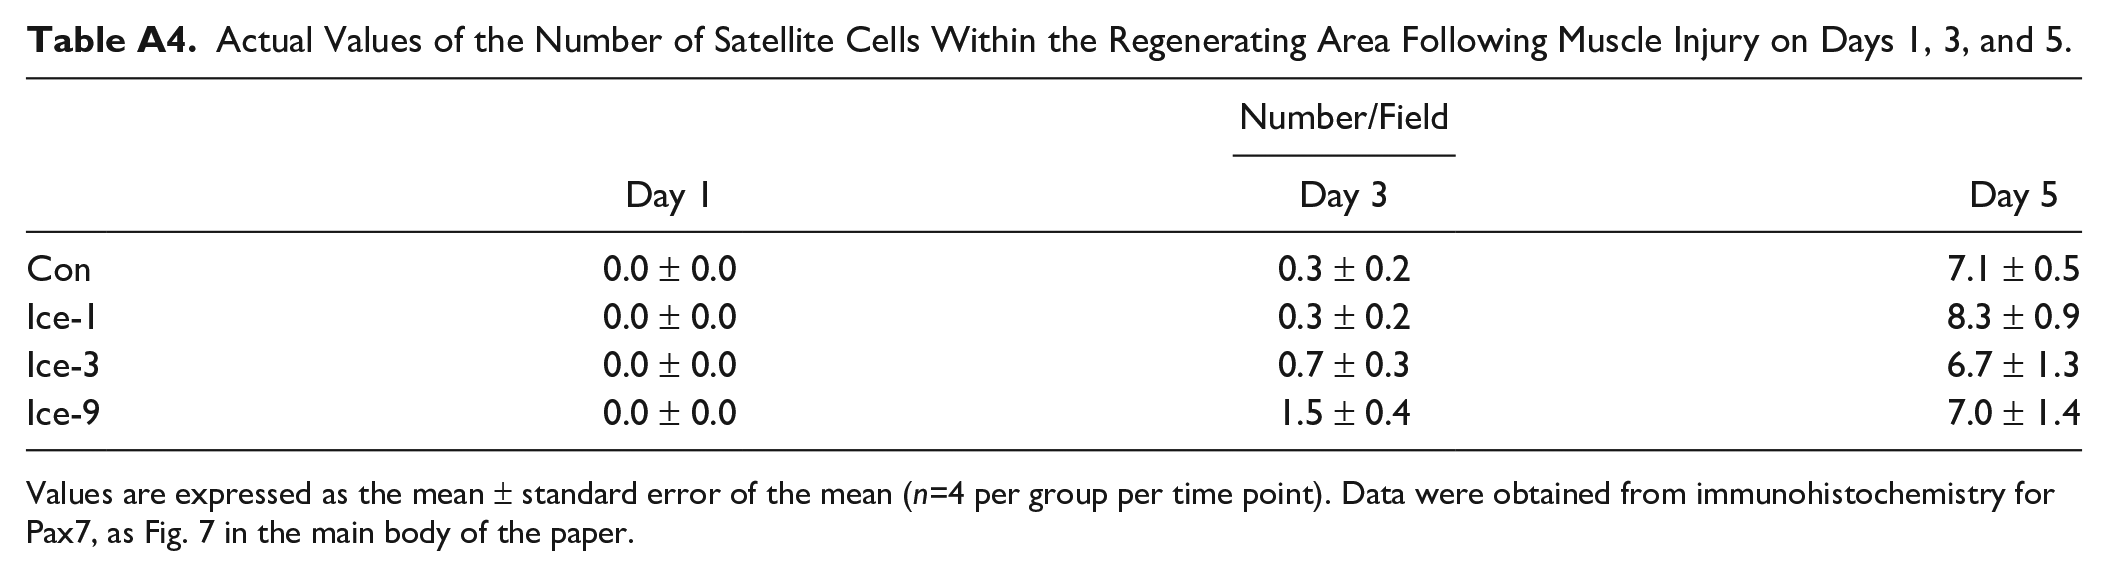
Actual Values of the Number of Satellite Cells Within the Regenerating Area Following Muscle Injury on Days 1, 3, and 5.
| Number/Field | |||
|---|---|---|---|
| Day 1 | Day 3 | Day 5 | |
| Con | 0.0 ± 0.0 | 0.3 ± 0.2 | 7.1 ± 0.5 |
| Ice-1 | 0.0 ± 0.0 | 0.3 ± 0.2 | 8.3 ± 0.9 |
| Ice-3 | 0.0 ± 0.0 | 0.7 ± 0.3 | 6.7 ± 1.3 |
| Ice-9 | 0.0 ± 0.0 | 1.5 ± 0.4 | 7.0 ± 1.4 |
Values are expressed as the mean ± standard error of the mean (n=4 per group per time point). Data were obtained from immunohistochemistry for Pax7, as Fig. 7 in the main body of the paper.
Acknowledgements
The authors would like to express their gratitude to Makoto Miyoshi for loaning an experimental devise. We also thank the members of our laboratory for their cooperation.
Competing Interests
The author(s) declared no potential conflicts of interest with respect to the research, authorship, and/or publication of this article.
Author Contributions
All authors have contributed to this article as follows: study design (MKawashima, IN, TA), conducting experiments (MKawashima, IN, ET, AT, MKurauchi, TSakuraya, TSonomura, EO, HY), data analysis and interpretation (MKawashima, IN, ET, MKurauchi), manuscript writing (MKawashima, JMP, TA), and all authors approved the final version of manuscript.
Funding
The author(s) disclosed receipt of the following financial support for the research, authorship, and/or publication of this article: This work was supported by the Japan Society for the Promotion of Science Grant-in-Aid for scientific research KAKENHI No. 21K11238 (to TA), Yamaha Motor Foundation for Sports (to MKawashima), and Wesco Scientific Promotion Foundation (to MKawashima).