
Abstract
Little is known about the adaptor protein FAM159B. To determine whether FAM159B expression findings in rats or mice can be extrapolated to humans, we compared FAM159B expression in healthy tissue samples from all three species using immunohistochemistry. Despite variations in expression intensity, similar FAM159B expression patterns were observed in most organs across species. The most prominent species difference was noted in pancreatic islets; while FAM159B expression was limited to single cells on the outer edges in mice and rats, it was detectable across entire islets in humans. Double-labeling immunohistochemistry revealed partial overlap of FAM159B expression with that of insulin, glucagon, and somatostatin in human islets. By contrast, FAM159B showed complete colocalization with only somatostatin in rats and mice. An additional analysis of FAM159B expression in lean and obese Zucker rats revealed larger islet areas due to increased β-cell mass in obese rats, which was accompanied by a smaller percentage of FAM159B-positive δ-cells per islet area. Beyond the known differences in islet architecture across species, our results point to larger dissimilarities in blood glucose regulation between rodents and humans than generally assumed. Moreover, findings regarding FAM159B expression (and function) cannot be directly transferred between rodents and humans.
Keywords
Introduction
Various cell signaling pathways depend on the participation of adaptor proteins. Usually non-enzymatic, these proteins regulate various aspects of cell-surface receptor functions through protein-membrane or protein-protein interactions mediated by their modular domains and/or peptide motifs. β-Arrestins and their regulation of G-protein–coupled receptor signaling are prime examples of adaptor proteins.
The adaptor protein FAM159B belongs to the Shisa-like protein family. Vertebrates have two copies of FAM159: FAM159A and FAM159B. Although the exact function of FAM159B remains unknown, previous research suggests that it acts as a transmembrane adaptor involved in regulating other transmembrane receptors and proteins. 1 FAM159B expression is present in neuroendocrine cells of the human stomach mucosa and pancreatic islets. 2 In pancreatic islets, its expression is linked to β-cell exocytosis 3 and maturation.4,5
Using a well-characterized antibody, we recently showed the expression of FAM159B in various human normal and neoplastic tissues. FAM159B was most predominant in neuronal and neuroendocrine cells and tissues, such as the cortex; trigeminal, dorsal root, and intestinal ganglia; pancreatic islets; and neuroendocrine cells of the bronchopulmonary and gastrointestinal tracts. Accordingly, FAM159B was also frequently detected in different types of endocrine and neuroendocrine tumors. 6 Using the neuroendocrine cancer cell lines BON-1, PC3, NCI-h82, and OH-1, as well as tissue samples from human pancreas and pancreatic neuroendocrine tumors, we also showed coexpression of FAM159B with various neuroendocrine-specific markers and several receptors that are typically expressed by neuroendocrine cells, including chromogranin A, neuron-specific enolase, insulinoma-associated protein 1, neural cell adhesion molecule 1, dopamine receptor 2, regulator of G-protein signaling 9, and the somatostatin receptors 2, 4, and 5. 7
Rodents are often used in preclinical studies to gain initial insight into a target structure, and the data obtained are then extrapolated to humans. To determine whether findings on FAM159B obtained in rats or mice can be easily transferred to humans, in the present study, we examined FAM159B expression in all three species using immunohistochemistry. Upon discovering differences in expression in pancreatic islets, representing one of the most important expression sites of FAM159B, among species, we additionally performed immunohistochemical double-labeling experiments with FAM159B and insulin, glucagon, or somatostatin 14/28 (SST) in pancreas tissue samples. Because these studies revealed clear-cut differences in FAM159B expression in the different cell populations of the islets too, we decided to further evaluate the impact of a diabetic state on FAM159B expression in the pancreatic islets. For that purpose, we analyzed pancreas samples from non-diabetic and diabetic humans and non-diabetic lean and diabetic obese Zucker rats.
Zucker rat samples were obtained from archived material from a previous experiment 8 that originally examined the effect of 4-week treatment with ciprofibrate on serum lipid and glucose levels, as well as on markers of hepatotoxicity. Obese Zucker rats bear a mutation in the leptin receptor gene and are leptin-resistant. Zucker rats homozygous for non-functional leptin receptors develop hyperphagia, obesity, and hyperlipidemia, leading to insulin resistance and hyperglycemia by the age of 12 weeks. By contrast, rats with homozygous dominant wild-type and heterozygous genotypes remain lean and display normal serum lipid and glucose concentrations.9–11
Fibrates like ciprofibrate activate the so-called peroxisome proliferator–activated receptor α, a specific nuclear receptor that regulates genes that play important roles in lipid and glucose metabolism and are commonly used in the treatment of hypertriglyceridemia and mixed hyperlipidemia.12,13 In the previous experiment, treatment of obese Zucker rats with ciprofibrate unexpectedly led to an increase in blood glucose concentrations and thus a worsening of diabetes in these rats. We therefore expected that any diabetes-related changes in FAM159B expression would be more pronounced in the ciprofibrate-treated animals than in the respective untreated controls. Since this would also allow us to make a statement about a possible correlation between severity of diabetes and alterations in FAM159B expression, we examined the archived pancreas tissue samples not only from lean and obese Zucker control rats but also from the respective ciprofibrate-treated animals.
Materials and Methods
Primary Antibody
The rabbit polyclonal anti-FAM159B HPA011778 antibody was purchased from Atlas Antibodies AB (Bromma, Sweden) and has been extensively characterized for its specificity in human cell lines and tissues. 6 The respective peptide PrEST Antigen FAM159B (APrEST71583) was also obtained from Atlas Antibodies. Since the sequence of the first 15 amino acids of the peptide used to immunize the rabbit is identical to amino acids 95–110 at the C-terminal end of the protein in rat and mouse except for one amino acid and due to the polyclonal nature of the antibody, a cross-reaction of the antibody with rat and mouse FAM159B is to be expected. To prove the specificity of the antibody also for rat and mouse tissues, a selection of FAM159B-positive rat and mouse tissue samples was additionally incubated with HPA011778 preadsorbed with its immunizing peptide, which in all cases caused a complete loss of the immunosignal (see insets in Fig. 1). By contrast, the two FAM159 isoforms present in vertebrates, FAM159A and FAM159B, substantially differ in their amino acid sequence, and there is no similarity in the C-terminal end against which the anti-FAM159B antibody HPA011778 was raised in FAM159B. Hence, HPA011778 does not cross-react with FAM159A.
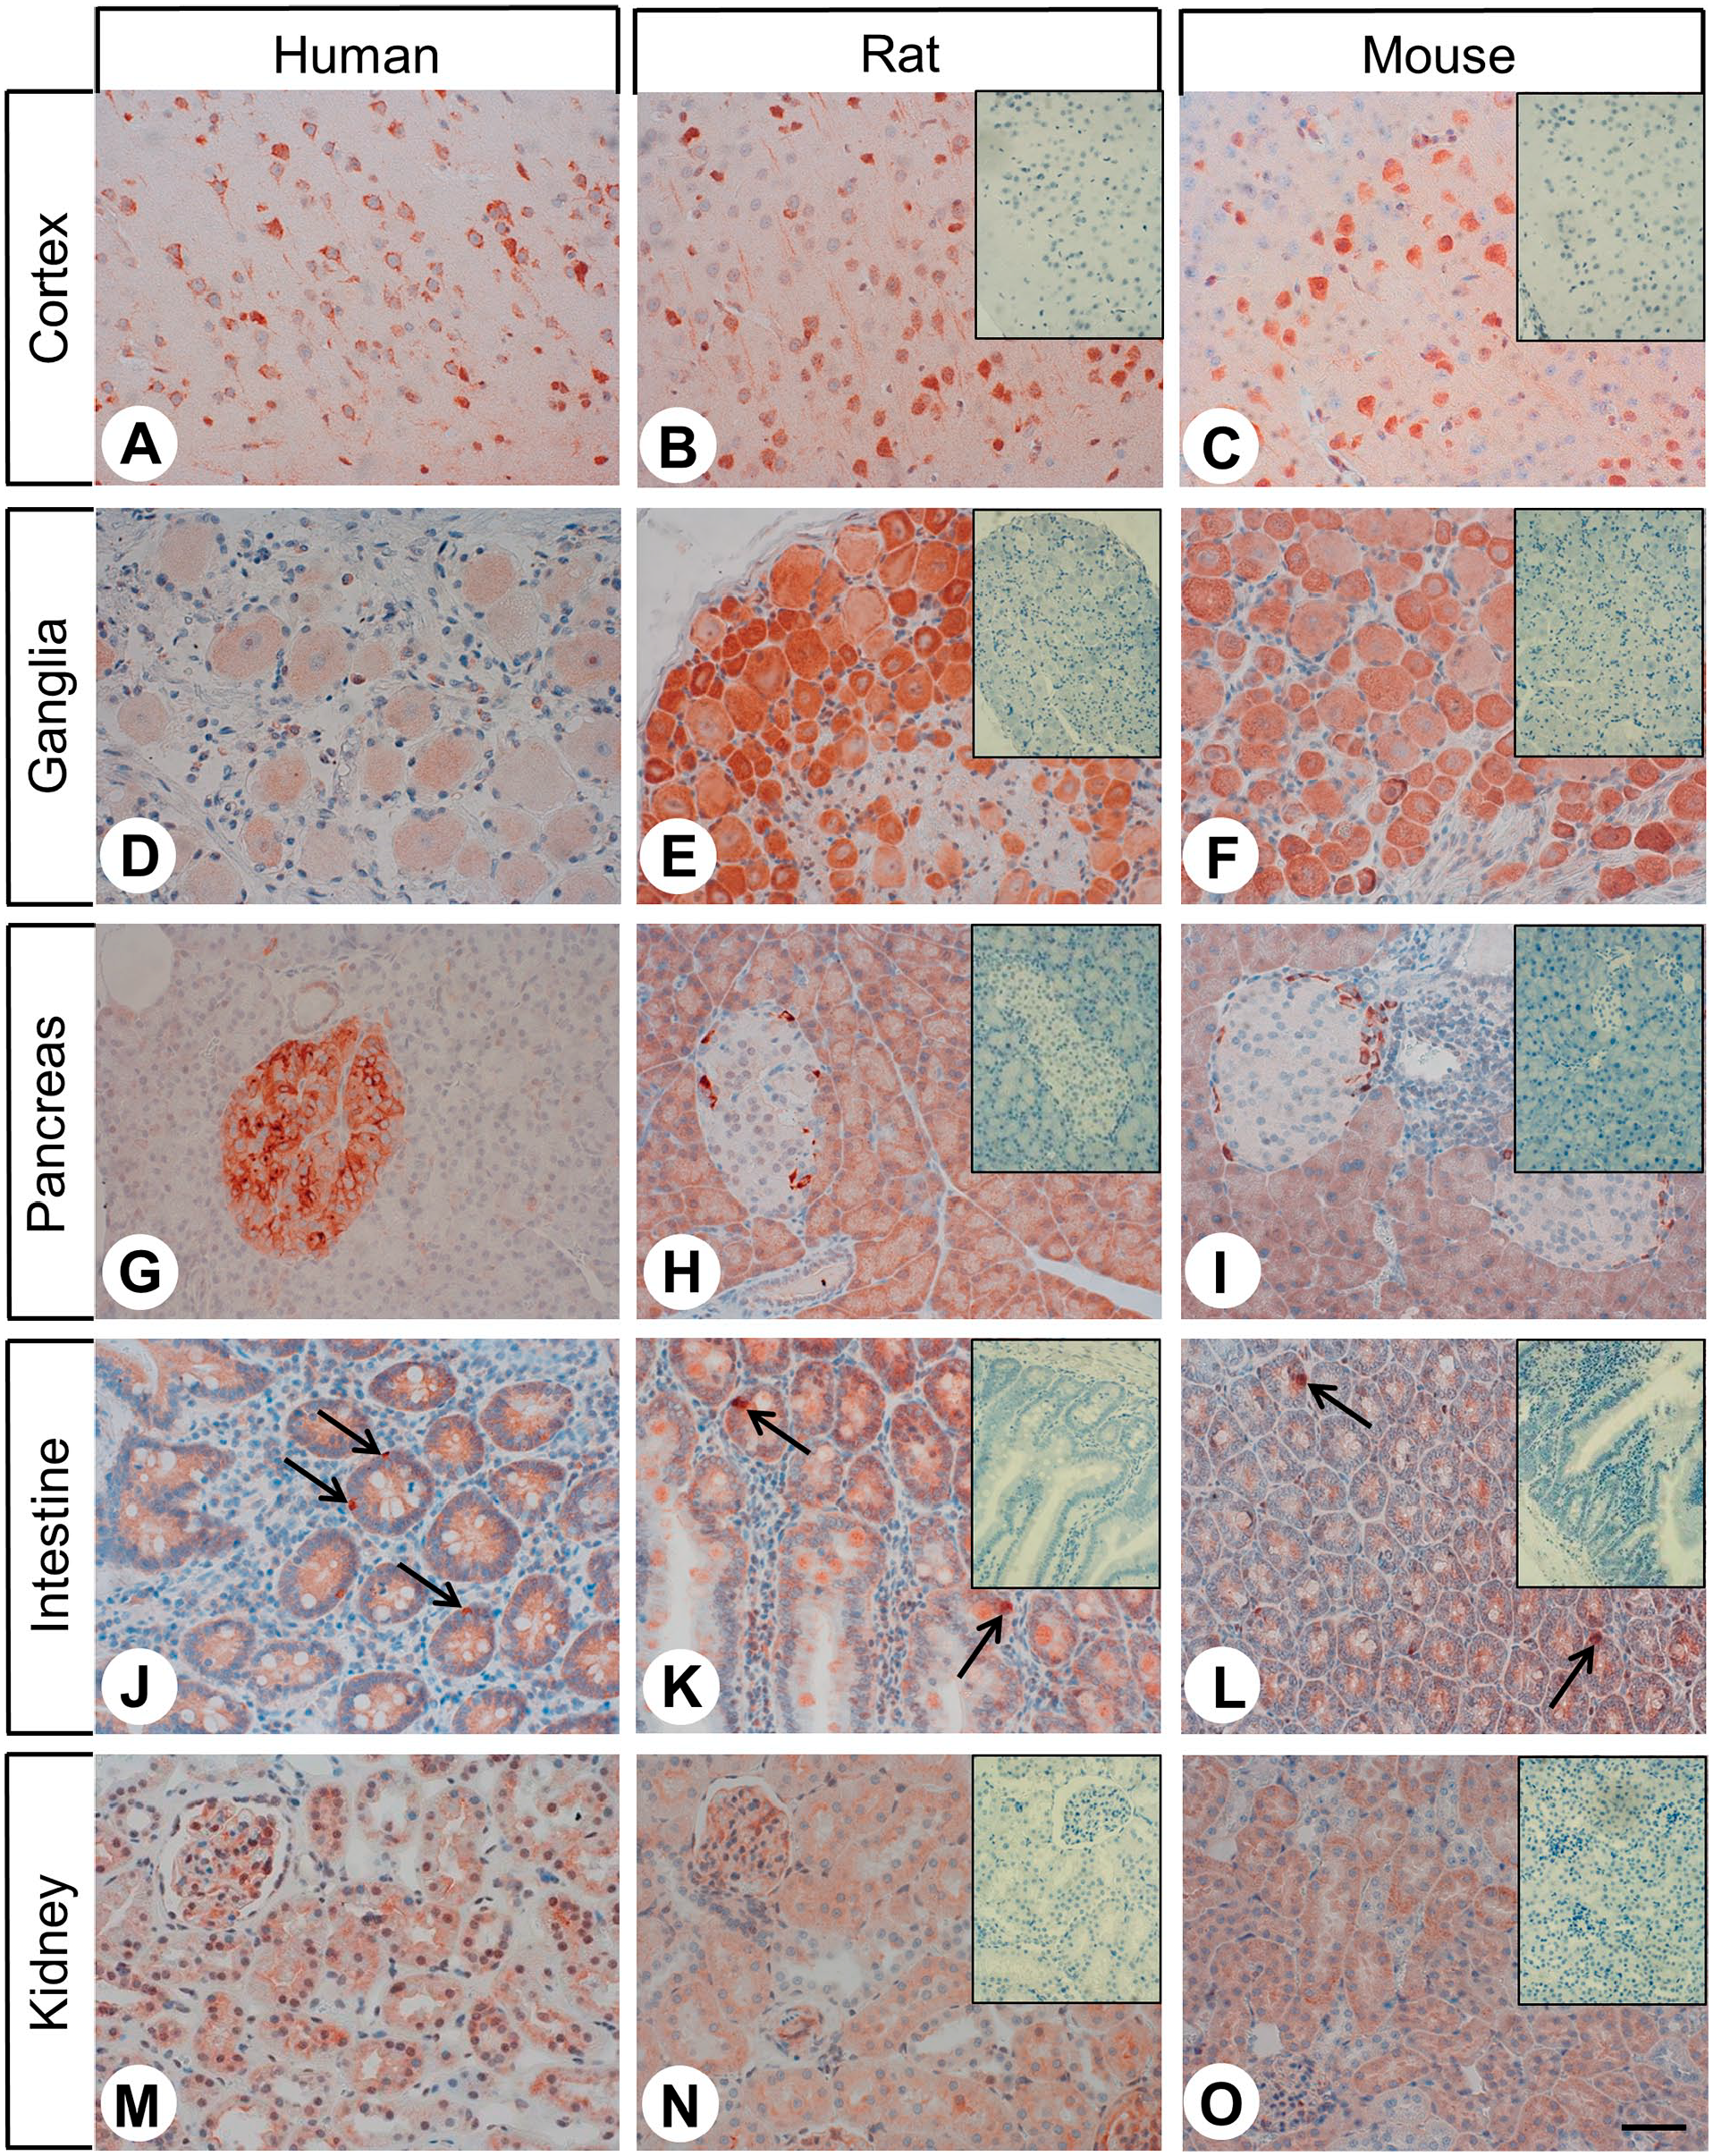
Immunohistochemical detection of FAM159B expression in different human (A, D, G, J, M), rat (B, E, H, K, N), and mouse (C, F, I, L, O) tissues. Immunohistochemical staining (red-brown color) and counterstaining with hematoxylin (blue color). Insets in (B, C, E, F, H, I, K, L, N, O): For adsorption controls, the anti-FAM antibody HPA011778 was incubated with 10 µg/ml of the immunizing peptide. All photomicrographs were taken at the same magnification. Scale bar: 50 µm; arrows in J–L: enteroendocrine cells.
Immunohistochemistry
Completely anonymised formalin-fixed and paraffin-embedded tissue samples from different human organs (n=3–5 each), as well as pancreas samples from non-diabetic (n=30) and diabetic patients (n=27; healthy tissue from the resection margin of pancreatic neuroendocrine tumors), were obtained from the Institute of Pathology and Cytology Bad Berka (Bad Berka, Germany). All procedures involving human participants were in accordance with the ethical standards of institutional and national research committees and the 1964 Helsinki Declaration and its later amendments. Permission for this retrospective analysis was obtained from the local ethics committee (Ethikkommission der Landesärztekammer Thüringen). Formalin-fixed and paraffin-embedded tissue samples from wild-type rats (Wistar Han rats; n=5 each) and mice (C57BL/6; n=5 each), as well as pancreas samples from lean and obese control and ciprofibrate-treated Zucker rats (n=9–12), were obtained from the archives of the Institute of Pharmacology and Toxicology, Jena University Hospital, Jena, Germany. Zucker rat samples were obtained from archived material from a previous experiment 8 evaluating the effect of 4-week treatment with ciprofibrate on serum lipid and glucose levels, as well as on markers of hepatotoxicity. Rats were purchased at 30 days of age, kept under standardized conditions, and treated orally for 4 weeks with ciprofibrate at 2 mg/kg body weight (dissolved in 0.9% NaCl; administered volume: 5 ml/kg body weight) once daily. Control rats received 0.9% NaCl at 5 ml/kg body weight. Animal procedures were approved by the Thuringian Animal Protection Committee. All animals received care according to the criteria outlined in the German Law on the Protection of Animals and the Guide for the Care and Use of Laboratory Animals published by the US National Institutes of Health (NIH publication No. 86–23, revised 1985). 8
From the paraffin blocks, 4-µm sections were prepared and floated onto positively charged slides. Immunostaining was performed using an indirect peroxidase labeling method. Samples were dewaxed and rehydrated in a descending alcohol series, during which endogenous peroxidase was blocked by incubating samples in 0.3% H2O2 in methanol for 45 min. For antigen retrieval, samples were microwaved in 10 mM citric acid (pH 6.0) for 16 min at 600 W. Subsequently, samples were incubated with anti-FAM159B HPA011778 antibody overnight at 4°C, followed by incubation with biotinylated anti-rabbit IgG and peroxidase-conjugated avidin (Vector ABC Elite Kit; Vector Laboratories, Burlingame, CA). Binding of the primary antibody was visualized using 3-amino-9-ethylcarbazole in acetate buffer (BioGenex, San Ramon, CA). Finally, samples were rinsed, counterstained with Mayer’s hematoxylin, and mounted in Vectamount mounting medium (Vector Laboratories).
For immunohistochemical controls, HPA011778 was adsorbed for 2 hr at room temperature with 10 µl/ml of the peptide PrEST antigen (Atlas Antibodies) used for rabbit immunizations.
For double-labeling experiments, samples were incubated overnight at 4°C with anti-FAM159B HPA011778 antibody together with monoclonal mouse anti-insulin antibody (1:100; Abcam, Cambridge, MA), monoclonal mouse anti-glucagon antibody (1:500; Sigma-Aldrich, St. Louis, MO), or monoclonal rat anti-SST-14/28 antibody (1:300; Abcam). The following day, samples were incubated with Cy3-conjugated anti-rabbit secondary antibody and Alexa Fluor 488-conjugated anti-mouse or anti-rat secondary antibody (1:5000; Invitrogen, Karlsruhe, Germany). Samples were then mounted in Fluoromount G with DAPI (Thermo Fisher Scientific, Waltham, MA) and examined using a Zeiss LSM 900 Airyscan 2 laser scanning confocal microscope (Jena, Germany).
When indicated, immunohistochemistry samples were scanned using a Hamamatsu NanoZoomer (Hamamatsu Photonics, Hamamatsu, Japan). For each slide, the total area covered by the pancreas sample, total islet area, and total area occupied by FAM159B-positive cells were measured using NDP.view2 2.9.29 software (Hamamatsu Photonics, Hamamatsu, Japan).
Statistics
SPSS 28.0.0.0 (IBM, Armonk, NY) was used for statistical analysis. Because the data were not normally distributed, Kruskal–Wallis tests, Mann–Whitney U tests, and Spearman’s rank correlations were performed. p-Values ≤0.05 were considered statistically significant.
Results
Comparative Immunohistochemical Analysis of FAM159B Expression in Human, Rat, and Mouse Tissues
Figure 1 shows FAM159B expression in selected human, Wistar Han rat, and C57BL/6 mouse organs. Within the cortex, the adaptor protein was present mainly in pyramidal cells. There were no notable differences among species. Also in trigeminal and dorsal root ganglia, similar FAM159B expression patterns were observed across all three species but with varying degrees of intensity and lower expression in humans. In the human pancreas, FAM159B expression was distributed throughout the entire Langerhans islets. By contrast, in rats and mice, expression of the adaptor protein was limited to single cells on the outer edges of islets. Weak to moderately strong FAM159B positivity was observed in all three species in the exocrine pancreas. Human kidneys showed strong FAM159B expression in mesangial cells of the glomeruli and the visceral and parietal layer of Bowman’s capsule and a varying degree of expression in tubules. Similar FAM159B expression was observed in rat and mouse kidneys. Weak to moderately strong staining of the intestinal epithelia and intestinal ganglia and strong staining of enteroendocrine cells were observed in all three species.
We further analyzed samples from the human, rat, and mouse pituitary gland, thymus gland, spleen, heart, lung, liver, adrenal gland, stomach, and epididymis (for examples of staining, see Appendix Fig. A1). While rat pituitary glands showed distinct FAM159B expression, human and mouse samples exhibited only low amounts of the adaptor protein. In thymus and spleen samples from all three species, strongly FAM159B-positive single macrophages were detected in addition to lightly stained lymphocytes. No noticeable immunostaining was observed in heart samples from any species. In the lungs, FAM159B expression was found in the bronchial epithelia and neuroendocrine cells, as well as in alveolar macrophages and other immune cells, with no major differences among species. FAM159B expression was absent from hepatocytes in the liver of all three species. By contrast, the adaptor protein was clearly expressed by Kupffer cells, especially in rat and mouse tissue samples. Across all three species, the adrenal medulla was largely FAM159B-negative, whereas distinct FAM159B expression was seen in the adrenal cortex, with the most pronounced staining in mice. In the stomach of all three species, in addition to moderately strong staining of epithelial cells, a strong immunosignal was detected in neuroendocrine cells. Finally, in all three species, moderate to strong positivity for the adaptor protein was observed in epididymal ducts of the epididymis, whereas the sperm themselves were FAM159B-negative.
Immunohistochemical Double-Labeling of Human, Mouse, and Rat Pancreas Tissue
Similar to the results of conventional immunohistochemical analyses, immunohistochemical double-labeling experiments showed expression of FAM159B throughout Langerhans islets in humans (Fig. 2A to C; red color). In addition, FAM159B expression partially overlapped with insulin, glucagon, and SST expression (Fig. 2A to C; green color). Hence, the adaptor protein was present in most insulin-producing β-cells and, to a lesser extent, in glucagon-releasing α-cells and SST-secreting δ-cells (Fig. 2A to C; overlap in yellow color; for individual channels, see Appendix Fig. A2–A4). By contrast, in rat and mouse pancreatic islets, FAM159B expression was limited to cells at the outer edges of the structures, and there was no overlap between FAM159B and insulin or glucagon expression but complete colocalization between FAM159B and SST expression (Fig. 2D to I; for individual channels, see Appendix Fig. A2–A4).
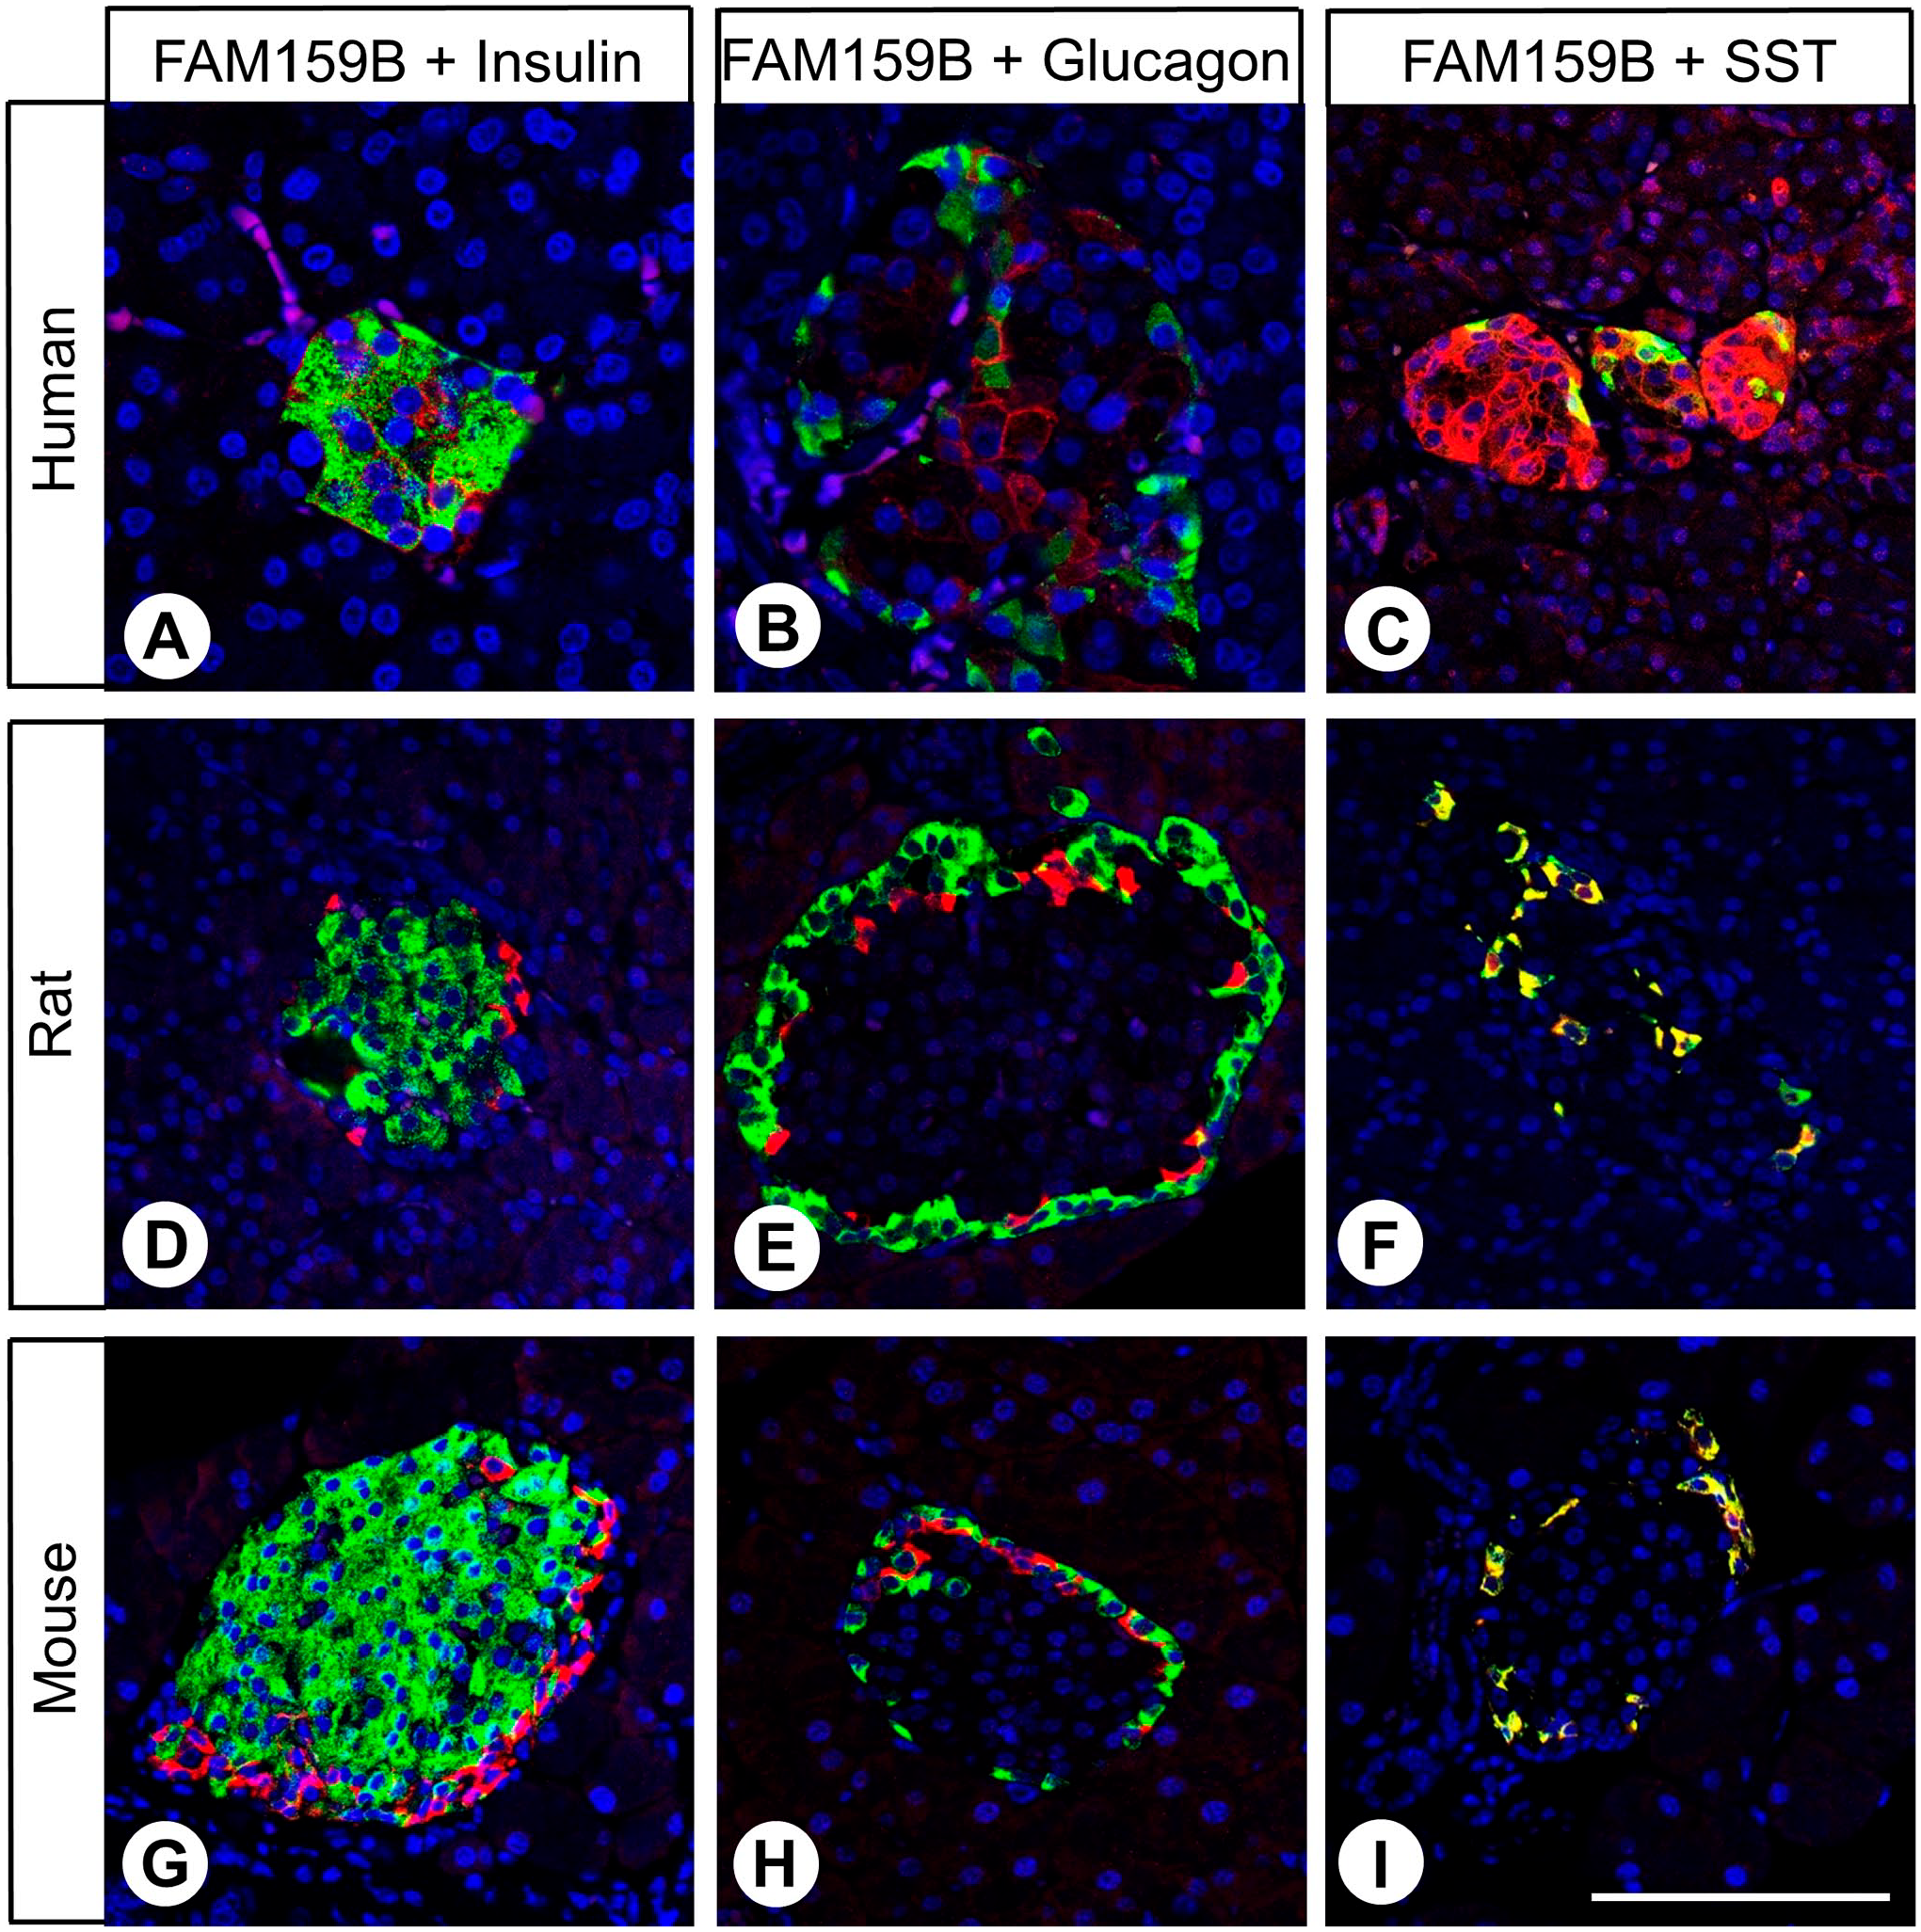
Double-labeling immunohistochemical analysis of FAM159B and insulin (A–C), glucagon (D–F), and somatostatin-14/28 (SST) (G–I) expression in the human, rat, and mouse pancreas. Labeling for FAM159B was visualized using Cy3-conjugated anti-rabbit antibody (red) and for insulin, glucagon, or SST using Alexa Fluor-488-conjugated anti-mouse or anti-rat antibody (green); overlapping expression is shown in orange/yellow color. Scale bar: 100 µm.
Analysis of FAM159B Expression in Pancreas Tissue From Control and Ciprofibrate-Treated Lean and Obese Zucker Rats and Non-Diabetic and Diabetic Patients
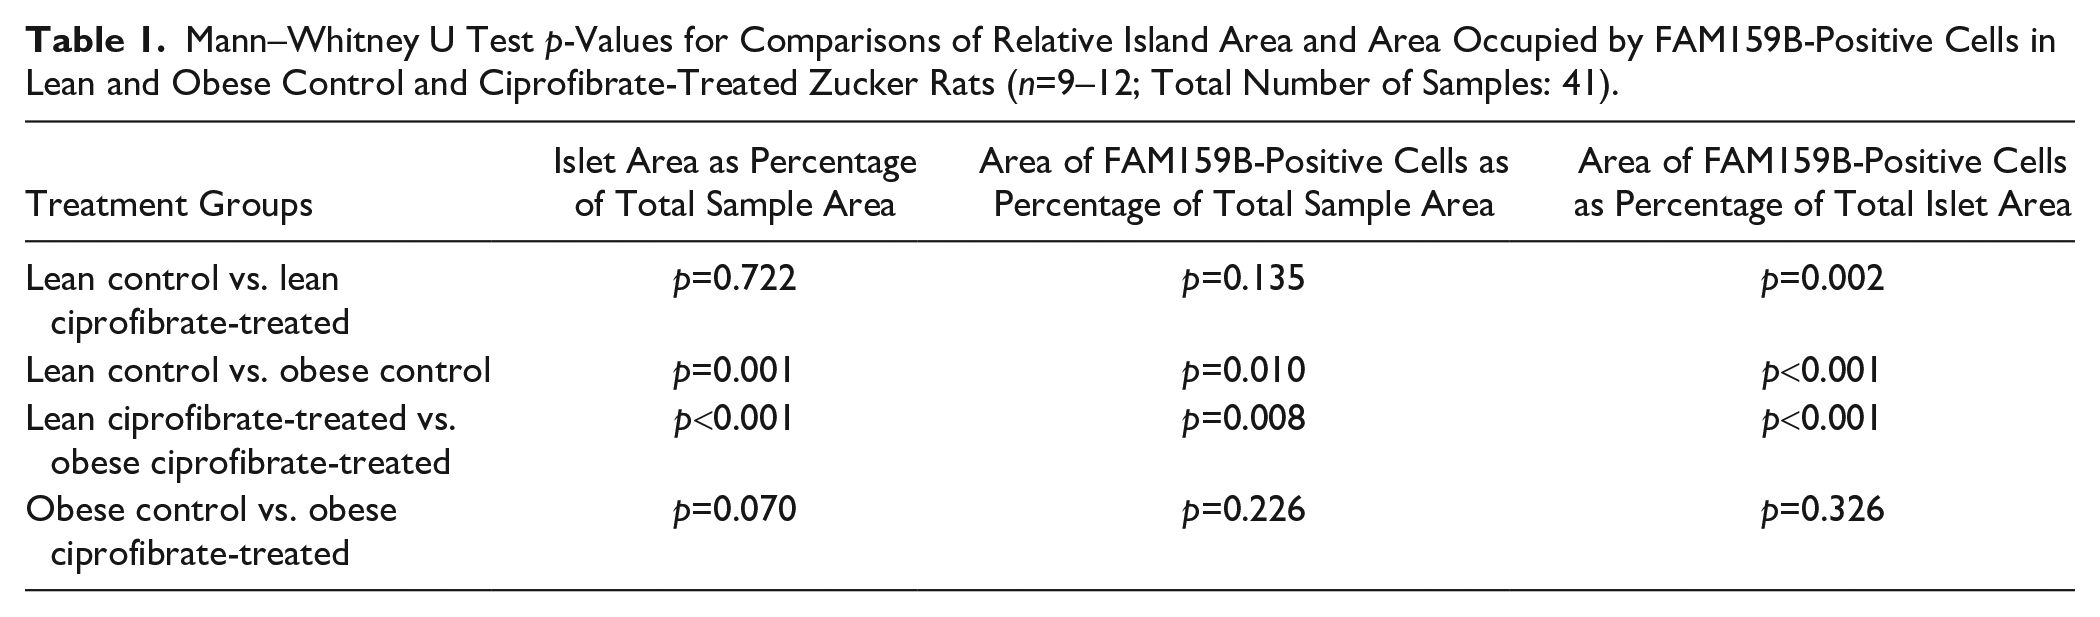
In lean and obese Zucker rats, immunohistochemical analysis of FAM159B expression revealed an expression pattern similar to that observed in wild-type Wistar Han rats and wild-type C57BL/6 mice. Also, FAM159B expression was limited to single cells on the outer edges of the islets in both lean and obese Zucker rats. However, obese Zucker rats, both control and ciprofibrate-treated, exhibited enlarged islets in comparison with respective lean rats when examining the pancreas samples under a microscope (Fig. 3). We therefore scanned and digitized the slides to determine the total area of each pancreas sample, total area of islets, and total area occupied by FAM159B-positive cells, which revealed several significant differences among the four groups regarding islet areas as percentage of the total pancreas area, area of FAM159B-positive cells as a percentage of total sample area, and area of FAM159B-positive cells as a percentage of total islet area (Fig. 4; Kruskal–Wallis test p<0.001 each; for pairwise Mann–Whitney U tests p-values, see Table 1). Lean control rats showed significantly smaller islet areas as a percentage of the whole pancreas area than obese control rats. The area of FAM159B-positive cells as a percentage of total islet area was significantly larger in lean control rats than in obese control rats. On the other hand, lean control rats showed a significantly smaller area of FAM159B-positive cells as a percentage of the total sample area than obese control rats. The same observations were made when comparing lean and obese ciprofibrate-treated rats. Furthermore, lean ciprofibrate-treated rats displayed a significantly higher area of FAM159B-positive cells as a percentage of total islet area than lean control rats.
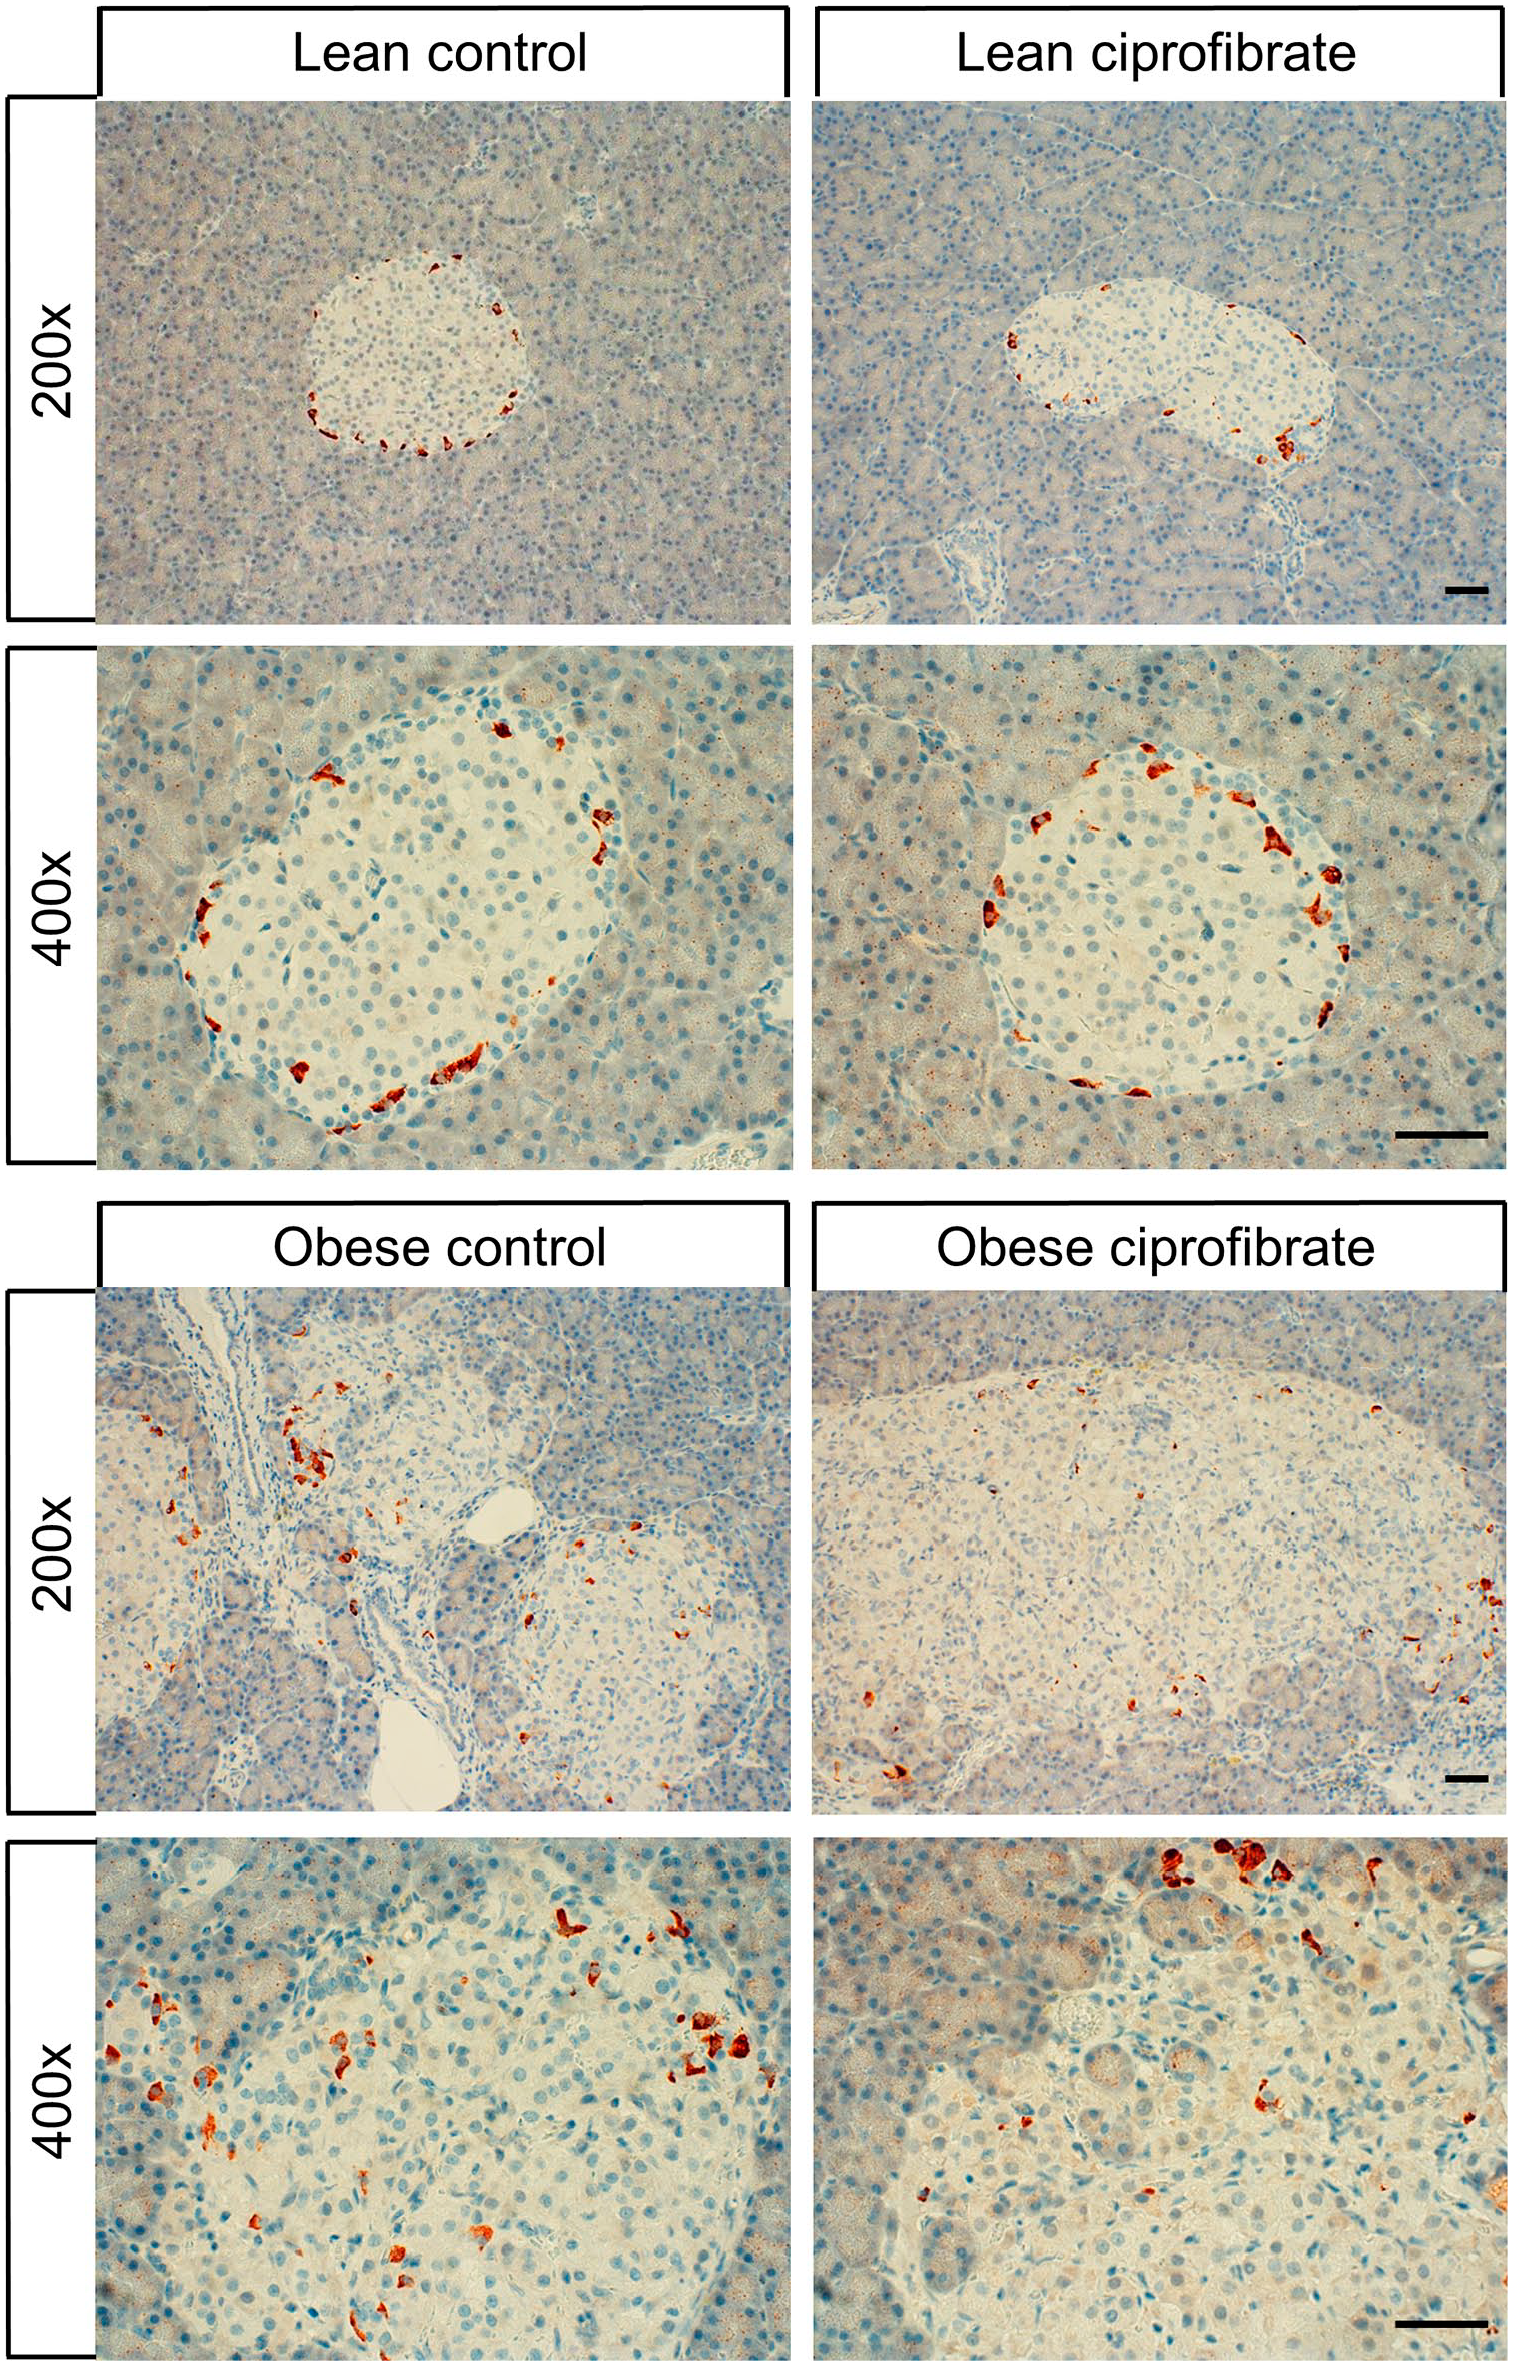
Immunohistochemical detection of FAM159B expression in Langerhans islets from lean and obese control and ciprofibrate-treated Zucker rats. Immunohistochemical staining (red-brown color) and counterstaining with hematoxylin (blue). Scale bars: 50 µm.
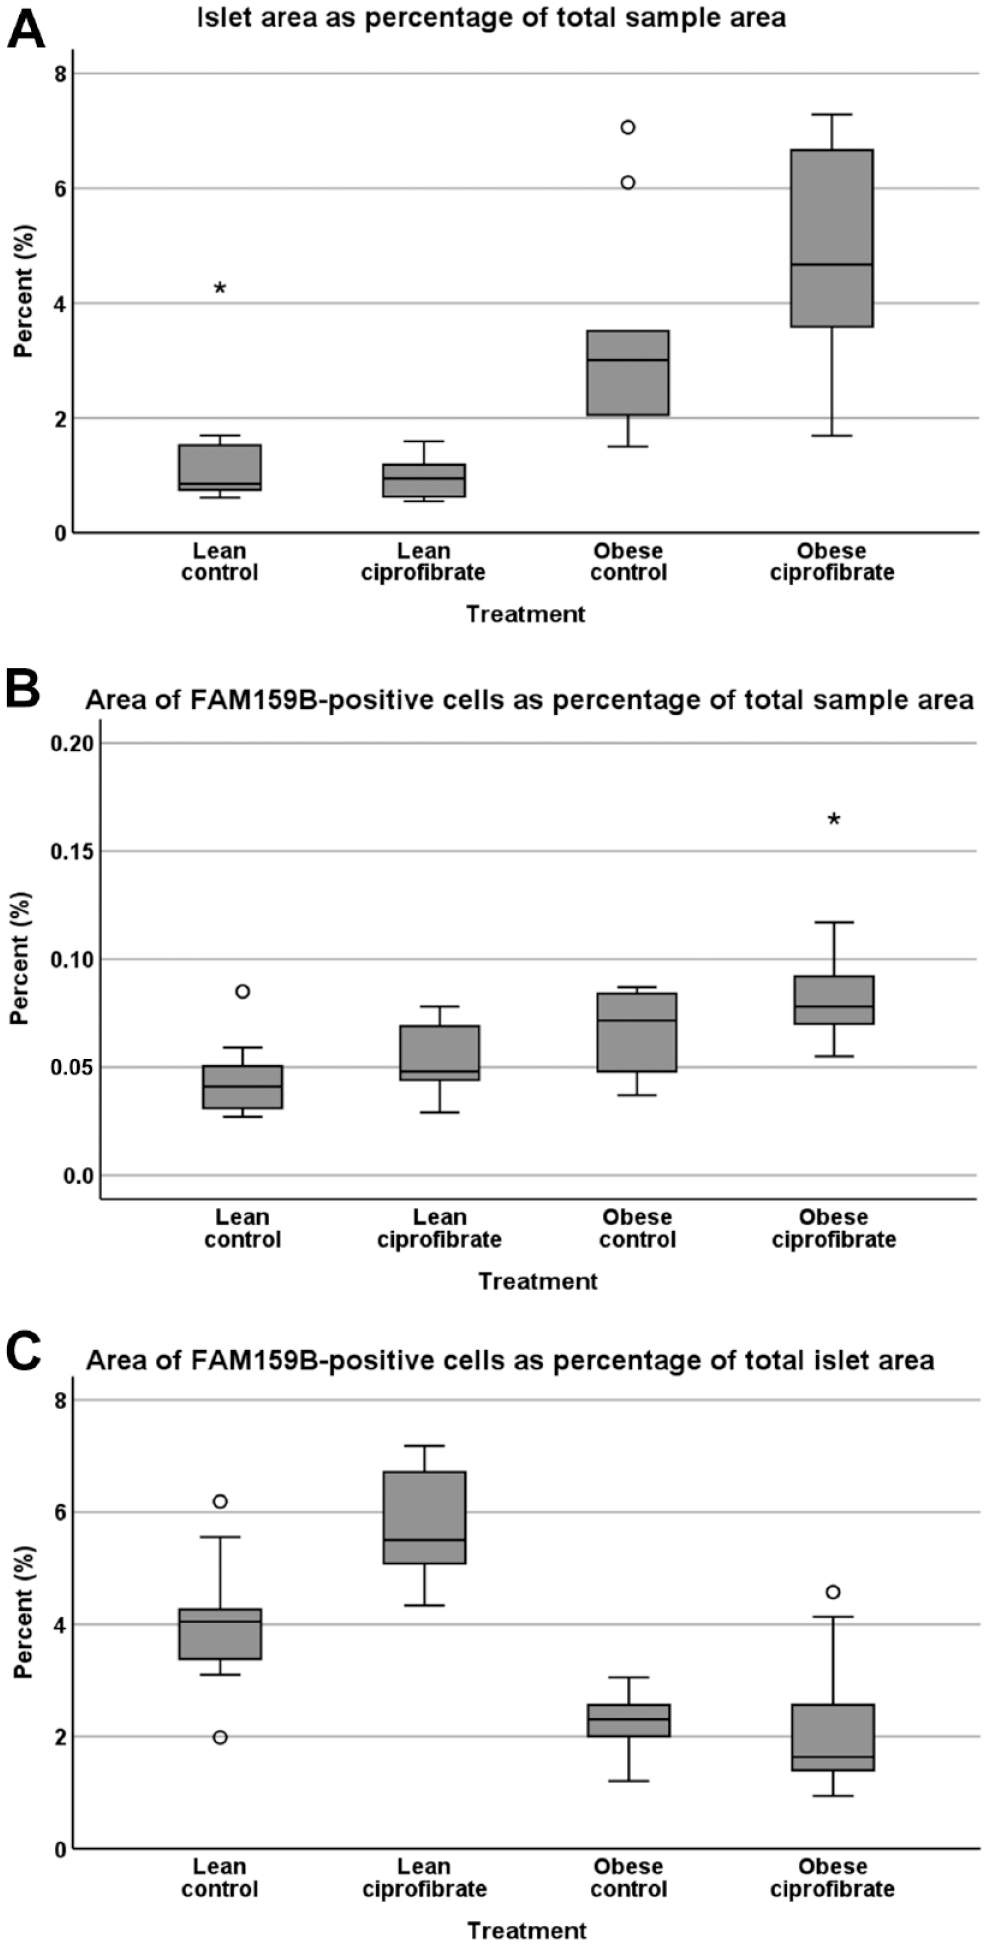
(A) Islet area as a percentage of total sample area, (B) area of FAM159B-positive cells as a percentage of total sample area, and (C) area of FAM159B-positive cells as a percentage of total islet area for lean and obese control and ciprofibrate-treated Zucker rats. Boxplots depict median values, upper and lower quartiles, minimum and maximum values, and outliers. Circles: mild outliers (data points 1.5–3 times above the upper or below the lower quartile); asterisks: extreme outliers (data points >3 times above the upper or below the lower quartile). Number of samples per treatment group: 9–12; total number of samples: 41.
Mann–Whitney U Test p-Values for Comparisons of Relative Island Area and Area Occupied by FAM159B-Positive Cells in Lean and Obese Control and Ciprofibrate-Treated Zucker Rats (n=9–12; Total Number of Samples: 41).
Between non-diabetic and diabetic patients, immunohistochemical analysis of FAM159B expression in islets showed no notable differences. Islets were the same size and showed similar intensity and distribution of FAM159B expression across all examined samples (data not shown). It should be noted, however, that all diabetic patients were medically treated with insulin (n=15), metformin (n=9), sitagliptin (n=2), or glimepiride (n=1).
When analyzing measured blood glucose levels of Zucker rats from our previous study 8 (for the sake of convenience, glucose values are retrieved from the study by Lupp et al. 8 and compiled in Appendix Table 1) together with the measured islet areas, we found a significant positive correlation between blood glucose levels and islet area as a percentage of total sample area (rsp = 0.628, p<0.001; Fig. 5A) and between blood glucose levels and area of FAM159B-positive cells as a percentage of total sample area (rsp = 0.596, p=0.001; Fig. 5B). Also, we observed a significant negative correlation between blood glucose levels and the area of FAM159B-positive cells as a percentage of total islet area (rsp = −0.473, p=0.002; Fig. 5C). In addition, there was a significant difference in blood glucose levels between lean control and obese control rats, between lean ciprofibrate-treated and obese ciprofibrate-treated rats, and between obese control and obese ciprofibrate-treated rats (Kruskal–Wallis test: p<0.001; for pairwise Mann–Whitney U test p-values, see Appendix Table 2).
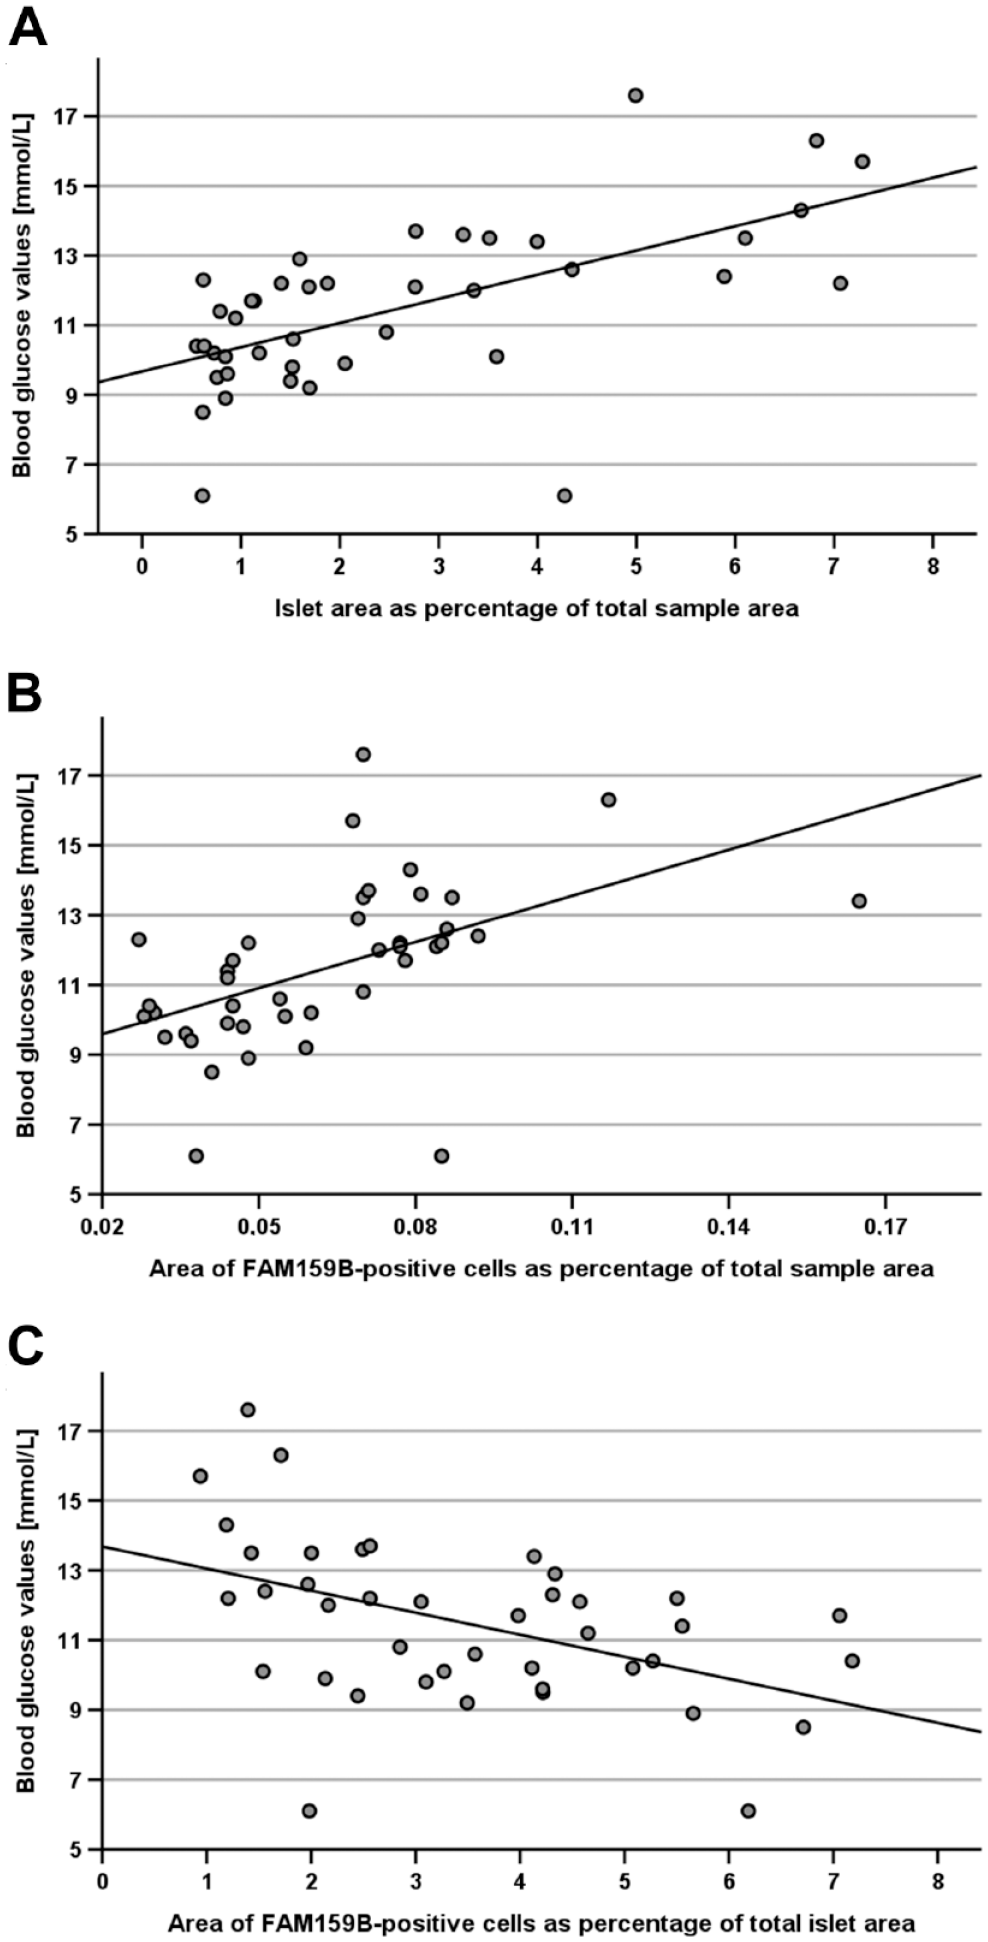
Correlations between blood glucose values of lean and obese control and ciprofibrate-treated Zucker rats and (A) islet area as a percentage of total sample area, (B) area of FAM159B-positive cells as a percentage of total sample area, and (C) area of FAM159B-positive cells as a percentage of total islet area. Number of animals/samples: n=41.
We then performed double-labeling immunohistochemistry analyses of FAM159B expression together with insulin, glucagon, or SST expression in pancreas samples from lean and obese Zucker rats. Again, FAM159B did not colocalize with insulin or glucagon but showed complete coexpression with SST (Fig. 6; for individual channels, see Appendix Fig. A5–A7). There were, however, significant differences in insulin, glucagon, and SST expression patterns between lean and obese rats. As in Wistar Han rats, in lean Zucker rats, glucagon and SST expression were limited to the outer areas of islets, whereas insulin-positive cells were located in the center of islets. Obese rats, in contrast, showed glucagon- and SST-expressing cells intercalated between insulin-positive cells. Insulin expression increased with larger islet size, whereas glucagon and SST expression remained relatively unchanged. In obese rats, some islets were slightly more disorganized and tended to fray at the edges and invade surrounding tissue, losing their characteristic round shape (Fig. 3; also observed by comparing glucagon expression between lean and obese rats, Fig. 6). This phenomenon was even more pronounced in obese ciprofibrate-treated rats (Figs. 3 and 6).
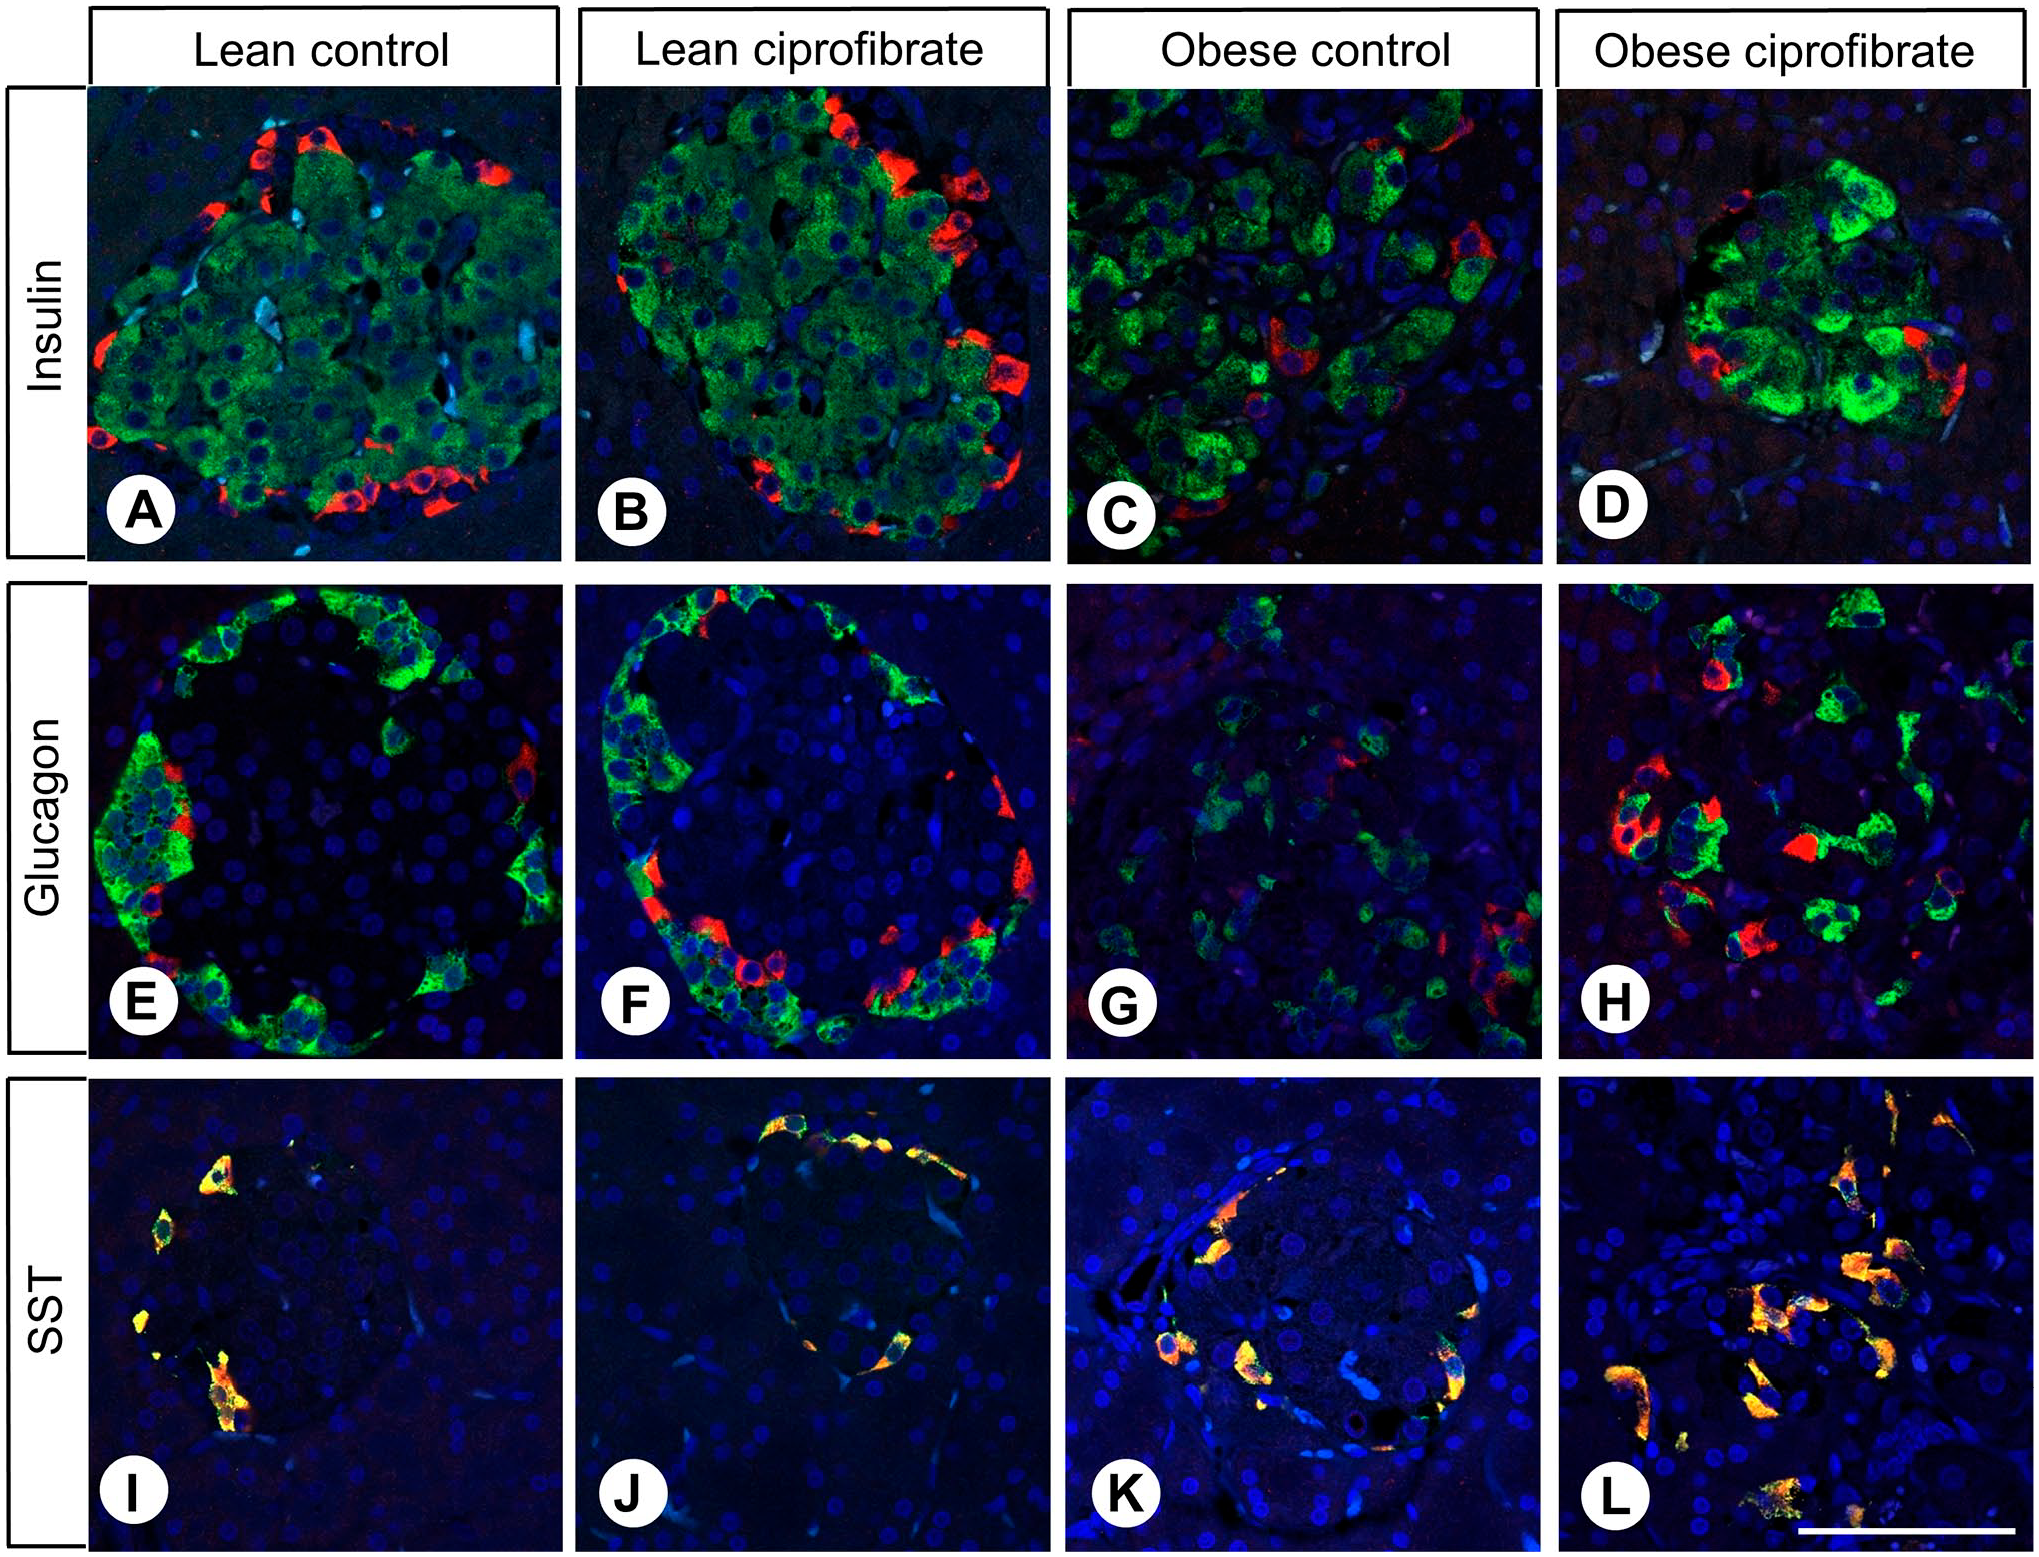
Double-labeling immunohistochemical analysis of FAM159B and insulin (A–D), glucagon (E–H), and somatostatin (SST) (I–L) expression in Langerhans islets from lean and obese control and ciprofibrate-treated Zucker rats. Labeling for FAM159B was visualized using Cy3-conjugated anti-rabbit antibody (red) and for insulin, glucagon, or somatostatin (SST) using Alexa Fluor-488–conjugated anti-mouse or anti-rat antibody (green); overlapping expression is shown in orange/yellow color. Scale bar: 100 µm.
Discussion
Comparative Immunohistochemical Analysis of FAM159B Expression in Human, Rat, and Mouse Tissues
Immunohistochemical analysis of healthy human, rat, and mouse tissue samples revealed some differences among species. The most significant dissimilarity in FAM159B expression was observed in pancreatic islets. While human samples showed the presence of FAM159B throughout whole islets, FAM159B expression was confined to single cells on the outer edge of islets in rat and mouse samples. Other organs, such as the pituitary gland, kidney, and adrenal gland, showed different intensities of adaptor protein expression across species. Therefore, FAM159B expression (and probably also function) in one species cannot be readily transferred to another species. Nevertheless, it remains to be clarified whether these differences in FAM159B expression are due to varying functions of the protein in different species or due to the unique biology of mice, rats, and humans.
As previously described, 6 human pancreas samples show FAM159B expression in insulin-producing β-cells and, to a lesser extent, in glucagon-releasing α-cells, supporting the previously observed tendency toward a correlation between FAM159B and insulin expression but not glucagon expression in neuroendocrine tumors of the pancreas. 6 As described before, 7 human Langerhans islets displayed partial overlap of FAM159B and SST expression. On the contrary, rat and mouse samples did not exhibit overlap between FAM159B and insulin or glucagon expression but strong colocalization with SST expression. These results indicate that in humans, FAM159B is involved not only in the regulation of insulin secretion 3 but also in the modulation of glucagon and SST release. It can therefore be assumed that this adaptor protein intervenes in glucose homeostasis in a much more complex way than previously postulated. Furthermore, our results suggest that in rodents, unlike humans, FAM159B is not involved, or not directly involved, in the modulation of insulin release. Interestingly, in the human samples, FAM159B expression was localized mainly at the cell membrane in the insulin- and glucagon-containing cells, while in all three species, it was localized predominantly to the cytoplasm in the SST-expressing cells (see Fig. 2), suggesting that the protein may also have a divergent functional state or even dissimilar functions in different cells.
Pancreas of Humans, Rats, and Mice: Similarities and Differences
Although the pancreas of humans, rats, and mice shows several similarities in histology, some differences should be noted. One major difference is the location of the organ within humans and rodents, as well as its gross anatomy. While the human pancreas is a compact organ with four distinct regions (head, neck, body, tail), rodents have a pancreas that is dispersed throughout the mesentery next to the duodenum and can be split into three main lobes (duodenal, splenic, and gastric). Overall, the pancreas in rats and mice is not as well defined as the human pancreas. In rodents, islets constitute 1–2% of pancreas volume, whereas in humans, this percentage increases to 1–4%. The number of islets is proportional to body weight across various species, but islets can vary in size, location, and composition. 14 Human islets have a higher α-cell proportion than rodent islets and <10% vs. <5% δ-cells, respectively. 15 Furthermore, rat and mouse islets show distinct expression patterns of endocrine cells; under normal conditions, α- and δ-cells are located in the periphery of islets, with β-cells being found within the core. Nonetheless, β-cells are still exposed to the outer layer and are not fully “surrounded” by α-cells. In human islets, the different endocrine cells are intermingled throughout whole islets. 16 In the present study, we also observed these different islet compositions in humans, rats, and mice. Three-dimensional (3D) analysis reveals that human α-cells do not intermingle with other cells on a single-cell level but form clusters located in a β-cell core. 16 Human β-cells are not clustered as in rodents, but 71% of β-cells are associated with other endocrine cells. 17 This points toward the possibility of unique paracrine interactions within a given islet. The composition and distribution of islets can further vary within a given species depending on their physiological and pathophysiological state. For example, human-type islet architecture can be found in mice in states with increased demands for insulin, such as inflammation, obesity, pregnancy, and diabetes. 15
Kim et al. 18 proposed that the more “disorganized” islet composition in humans enables β-cells to respond to low glucose concentrations (1 mM) that mice islets do not recognize. Furthermore, they found that ob/ob and pregnant mice exhibit more large islets than humans and other primates. Contrary to islet architecture under normal conditions, some mice even show intermingling of α- and δ-cells with β-cells. The authors concluded that islets possess a certain extent of plasticity that allows them to adapt to various physiological and pathophysiological changes. This is in line with the results of the present study, which showed that obese Zucker rats, both control and ciprofibrate-treated, exhibit a more “disorganized” islet composition. Some obese rats also showed δ-cells intermingled with β-cells. Taking this idea one step further, Kim et al. 18 postulated that differences between humans and mice arose due to past evolutionary adjustments to adapt to changing demands of insulin.
Despite anatomical and histological differences in the pancreas, glucose and insulin signaling are highly conserved across species ranging from fruit flies to rodents. 19 Consequently, porcine or bovine insulin was used to treat human diabetes before human insulin was introduced into routine therapy in the early 1980s. 20 Even today, animals (i.e., cats and dogs) with diabetes are still treated with recombinant human insulin. 21 There are, however, also slight differences among species. For example, Drosophila exhibits an insulin receptor with a structure highly homologous to that of mammalian receptors and also contains an insulin-like molecule. However, although the amino acid sequence of the Drosophila insulin receptor is similar to that of humans, the Drosophila receptor is larger due to extensions on the amino and carboxyl termini. 22 In humans, the insulin receptor is encoded through a single insulin receptor gene on chromosome 19 and is composed of 19 exons. The receptor exists in two isoforms (IR-A and IR-B) that result from alternative splicing on exon 11. By contrast, the insulin receptor gene of chickens only encodes a single insulin receptor. 23 Therefore, although glucose signaling is highly conserved and the final outcome of lowering blood glucose concentration may be identical across species, there are differences that can result in changes in downstream signaling and receptor or protein expression on a subcellular level. Nevertheless, with the exception of the pancreatic islets, FAM159B overall shows similar, although not identical, expression in humans, rats, and mice. It is therefore possible that the adaptor protein still has the same general function in all three species but exhibits differences in downstream processes due to slight species differences in these processes. Identifying the exact function of FAM159B remains a goal for future research. Once its function is identified, it may be possible to explain the different expression patterns of FAM159B in humans, rats, and mice.
Immunohistochemical Analysis of Lean and Obese Control and Ciprofibrate-Treated Zucker Rats
Immunohistochemical analyses of lean and obese control and ciprofibrate-treated Zucker rats revealed significantly larger islet areas in obese rats (and especially in obese ciprofibrate-treated rats) than in lean rats resulting from an increase in insulin-producing β-cells. This observation is in line with previous studies showing that prediabetes is a state in which rising insulin demands are temporarily compensated for by increased β-cell secretory activity, followed by adaptive β-cell proliferation. 24 The area of FAM159B-expressing cells did not substantially increase in correspondence with islet area, and consequently, obese rats showed a significantly smaller area of FAM159B-positive cells as a percentage of total islet area than the respective control or ciprofibrate-treated lean rats. Nevertheless, the calculated area of FAM159B-positive cells as a percentage of the total sample area was somewhat larger in obese rats than in lean rats. Therefore, the amount of adaptor protein-expressing cells most likely slightly increased with islet size. This observation could be explained by more closely analyzing the expression of SST-releasing δ-cells in rodents and hypothesizing that FAM159B is directly involved in SST signaling pathways.
δ-Cells only comprise up to 5–10% of endocrine cells in islets 15 but are highly important for maintaining balanced hormone output. As SST is a potent inhibitor of insulin and glucagon secretion, rodent δ-cells may communicate with α- and β-cells through a neuron-like morphology with defined cell soma and filopodia-like extensions. Although δ-cells are almost exclusively found on the outer edge closer to α-cells than to β-cells, their unique morphology may allow them to communicate across islets and modulate various non–δ-cells that are not in close proximity. This possibility is supported by the observation that δ-cells exhibit various hormone and neurotransmitter receptors such as glucagon receptor and glucagon-like peptide-1 receptor, indicating their involvement in paracrine, endocrine, neuronal, and nutritional signals. By contrast, human δ-cells do not show this morphology and are much more compact but are found dispersed between α- and β-cells, suggesting that the plasticity of δ-cells along with their epigenetic adaptivity contributes to changes in islet function in response to varying metabolic environments. 25 Therefore, the slight increase of FAM159B expression in larger islets could be an adaptive mechanism; δ-cells may proliferate to a small extent or elongate their dynamic filopodia-like extensions in an attempt to reach more newly proliferated β-cells. Consistent with this possibility, a previous study shows that the length of filopodia extension is dynamic, enabling δ-cells to reposition in the intra-islet milieu and allowing plasticity in SST signaling landscapes within islets. 24
The massive proliferation of β-cells also explains the decrease in FAM159B expression as a percentage of total islet area in obese rats. Compared with lean rats, which show the expected 4–5% area of FAM159B expression relative to total islet area, obese rats showed only ~2% relative area of FAM159B expression. As the total islet area in obese rats increased but δ-cells do not proliferate as extensively, their corresponding area as a percentage decreased. Furthermore, we confirmed the previously described neuron-like morphology of δ-cells in rats (Fig. 6), as well as the different localization of δ-cells in humans and rodents.
Due to the scarcity of δ-cells, their cellular regulatory mechanisms are still largely unknown. Previous studies revealed some cellular changes with diabetes, with several species showing a reduction in δ- and β-cells and an increase in α-cells. Impaired δ-cell function in diabetes and prediabetes may lead to an imbalance in α- and β-cells, thus shifting the glycaemia setpoint toward hyperglycaemia. 25 Zucker rats develop hyperphagia, obesity, and hyperlipidemia, leading to insulin resistance and hyperglycaemia by 12 weeks of age. 8 In the present study, we observed an increased islet area with a higher blood glucose level in obese Zucker rats, which may occur as a result of insulin resistance in peripheral cells. That is, as a coping mechanism and in order to secrete more insulin, proliferation of β-cells takes place. However, as this measure is not sufficient, rats still develop hyperglycaemia. We further observed a decrease in FAM159B-positive cells as a percentage of total islet area along with an increase in blood glucose levels. As FAM159B expression is found in δ-cells in rats and larger islets are due to β-cell proliferation, the observed decrease in the area of FAM159B-positive cells was to be expected. Furthermore, this also hints at an imbalance of α-, β-, and δ-cells in diabetic rats compared with healthy rats.
Arrojo e Drigo et al. 24 observed several components for SST secretion in the filopodia of human and mouse δ-cells, including synaptophysin and vesicle-associated protein 2 (VAMP2). Thus, they postulated that SST secretion can occur independently of the soma and filopodia of δ-cells, as both exhibit elements of active exocytosis machinery. Having previously analyzed the coexpression of FAM159B with various markers for neuroendocrine cells, 7 we also observed strong coexpression of this adaptor protein, among others, with synaptophysin. It is thus possible that FAM159B is involved in the exocytosis of SST from δ-cells and other SST-secreting cells in humans, rats, and mice. Furthermore, as this adaptor protein is found also in other organs in humans, rats, and mice, it may also be involved in exocytosis processes other than those of insulin, glucagon, and SST. Further research is needed to answer this question and elucidate the exact roles of FAM159B across species.
Interestingly, the adaptive increase in islet size, the β-cell proliferation and the changes in islet architecture were more pronounced in obese ciprofibrate-treated Zucker rats than in obese control Zucker rats. As blood glucose levels were also higher in ciprofibrate-treated rats, ciprofibrate does not seem to have a protective effect on the development of diabetes mellitus in rodents, unlike in humans.12,13
Analysis of FAM159B Expression in Diabetic and Non-Diabetic Patients
In line with previous findings, 2 we did not detect a difference in FAM159B expression in pancreas samples from non-diabetic and diabetic humans. However, it is important to note that all samples from diabetic humans originated from patients who were treated and showed blood glucose levels in the normal range. Therefore, two conclusions are possible: FAM159B may be involved in blood glucose regulation processes that are not significantly altered in patients with diabetes, or FAM159B expression may be unchanged when diabetes is effectively treated.
In conclusion, for the present study, a striking species difference in adaptor protein FAM159B expression was observed in pancreas islets. While FAM159B expression partially overlapped with insulin, glucagon, and SST expression in human islets, rats and mice exhibited complete colocalization only between FAM159B and SST expression. These results indicate that FAM159B is involved not only in the regulation of insulin but also in the modulation of glucagon and SST release in humans, whereas it is only involved in the regulation of SST release in rodents.
Hence, beyond dissimilarities in islet architecture, our results point to larger differences in blood glucose regulation between humans and rodents than generally assumed. Finally, it can be concluded from our data that findings on FAM159B expression (and function) but also on blood glucose regulation obtained in rodents cannot be easily transferred to humans.
Footnotes
Appendix
Mann–Whitney U Test p-Values for Comparisons of Blood Glucose Levels in Lean and Obese Control and Ciprofibrate-Treated Zucker Rats.
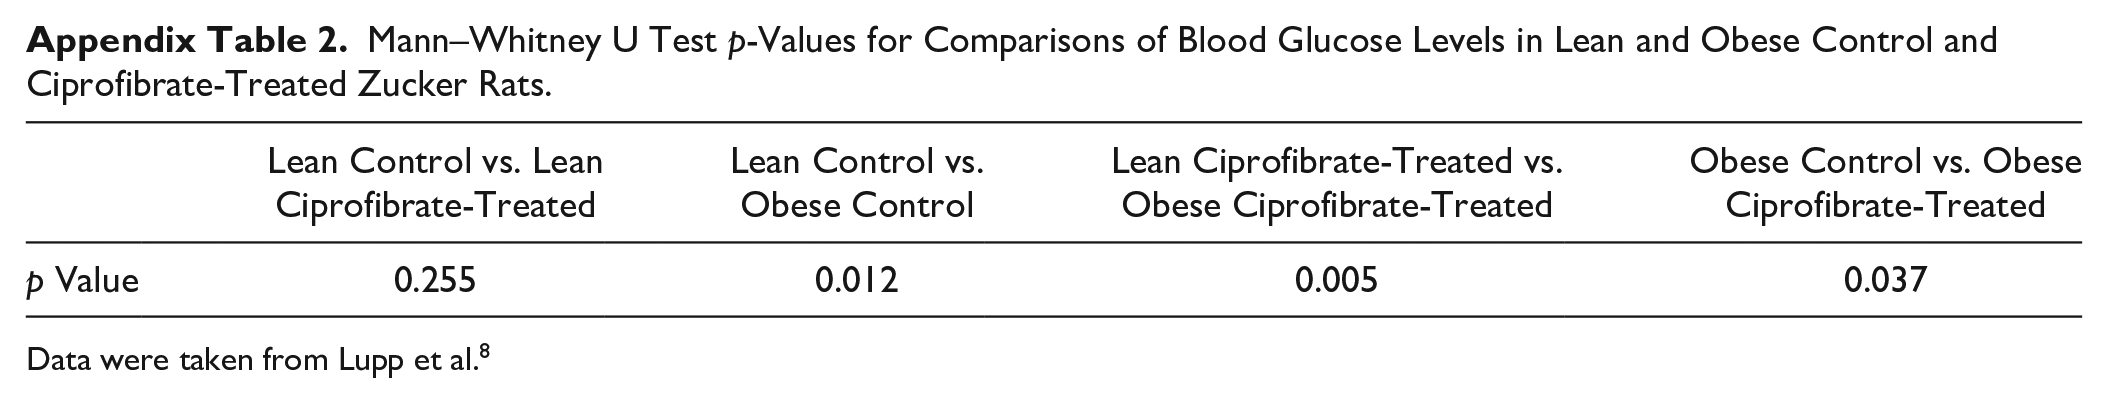
| Lean Control vs. Lean Ciprofibrate-Treated | Lean Control vs. Obese Control | Lean Ciprofibrate-Treated vs. Obese Ciprofibrate-Treated | Obese Control vs. Obese Ciprofibrate-Treated | |
|---|---|---|---|---|
| p Value | 0.255 | 0.012 | 0.005 | 0.037 |
Data were taken from Lupp et al. 8
Competing Interests
The author(s) declared no potential conflicts of interest with respect to the research, authorship, and/or publication of this article.
Author Contributions
Conceptualization (A-SLB and AL); Formal analysis (A-SLB and AL); Investigation (A-SLB and AL); Methodology (A-SLB and AL); Project administration (AL); Resources (DK and JS); Supervision (AL); Validation (A-SLB and AL); Visualization (A-SLB and AL); Writing – original draft (A-SLB and AL); Writing – review & editing (A-SLB, DK, JS, and AL).
Funding
The author(s) disclosed receipt of the following financial support for the research, authorship, and/or publication of this article: Daniel Kaemmerer received funding and support for travel to meetings from IPSEN and PFIZER.