
Abstract
To clarify the cellular mechanism of cortical porosity induced by intermittent parathyroid hormone (PTH) administration, we examined the femoral cortical bone of mice that received 40 µg/kg/day (four times a day) human PTH (hPTH) (1–34). The PTH-driven cortical porosity initiated from the metaphyseal region and chronologically expanded toward the diaphysis. Alkaline phosphatase (ALP)-positive osteoblasts in the control mice covered the cortical surface, and endomucin-positive blood vessels were distant from these osteoblasts. In PTH-administered mice, endomucin-reactive blood vessels with TRAP-positive penetrated the ALP-positive osteoblast layer, invading the cortical bone. Statistically, the distance between endomucin-positive blood vessels and the cortical bone surface abated after PTH administration. Transmission electron microscopic observation demonstrated that vascular endothelial cells often pass through the flattened osteoblast layer and accompanied osteoclasts in the deep region of the cortical bone. The cell layers covering mature osteoblasts thickened with PTH administration and exhibited ALP, α-smooth muscle actin (αSMA), vascular cell adhesion molecule-1 (VCAM1), and receptor activator of NF-κB ligand (RANKL). Within these cell layers, osteoclasts were found near endomucin-reactive blood vessels. In PTH-administered femora, osteocytes secreted Dkk1, a Wnt inhibitor that affects angiogenesis, and blood vessels exhibited plasmalemma vesicle-associated protein, an angiogenic molecule. In summary, endomucin-positive blood vessels, when accompanied by osteoclasts in the ALP/αSMA/VCAM1/RANKL-reactive osteoblastic cell layers, invade the cortical bone, potentially due to the action of osteocyte-derived molecules such as DKK1.
Introduction
Contemporary comprehension of the mechanisms underlying bone formation stimulated by drug treatments for osteoporosis can be divided into two principal histological processes: remodeling-based and modeling-based bone formation. 1 Remodeling-based bone formation follows osteoclast bone resorption, whereas modeling-based bone formation involves independent occurrence of bone formation and resorption. Among these, teriparatide, a synthetic human parathyroid hormone (hPTH) analog, is a commonly used agent for investigating remodeling-based bone formation. Parathyroid hormone (PTH)-driven bone anabolism is predicated by cell coupling between osteoclasts and osteoblasts. This finding is evidenced by animal models featuring PTH stimulating preosteoblasts and osteoblastic bone formation in normal mice, without facilitating osteoblasts in forming new bone in the absence of bone-resorbing osteoclasts in c-fos−/− mice. 2
We previously reported that frequent PTH administration results in remodeling-based bone formation characterized by numerous thin metaphyseal trabeculae surrounded by thick preosteoblastic cell layers with several osteoclasts. 3 Conversely, low frequent PTH administration induced remodeling-based and modeling-based bone formation with relatively thick trabeculae. Therefore, high PTH administration frequency may stimulate cell coupling of osteoclasts and osteoblasts, accelerating the remodeling-based bone formation of metaphyseal trabeculae.
Contrasting metaphyseal trabeculae, Burr’s team discovered that daily hPTH (1–34) administration triggered intracortical remodeling in the midshaft of the rabbit tibia, increasing cortical porosity. 4 Subsequently, these results raise concerns that intermittent PTH treatment for osteoporosis in adult female cynomolgus monkeys may compromise cortical bone strength due to porosity induction. 5 Clinical studies have reported cortical porosity following daily teriparatide administration, corroborating these findings.6,7
The specific site of cortical bone susceptibility to teriparatide-induced porosity has been identified in the region close to the endocortical surface.5,8 Furthermore, PTH administration frequency and dosage regimens have been implicated in cortical porosity. Several investigators explored the effects of intermittent teriparatide administration, discovering that higher daily doses increased cortical porosity in rabbits, as opposed to weekly dosing.9,10 Utilizing high resolution peripheral quantitative computed tomography (HR-pQCT), Hansen et al. 6 reported that a regimen of PTH administration had deleterious effects on cortical bone microarchitecture and strength in postmenopausal women with osteoporosis.
Many researchers have used mouse models to inhibit or overexpress osteocyte-derived sclerostin, a Wnt inhibitor, postulating that cell coupling between osteoclasts, osteoblasts, and osteocytes mediates PTH-driven anabolic effects in spongy bone and porosity in cortical bone.11–16 Subsequent studies have revealed the expression of the PTH receptor in osteocytes.12–16 Notably, blocking sclerostin in the bone anabolism with sclerostin antibodies has resulted in the development of romosozumab, a drug that can induce modeling-based bone formation in osteoporotic patients.17,18 Therefore, sclerostin secreted by osteocytes may be involved in modeling-based bone formation rather than remodeling-based bone formation. Nonetheless, osteocytes may influence PTH-driven cortical porosity through mechanisms beyond sclerostin.
Meanwhile, we have previously highlighted an increase in endomucin high-positive bone-specific blood vessels, surrounded by α-smooth muscle actin (αSMA)-positive cells after PTH administration. αSMA is recognized for its expressed perivascular and undifferentiated mesenchymal cells, suggesting interactions with vascular endothelial cells. 19 These αSMA-positive cells extend out from blood vessels and express alkaline phosphatase (ALP) and c-kit, establishing their potential to differentiate into osteogenic and vascular endothelial/perivascular cells.20,21 Thus, PTH affects osteoclasts, osteoblasts, and other cell types, including osteocytes and blood vessels. This characteristic may be pivotal in not only bone anabolism of spongy bone but also cortical porosity.
Taken together, it is imperative to consider osteoclasts, osteoblasts, and the involvement of osteocytic network and bone-specific blood vessels to elucidate the cellular mechanism behind cortical porosity. In addition, the histological degree of the cortical porosity must be different from the metaphyses to the diaphysis of long bones. This study identified three distinct regions for cortical porosity observation: zonation of regions close to the growth plate, intermediate regions between metaphyses and diaphysis, and regions toward diaphysis. Therefore, we aimed to histologically investigate the spatiotemporal distribution of osteoblasts, osteoclasts, and bone-specific blood vessels in these three regions throughout PTH treatment. In addition, we sought to elucidate the cellular interactions and inducing factors that contribute to cortical bone porosity through histological analysis.
Materials and Methods
Animals
Six-week-old male C57BL/6J mice (n=60, Japan CLEA, Tokyo, Japan) were handled per Japanese Act on the Welfare and Management of Animals and Hokkaido University’s guidelines for animal care and research use (approved study protocol no. 20-0019). The mice were divided into two groups: a control group receiving vehicle only (control group, 0.9% saline, n=6) and a PTH group receiving hPTH 1–34 (Sigma-Aldrich Co., LLC., St. Louis, MO) at a dose of 40 µg/kg/day, administered four times per day (PTH group, n=6 for 1, 3, 7, 14, 21 days). The dosage and frequency of PTH administration were decided based on the results of a previous study. 3
Specimen Preparation
The left hind legs of mice were ligated at the femoral region under anesthesia using an intraperitoneal injection of an anesthetic agent combination (0.3 mg/kg of medetomidine, 4.0 mg/kg of midazolam, and 5.0 mg/kg of butorphanol). Left tibiae were extracted for subsequent RNA sequencing and real-time PCR analyses. Femora were fixed with 4% paraformaldehyde in a 0.1 M phosphate buffer (pH 7.4) via the left ventricle. The right femora were removed and immersed in the same fixative for 24 hr. After obtaining micro-CT images, the femora underwent decalcification with 10% ethylenediaminetetraacetic disodium salt (EDTA-2Na) for 2 months at 4C before paraffin embedding. Sagittal sections, 5 µm thick, were cut parallel to the longitudinal axis of the bone. Left femora were longitudinally divided. One piece was decalcified with a 4.13% EDTA-2NA solution before epoxy resin embedding. The other was post-fixed with 1% osmium tetraoxide in a 0.1 M cacodylate buffer for 4 hr at 4C, dehydrated in ascending acetone solutions, and embedded in epoxy resin (Epon 812, Taab, Berkshire, UK). Histochemical staining sections were photographed using a Nikon Eclipse E800 microscope (Nikon Instruments Inc., Tokyo, Japan), and light microscopic images were captured with a digital camera (Nikon DXM1200C, Nikon Instruments Inc.).
Micro-CT Analysis
Micro-CT images of the right femora’s sagittal section, spanning from the distal epiphysis to 1.6 cm distally, were obtained using a micro-CT (CosmoScan Fx, Rigaku Corporation, Tokyo, Japan) with a 90 kV tube voltage and 88 µA tube current (Field of view (FOV): 10 mm) following our recent report. 22
Selection of Different Regions of Interest (ROIs) in the Cortical Bone
Posterior femoral cortical bones were categorized into three ROIs: the metaphyseal region extending from 0.95 mm proximal to the growth plate to 0.7 mm toward the distal region (zone 1), the region from 1.4 to 2.1 mm (zone 2), and the diaphyseal region from 2.1 to 2.8 mm (zone 3; Fig. 1A).
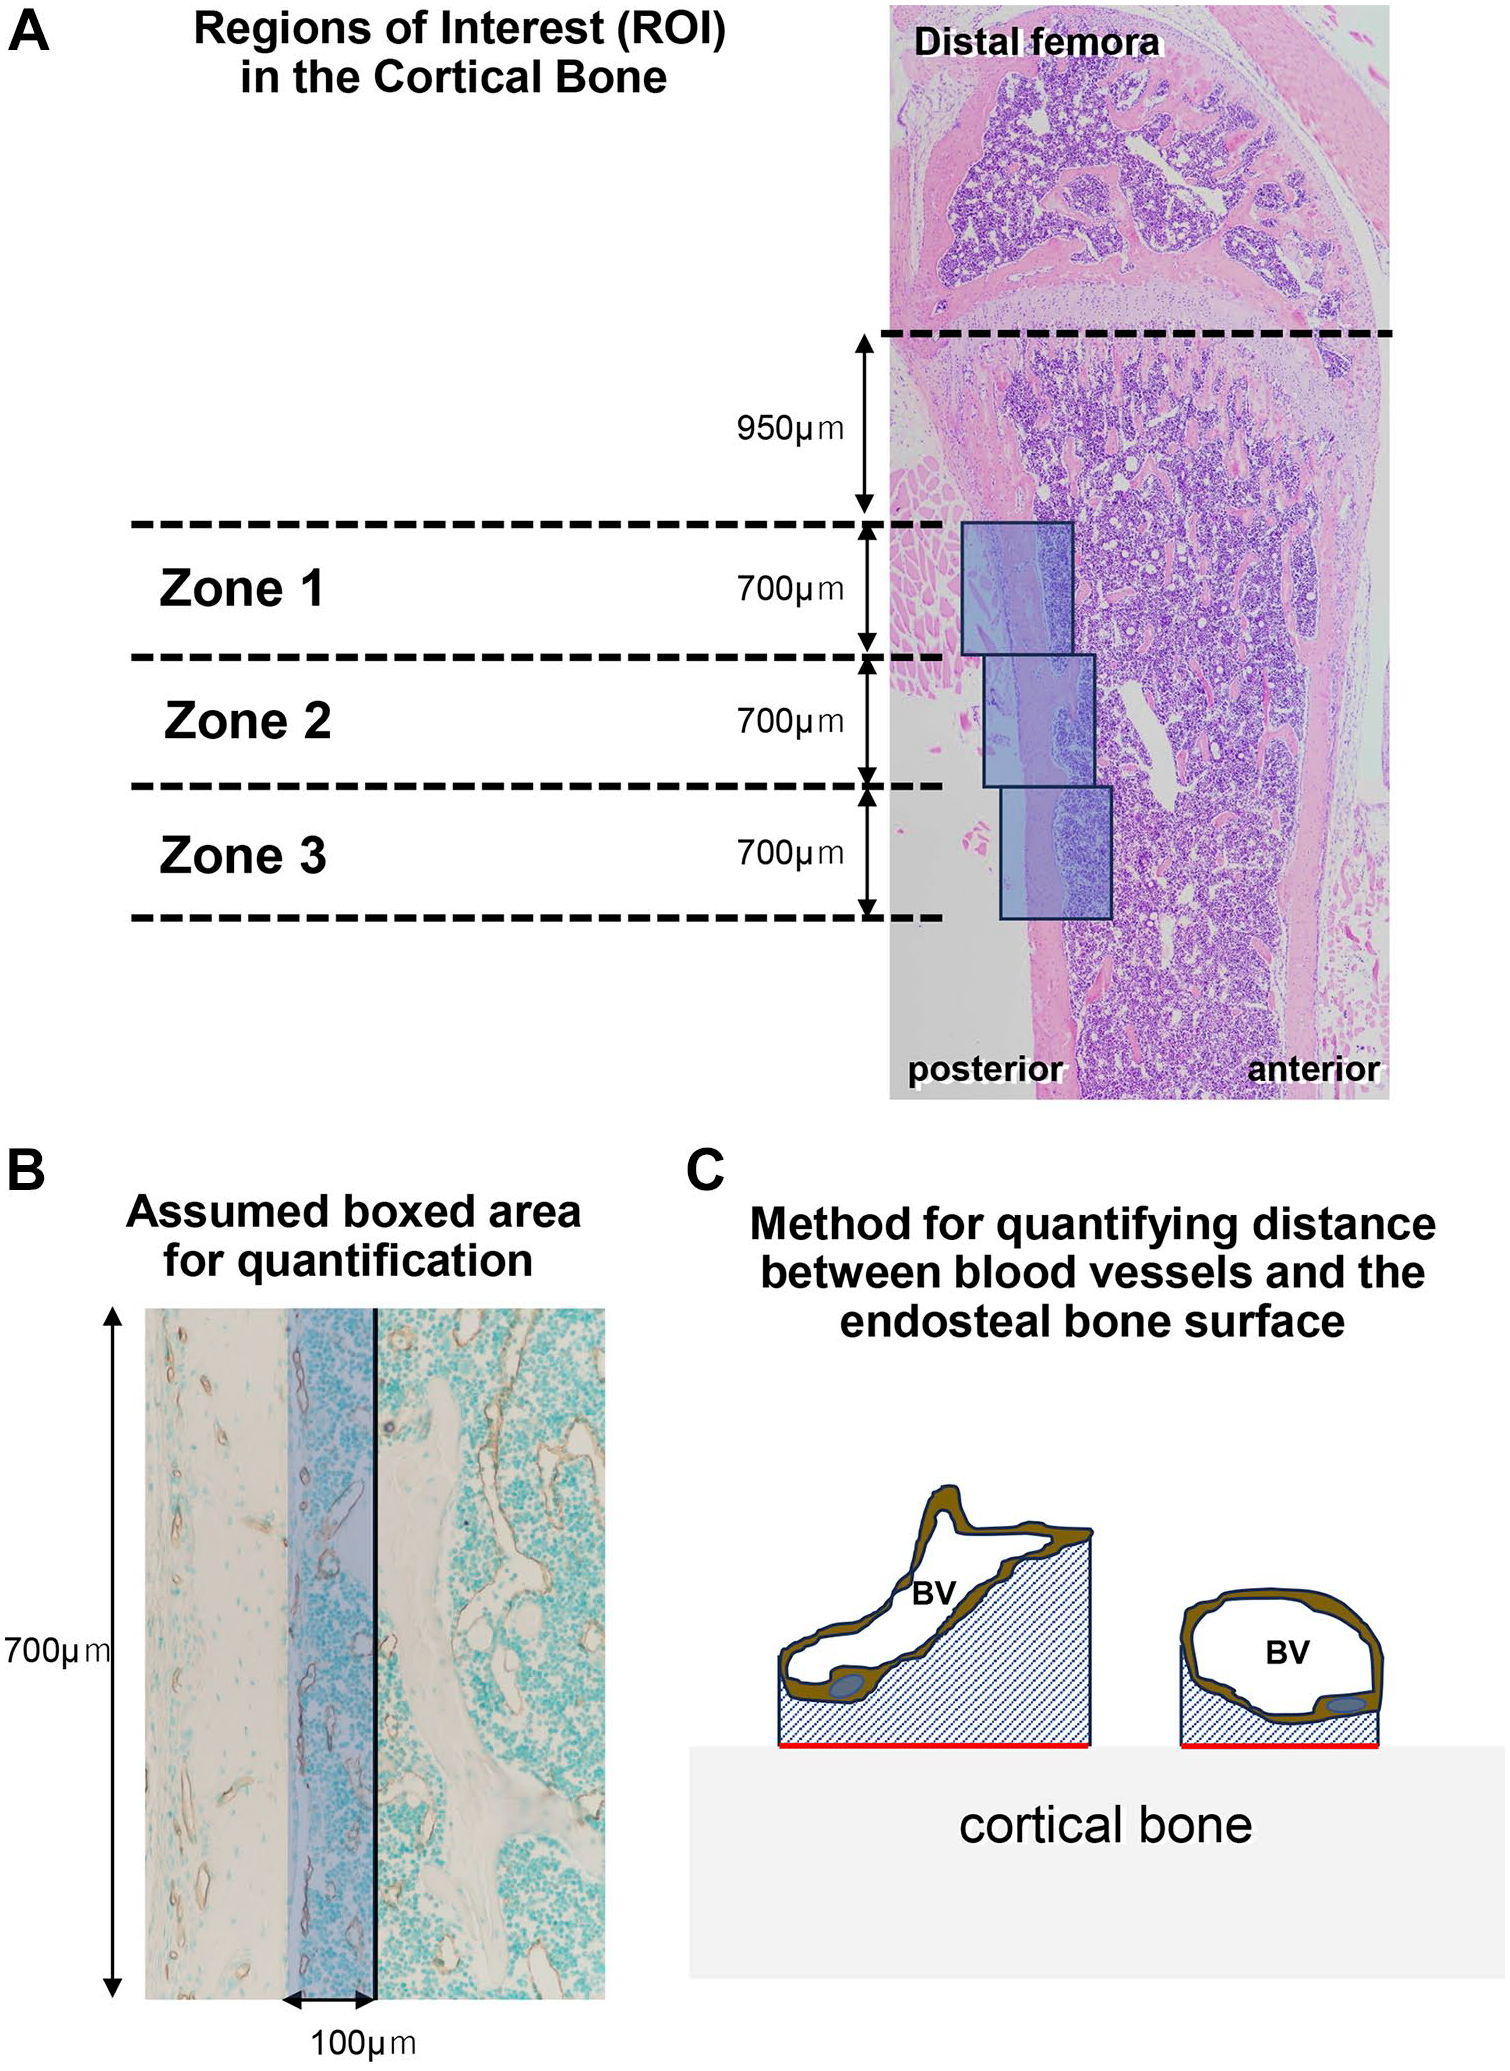
Region of interest (ROI) in cortical bone and quantification. ROI images named zone 1, zone 2, and zone 3 on the posterior femoral cortical bones are denoted in blue boxes (Panel A). Panel B displays the assumed boxed areas for measuring the distance between blood vessels (BV) and endosteal bone surfaces and osteoclast numbers. Panel C illustrates the quantification method for the distance between BV and the endosteal bone surface. The distance between BV and the endosteal bone surface is calculated by dividing the surrounding area between endomucin-positive BV and the cortical bone surface (diagonal blue-lined area) by the cortical bone surface length (red line).
Immunohistochemistry for αSMA, Vascular Cell Adhesion Molecule-1 (VCAM1), Sclerostin, Dickkopf1 (Dkk1), and Plasmalemma Vesicle-associated Protein (PLVAP)
Dewaxed paraffin sections were processed for αSMA, VCAM1, sclerostin, Dkk1, and PLVAP, as previously described. 23 In brief, the sections were immersed in 0.3% H2O2 in phosphate-buffered saline (PBS) for 30 min to block endogenous peroxidase. Next, 1% bovine serum albumin (Serologicals Proteins Inc., Kankakee, IL) in PBS (1% BSA-PBS) was applied to the sections for 20 min to minimize nonspecific binding. The sections were incubated with mouse monoclonal antiserum to αSMA (MAB1420, R&G systems Inc., Minneapolis, MN) at a 1:600 dilution, goat polyclonal antiserum against VCAM1 (AF643, R&G systems Inc.,) at a 1:100 dilution, goat polyclonal antiserum against sclerostin (AF1589, R&G systems Inc.,) at a 1:50 dilution, goat polyclonal antiserum against Dkk1 (AF1765, R&G systems Inc.,) at a 1:100 dilution, or rat polyclonal antiserum against PLVAP (ab27853, Abcam PLC, Cambridge, UK) at a 1:100 dilution at room temperature (RT) for 2 hr. The sections reacted with the primary antiserum against αSMA were incubated with horseradish peroxidase (HRP)-conjugated rabbit anti-mouse IgG (40267F, Thermo Fisher Scientific Inc., Waltham, MA) at a dilution of 1:100 for 1 hr at RT. The sections reacted with antisera to VCAM1, sclerostin, Dkk1, or PLVAP were incubated with HRP-conjugated rabbit anti-goat IgG (40267F, American Qualex International, Inc., Clemente, CA) or HRP-conjugated rabbit anti-rat IgG (A18921, Thermo Fisher Scientific Inc.). We have optimized all antibody dilutions specifically for use in this study. Diaminobenzidine (DAB) tetrahydrochloride was used as a substrate to visualize all HRP-conjugated immunoreactions. All sections were counterstained with methyl green and examined under a light microscope. Negative control experiments utilized normal mouse, goat, and rat sera as primary antibodies instead of antisera against the specific antigens (data not shown).
Double Detection of Endomucin/TRAP, Endomucin/ALP, PDGFbb/Endomucin, and αSMA/Endomucin
For endomucin/TRAP and endomucin/ALP double detection, the sections were treated with polyclonal rat IgG against mouse endomucin (sc-65495, Santa Cruz Biotechnology, Inc., Dallas, TX) and subsequent HRP-conjugated rabbit anti-rat IgG for DAB visualization, as previously described. For TRAP detection, immunostained sections were incubated in a mixture of 2.5 mg of naphthol AS-BI phosphate (Sigma-Aldrich Co., LLC.), 18 mg of Red Violet LB salt (Sigma-Aldrich Co., LLC.), and 100 mM L(+) tartaric acid (0.76 g, Nacalai Tesque, Inc., Kyoto, Japan) diluted in 30 ml of a 0.1 M sodium acetate buffer (pH 5.0) for 15 min at 37C, as reported previously. 24 Similar to ALP immunoreactivity detection, sections reacted with the endomucin antibody were incubated with rabbit sera and tissue nonspecific ALP25,26 at RT for 2 hr, then reacted with ALP-conjugated goat anti-rabbit IgG (111-055-003, Jackson Immune Research Laboratories Inc., West Grove, PA). ALP histochemistry was performed as described by Zhao et al. 20 In short, sections were incubated in a mixture of 2.5 mg of naphthol AS-BI phosphate (Sigma-Aldrich Co., LLC.) and 18 mg of Fast Blue BB salt (Sigma-Aldrich Co., LLC.) diluted in 30 ml of a 0.1 M Tris-HCl buffer (pH 8.5) for 15 min at 37C. Regarding PDGFbb/endomucin and αSMA/endomucin double staining, the sections were incubated with polyclonal rabbit IgG against mouse PDGFbb (ab23914, Abcam PLC.,) at a 1:300 dilution or mouse monoclonal antiserum to αSMA (MAB1420, R&G systems Inc.,) at a 1:600 dilution at RT for 2 hr. Next, sections were reacted with HRP-conjugated swine anti-rabbit IgG (P0399, Agilent Technologies Inc., Santa Clara, CA) or HRP-conjugated rabbit anti-mouse IgG (61-6520, Thermo Fisher Scientific Inc.) before DAB visualization. Treated sections were incubated with polyclonal rat antibody to endomucin (Santa Cruz Biotechnology, Inc.) and then with ALP-conjugated goat anti-rat IgG (112-055-003, Jackson Immune Research Laboratories Inc.). ALP enzyme reaction for visualizing endomucin immunoreactivity was performed, as previously mentioned. We have optimized all antibody dilutions specifically for use in this study. In addition to those already presented, negative control experiments involved the use of normal rabbit and rat sera as primary antibodies instead of antisera against the specific antigens (data not shown).
Von Kossa Staining
Epoxy resin sections from undecalcified specimens were incubated with an aqueous solution of silver nitrate until the dark brown/black staining of bone tissue was visible under a light microscope. 27
Transmission Electron Microscopic (TEM) Studies
Semi-thin sections of epoxy resin-embedded specimens were cut with an ultramicrotome (Sorvall MT-5000; Ivan Sorvall, Inc., Norwalk, CT), stained with toluidine blue, and observed with a Nikon Eclipse E800 microscope (Nikon Instruments Inc.). Ultra-thin sections obtained with an ultramicrotome were stained with uranyl acetate and lead citrate. These specimens were subjected to TEM observation (Hitachi H-7800, Hitachi Co., Tokyo, Japan) at 80 kV.
Quantification of the Distance Between Blood Vessels and Endosteal Bone Surface and Osteoclast Numbers in Assumed Bone Areas Posterior
Osteoclast numbers were counted in assumed boxed areas 700 µm in length and 100 µm in width (Fig. 1B). We regarded TRAP-positive cells with more than two nuclei as osteoclasts. As depicted in Fig. 1C, the distance between the cortical bone surface and endomucin-positive blood vessels in each zone was calculated as the index obtained by dividing the area encompassing endomucin-positive blood vessels and the cortical bone surface by the cortical bone surface length.
RNA Sequencing Analysis
The total RNA obtained from the left tibiae of the control and PTH groups at 7 days (1 week) was employed for RNA sequencing analysis (n=3 per group). The base sequences of the library-adjusted sample were collected (acquired read length: 150 bp × two paired ends) using the next-generation sequencer NovaSeq 6000 (Illumina, Inc., San Diego, CA), the library adjustment reagents NEBNext Poly(A) mRNA Magnetic Isolation Module (E7490; New England Biolabs Japan Inc.), and NEBNext Ultra TMII Directional RNA Library Prep Kit (E7760; New England Biolabs Japan Inc.). The sequence reads were trimmed using Trimmomatic v0.38 and mapped to the mouse reference genome (mm10) using HISAT2 v2.1.0. The raw reads mapped to known exon regions, fragments per kilobase of exon per million reads mapped (FRKM), and transcripts per million (TPM) were calculated using featureCounts v1.6.3 to quantify gene expression. Differentially expressed genes in the control and PTH-administered groups were extracted using DeSeq2 (v1.24.0) to create a heatmap.
The Quantitative Analysis of Gene Expression Through Reverse Transcription-Quantitative PCR
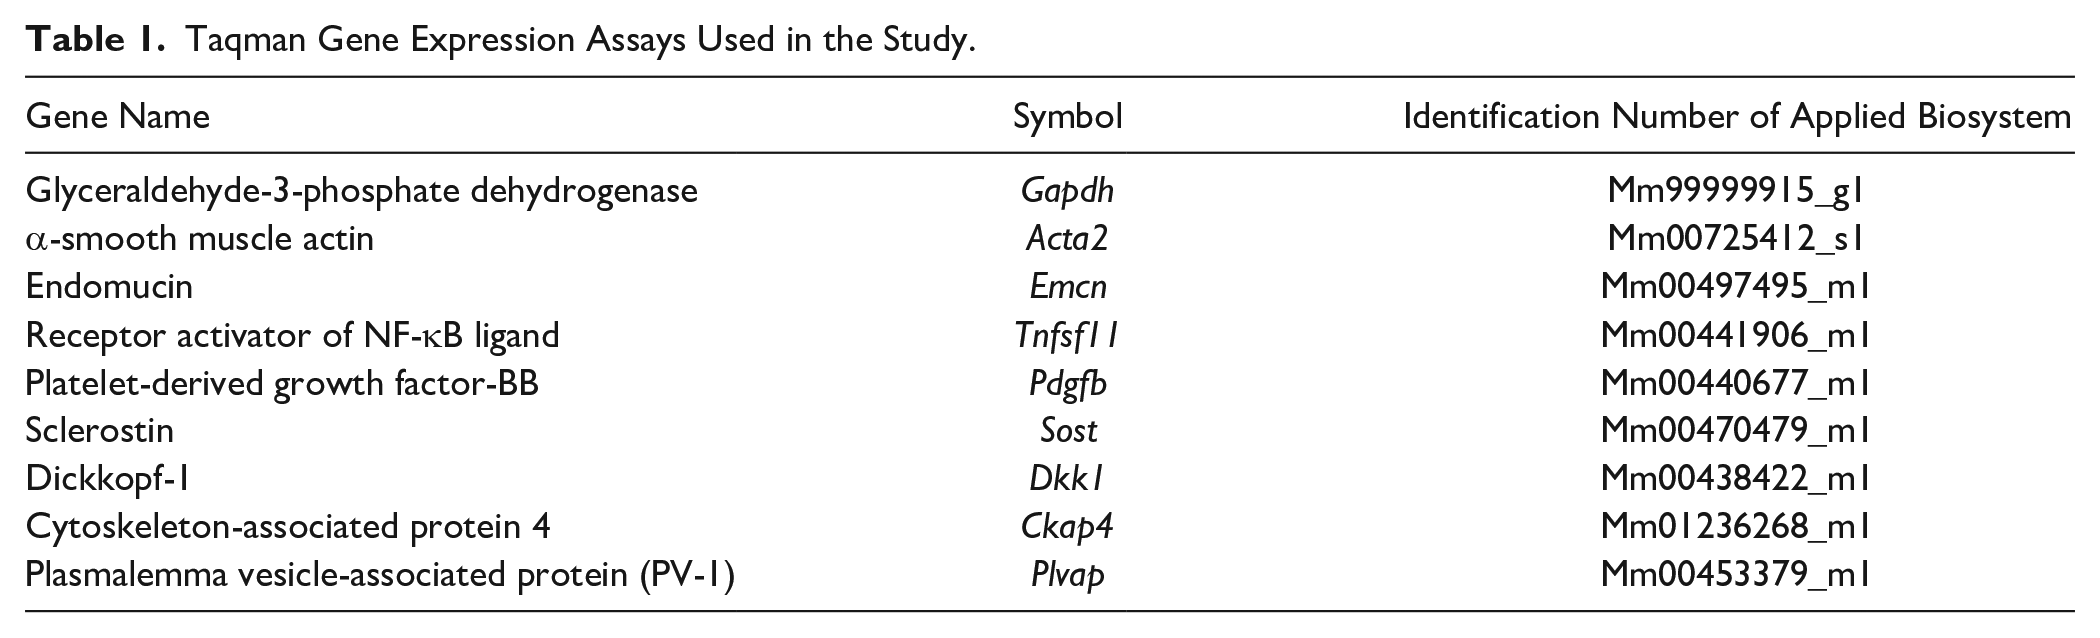
The cortical bones of the control and PTH groups were employed for real-time PCR on 7 days (1 week) and frozen in liquid nitrogen. The samples were homogenized by adding 10 ml/g of TRIzol reagent (Life Technologies Co., Carlsbad, CA). Then, 2 ml of chloroform were added to 10 ml of TRIzol solution, and the mixture was centrifuged at 15,000 rpm for 5 min at 4C to remove small debris. The supernatant was then transferred to a new tube, which was vortexed for 15 sec after adding 2 ml of chloroform. The lysate was then transferred to a new tube and incubated for 5 min at RT. After phase separation, the aqueous phase containing the RNA was transferred to a new tube. Then, RNA was precipitated by adding 5 ml of isopropyl alcohol per 10 ml of TRIzol reagent. After 10 min of incubation at RT, the mixture was centrifuged for 60 min at 15,000 rpm at 4C. The resulting RNA pellet was washed with 1 ml of 75% ethanol and briefly air-dried. The RNA was then dissolved in 30 μl Diethylpyrocarbonate (DEPC)-treated water. First-stranded cDNA was synthesized from the obtained total RNA with the SuperScript VlLO cDNA Synthesis Kit (Life Technologies Co.). The expression levels of various genes relative to those of Gapdh were comparatively quantified via the ΔΔCt method in a quantitative PCR System (StepOne; Thermo Fisher Scientific Inc.) to determine Acta2 (αSma), Emcn, Tnfsf11 (Rankl), Pdgfb, Sost, Dkk1, Ckap4, and Plvap expression. The TaqMan probes (Applied Biosystems, Waltham, MA) used for the analysis are shown in Table 1.
Taqman Gene Expression Assays Used in the Study.
Statistical Analysis
All statistical analyses were assessed through one-way ANOVA followed by Student’s t-test with Bellcurve for Excel v4.04 (Social Survey Research Information Co., Ltd. Tokyo, Japan). All values are presented as the mean ± SD. Values of p<0.05 were considered significant.
Results
Micro-CT and Histological Images of PTH-induced Cortical Porosity
Under 40 µg/kg/day of hPTH (1–34) four times a day, micro-CT images of mouse femora chronologically demonstrated a marked increase in the trabecular bone beneath the growth plate and the cortical bone transformation into a porous, trabecular bone-like structure (Fig. 2A). From 1 week after PTH administration, initial cortical bone porosity became visible (Fig. 2A, IV to VI). The sagittal view of the cortical bone on the femoral posterior side revealed the porous structure from the distal (metaphyseal) to the proximal (diaphyseal) regions as the experimental period progressed (Fig. 2A, I to Ⅻ). When observed horizontally, these pores formed the endosteal side toward the mid-region of the cortical bone (Fig. 2A, i to vi). Consistent with the micro-CT images, histological sections indicated a chronological increase in trabecular bone volume and porous structure in PTH-administered femora (Fig. 2B). Thus, PTH-induced cortical porosity appeared chronologically from metaphyseal to diaphyseal regions in sagittal sections and from the endosteal to mid-region in horizontal sections.
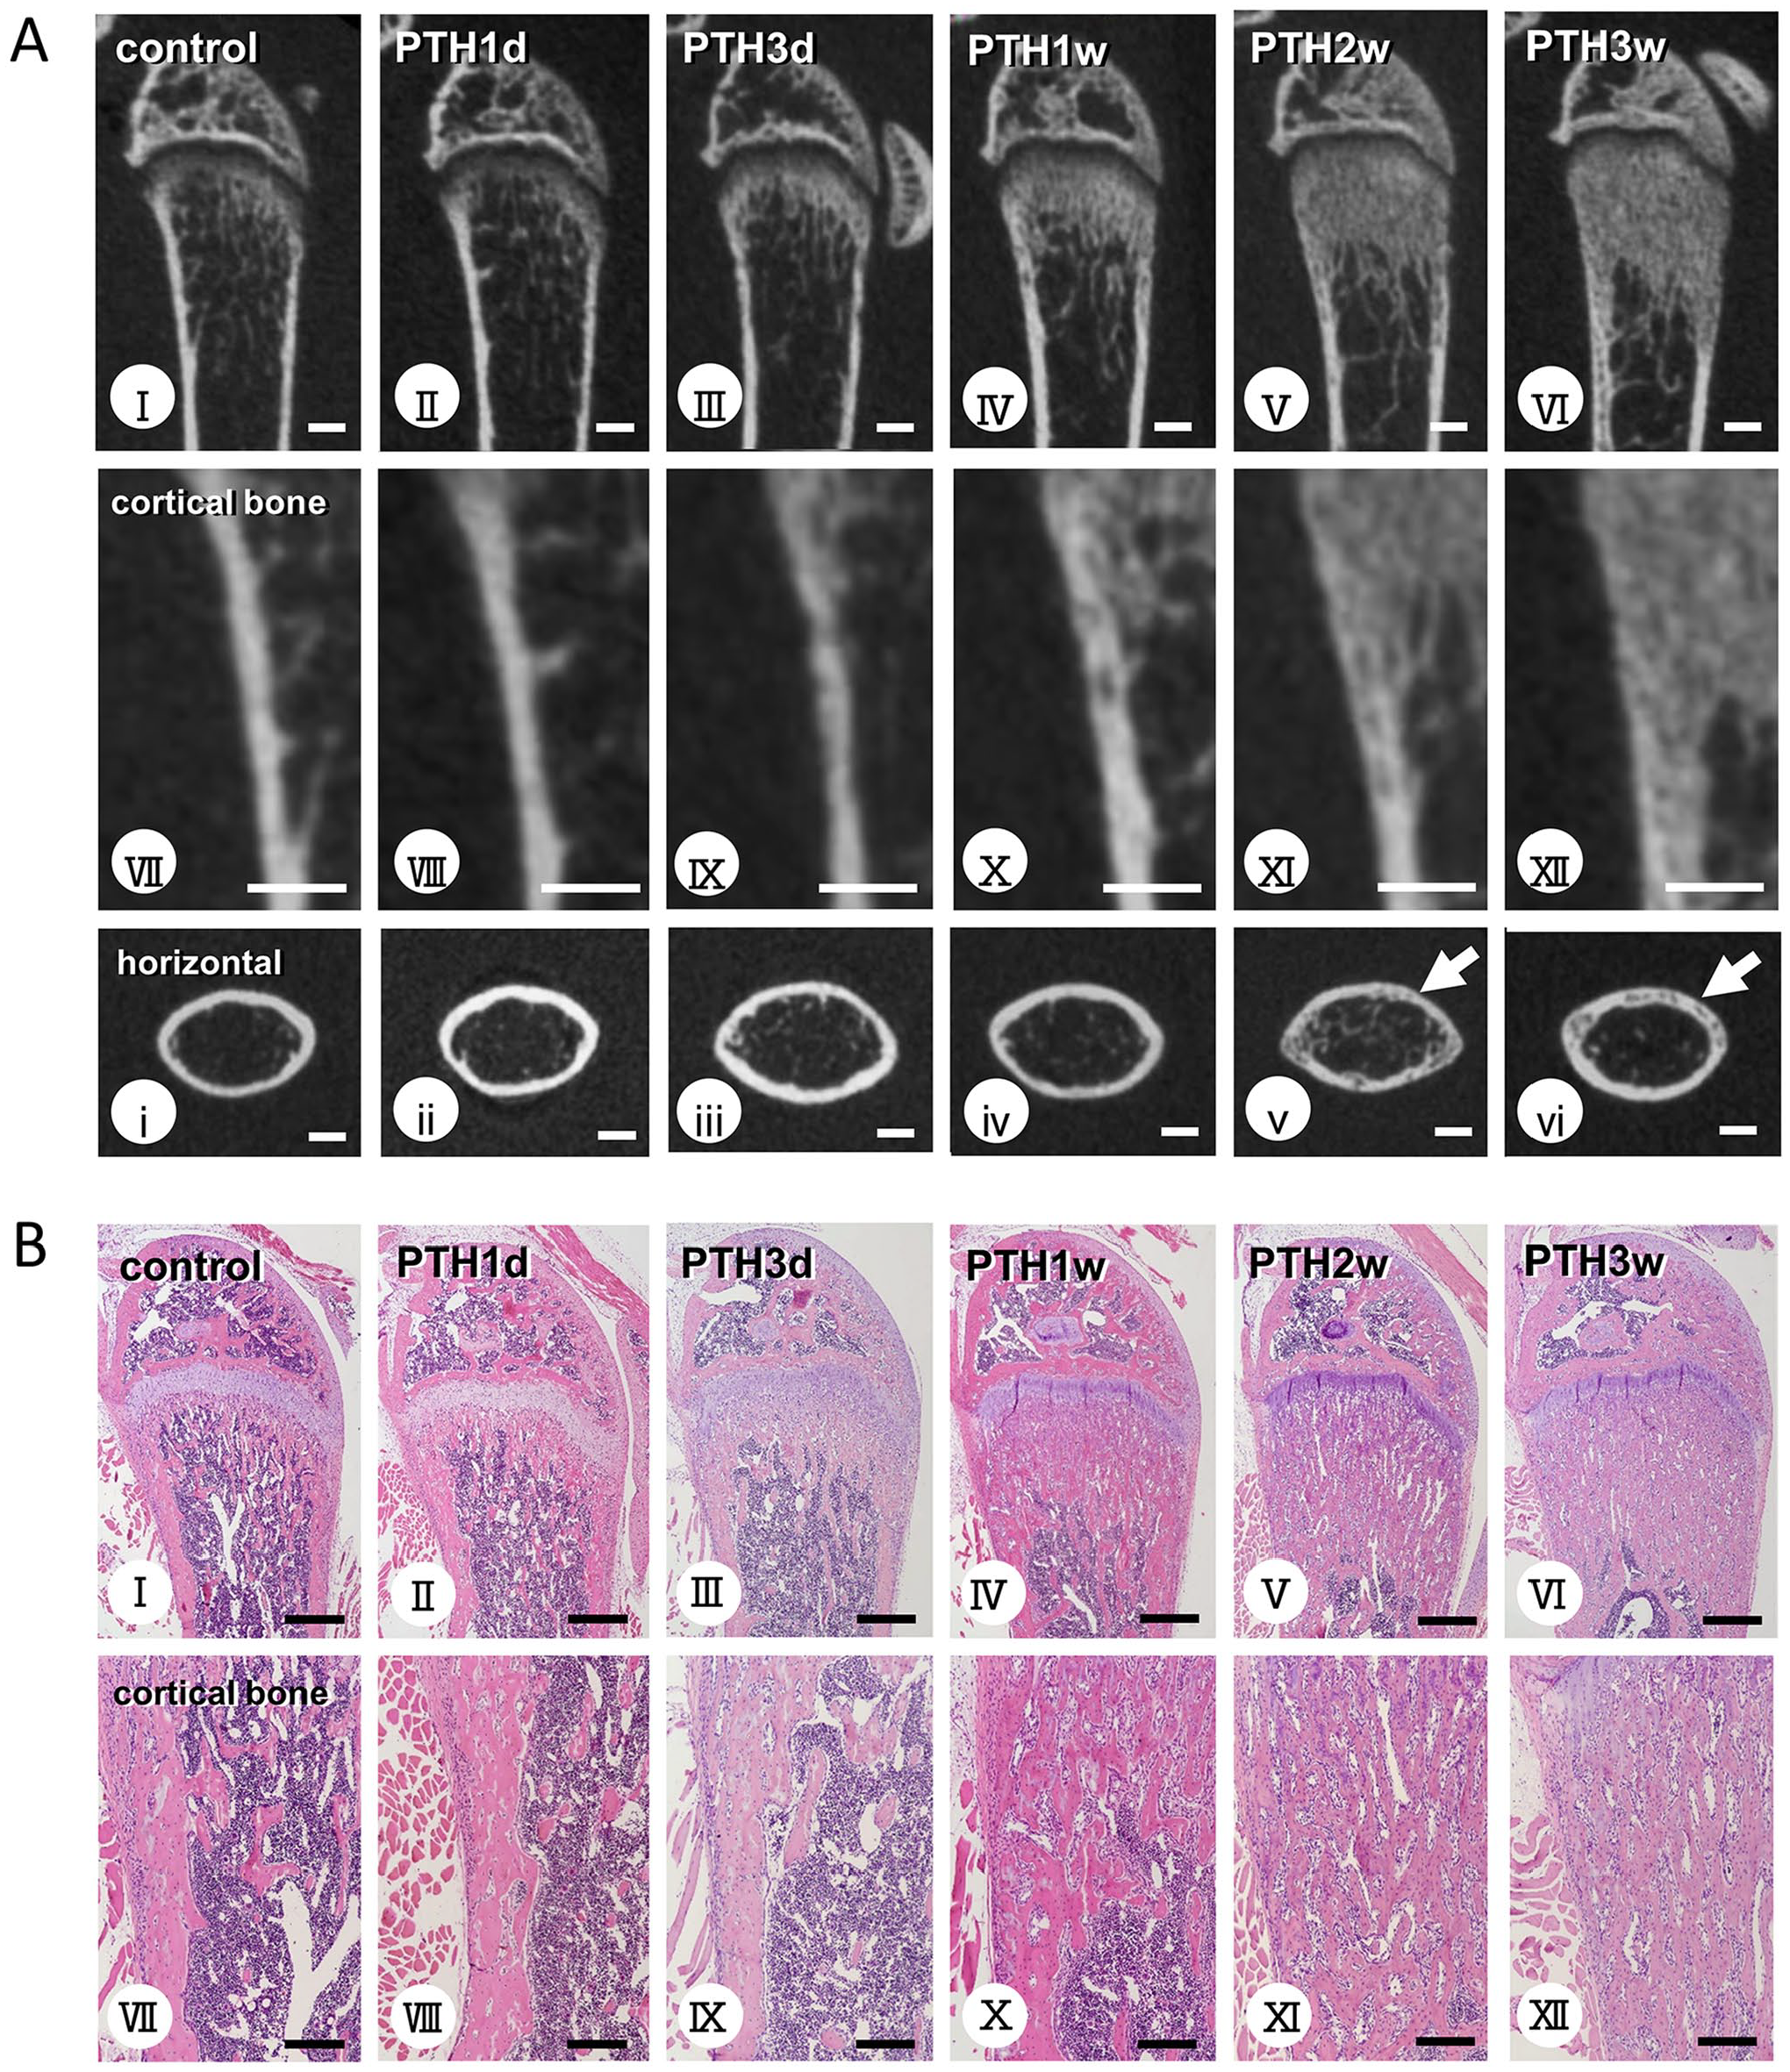
Micro-CT and histological images obtained from the femoral cortical bone in control and human parathyroid hormone (hPTH 1–34)-administered mice. Micro-CT images of the femora in control and PTH-administered mice (Panel A). H&E staining of the femora in control and PTH-administered mice (Panel B). Figs. VII–XII and i–vi reveal highly magnified cortical bone in the sagittal and horizontal sections. PTH-administered femora chronologically show abundant metaphyseal trabeculae (A: II–VI, B: II–VI) compared with control mice (A: Ⅰ, B: Ⅰ). High-magnification images of the posterior cortical bone exhibit porous or trabecular bone-like structures 1 week post-PTH administration. This porosity appears chronologically from the metaphyseal to the diaphyseal regions (A: VII–XII, B: VII–XII). Horizontal micro-CT images show that this porosity originated from the endosteal side and spread toward the mid-region of the cortical bone (A: i–vi). Bars A: I–XII, i–vi = 1 mm; bars B: I–VI = 500 µm; bars B: VII–XII = 100 µm.
Double Detection of Endomucin/TRAP and Endomucin/ALP in the Cortical Bone
Next, we examined the dual staining for the endothelial cell marker endomucin and the osteoclast marker TRAP in three distinct zones (1–3) after 1 week: the region close to the growth plate (zone 1), the intermediate regions between metaphyses and diaphysis (zone 2), and the region toward diaphysis (zone 3; Fig. 3). In zone 1, the cortical bone in control mice predominantly possessed several endomucin-positive blood vessels between the cortical bone and trabeculae, covered by ALP-reactive osteoblasts (Fig. 3D). When observing toward the diaphysis (zones 2 and 3), ALP-reactive osteoblasts were located on the smooth endosteal bone surface (Fig. 3E and F).
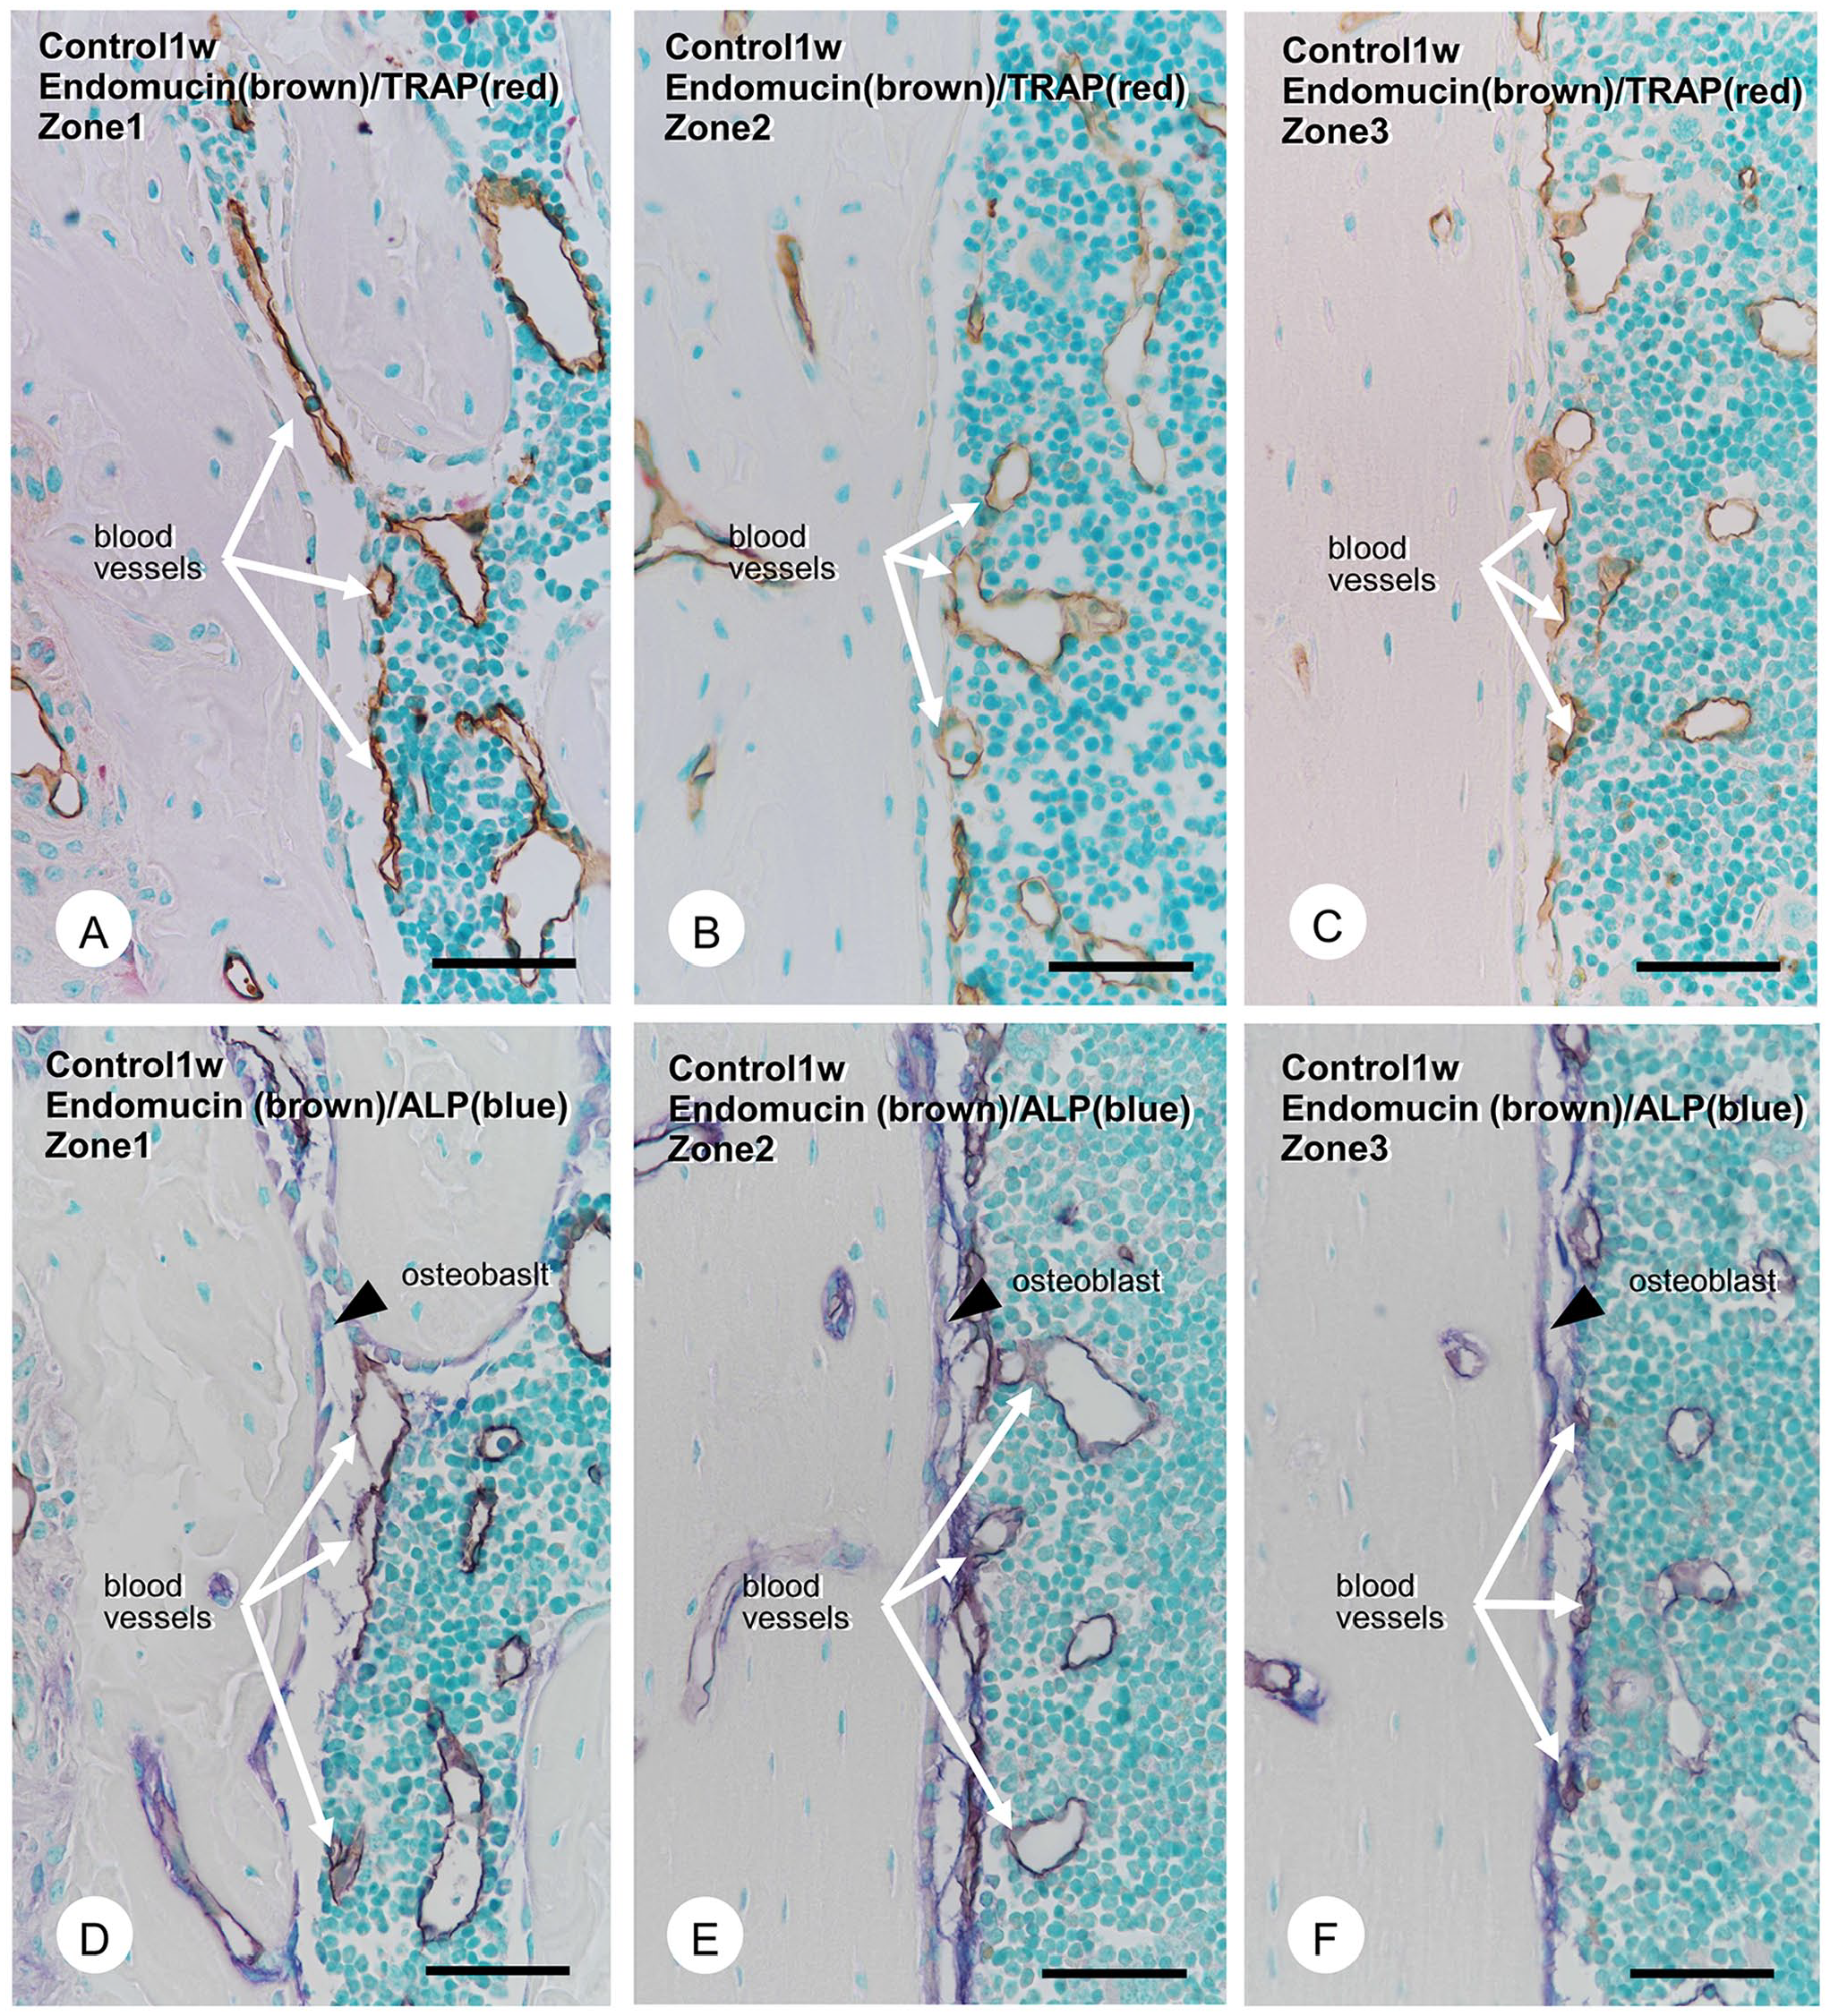
Immunolocalization of endomucin-positive blood vessels, tartrate-resistant acid phosphatase (TRAP)-positive osteoclasts, and alkaline phosphatase (ALP)-positive osteoblasts in control mice. The double detection of endomucin-positive blood vessels (brown) and TRAP-positive osteoclasts (red) in control mice (Panels A–C). The double detection of endomucin (brown) and ALP-reactive osteoblasts (blue; Panels D–F). Endomucin-positive blood vessels (brown, white arrows) far from the cortical surface and TRAP-positive osteoclasts on the cortical bone surface in all zones. In contrast, ALP-positive mature osteoblasts (blue, black arrowheads) are located on the cortical bone surface (Panels D–F). Endomucin-positive blood vessels never penetrated the ALP-reactive osteoblastic layers. Bars A–F = 50 µm.
Endomucin-positive blood vessels were close but never penetrated the ALP-reactive osteoblastic layers to reach the bone surfaces (Fig. 3E and F). There were few TRAP-positive osteoclasts on the endosteal bone surface in zones 1–3 (Fig. 3A to C). In contrast, in the PTH-administered group, zone 1 exhibited many osteoclasts and thick ALP-reactive osteoblastic layers covering the bone surface (Fig. 4A and D). In zones 2 and 3, many blood vessels with small diameters and TRAP-positive osteoclasts tended to accumulate on the rough endosteal bone surface (Fig. 4B and C). ALP-positive osteoblastic layers developed, though they were not as thick as those in zone 1 (Fig. 4E and F). Some TRAP-positive osteoclasts and endomucin-positive blood vessels invaded the cortical bone’s superficial layer (Fig. 4B and C).
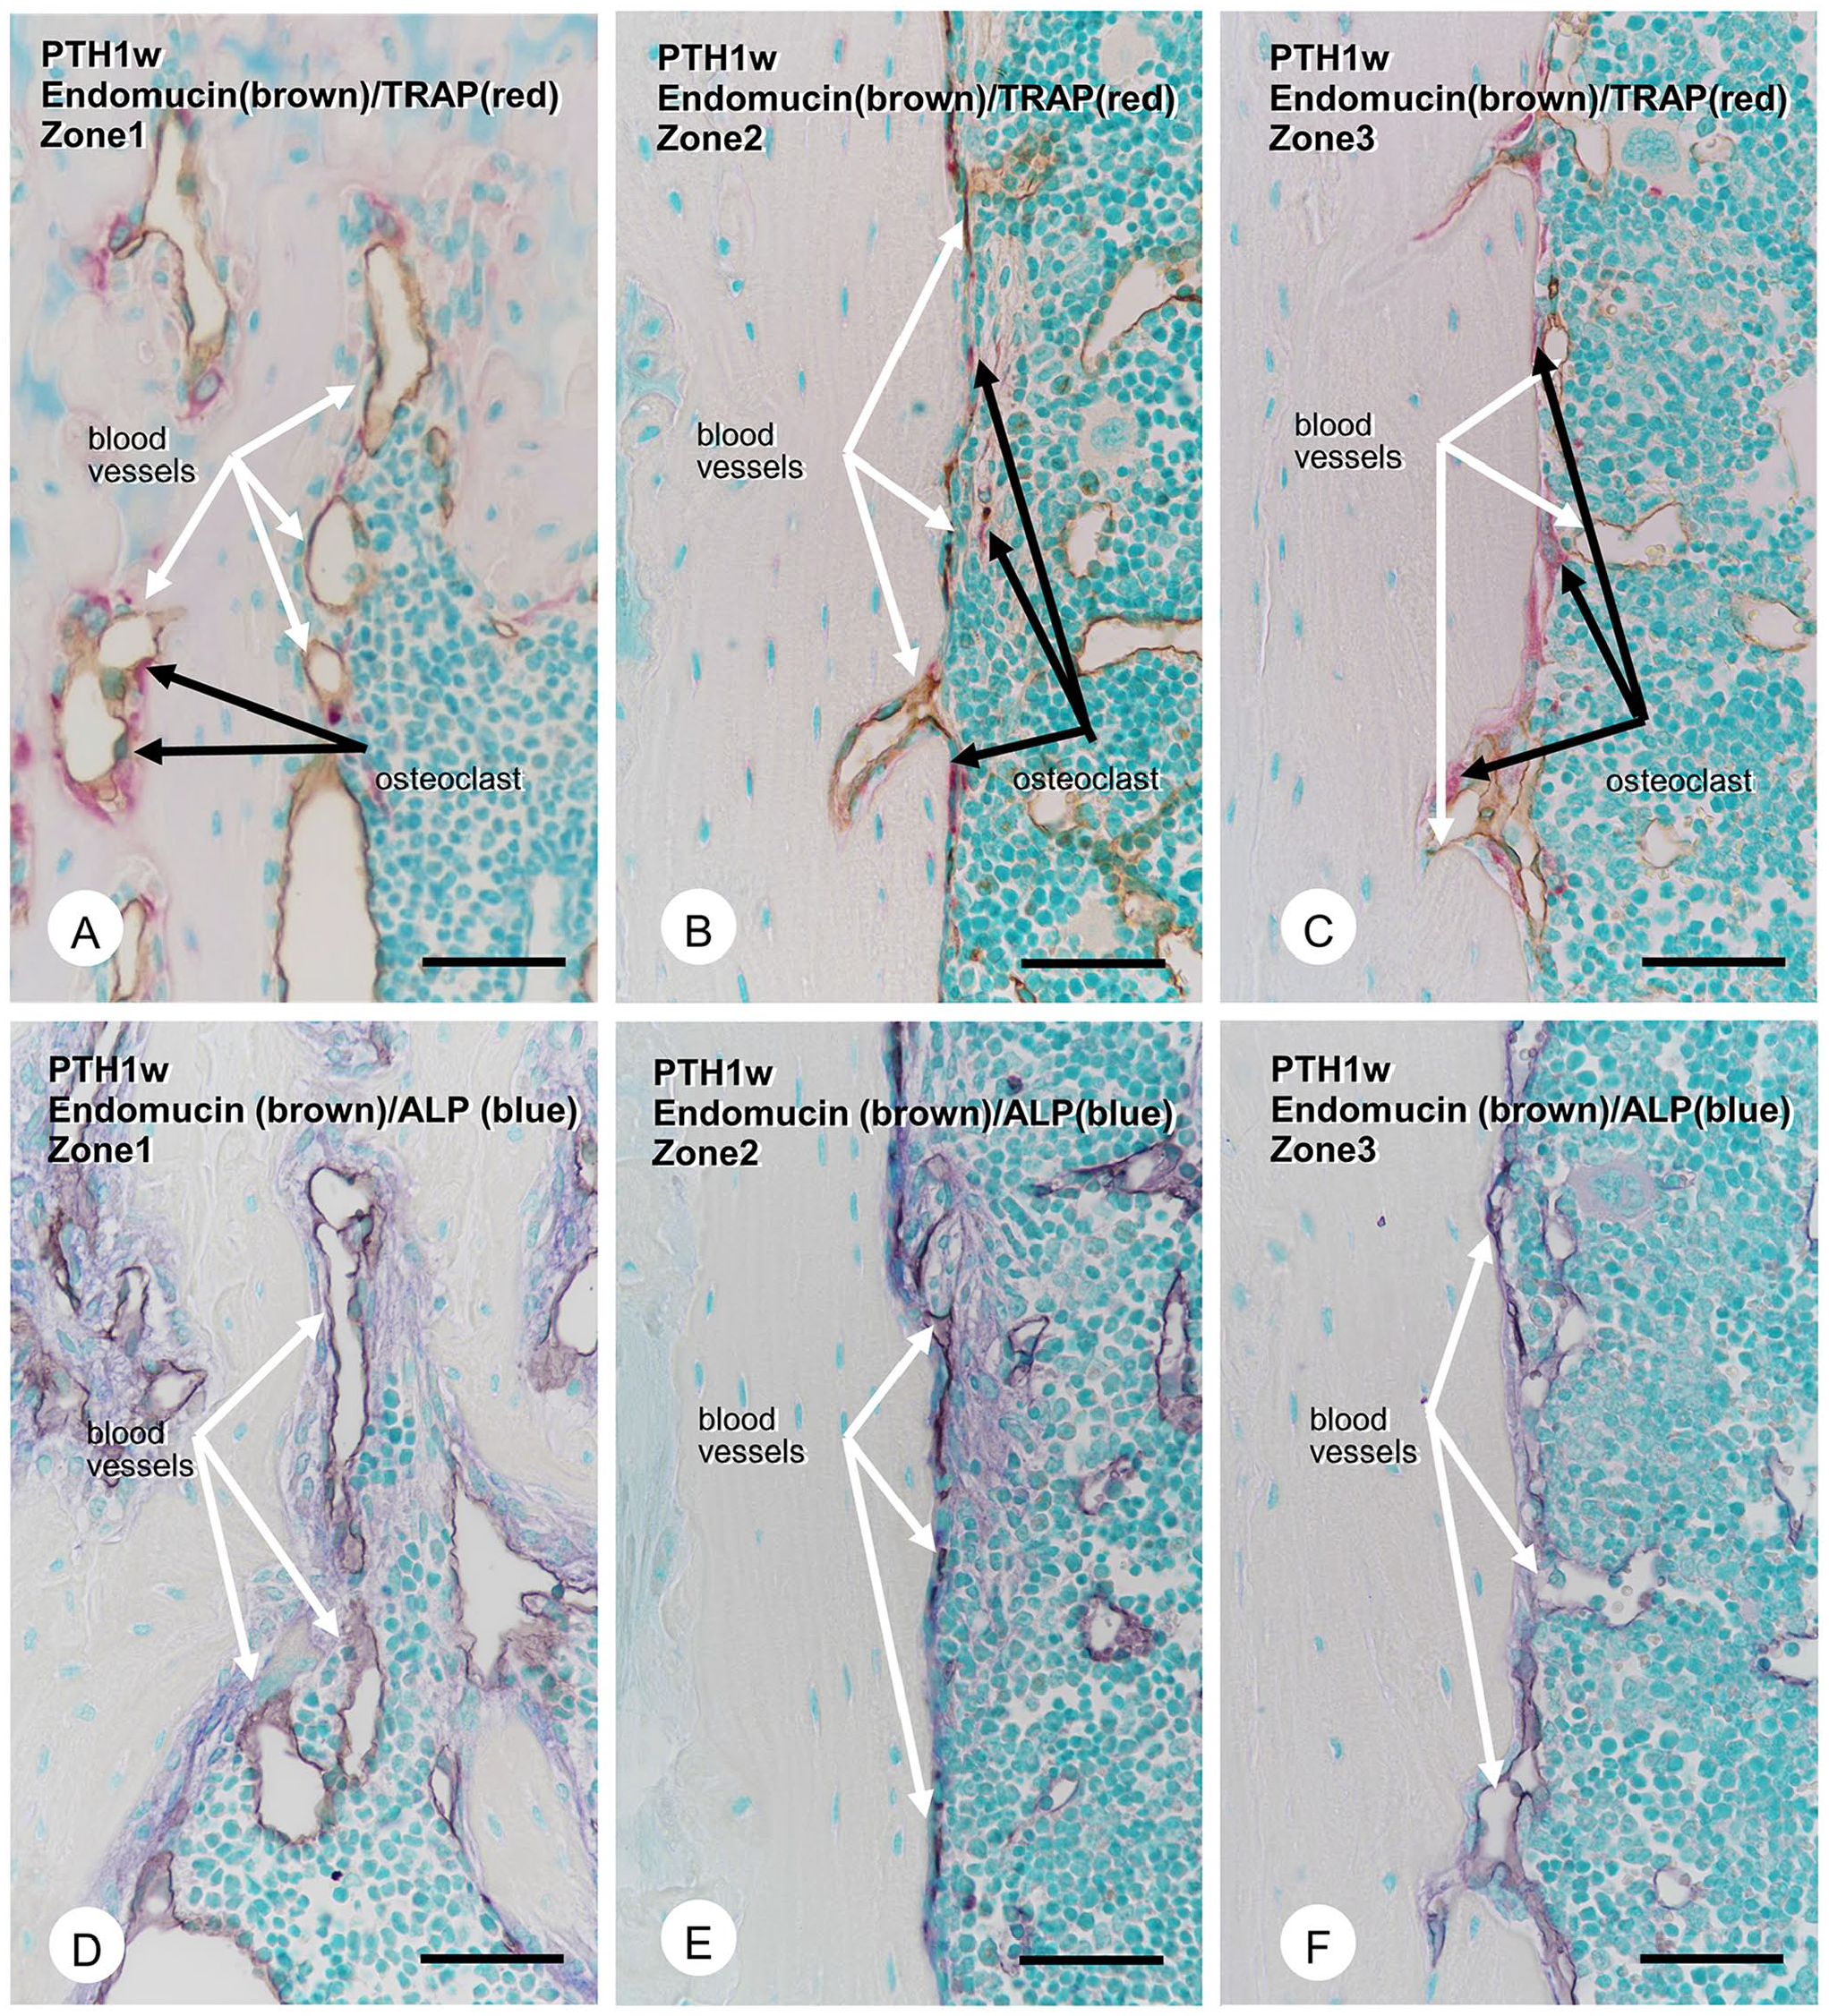
Immunolocalization of endomucin-positive blood vessels, tartrate-resistant acid phosphatase (TRAP)-positive osteoclasts, and alkaline phosphatase (ALP)-positive osteoblasts in mice 1 week after parathyroid hormone (PTH) administration. The double detection of endomucin-positive blood vessels (brown) and TRAP-positive osteoclasts (red) in PTH-administered mice after 1 week (Panels A–C). The double detection of endomucin (brown) and ALP-reactive osteoblasts (blue; Panels D–F). In zone 1, there were many TRAP-positive osteoclasts (red, black arrows, Panel A), endomucin-reactive blood vessels (brown, white arrows, Panels A and D), and a thick ALP-positive osteoblastic layer covering the cortical bone surface (Panel D). In zones 2 and 3, numerous blood vessels with small diameters were apparent on the cortical surface, partially penetrated in the cortical bone with TRAP-positive osteoclasts (Panels B and C). Unlike zone 1, ALP-positive osteoblasts in zones 2 and 3 do not form as thick cell layers (Panels E and F). Bars A–F = 50 µm.
Distance of Blood Vessels From the Endosteal Bone Surface and Osteoclast Numbers in the Assumed Boxed Areas
We measured the distance between blood vessels and the endosteal bone surface and quantified TRAP-positive osteoclast numbers in the assumed boxed areas with a 700-µm length and 100-µm width (see Fig. 1B and C, and Materials and Methods). The distance between blood vessels and the bone surfaces significantly decreased in the PTH groups compared with the control groups from 1 day to 1 week in zones 1–3 (Fig. 5A to C). In contrast, statistical analyses revealed increased osteoclast numbers in the PTH-administered groups from 1 day to 1 week relative to the control groups (Fig. 5D to F). Therefore, it seems likely that endomucin-positive blood vessels and TRAP-positive osteoclasts gradually approached the endosteal bone surfaces.
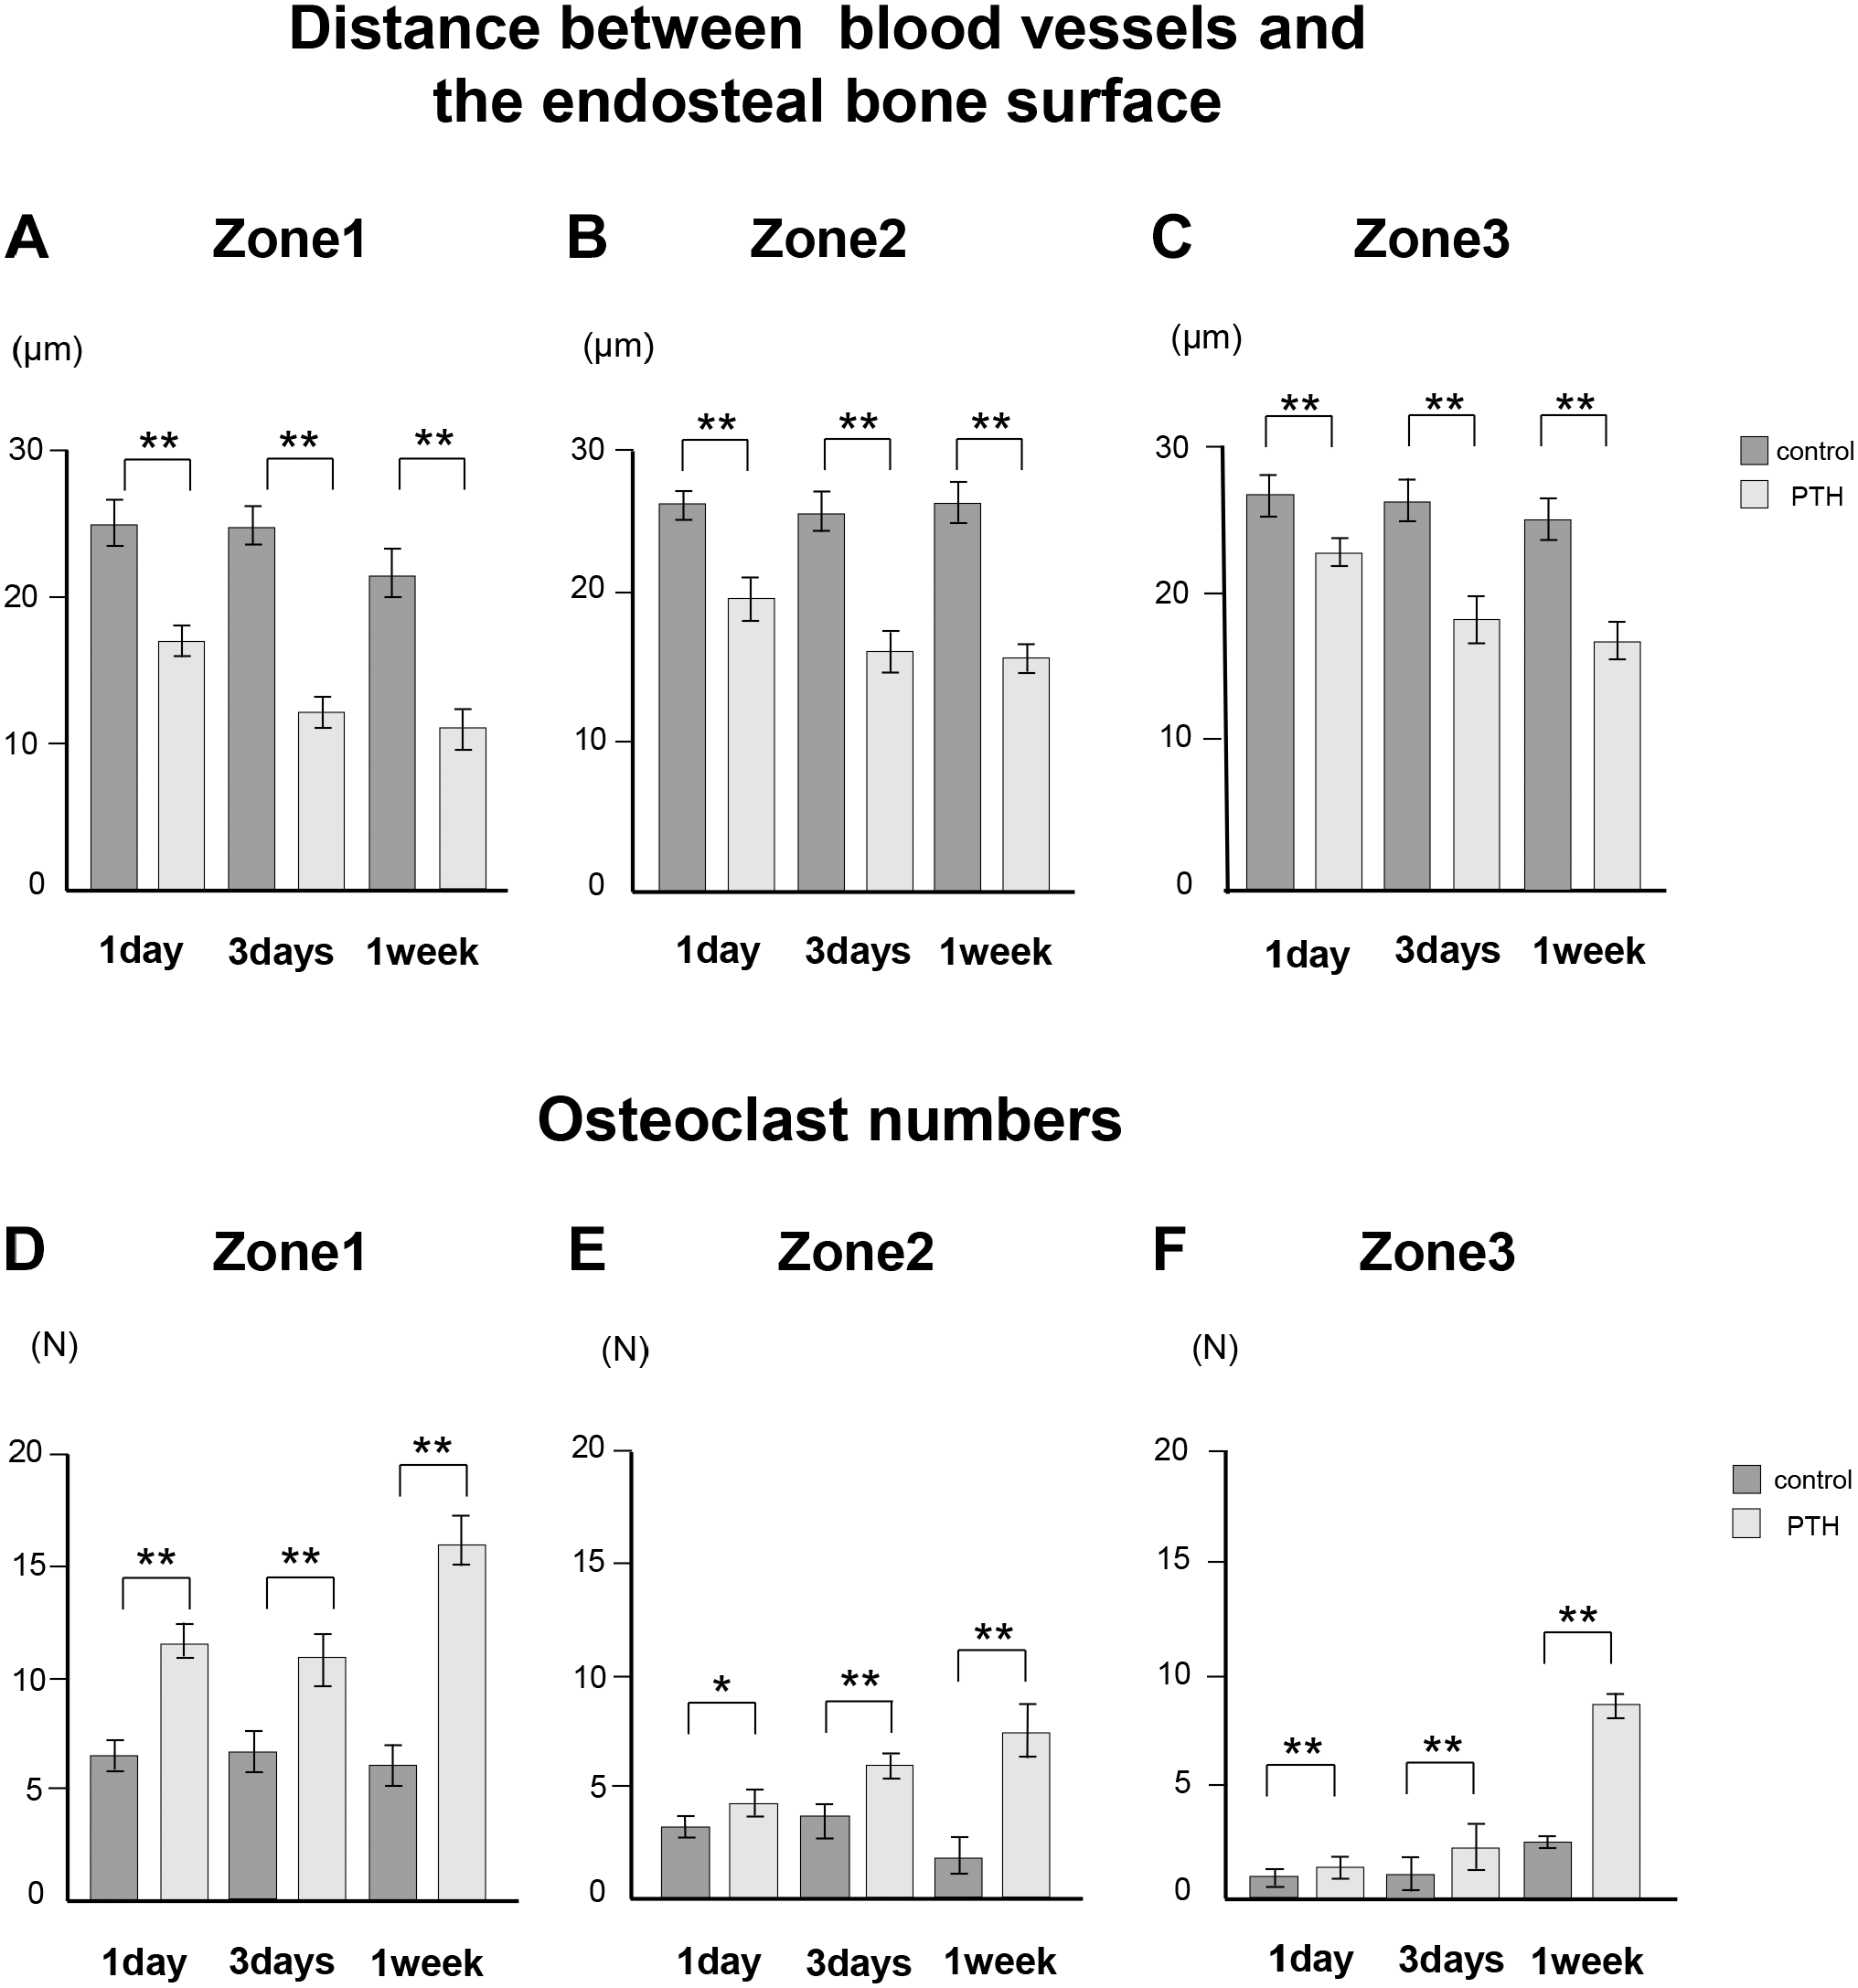
Distance index between blood vessels and the endosteal bone surface and osteoclast numbers in control and parathyroid hormone (PTH)-administered mice. The distance between blood vessels and the endosteal cortical bone surface (Panels A–C). Osteoclast numbers in zones 1 to 3 (Panels D–F). The distance between the blood vessels and the endosteal cortical bone surface significantly decreased in PTH groups compared with the control groups across all periods and zones (Panels A–C). The number of osteoclasts in PTH groups is higher than that of the control group across all periods and zones (Panels D–F). *p<0.05, **p<0.001.
Fine Structure of Blood Vessels Invading the Cortical Bone
High-resolution semi-thin sections and TEM observations revealed flattened osteoblasts and osteoclasts on bone surfaces and blood vessels near bone surfaces after 1 week in the PTH group (Fig. 6A to D). When observing blood vessels invading the cortical bone’s superficial layer, the bone matrix close to the tips of invading blood vessels was well calcified (Fig. 6E and F). However, TEM observations demonstrated that vascular endothelial cells and osteoclasts accompanied one another on the tip of invading blood vessels (Fig. 6G).
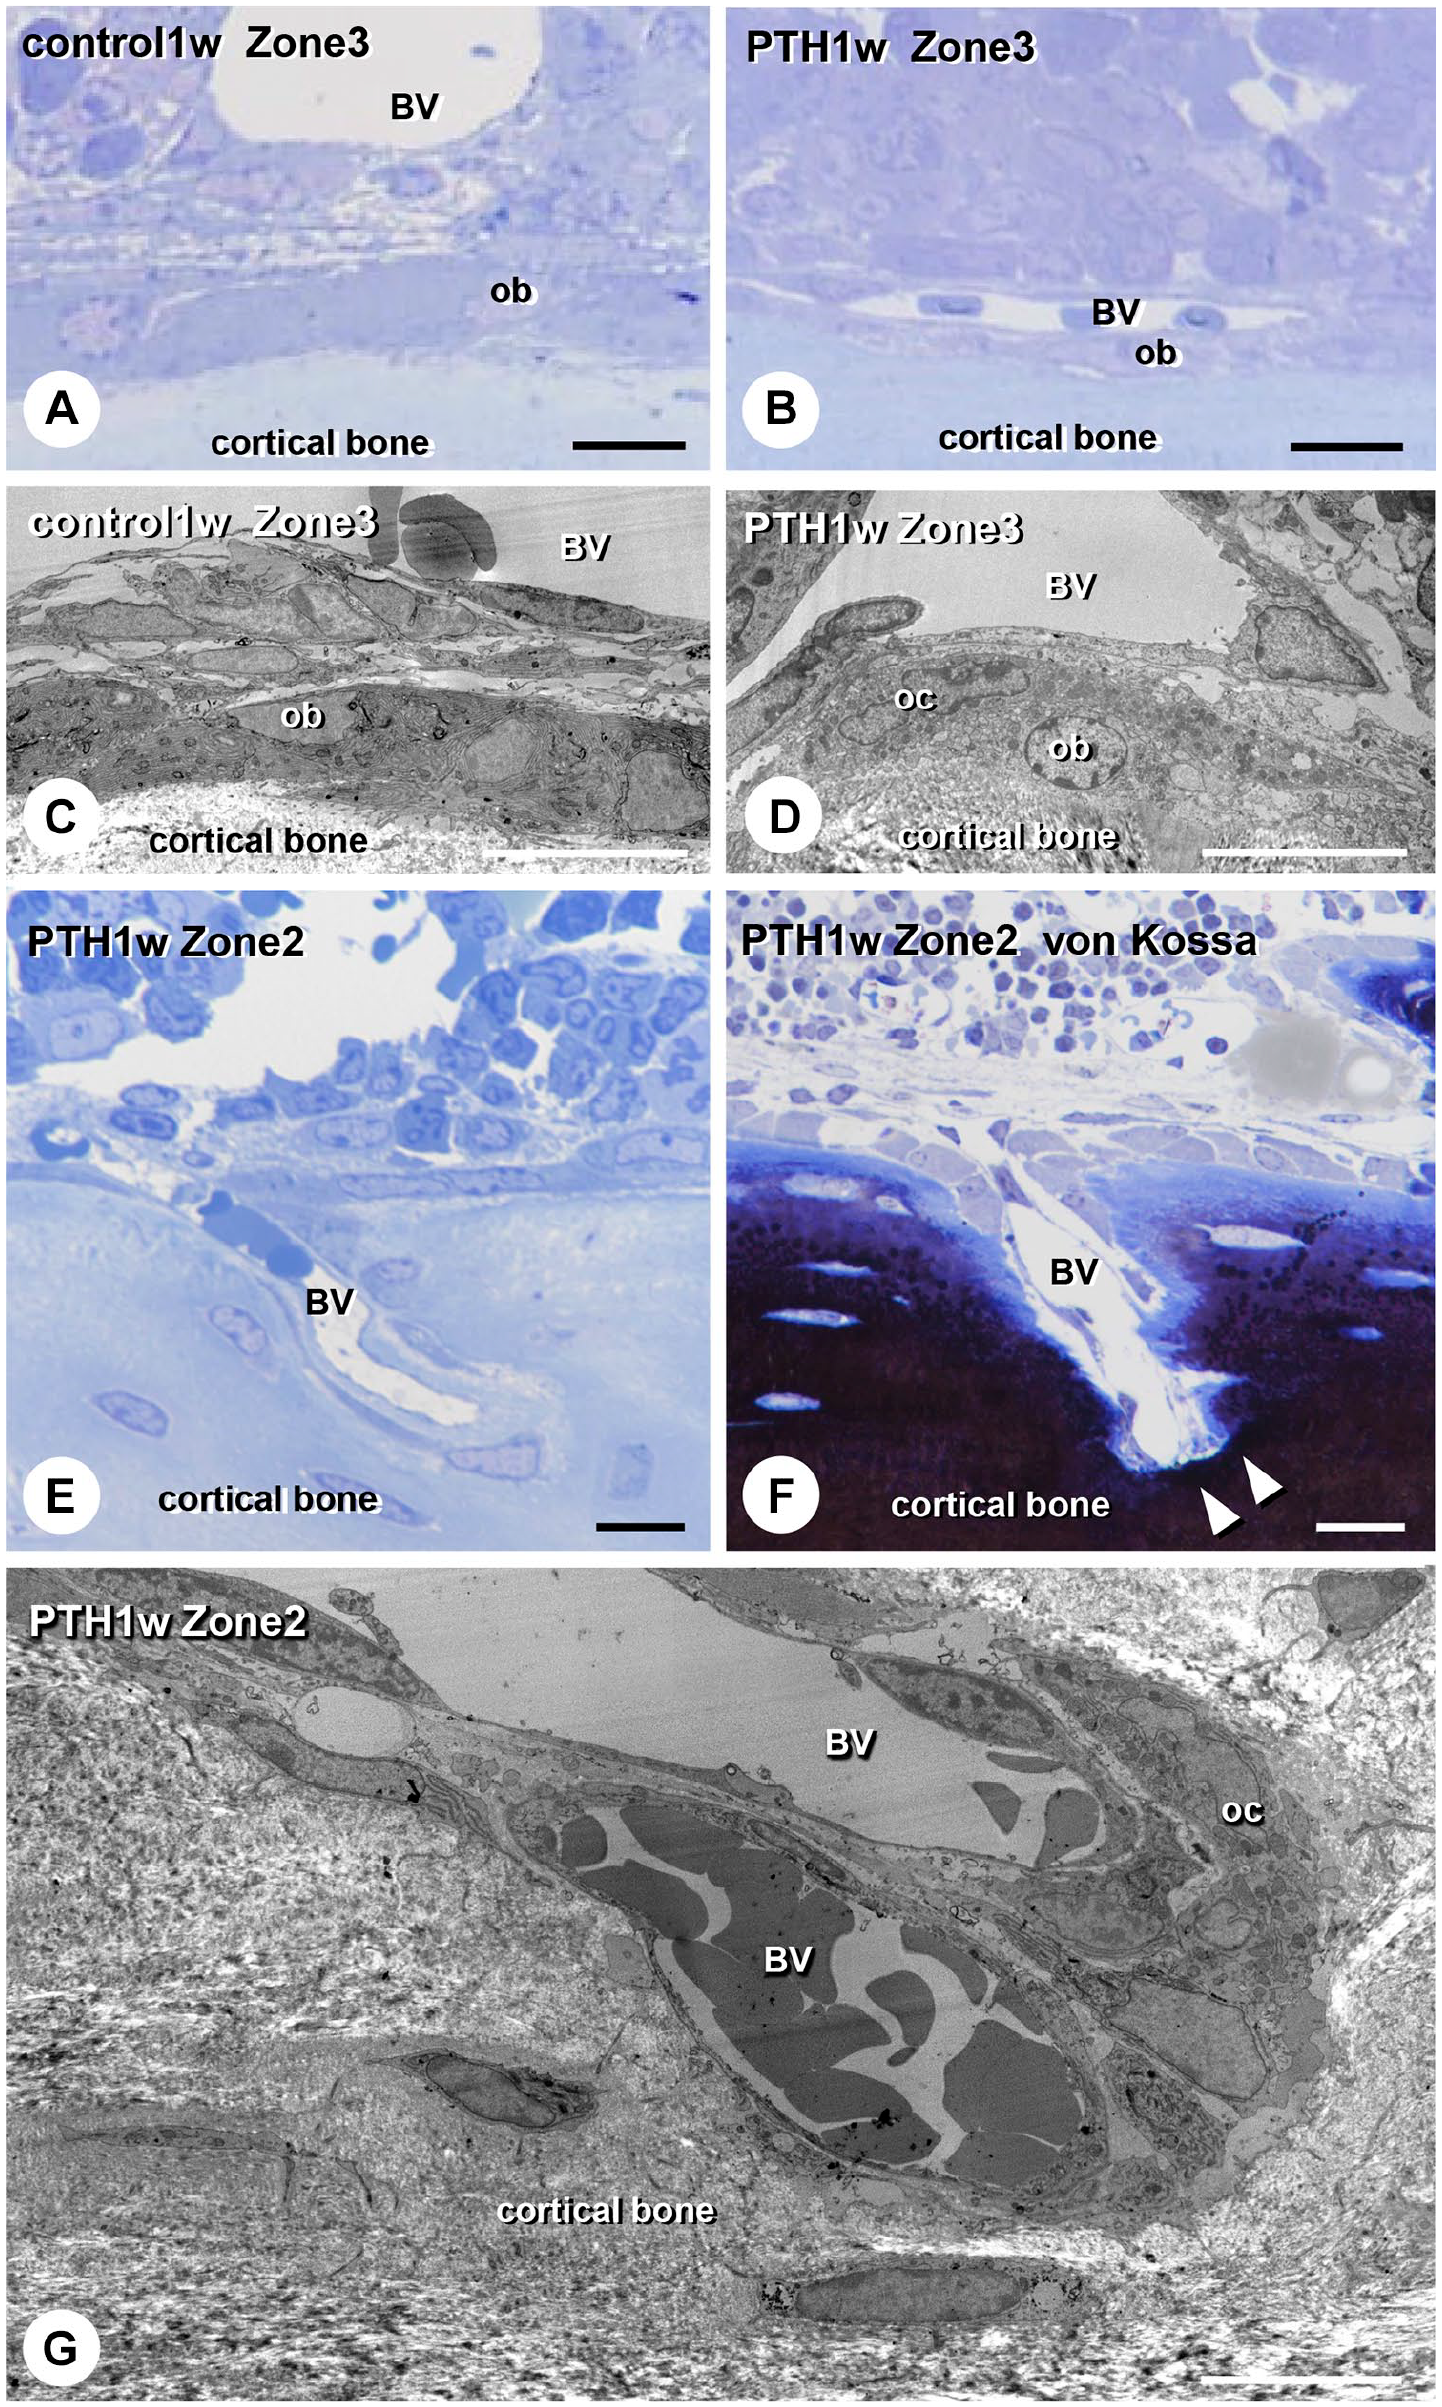
Ultrastructural images of cells around the cortical bone surface in control and parathyroid hormone (PTH)-administered mice. Light microscopic images of the cortical surface in zones 2 and 3 in control (Panel A) and PTH mice 1 week after administration (Panels B, E, and F). Panels C, D, and G present the transmission electron microscopic images at the corresponding areas of Panels A, B, and E. One week after PTH administration, flattened osteoblasts (ob) and osteoclasts (oc) with blood vessels (BV) are located on the cortical bone surface in zone 3 (Panels B and D). In zone 2 with PTH-administered mice, the invading vascular endothelial cells with osteoclasts are at the tip of BV (Panel G). The bone matrix near the tips of invading BV was mineralized (Panel F). Bars A, B, E, F = 20 µm; bars C, D, G = 10 µm.
Histological Characterization of Osteoblastic Layers Over Mature Osteoblasts in the PTH-administered Groups
As previously reported, 20 we have examined whether the osteoblastic cell layer would exhibit αSMA reactivity in specimens 1 week after PTH administration (Fig. 7). The control specimens showed only αSMA-positive cells (identical to arterioles and venules) in the periosteum but hardly any on endosteal bone surfaces (Fig. 7A to C). Conversely, in the PTH groups, zone 1 displayed αSMA-positive thick cell layers identical to ALP-reactive osteoblastic layers surrounding bone surfaces; zone 2 exhibited thin αSMA-positive cell layers (Fig. 7E to G). Next, we double-stained αSMA and endomucin localized blood vessels invading the cortical bone underneath the αSMA-positive cell layer in the PTH group (Fig. 7H). However, no αSMA-positive cell layer was seen in the control group (Fig. 7D). Consistently, real-time PCR verified the increased expression of Acta2 (αSma) and Emcn (Endomucin) in PTH groups (Fig. 7I and J).
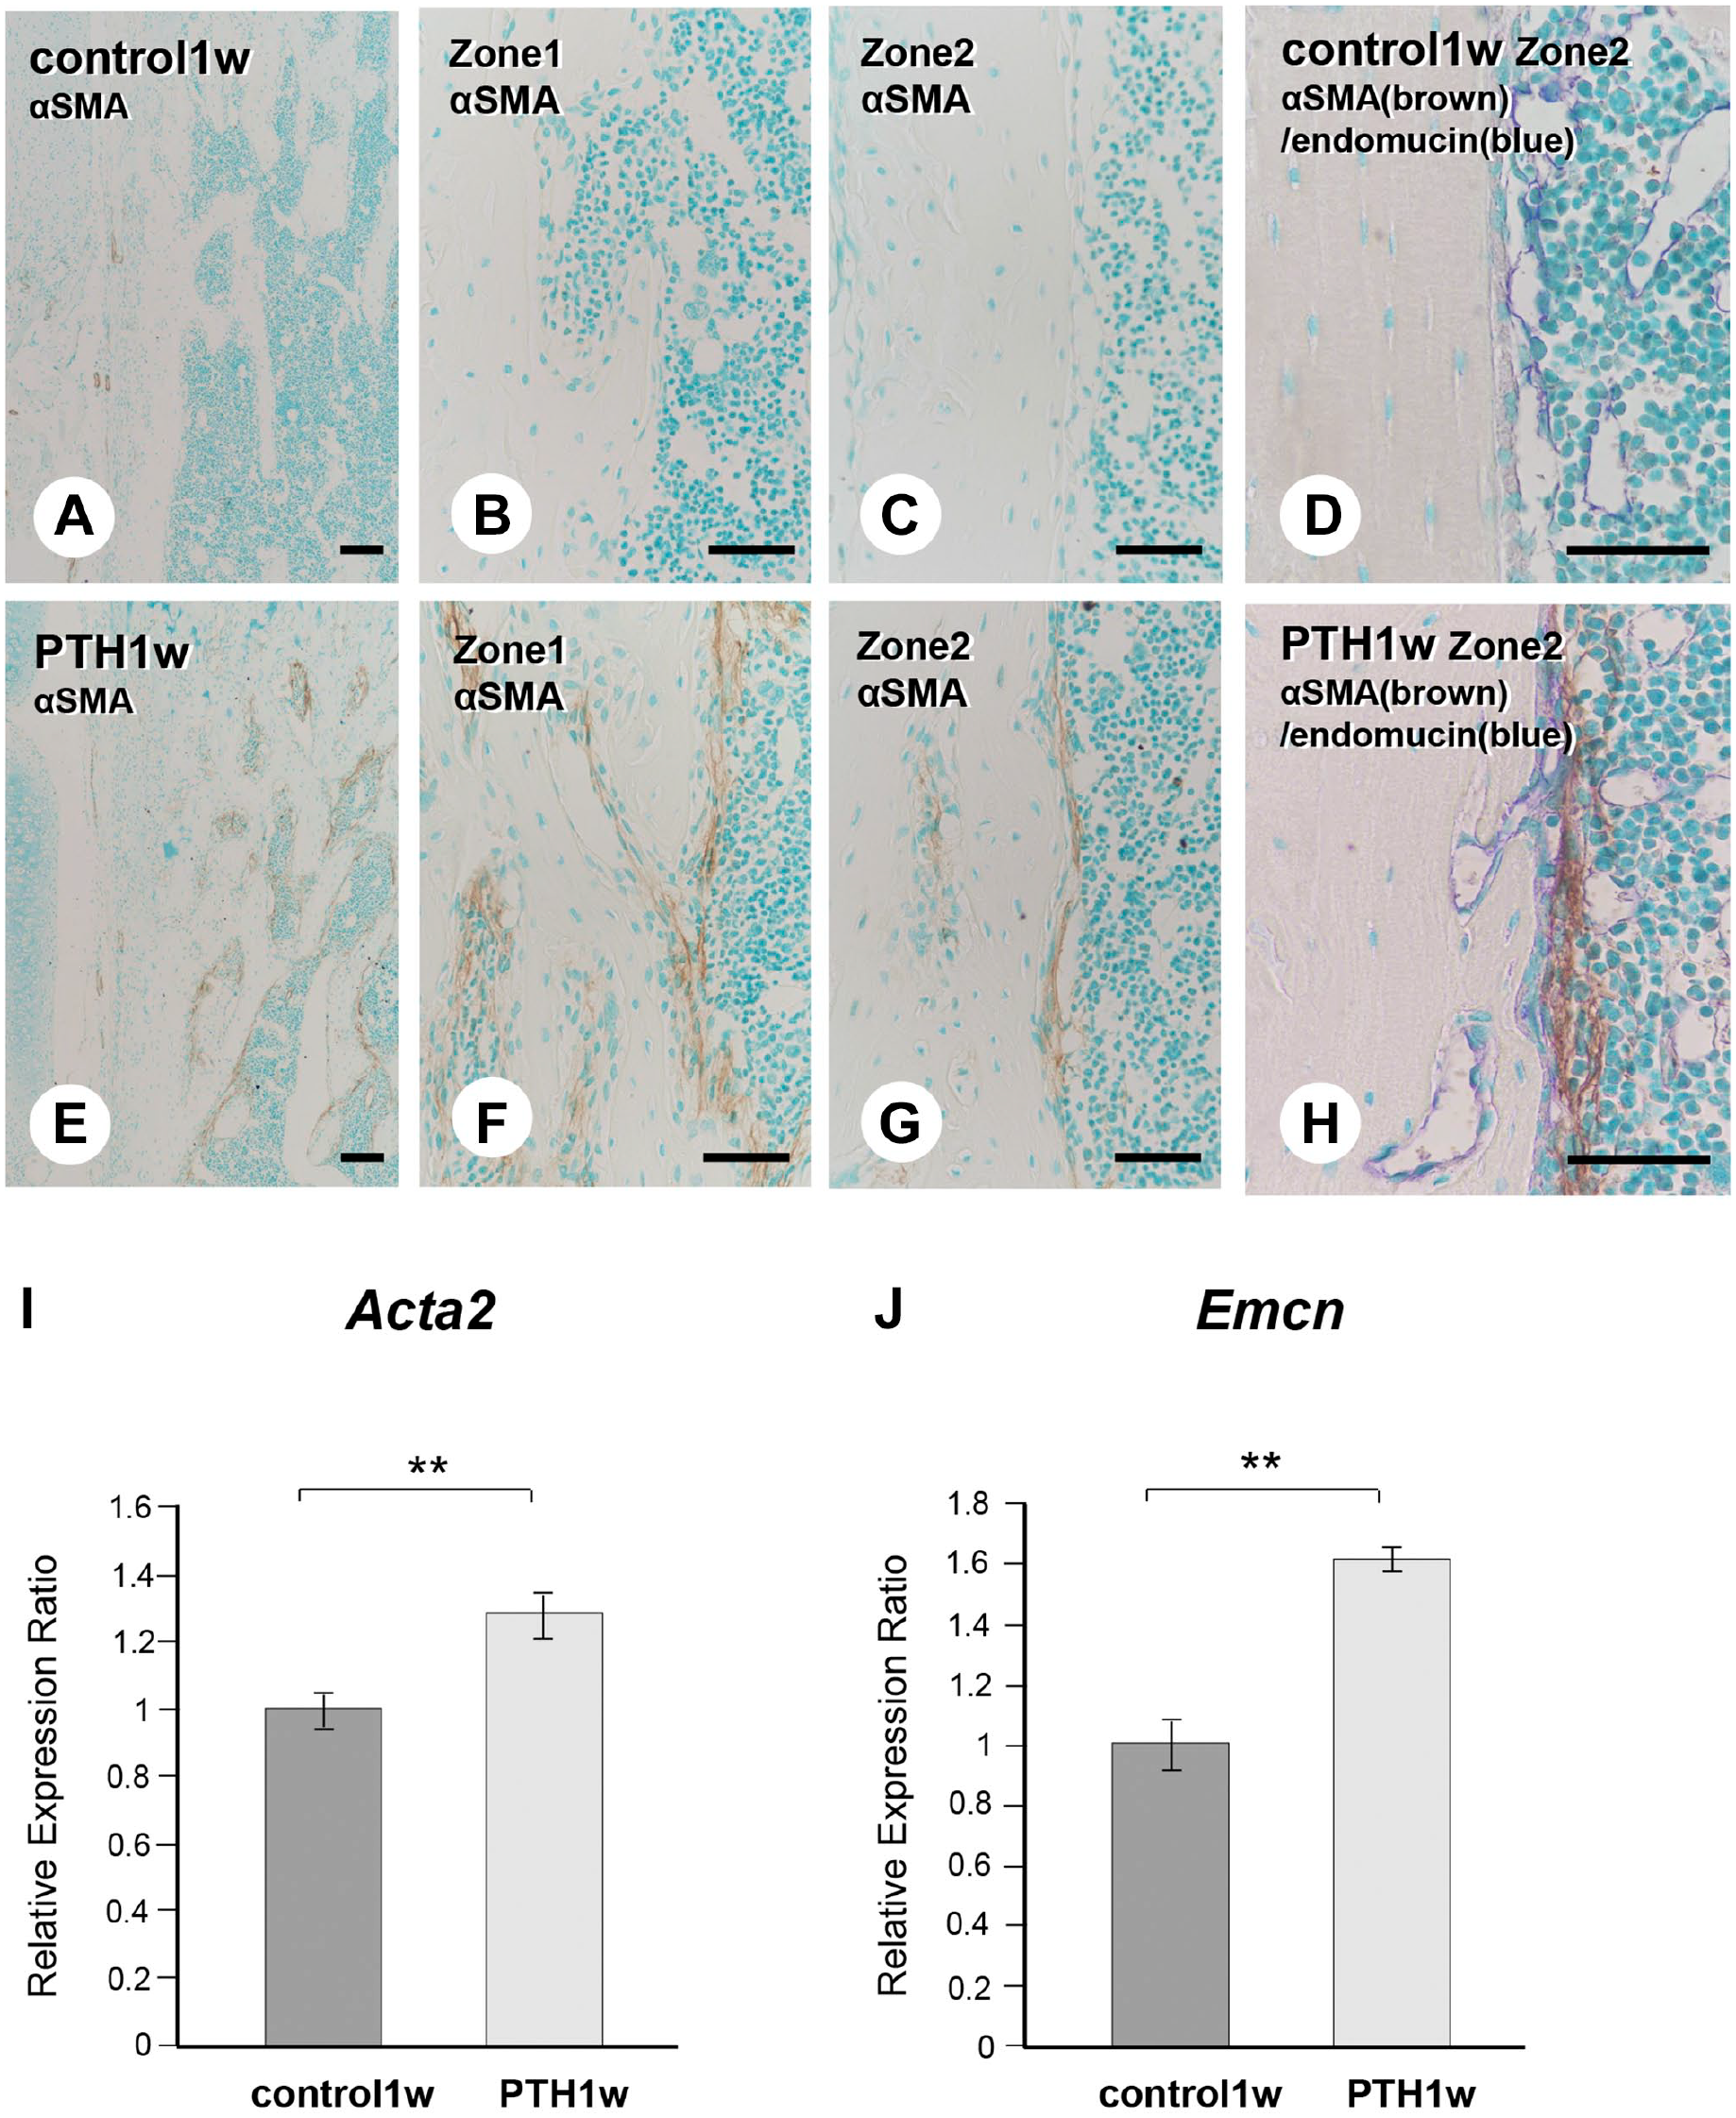
Histological comparison of the α-smooth muscle actin (αSMA)-positive osteoblastic cell layer and Acta2 (αSma) and Emcn gene expression in the control and parathyroid hormone (PTH)-administered mice. At a lower magnification of αSMA immunohistochemistry, αSMA-positive cells (brown) covered the bone surface in PTH-administered mice after 1 week (Panel E). Only a few αSMA-positive cells were apparent in the periosteum of control mice (Panel A), but there were no αSMA-positive cells on the surface of the endosteal side (Panels B and C). In the PTH group, αSMA-positive thick cell layers were observed in zone 1 (Panel F). Thin αSMA-positive cell layers were observed in zone 2 (Panel G). Double αSMA (brown) and endomucin (blue) staining revealed that endomucin-positive blood vessels invading the cortical bone were covered by the αSMA-positive cell layer in PTH-administered mice (Panel H). The control group had no αSMA-positive cell layer around endomucin-positive blood vessels (Panel D). Real-time PCR analysis consistently demonstrated a significant increase in αSma (Acta2) and Endomucin (Emcn) expression in PTH-administered mice (Panels I and J). Bars A–C, E–G = 100 µm; bars D, H = 50 µm. **p<0.001.
Furthermore, in the PTH group, VCAM1 immunoreactivity was observed in the corresponding osteoblastic cell layer, which could be seen as a thick cell layer in zone 1 and a thin layer in zone 2 (Fig. 8A to D). In addition, the double detection of RANKL/TRAP identified many osteoclasts in the osteoblastic layers with RANKL reactivity in zones 1 and 2 of the PTH group (Fig. 8E to H). We examined the double detection of PDGFbb that reportedly modulated angiogenesis and endomucin in osteoclastic cells. 28 PDGFbb-reactive osteoclastic cells were near endomucin-positive blood vessels, as observed in zones 1 and 2 of the PTH groups, but not in the control group (Fig. 8I to L). Consistent with RANKL and PDGFbb histochemistry, real-time PCR indicated elevated Tnfsf11 (Rankl) and Pdgfb expression (Fig. 8M and N). PTH-administered femora displayed ALP-reactive osteoblastic cell layers also possessing αSMA, VCAM1, and RANKL. The close localization of PDGFbb-positive osteoclasts and endomucin-reactive blood vessels was observed among these cell layers. This finding implicates the possibility that endomucin-reactive blood vessels and osteoclasts could migrate through VCAM1-positive/RANKL-reactive osteoblastic cell layers to reach the endosteal bone surface.
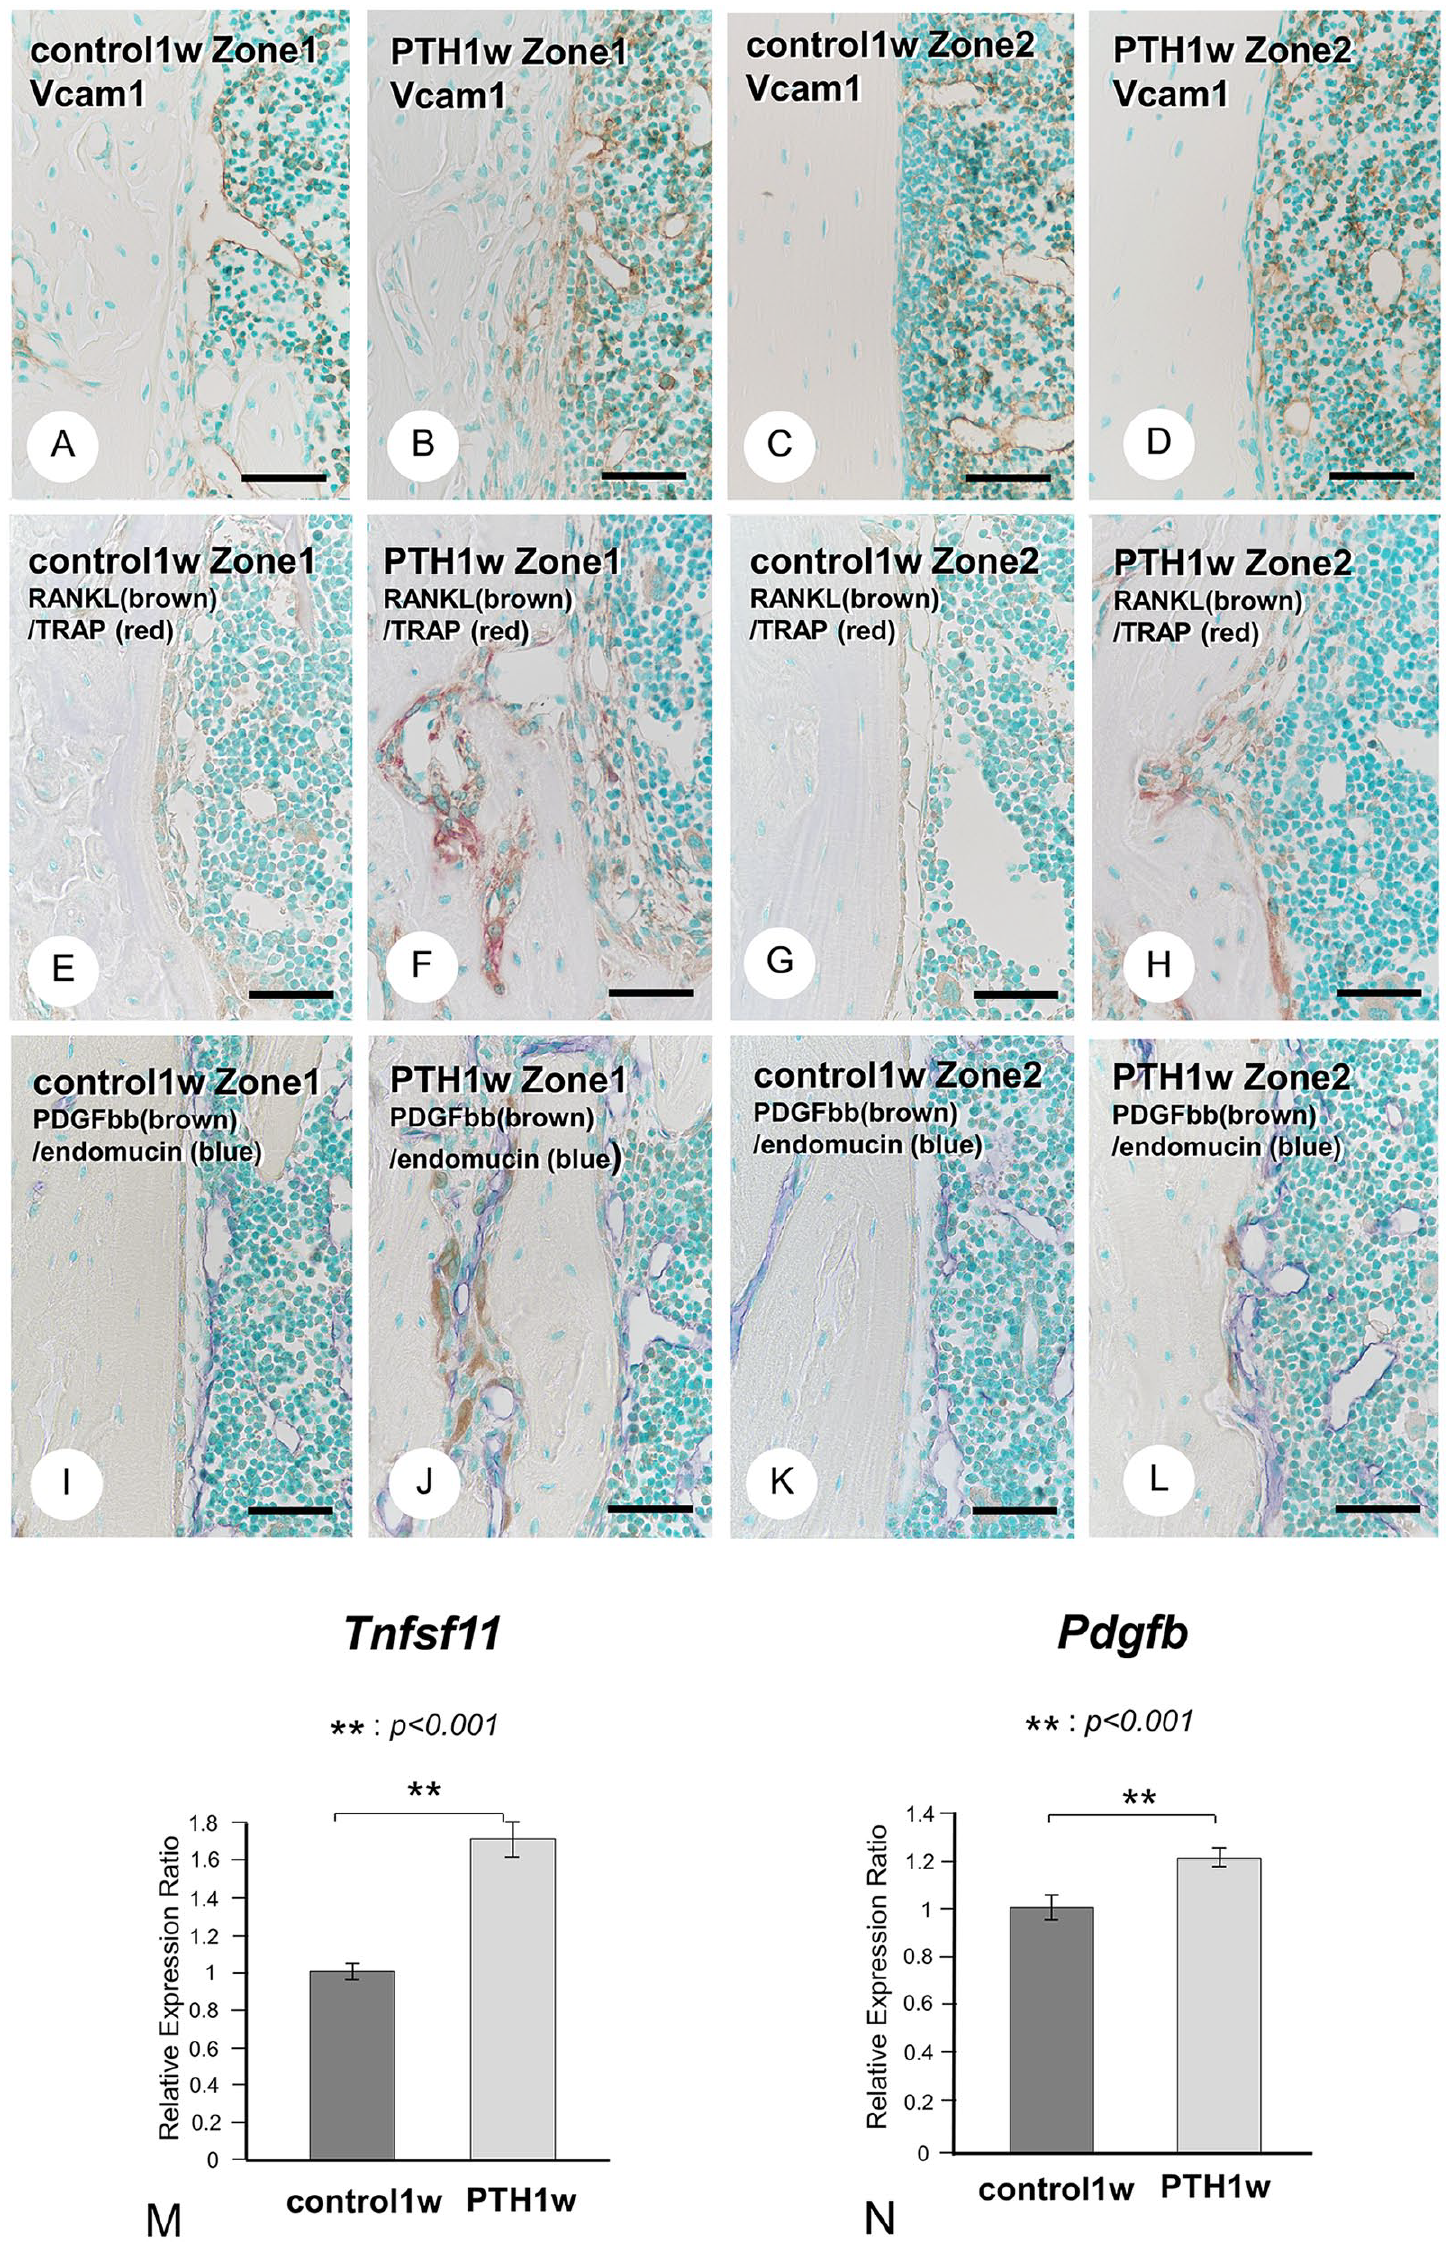
Vascular cell adhesion molecule-1 (VCAM1), receptor activator of NF-κB ligand (RANKL), and platelet-derived growth factor-BB (PDGFbb) distribution and gene expression in control and parathyroid hormone (PTH)-administered mice. VCAM1 immunodetection (brown; Panels A–D) in control (Panels A and C) and PTH-administered mice (Panels B and D). A VCAM1-positive thick osteoblastic layer exists on the cortical bone surface in zone 1 (Panel B), whereas a thin layer was in zone 2 (Panel D). The double detection of RANKL (brown; Panels E–H) and tartrate-resistant acid phosphatase (TRAP; red) in control (Panels E and G) and PTH-administered mice (Panels F and H). Numerous TRAP-positive osteoclasts were located in the RANKL-positive osteoblastic layers in zones 1 and 2 (Panels F and H). The double detection of PDGFbb (brown; Panels I–L) and endomucin (blue) in control (Panels I and K) and PTH-administered mice (J and L). There were no PDGFbb-positive osteoclasts in control mice (Panels I and K). PDGFbb-positive osteoclasts were apparent in the cortical porous with endomucin-positive blood vessels in zone 1 (Panel J) and endomucin-positive blood vessels on the cortical bone surface in zone 2 (Panel L) of PTH-administered mice. Real-time PCR consistently demonstrated a significant increase in Rankl (Tnfsf11) and Pdgfb expression (Panels M and N). Bars A–L = 50 µm. **p<0.001.
DKK1, Ckap4, and Plvap Immunolocalization and Expression in PTH-administered Femora
We turned our attention to genes expressed by osteocytes, as we considered them potential candidates for vascular invasion into cortical bone, given their predominant presence inside cortical bone. Our investigation involved the examination of molecules secreted by angiogenetic factors and osteocyte-derived molecules through RNA sequencing (Fig. 9). Heat map analysis revealed the elevated expression of many angiogenic factors, including Hif1α, Pdgfb, Vash2, Ephb4, Efnb2, Ramp3, Ephb2, Pik3r3, Srpx2, Aplnr, Gas1, Cd276, Dkk1 (a Wnt inhibitor and angiogenic activator), Ckap4 (a Dkk1 receptor), and Plvap (plasmalemma vesicle-associated protein, an angiogenetic factor), and osteocyte-derived molecules, such as Dmp1, Phex, Tnfsf11, and Dkk1, in the PTH group (Fig. 9A and B). Among them, we focused on Dkk1, Ckap4, and Plvap. Sclerostin was observed in osteocytes and their canaliculi in the control and PTH groups, with no significant difference in the Sost expression (Fig. 9C, D, and I). However, Dkk1 gene expression was significantly elevated after PTH administration, and intense immunoreactivity was observed in osteocytes in the PTH group (Fig. 9E, F, and J). Real-time PCR verified the elevated Ckap4 expression (Fig. 9K), and blood vessels close to and invading the cortical bone definitively showed Plvap immunoreactivity in the PTH group but not in the control group (Fig. 9G and H). Consistently, Plvap expression was significantly elevated (Fig. 9L).
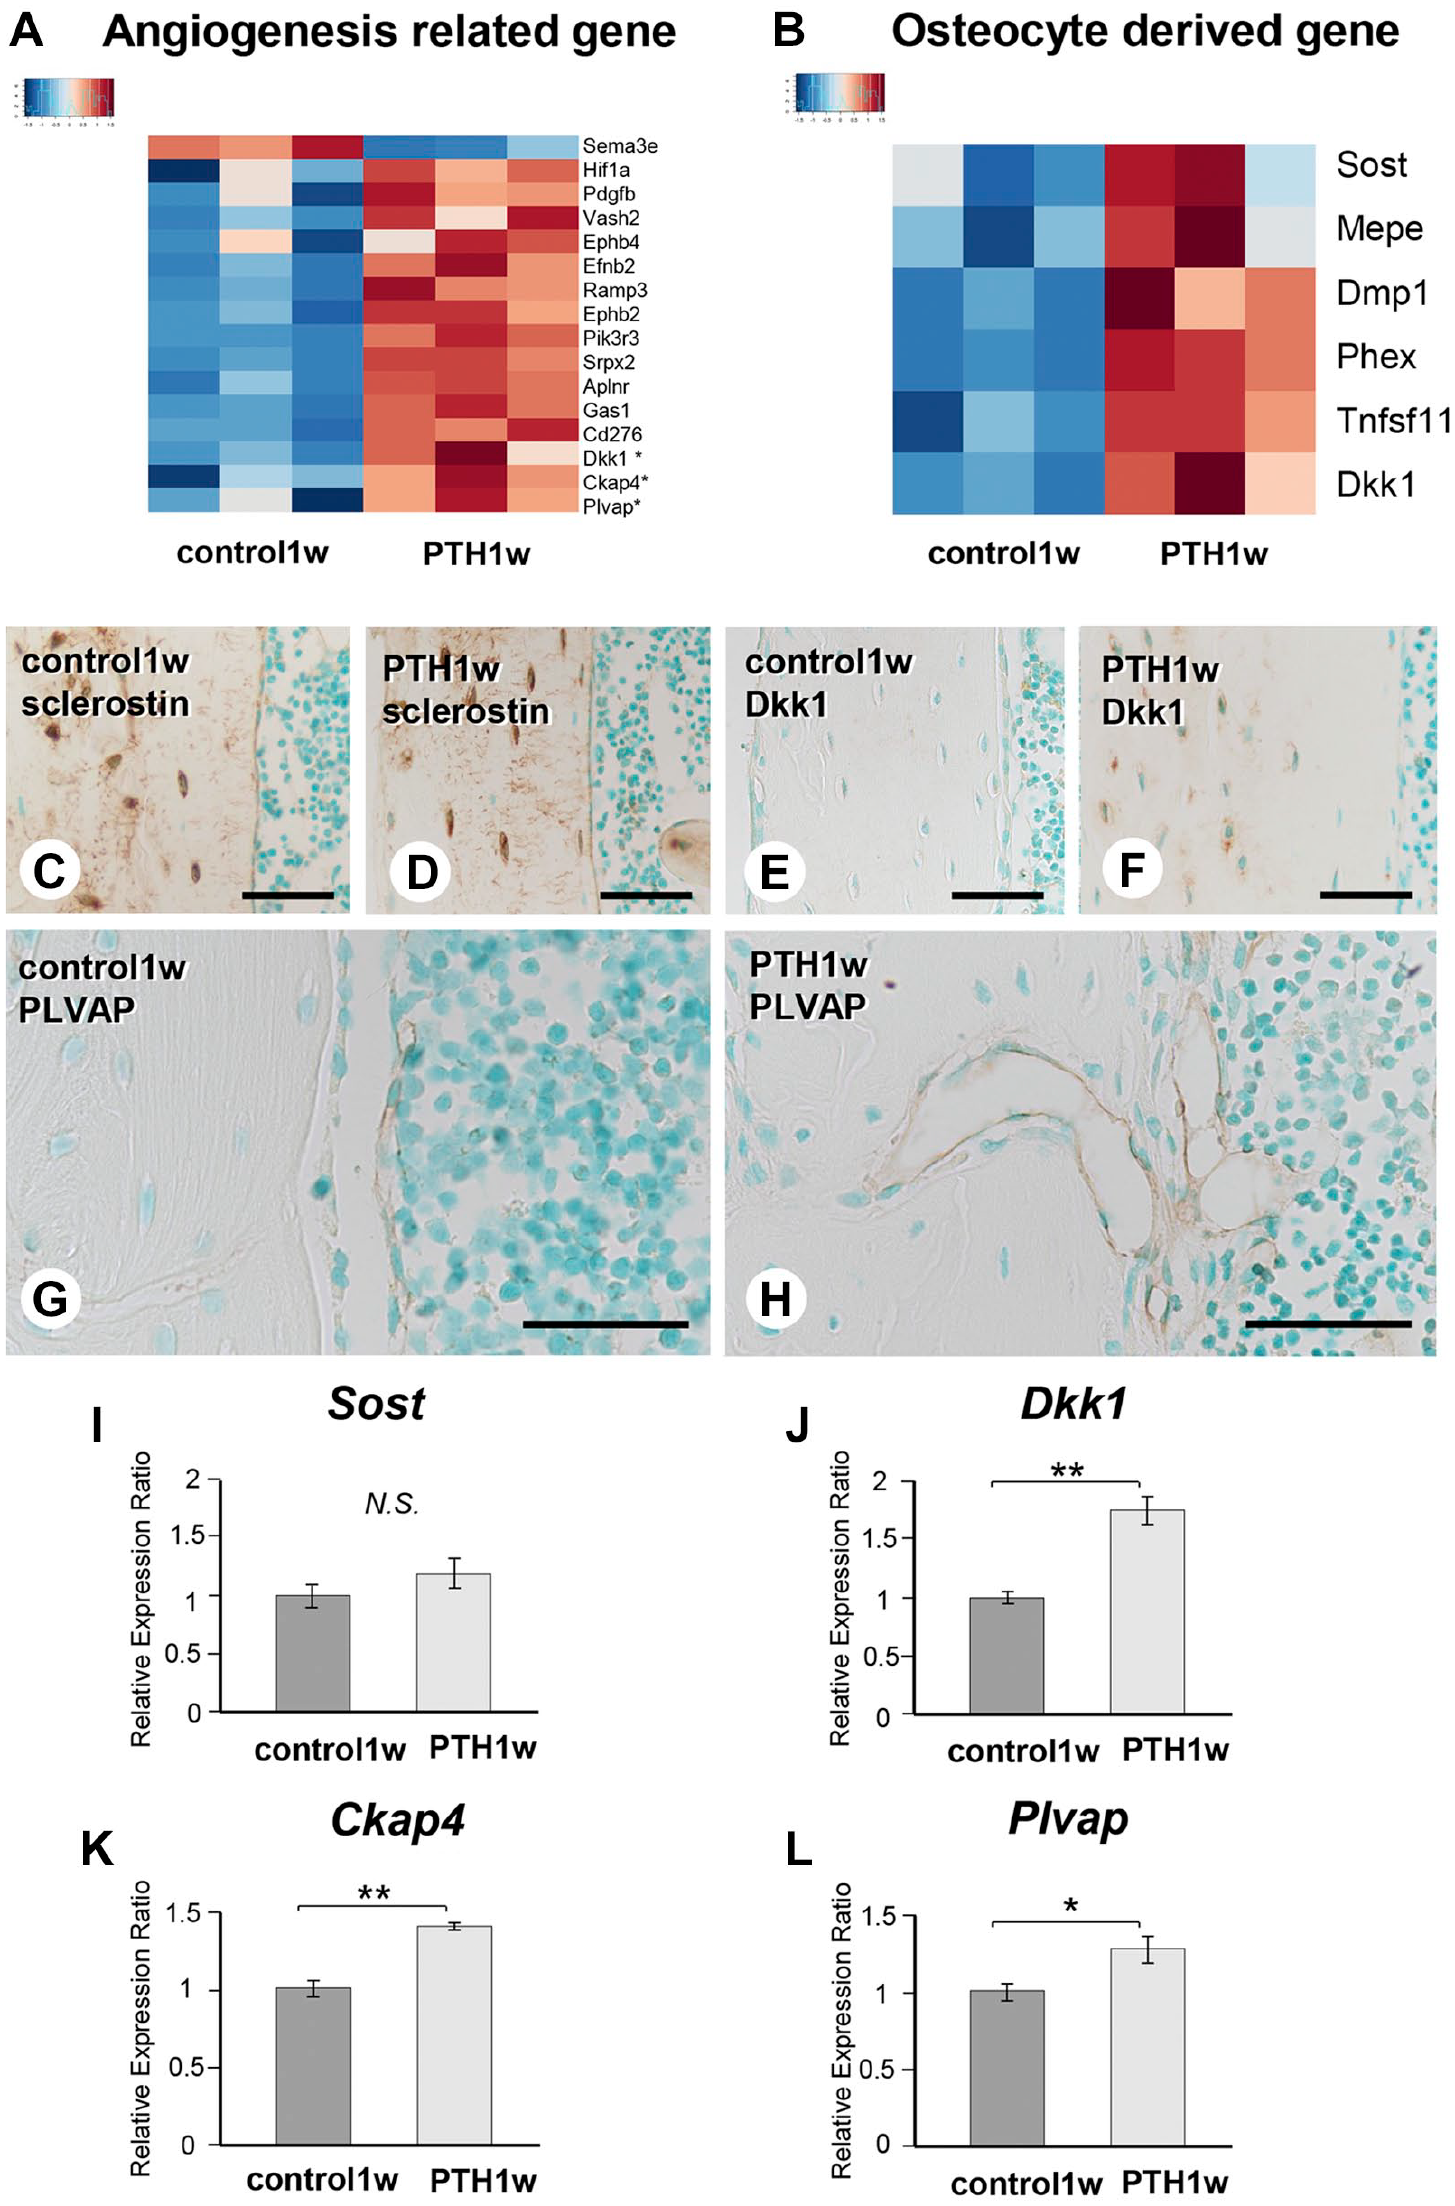
Osteocyte-derived angiogenic factor, Dickkopf1 (Dkk1), cytoskeleton-associated protein 4 (Ckap4), and plasmalemma vesicle-associated protein (Plvap) immunolocalization and gene expression in parathyroid hormone (PTH)-administered mice. Heatmap analysis by RNA sequencing revealed an elevated expression of numerous angiogenic factors, Hif1a, Pdgfb, Vash2, Ephb4, Efnb2, Ramp3, Ephb2, Pik3r3, Srpx2, Aplnr, Gas1, Cd276, Dkk1, Ckap4, Plvap (Panel A), and osteocyte-derived molecules, such as Dmp1, Phex, Tnfsf11, and Dkk1 (Panel B) in PTH-administered mice. Sclerostin-positive osteocytes and their canaliculi were apparent in control and PTH-administered mice (Panels C and D). There was no significant difference in the Sost expression in both mice groups (Panel I). Dkk1 immunohistochemistry demonstrated the intense immunoreactivity in PTH-administered mice (Panel F) compared with control mice (Panel E). Dkk1 expression was significantly elevated after PTH administration (Panel J). Plvap-positive blood vessels were located close to the cortical bone surface and invaded the cortical bone in PTH-administered mice (Panel H) but not in control mice (Panel G). Ckap4 and Plvap gene expressions were significantly elevated (Panels K and L). Bars C–H = 50 µm. *p<0.05, **p<0.001.
Discussion
In our current study using a mouse model, we observed that cortical porosity progresses from the metaphyseal region to the diaphyseal region in sagittal sections and the endosteal bone surface into the mid-region of the cortical bone in transverse sections. PTH administration caused blood vessels to migrate toward the endosteal bone surface, passing through the ALP-positive osteoblastic layer. These osteoblastic layers were thick in the metaphyseal region but thin in the diaphyseal region. Furthermore, PTH administration resulted in not only blood vessels’ migration on the endosteal bone surface but also the appearance of osteoclasts in the close vicinity of the invading blood vessels. We postulate that the closely coordinated migration of blood vessels and osteoclasts toward the cortical bone surface is essential during the early stages of cortical porosity in our mouse models.
We hypothesized that while blood vessels approached the osteoblastic layer covering mature osteoblasts and penetrated the cortical bone, the ALP-positive osteoblastic layer is pivotal in endomucin-positive blood vessels migration. Blood vessels in the control group maintained a certain distance from the bone surface, and there were no signs of blood vessels penetrating the cortical bone. The endosteal surface of the mouse femur observed in this study gradually underwent bone formation through modeling. 29 Therefore, osteoclasts are nearly absent under normal conditions.
In contrast, the ALP-positive thick osteoblastic layer in PTH-administered mice exhibited characteristics such as αSMA and VCAM1 positivity. αSMA is a marker for perivascular and undifferentiated mesenchymal cells, 19 whereas VCAM1 is an adhesion molecule expressed in endothelial, undifferentiated mesenchymal, and bone marrow stromal cells. 30 Therefore, vascular endothelial cells could migrate toward endosteal bone surfaces using VCAM1-positive osteoblastic cell layers as a scaffold. On the other hand, the αSMA-positive osteoblastic cell layer implies that these cells may still possess perivascular cell characteristics, suggesting a potential interaction with vascular endothelial cells.
Our previous reports indicated that PTH-treated mice exhibited increased osteoblastic progenitor proliferation in the metaphyses of long bones, vascular lumen diameter, and vessel numbers. In addition, many αSMA-positive cells extended into the endomucin-positive blood vessels and the surrounding tissue.20,21 These αSMA-positive cells, which also exhibit ALP and VCAM1 positivity, are postulated to be undifferentiated mesenchymal cells capable of differentiating into perivascular cells and osteoblast progenitors. Therefore, the ALP/αSMA/VCAM1-positive cells in this study, spreading gradually from the metaphyseal to diaphyseal regions, are likely to induce cortical porosity.
Many TRAP-positive osteoclasts in PTH-treated mice were included in the thick osteoblastic layer covering the endosteal bone surface. Statistical analysis of the distance between blood vessels and bone surfaces strongly indicates that endomucin-positive blood vessels gradually approached the endosteal bone surface after PTH administration. In addition, these endomucin-positive blood vessels were near osteoclasts producing PDGFbb, as shown in Fig. 8. On the other hand, the femora’s endosteal bone surface of growing mice is a bone modeling region where continuous calcein labeling has been observed. 29
The many osteoclasts induced by PTH administration are likely due to the osteoclastogenesis potential of the osteoblastic cell layer that is positive not only for ALP/αSMA/VCAM1 but also for RANKL. Although these RANKL-positive osteoblastic cells thin out when approaching the diaphyseal region, a niche for osteoclast induction in situ is needed. Thus, RANKL-positive osteoblastic layers covering the endosteal bone surface may induce osteoclasts, keeping the close proximity to blood vessels by mediating PDGFbb synthesis. Notably, the osteoclasts accompanied by blood vessels would be crucial for penetrating the cortical bone interior.
In this study, von Kossa staining revealed that the tips of blood vessels invading the deep cortical bone are calcified. It is challenging for the endothelial cells in the blood vessels to dissolve the calcified matrix. However, TEM observations revealed osteoclasts lined up alongside invading endothelial cells, suggesting that osteoclasts dissolved the calcified bone matrix. As such, osteoclasts participating in migration and penetration in the cortical bone interior seem intrinsic to the initial cortical porosity process.
One may wonder what prompts blood vessels and osteoclasts to invade the cortical bone interior. The osteocyte network is a potential candidate as osteocytes are predominately embedded in bone. RNA sequencing revealed that PTH administration upregulated Hif1α, Pdgfb, Vash2, Ephb4, Efnb2, Ramp3, Ephb2, Pik3r3, Srpx2, Aplnr, Gas1, Cd276, and Dkk1. Among these genes, we noted that Dkk1 is an osteocyte-derived molecule, which was reportedly an inhibitor of Wnt signaling and an angiogenesis activator.31–33 Because Ckap4 (a Dkk1 receptor)34,35 and Plvap (plasmalemma vesicle-associated protein, an angiogenetic factor) 36 expressions were also elevated, we postulated that osteocyte-derived molecules, such as Dkk1, affected vascular endothelial cells to induce angiogenesis. This reaction potentially enables invasion into the cortical bone with osteoclasts in the PTH group.
The human cortical bone comprises many osteons, a concentric circle with central blood vessels, and inner and outer circumferential lamellae. Therefore, the anatomical structure of the human cortical bone is not the same as that of rodents. However, the inner circumferential lamellae’s endosteal bone surface in humans must histologically correspond to the endosteal cortical bone surface in mice and the bone surface of the Haversian canal of osteons. Nevertheless, animal studies still have limitations in reproducing the cortical porosity in humans; thus, further experiments are necessary.
Intermittent PTH administration induced femoral cortical porosity that progressed from the metaphysis to the diaphysis in mice. After PTH administration, endomucin-positive blood vessels and PDGFbb-reactive osteoclasts in ALP/αSMA/VCAM1-reactive osteoblastic cell layers invade the cortical bone through osteocyte-derived molecules, such as DKK1.
Footnotes
Acknowledgements
We thank Rhelixa Co., Ltd. for their assistance in the RNA sequencing analysis.
Competing Interests
The author(s) declared no potential conflicts of interest with respect to the research, authorship, and/or publication of this article.
Author Contributions
TH designed the study and drafted the manuscript. MA was the first author to write the original draft and contributed to analysis of data and interpretation of data. HH, TY, XL, QY, and MH-Kcontributed to immunohistochemistry. HI, HM, HY, TS, YS, and JC worked on the statistical analyses and critical reading. NA participated in the discussion, editing, and formatting of the manuscript. All the above authors have read and approved the final manuscript.
Funding
The author(s) disclosed receipt of the following financial support for the research, authorship, and/or publication of this article: This study was partially supported by grants from the Japan Society for the Promotion of Science (JSPS, 22K0991 to Hasegawa T, 22K21006 to Maruoka H, and 21H03103 to Amizuka N), a grant-in-aid provided by the Uehara Memorial Foundation (Hasegawa T), and the JSBMR Rising Stars Grant provided by the Japanese Society for Bone and Mineral Research (Hasegawa T).