
Abstract
A growing body of evidence emerging supported that ectodysplasin-A (EDA) signaling pathway contributed to craniofacial development. However, their expression in condyle has not been elucidated yet. This study investigated the expression patterns of EDA, EDA receptor (EDAR), and EDAR-associated death domain (EDARADD) in condyle of postnatal mice. Histological staining and micro–computed tomography (CT) scanning showed that as endochondral ossification proceeded, the thickness of chondrocyte layer decreased, and the volume of mandibular condyle increased. Osteoclasts remained active throughout the condylar development. Immunohistochemistry staining demonstrated that EDA was expressed in almost all layers during the first 2 weeks after birth. EDA shifted from the mature and hypertrophic layers to fibrous and proliferating layers at postnatal 3 weeks. As condyle matured, the distribution of EDA tended to be limited to hypertrophic layer. The distribution patterns of EDAR and EDARADD were consistent with EDA, while the level of EDAR expression was slightly lower. mRNA expression levels of EDA signaling pathway-related components increased after birth. Furthermore, we evaluated the expression of EDA using ATDC5 in vitro. EDA increased during the late stage of chondrogenesis. These findings proved that EDA signaling pathway was involved in condylar development and acted as a regulatory factor in condylar maturation and differentiation.
Introduction
The mandibular condyle, as the growth center of the mandible, promotes the growth and development through endochondral osteogenesis and is an important component of the temporomandibular joint. Mandibular condylar dysplasia can lead to mandibular deformity, severe malocclusion, and temporomandibular joint disorders (TMDs). 1 Unlike other articular cartilage, condylar cartilage is the secondary cartilage and originates from cranial neural crest cells, which can differentiate into chondrocytes and osteoblasts. 2 From birth to adolescence, the mandible showed its rapid growth spurt. The growth rate and direction of the condylar cartilage are plastic, determining the length and height of mandibular growth and making the condylar cartilage a focus of scientific research. The study of the early postnatal growth and development of the mandibular condyle had important clinical implications for exploring the pathogenesis of various maxillofacial deformities.
Secreted ectodysplasin-A (EDA) is an exocytotic type II membrane protein with a short intracellular structural domain, a transmembrane structural domain, a collagen motif, and a tumor necrosis factor (TNF) ligand. EDA is known as an important factor in ectodermal development and a member of the TNF superfamily. 3 It is encoded by the eda gene located on chromosome Xq12-q13.1 in humans. 4 The highly conserved EDA signaling pathway is essential for ectodermal morphogenesis. 5 It involves the combination of EDA and EDA receptor (EDAR). This interaction leads to the recruitment of an EDAR-associated death domain (EDARADD), making the transcription factor nuclear factor kappa B (NF-κB) to translocate into the nucleus and transcribe multiple target genes. 6 Mutations in the EDA pathway gene disrupts the interaction between the epithelial cells located on the surface and the underlying mesenchyme during embryonic development, causing X-linked hypohidrotic ectodermal dysplasia (XLHED), which is characterized by hypodontia, hypohidrosis, and hypotrichosis. 7
Previous studies have focused on the regulatory role of EDA in epithelial development including that of teeth and hair.8,9 It should be noted that in ectodermal dysplasia there are disorders of epithelial–mesenchymal interactions affecting the structure of the endoderm and ectoderm, which are not confined to a single ectoderm. 10 The mandibular morphology was abnormal in EDA−/− mice (Tabby mice, a mouse model of XLHED), which showed the lower corpus of the jaw, narrower neck of the condyle, and marked backward projection of the coronoid process. 11 In addition, the significantly decreased marrow space in the EDA-deficient calvarial bone showed osteopetrosis-like alterations, which were retained during adulthood. 12 Patients with XLHED also showed craniofacial deformities, along with changes in bone density. The presence of the classical signs of craniofacial dysmorphism, such as maxillary hypoplasia, mandibular prognathism, facial concavity, and altered growth of the cranial base, raised the potential contribution of EDA to epithelial–mesenchymal interactions. 13
However, the function of EDA in normal and abnormal craniofacial development remained elusive, and its effects on the mandibular condyle was unknown yet. To gain insight into the biological significance of EDA, we examined the expression patterns of EDA signaling pathway members during normal postnatal development of condyle in mice. The results of this study may provide novel insights into the development of the mandibular condylar cartilage and related diseases.
Materials and Methods
Animals
C57BL/6J mice aged postnatal day 1 (PN1d) to 12 weeks (PN12w), were purchased from the Shanghai Model Organisms Center (Shanghai, China). The mice were provided with ad libitum access to food and water under climate-controlled conditions. The same standardized diet was given to each animal, and they all showed no signs of disease. Under inhalation anesthesia with ether (nacalai tesque, Kyoto, Japan), the mice were perfused with 4% paraformaldehyde (PFA) in 0.1-M sodium phosphate buffer. Subsequently, the mandibles were dissected and fixed in 4% PFA in 0.1-M phosphate buffer (pH 7.4) at room temperature for 48 hours. All experimental procedures were approved by the Tongji University Ethics Committee, and all procedures were performed according to institutional guidelines.
Micro–Computed Tomography
Micro–computed tomography was performed to assess bone structure and quality. The Scanco Medical µCT50 system (Scanco Medical, Bassersdorf, Switzerland) and accompanying software were used for visualization and quantification. A region of interest in the area of the mandibular condyle was selected, and histomorphometric values including bone volume fraction (BV/TV), trabecular thickness (Tb.Th), trabecular separation (Tb.Sp), and trabecular number (Tb.N) were assessed.
Histological Sample Preparation
After scanning analysis with the micro-CT system, the mandibular condyle was completely separated and fixed in 4% PFA at 4°C overnight. They were decalcified with 10% (wt/vol) ethylenediaminetetraacetic acid (EDTA; pH 7.4) and then embedded in paraffin with automatic equipment. The paraffin section was approximately 4-μm thick paralleling to the long axis.
Immunohistochemistry and Immunofluorescence Staining
The used antibodies were rabbit anti-EDA (1:200; Bioss, Beijing, China), rabbit anti-EDAR (1:200; Proteintech, Rosemont, IL, USA), and rabbit anti-EDARADD (1:200; Biobyt, Wuhan, China). The slides were visualized with a DAB detection kit and stained with methyl green (Sigma-Aldrich). For immunofluorescence staining, the used primary antibodies were rabbit anti-collagen type II (Col-II 1:200; Boster, Wuhan, China), rabbit anti-aggrecan (1:200; Boster), mouse anti-SOX9 (1:200; Proteintech), mouse anti-cathepsin K (Ctsk, 1:50, Santa Cruz, Dallas, TX, USA), and rabbit anti-osteocalcin (OCN, 1:200; Boster). Subsequently, the slides were incubated with DyLight 594-conjugated goat anti-mouse IgG (1:500; Invitrogen, Carlsbad, CA, USA) or DyLight 594/488-conjugated goat anti-rabbit IgG (1:500; Invitrogen) followed by 4ʹ,6-diamidino-2-phenylindole (DAPI) (1:800; Sigma-Aldrich).
Cell Culture
ATDC5 cells were cultured in a 1:1 mixture of Dulbecco’s Modified Eagle Medium/F-12 (Invitrogen) supplemented with 5% fetal bovine serum and maintained at 37°C in a 5% CO2 environment. The cells reached confluence after 5 days of culturing, and Insulin-Transferrin-Selenium Supplement (Invitrogen) was added for 21 days to induce chondrogenic differentiation and maturation. All serum- or supplement-containing media were replaced every 2 days.
RNA Extraction and Quantitative Real-Time Polymerase Chain Reaction
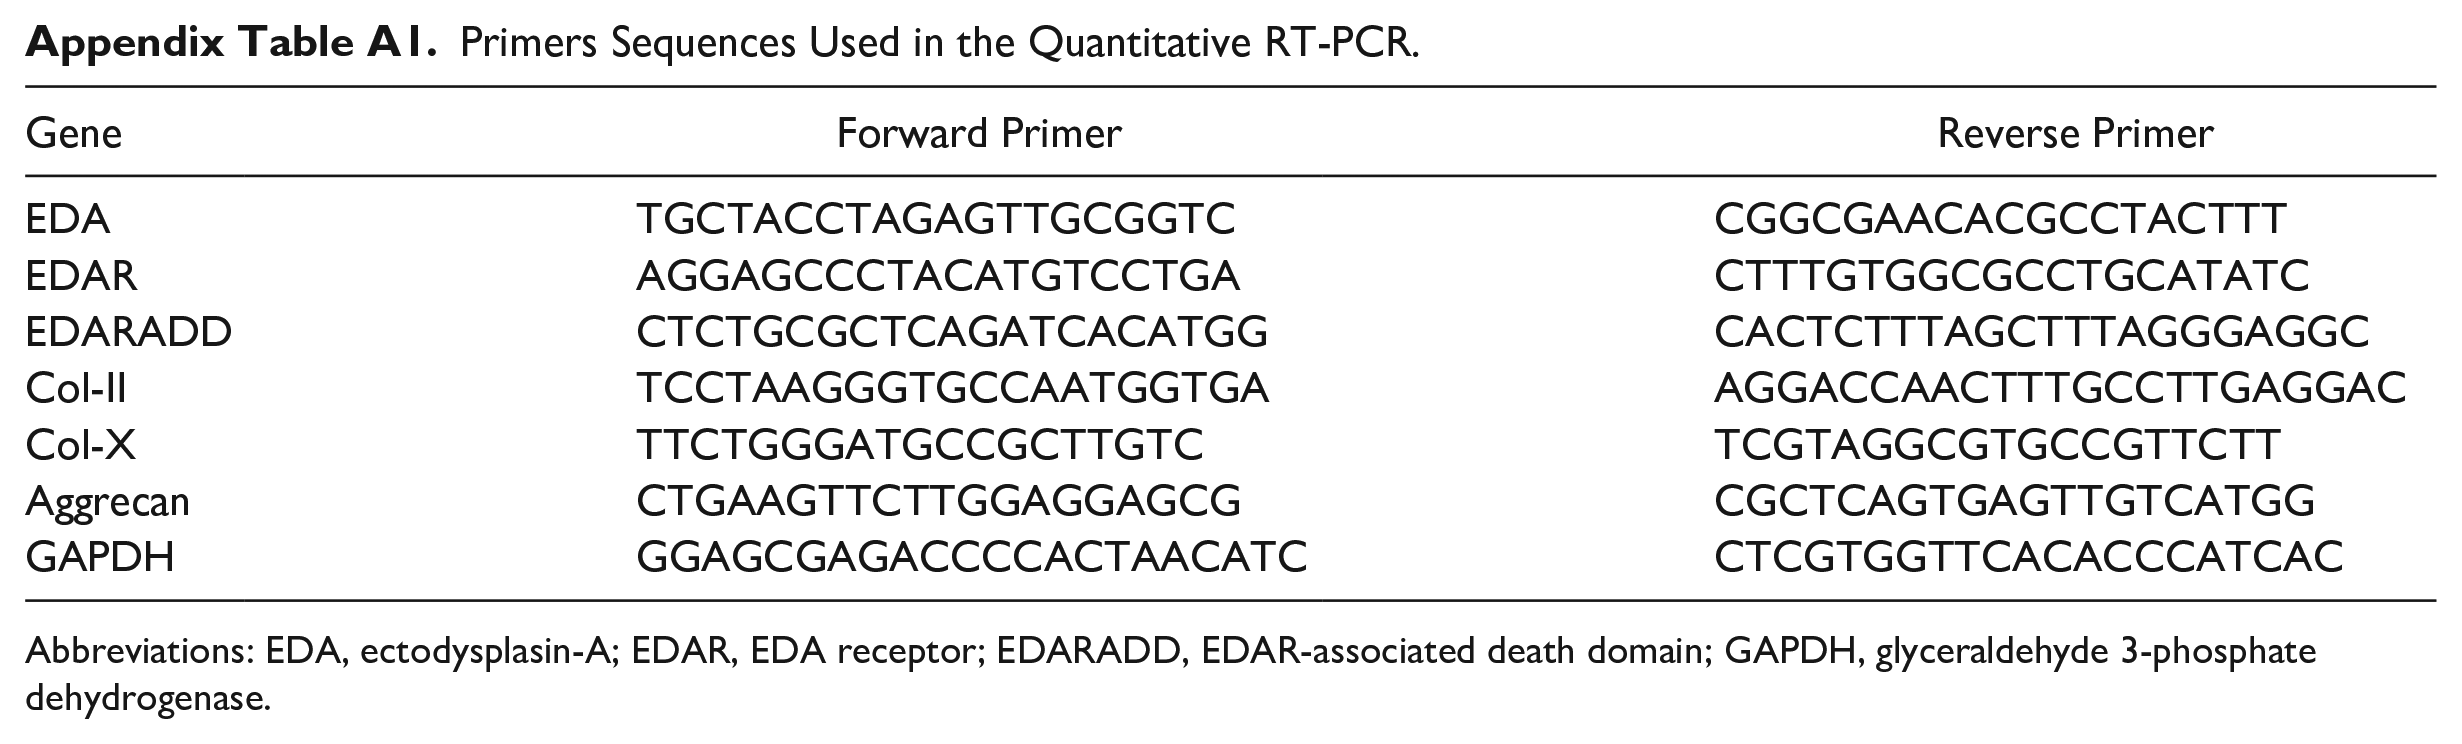
Mandibular condyles harvested from mice aged PN1d to PN12w were homogenized using a homogenizer (Tissuelyser-24, Jingxin). ATDC5 cells were cultured as previously described. RNA was extracted from both cultured cells and mandibular tissue using Trizol Reagent (TaKaRa, Otsu, Japan) according to the manufacturer’s instructions. The purity and concentration of the RNA samples were tested using a NanoDrop2000 spectrometer (NanoDrop Technology, USA). Using the PrimeScript RT reagent Kit with gDNA Eraser (TaKaRa), 1000 ng of RNA was transcribed into first-strand cDNA. Utilizing Applied Biosystems QuantStudio 6 with SYBR Premix Ex Taq II kit (TaKaRa), quantitative real-time polymerase chain reaction (PCR) was carried out in triplicate. The amplification profile consisted of 30 seconds at 95°C, followed by 45 cycles of 10 seconds at 95°C and 35 seconds at 62°C. PCR primers were purchased from Sango Biotech (Shanghai, China). GAPDH was used for normalization, and mRNA expression levels were calculated using the 2−ΔΔCT method. The sequences of the primers used were listed in Appendix Table A1.
Protein Extraction and Western Blot Assay
Cells from various groups were washed three times with phosphate-buffered saline before being harvested in RIPA buffer containing a protease inhibitor. The cells were quickly scraped off with a spatula on ice and transferred to an eppendorf tube. Following an ultrasonic disruption, they were centrifuged at 12,000 r/min and 4°C for 15 minutes. The supernatant contained the whole protein extract. A protein standard curve was constructed using the bicinchoninic acid method, and the protein concentration was measured and calculated. Proteins were separated using a 10% gel and transferred to a polyvinylidene fluoride (PVDF) membrane (Millipore, Boston, MA, USA). The membrane was incubated in 5% skim milk for 1 hour. The PVDF membranes were incubated with rabbit anti-EDA antibody (1:500; Bioss), rabbit anti-GAPDH antibody (1:1000; CST, Danvers, MA, USA), and goat anti-rabbit IgG secondary antibody (1:2000; Proteintech). Protein bands were visualized using enhanced chemiluminescence (ECL) and analyzed with Gel-Pro analyzer software.
Statistical Analysis
Results were representative examples of more than three independent experiments as mean ± SD for absolute values. For comparison between multiple groups, one-way analysis of variance was used, and the groups with significant differences were compared in pairs. P<0.05 means that the difference between the samples was statistically significant (*means p<0.05, ** means p<0.01, and *** means p<0.001). Statistical analysis was performed using SPSS software 22. 0 (SPSS Inc., Chicago, IL, USA).
Results
Histological Changes in the Development of the Condyle
Hematoxylin and eosin (HE), toluidine blue (TB), and modified safranine O-fast green staining revealed that the condyle of mice at PN1d exhibited a pointed round shape, with the thickness of the condylar chondrocyte layer (except mast chondrocytes) being approximately 10 cell layers (Fig. 1A to C). At PN1w, the width of the condylar cartilage had significantly increased, especially in the hypertrophic layer (Fig. 1D to F). At PN2w, each layer of cartilage cells could be identified. From the tip of the condyle, the following clear layers were observed: (1) fibrous layer; (2) proliferating layer; (3) mature layer; (4) hypertrophic layer; and (5) calcified cartilage layer. In addition, some cells in the hypertrophic layer appeared vacuolated (Fig. 1G to I).
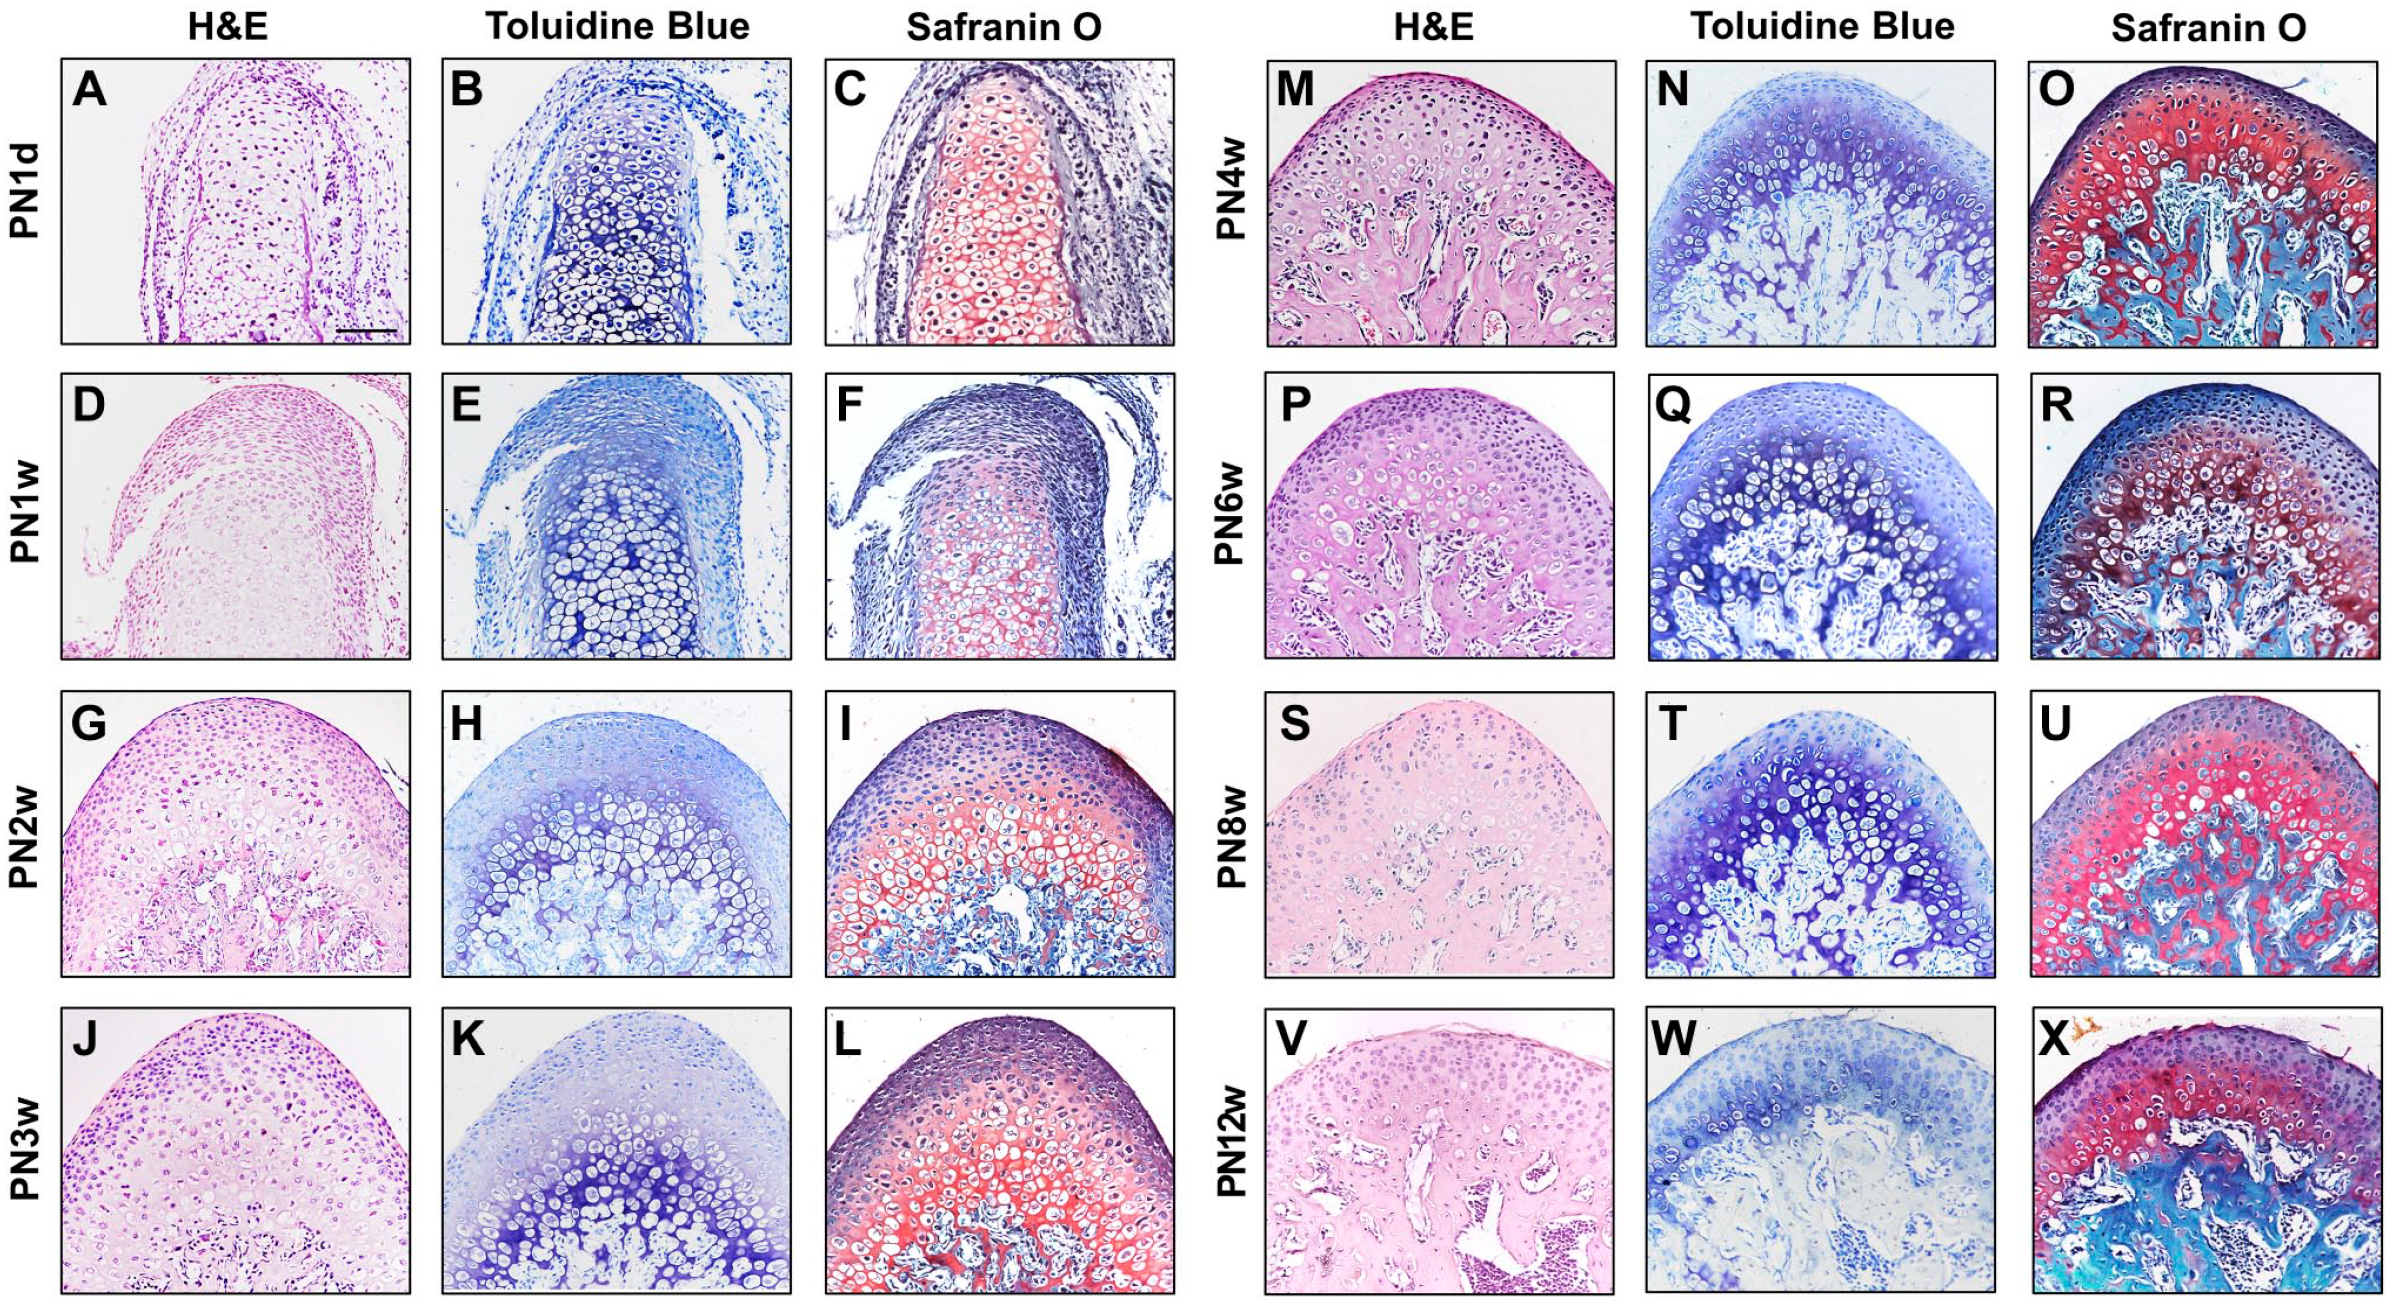
Mandibular condyles in PN1d, PN1w, PN2w, PN3w, PN4w, PN6w, PN8w, PN12w of C57 mice were examined by hematoxylin-eosin (H&E) staining (A, D,G,J,M,P,S,V), toluidine blue (TB) staining (B, E,H,K,N,Q,T,W), and Safranine O-Fast Green staining (C, F,I,L,O,R,U,X). Bars = 100 μm.
At PN3w, cartilage stratification was more pronounced, with significantly thicker cartilage and wider proliferative and hypertrophic layers compared to PN2w (Fig. 1J to L). At PN4w, the condylar cartilage had reached its proper width, and its thickness was reduced along the major longitudinal axis. The proliferative layer was barely visible, and noticeable mineralized bone tissue was present below the hypertrophic layer. (Fig. 1M to O).
The condylar cartilage stratification was obvious at PN6w (Fig. 1P to R). Modified safranine O-fast green staining demonstrated that the extracellular matrix enriched the intercellular space. The apical part of the condyle was mostly occupied by mast layer cells, whereas the number of superficial, proliferative layer cells decreased further at PN8w (Fig. 1S to U). At PN12w, the condylar morphology appeared more flattened. The articular cartilage (excluding hypertrophic chondrocytes) consisted of a superficial cell zone with a thickness of 2 to 3 cell layers thick (Fig. 1V to X).
Expression of EDA Pathway-Related Members During Condylar Development
At PN1d, EDA protein was mainly expressed in the hypertrophic, proliferating, and fibrous layers (Fig. 2A and A’). It was located in the proliferative chondrocytes and cell membrane of hypertrophic chondrocytes. In contrast, EDAR and EDARADD were weakly positive expression (Fig. 2I, I’, Q, and Q’). The expression levels of all three proteins began to increase from PN1w onward. EDA was expressed specifically in the centrally differentiated chondrocytes and extracellular matrix, while EDARADD was detected in differentiating cells and surrounding undifferentiated cells of the condylar cartilage. At this stage, the level of expression of EDAR increased but remained relatively low (Fig. 2B, B’, J, J’, R, R’, and Y). At PN2w, the expression of the three proteins gradually became weaker in the hypertrophic layer. EDA, EDAR, and EDARADD were mainly detected in the nucleus of the cells in fibrous and proliferative layers. In addition, qRT-PCR revealed that the mRNA expression levels of EDA, EDAR, and EDARADD increased (Fig. 2C, C’, K, K’, S, S’, and Y).
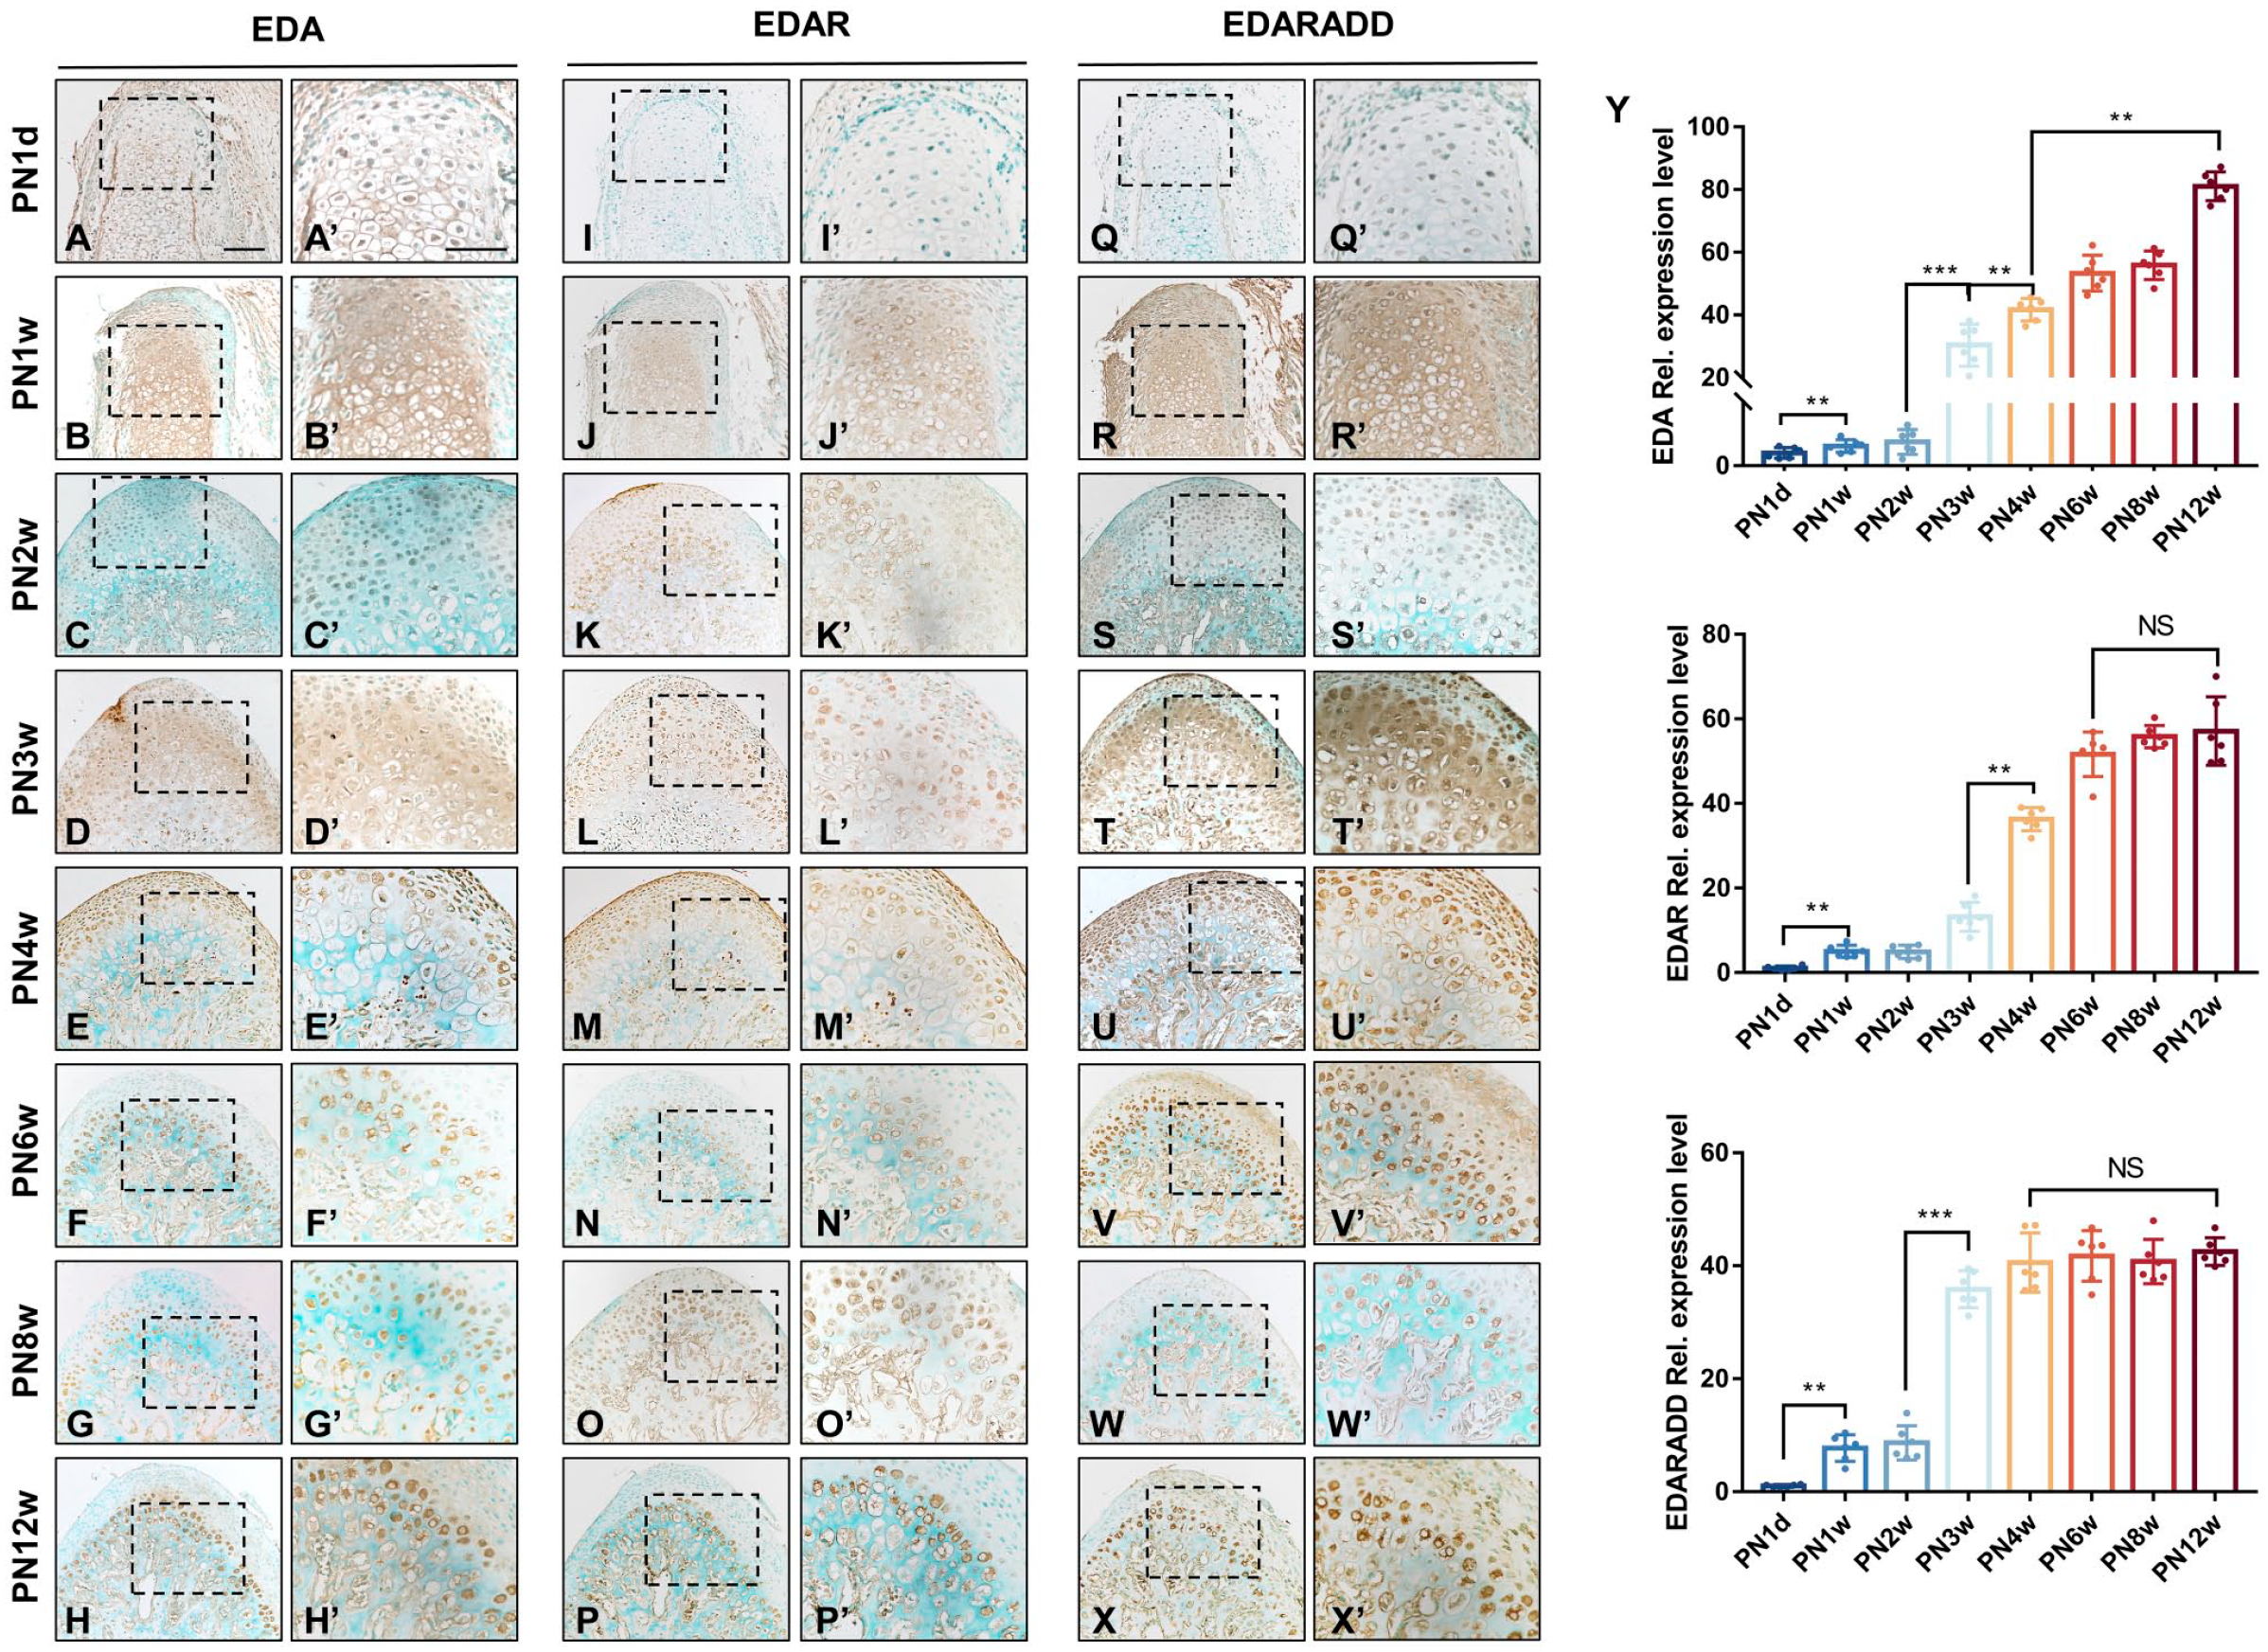
The distribution and Quantitative-real time PCR of EDA, EDAR, EDARADD in postnatal mouse mandibular condyle from PN1d to PN12w. (A-H) showed immunochemistry of EDA, (I-P) showed immunochemistry of EDAR, (Q-X) showed immunochemistry of EDARADD. (A’-X’) corresponds to (A-X). Brown indicates positive staining for EDA, EDAR and EDARADD; green, methyl green counterstain. Bars = 100 μm. (Y) The relative expression of mRNA for EDA, EDAR, EDARADD were represented as a fold increase over the GAPDH expression. Values were the mean ± SEM with a minimum n=6 for each group studied. Abbreviation: EDA, ectodysplasin-A; EDAR, EDA receptor; EDARADD, EDAR-associated death domain; GAPDH, glyceraldehyde 3-phosphate dehydrogenase; PN1d, postnatal day 1; PN12w, postnatal 12 weeks; GAPDH, glyceraldehyde 3-phosphate dehydrogenase.
At PN3w, they were mostly concentrated in the proliferative and mature layers and were also expressed in the extracellular matrix (Fig. 2D, D’, L, L’, T, and T’). The mRNA expression level of EDA significantly changed from PN3w to PN4w, and the distribution of EDA also underwent noticeable alterations. At PN4w, EDA was shifted in the fibrous, mature, and proliferative layers. EDAR and EDARADD were also detected in the nucleus of the fibrous, mature, and proliferative layer (Fig. 2E, E’, M, M’, U, U’, and Y). From PN6w, the expression of EDA, EDAR, and EDARADD gradually weakened in the fibrous and proliferative layers (Fig. 2F, F’, G, G’, H, H’, N, N’, O, O’, P, P’, V, V’, W, W’, X, and X’). Their distributions were confined to the mature and hypertrophic layers near the subchondral bone. Consistent with the expression patterns of their mRNAs, their expression levels increased gradually. This expression pattern persisted until condylar maturation (Fig. 2Y).
Altogether, the expression of EDA, EDAR, and EDARADD proteins was observed at all examined stages. As the condylar cartilage matured, the distribution of EDA tended to be confined to the hypertrophic layer. The expressions and distributions of EDA, EDAR, and EDARADD remained consistent. The mRNA expression level of EDA pathway-related components increased gradually, with mRNA expression of EDAR and EDARADD exhibiting a similar trend.
Changes in the Expression of Col-II, Aggrecan, and Sox9 in the Condylar Cartilage
Extracellular matrix components play an important role in resisting compression forces and maintaining the tensile properties of the tissue. Therefore, we also observed changes in the expression of extracellular matrix during condylar development in mice. Immunofluorescence staining of Col-II and aggrecan in each age group showed red cytoplasm without nucleus coloration and strong positive expression of Col-II and aggrecan (Fig. 3A and B). Col-II was mainly distributed in the mature and hypertrophic layers, with no expression in the fibrous and proliferating layers (Fig. 3A). Aggrecan was also observed in the proliferating layer during the early stage, and later became concentrated in the hypertrophic layer (Fig. 3B). Both Col-II and aggrecan gradually increased from PN1d, with the highest thickness at PN3w. At PN4w, thickness decreased after the onset of mastication but was still in active synthesis with peak proliferation. At PN6w, both Col-II and aggrecan were present in significant amounts. From PN8w, their expression continued to decrease as part of age-related changes. Sox9-positive cells were detected in the fibrous and proliferating layers at PN1d. The number of these positive cells decreased over time (Fig. 3C).
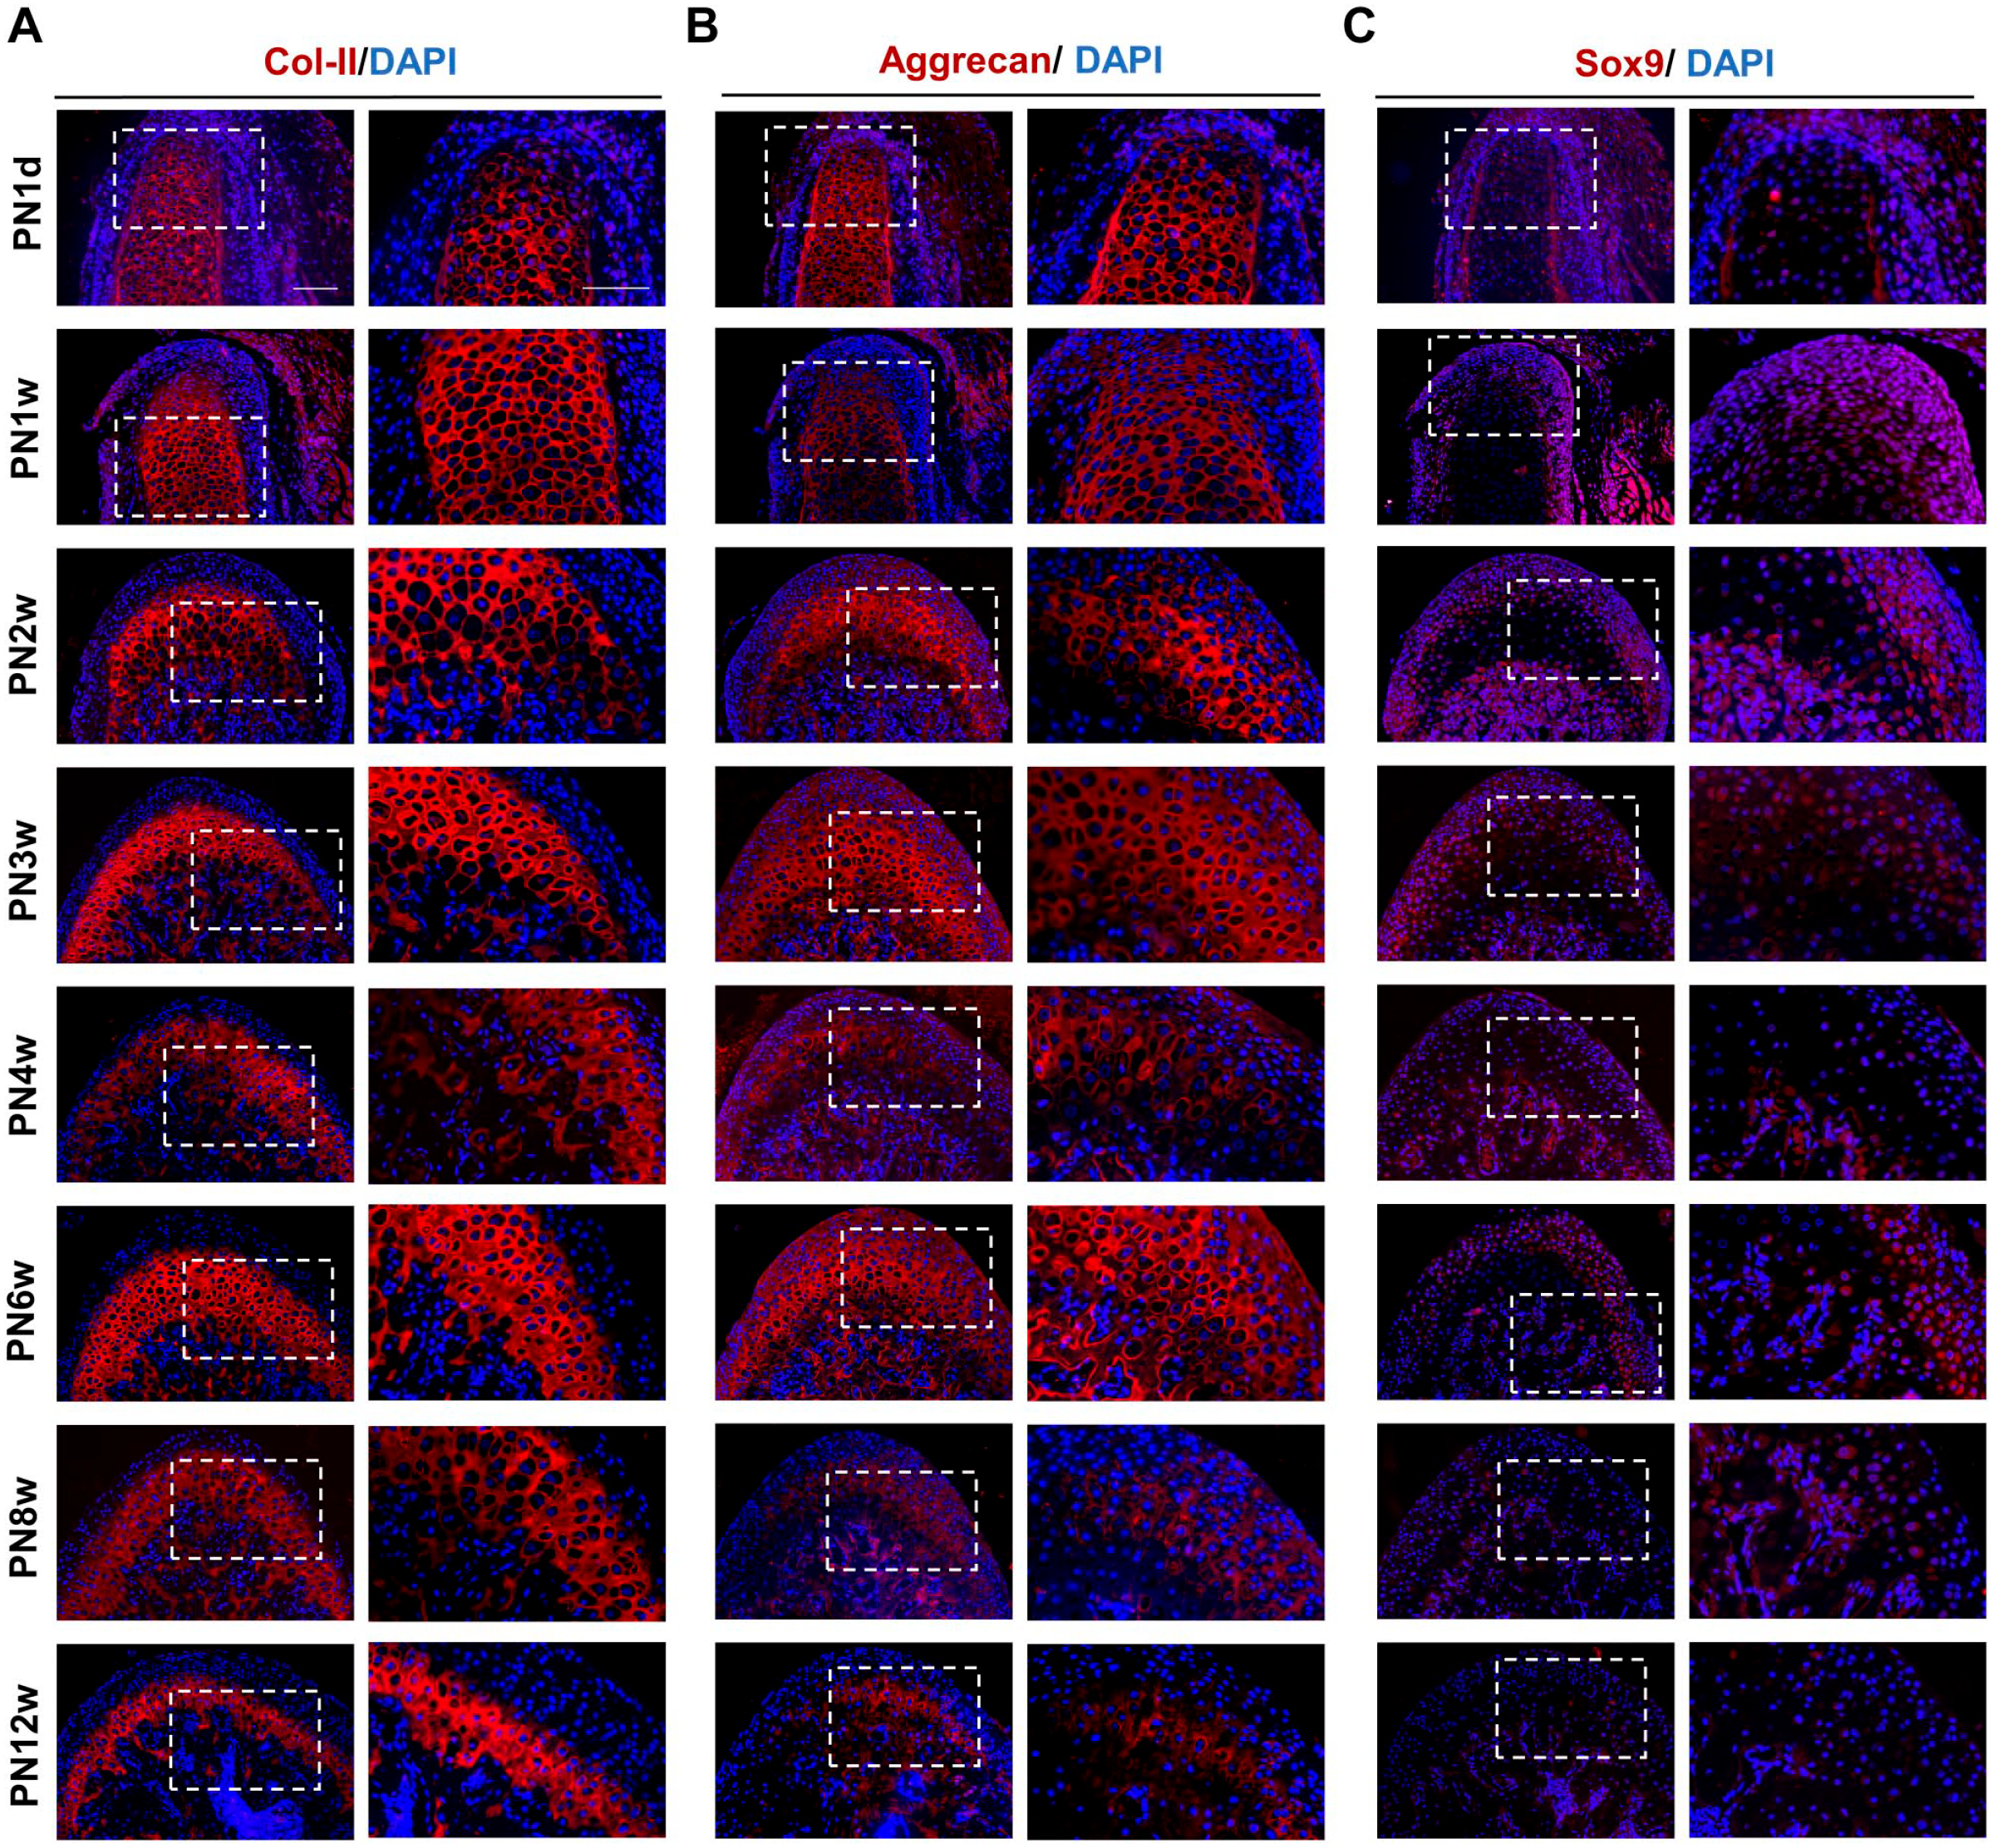
Immunofluorescence for Col-II. (A) for aggrecan (B) for Sox9 (C) in postnatal mouse mandibular condylar cartilage from PN1d to PN12w. Bars = 100 μm. Abbreviation: PN1d, postnatal day 1; PN12w, postnatal 12 weeks.
Changes in Osteogenesis and Osteoclastic Processes During Condylar Development
In our study, osteoclasts were relatively active throughout the development of the condyle, as demonstrated by TRAP staining and detection of CTSK-positive cells (Fig. 4A and B). At PN3w, mice were in a dissociative phase and experienced a change in diet structure. Osteoclast activity peaked at this stage. By PN8w, the number of osteoclasts increased to a high level once again, and the condylar morphology was essentially stabilized by that point (Fig. 4D).
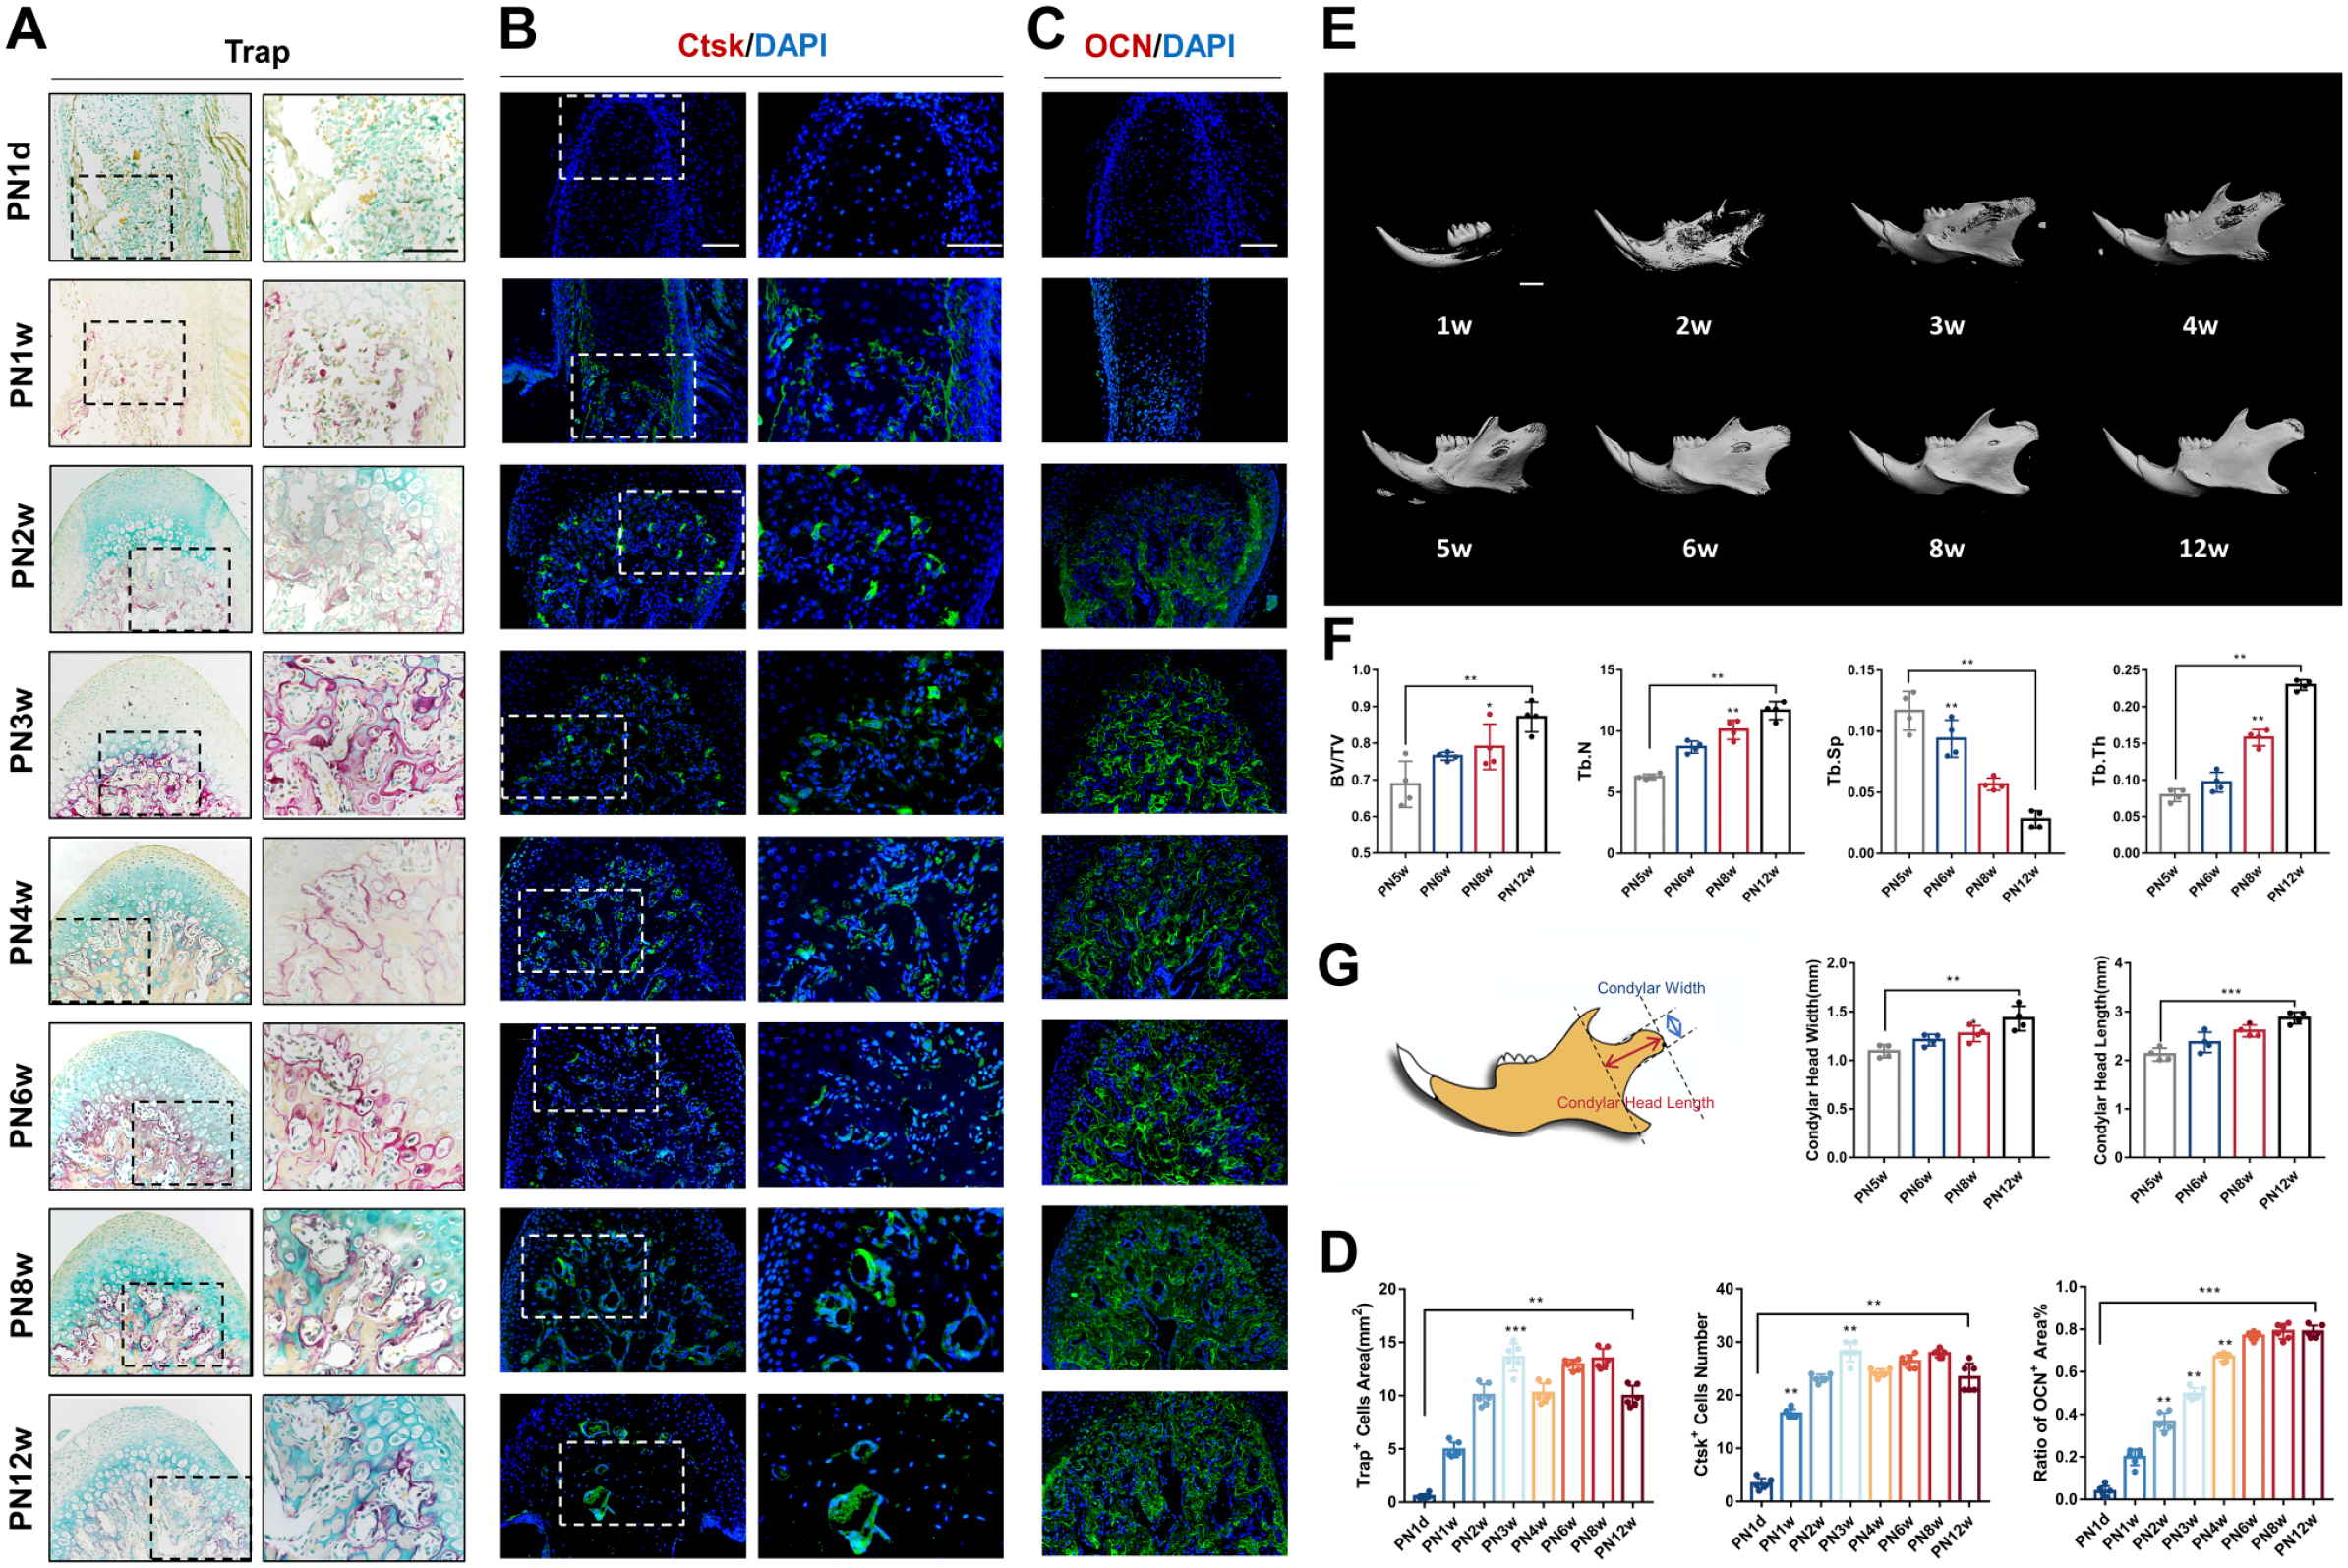
Osteoclasts and osteogenesis in postnatal mouse mandibular condylar cartilage from PN1d to PN12w. (A) Tartrate-resistant acid phosphatase (TRAP) staining and (B) The immunofluorescence staining of Ctsk indicated that the osteoclast number and activity in mandibular condyles. (C) The immunofluorescence staining of osteocalcin (OCN) indicated that subchondral bone osteoid formation. (D) Analysis of Trap-positive cell area, Ctsk-positive cells number and ratio of OCN-positive area in PN1d to PN12w. Bars = 100 μm. Micro–computed tomography (CT) images and analysis of the mandibular condyles. (E) Three-dimensional reconstruction of the mandibular condyle in PN1w, 2w, 3w, 4w, 5w, 6w, 8w, and 12w. (F) Bone volume fraction (BV/TV), trabecular number (Tb.N), trabecular separation (Tb.Sp) and trabecular thickness (Tb.Th) were calculated from the selected subchondral cubes (n=4). (G) Schematics graph and height of condyle. Bars = 1.0 mm. Abbreviation: PN1d, postnatal day 1; PN12w, postnatal 12 weeks.
OCN expression was not observed before PN1w but was detected from PN2w onwards in the subchondral bone (Fig. 4C). The 3D reconstruction of Micro-CT scanning revealed that at PN2w, part of bone trabeculae had formed. At PN3w, significant increase was observed in the mineralization of the subchondral bone in the condyle. The subchondral bone of the condyle continued to mineralize. The increase in length and width persisted until condyle maturation (Fig. 4E and G).
Bone volume analysis showed a continuous increase in BV/TV, Tb.N, and Tb.Th, indicating that bone volume followed a growth pattern. Tb.Sp displayed a reverse relationship with time, suggesting that bone trabeculae underwent orderly and densified development modifications (Fig. 4F). Generally, as the mice aged from 3 to 12 weeks, the condylar cartilage became thinner, whereas the subchondral bone became larger and thicker.
EDA Expression During Chondrogenic Maturation in ATDC5 Cells
To further investigate EDA expression during maturation and differentiation of chondrocyte, we cultured in vitro ATDC5 cells, a mouse chondrogenic cell line. Alcian Blue staining on 21 days proved that chondrogenic induction was effective (Fig. 5A). Cellular immunofluorescence showed EDA-positive expression in ATDC5 cells after 21 days of chondrogenic-induced culture (Fig. 5B).
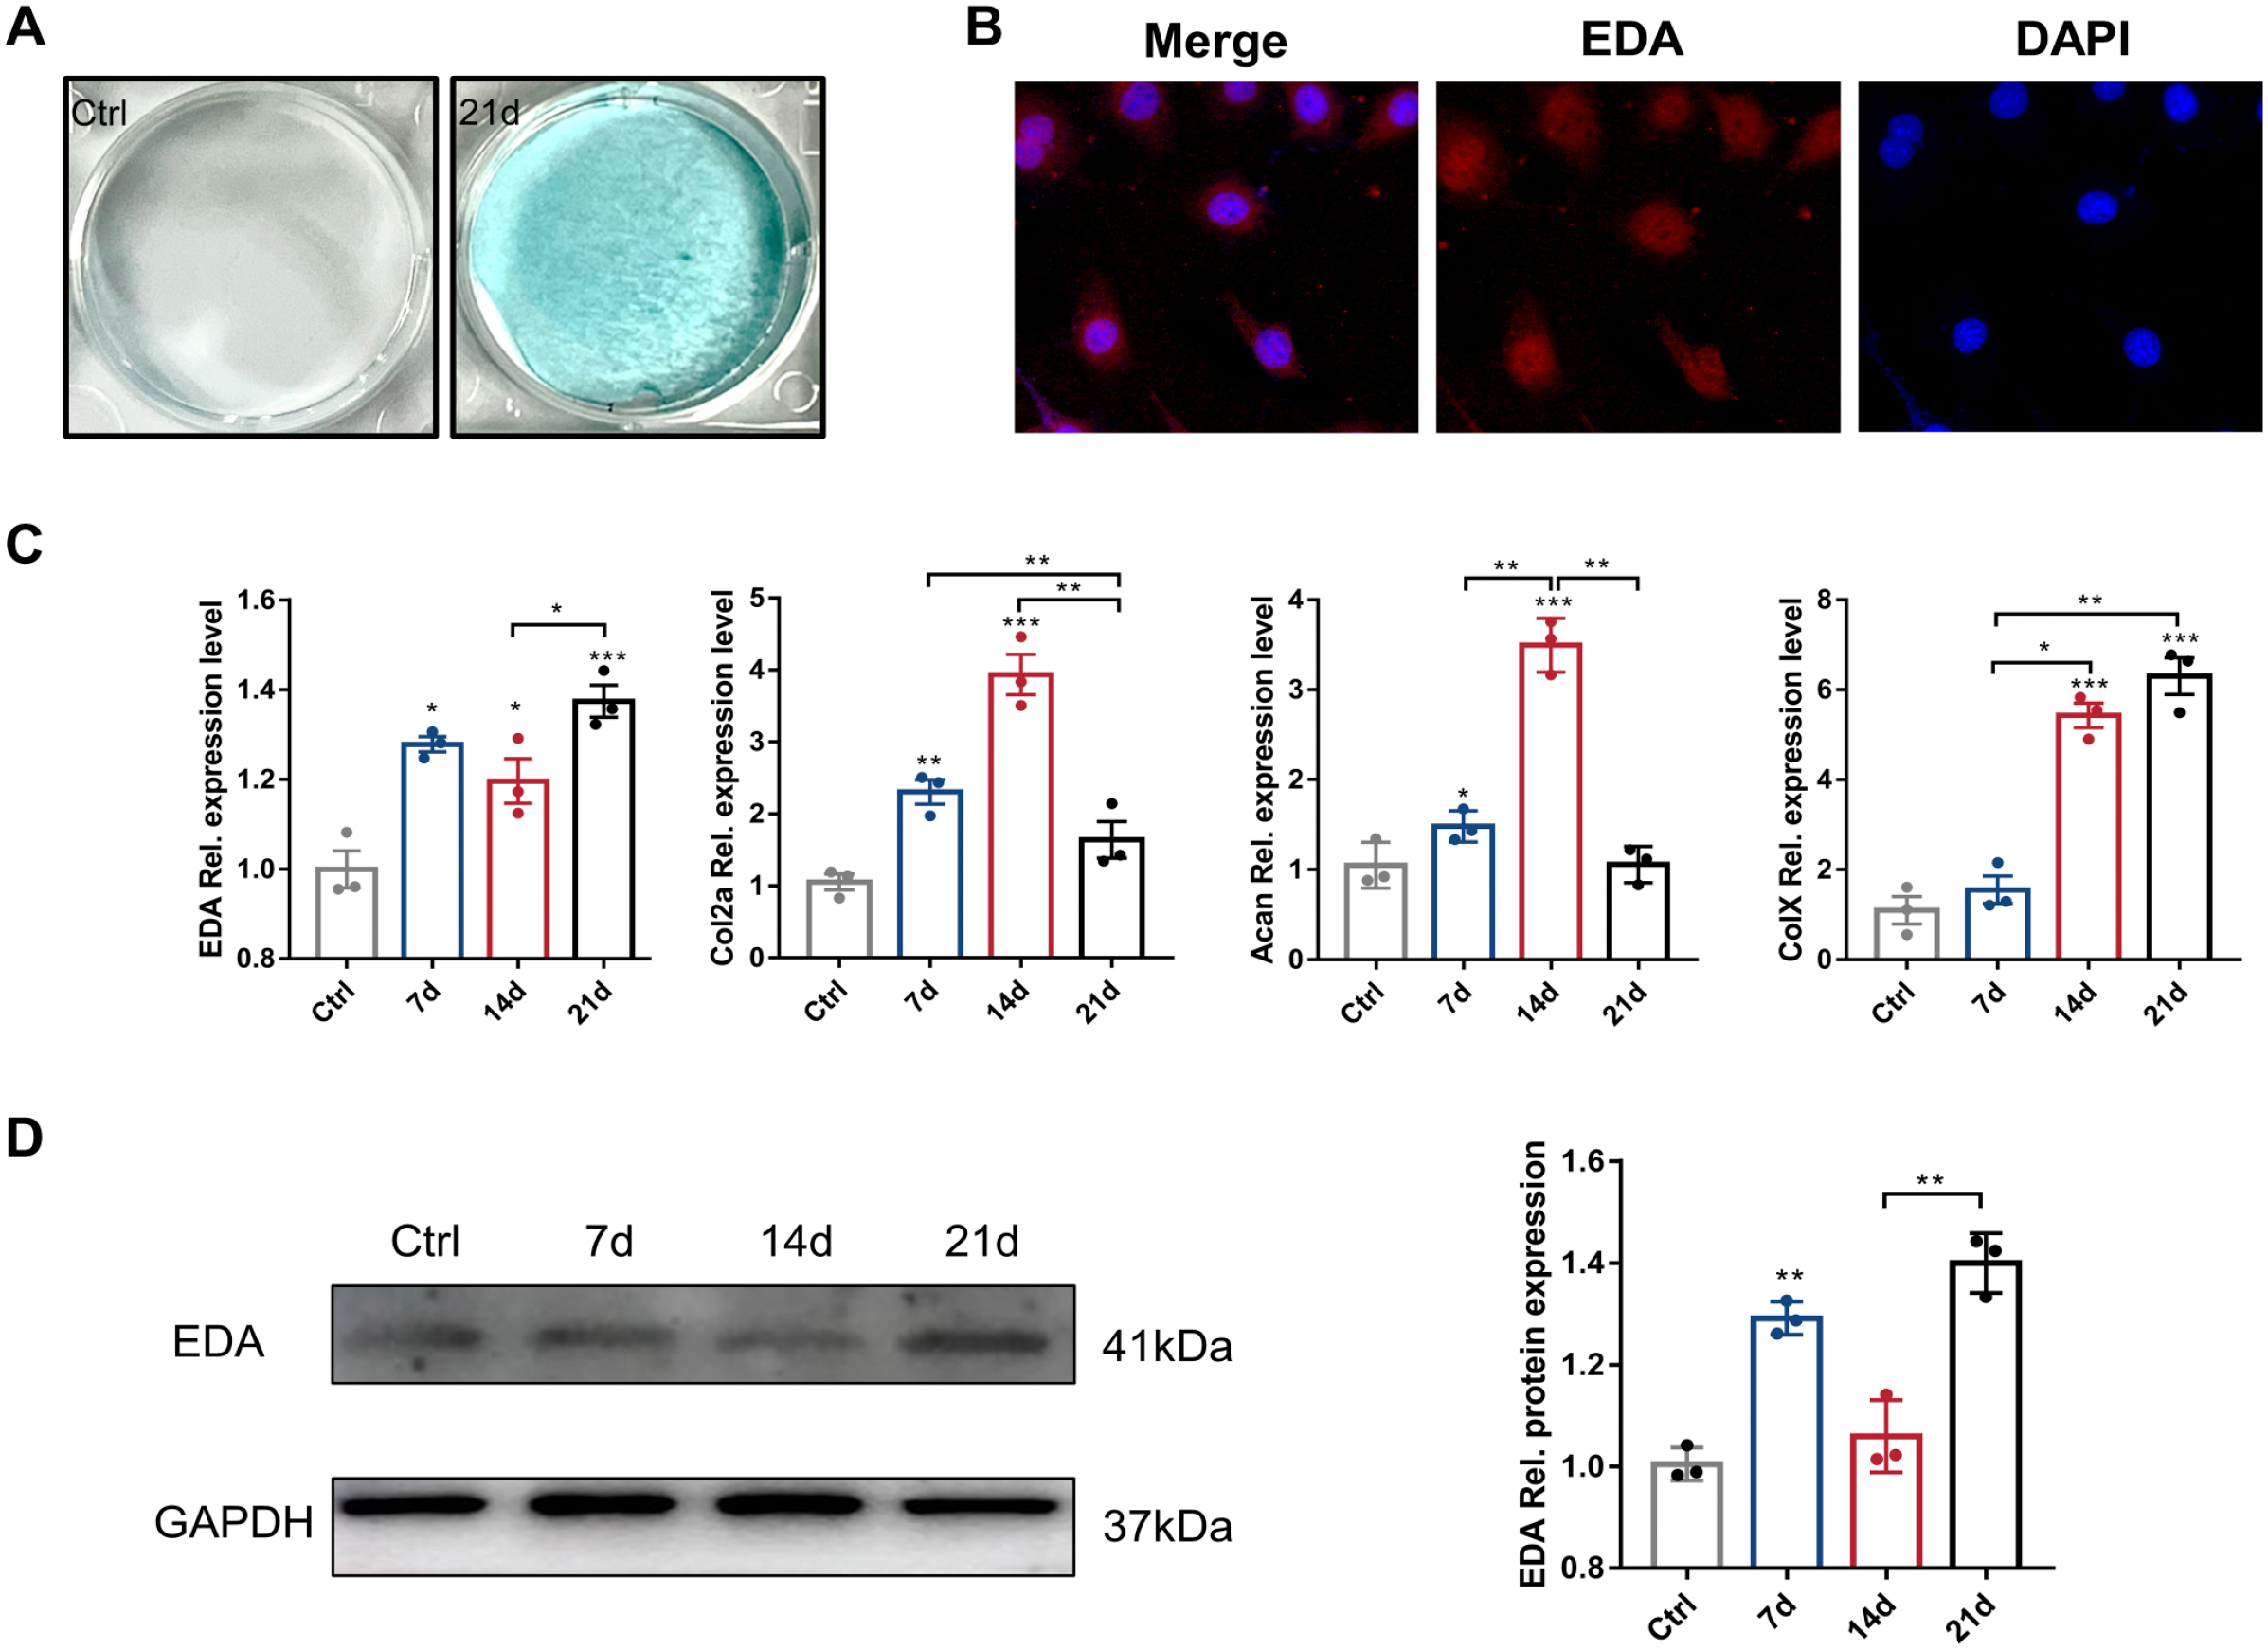
Detection of EDA in ATDC5 cells. (A) On day 21, Alcian bule staining was used to detect chondrogenesis induction. (B) The immunofluorescence staining of EDA (red) in ATDC5 cells. (C) The relative mRNA expressions of EDA, aggrecan, Col-II, and Col-X in ATDC5 cells on days 7, 14, and 21 during the culture period. (D) In vitro, the protein was extracted from the ATDC5 cell line. Protein levels of EDA were detected by Western blot. Bars = 100 μm. Abbreviation: EDA, ectodysplasin-A.
The mRNA expression level of EDA was elevated in ATDC5 cells at the early stage of chondrogenesis (Fig. 5C). On 14 days, the expression of EDA significantly decreased, but then significantly increased on 21 days compared to that on 0 and 7 days. The expression of Col-II increased gradually in ATDC5 cells, peaking on 14 days. On 21 days, the expression of Col-II tended to decrease. The expression pattern of aggrecan was similar to that of Col-II. The mRNA expression level of Col-X significantly increased on 14 days and continued to increase on 21 days compared to that on 0 and 7 days. Western blotting showed that EDA protein expression was consistent with its mRNA expression (Fig. 5D).
Discussion
This study showed the histological and morphological changes in postnatal mice condyle and the distribution of EDA pathway-related proteins during condylar development for the first time. In addition, we also investigated the development of the extracellular matrix, osteogenesis, and osteoclastic processes in the subchondral bone. Our results revealed a specific spatiotemporal pattern in the distribution of EDA, EDAR, and EDARADD, as well as different but similar changes in gene expression levels at different developmental stages. This study suggested that EDA was associated in mandibular condylar development.
Emerging evidence demonstrates that the EDA signaling pathway not only plays roles in ectoderm development and maintenance but also involves in regulation of cancer cell processes, nonalcoholic fatty liver disease (NAFLD), and type II diabetes, highlighting the diverse roles it plays in biological processes.14,15 Meanwhile, patients with XLHED also present changes in craniofacial structural measurements.16,17 Studies have showed that mandibular growth retardation is another craniofacial manifestation in patients with EDA mutations. 18 In addition, patients with XLHED have structural changes in the jawbone, including localized increases in alveolar and mandibular bone density, as well as excessive cortication. 19 Tabby mice also have skeletal phenotypes, including spontaneous caudal fractures associated with epiphyseal and subepiphyseal dysplasia, and bone architecture defects with increased bone connection. 20 Considering these findings, we speculated that EDA mutations might be involved in mandibular development.
It was reported that mRNA expression of EDA was detected in rib osteoblasts, but not in the chondrocytes and hypertrophic chondrocytes of the developing rib at week 12 of gestation. 21 The difference between our results can be attributed to the fact that the mandibular condylar cartilage is secondary cartilage, while rib cartilage is primary cartilage. Although the two cartilage tissues share similarities in histological structure, they differ in terms of progenitor cell origin and cell differentiation. In particular, condylar chondrocytes differentiate from cranial neural crest cells. 22 Moreover, unlike most articular cartilage, the condylar cartilage consistes of fibrocartilage, whereas it is hyaline cartilage in other synovial joints. 23
Studies have illustrated that EDA is involved in various signaling pathways such as wingless-associated integration site (Wnt)/β-catenin, fibroblast growth factor (FGF) pathways and bone morphogenetic protein (BMP) signaling pathways.13,24,25 These pathways are also necessary for the regulation of differentiation and function of chondrocyte. 26 In addition, NF-κB signaling pathway, the EDA downstream, is widely involved in the pathological process of temporomandibular osteoarthritis. 27
We noticed that mutations in paired box 9 (Pax9) can lead to nonsyndromic hypodontia. 28 Pax9-deficient mice also exhibit craniofacial and limb abnormalities, including cleft of the secondary palate, absence of mandibular coronoid process and lack of pharyngeal pouch.29–31 Studies have demonstrated that Pax9 is required for skeletal development of skull and larynx and is also involved in pattern formation in the developing limb, especially during chondrogenesis.31,32 Pax9-dependent signaling is functionally integrated with EDA signaling during odontogenesis. 33 Treatment with anti-EDAR agonist antibody has been reported to resolve palate defects in Pax9-/- mice, suggesting that the EDA/EDAR signaling pathway is downstream of Pax9. 34 There may be a unique interaction between Pax9 and the EDA signaling pathway that can be further exploited for the development of craniofacial complex.
Our findings revealed that the development of condylar cartilage was a dynamic process, which was not only affected by genetic factors, but also by mechanical stress. 35 Mice were weaned after PN3w and began to chew themselves, which led to the decrease in thickness of condylar cartilage observed at PN3w. In our study, at PN3w, EDA pathway-related proteins were mainly distributed in the proliferative layer, while at PN4w, the distribution shifted to the hypertrophic layer. We speculated that this shift was caused by the stimulation of occlusal forces. Further research was needed to determine whether stress stimulation from chewing and eating can affected the expression of EDA pathway-related proteins.
In the extracellular matrix of condylar cartilage, collagen and proteoglycans interacted with each other to build a networked scaffold structure. 36 Col-II is the major form of collagen and interacts with aggrecan to stabilize the lattice-like structure of condylar cartilage. 37 Aggrecan contains large chains of negatively charged polysaccharides, which enable proteoglycans to trap water. Consequently, aggrecan plays a key role in promoting the structural and functional integrity of the extracellular matrix. 38 Our findings were consistent with others, as we found that aggrecans were mainly located in the hypertrophic and mature layers of the cartilage.2,39 Sox9, an important transcription factor for chondrocyte differentiation, is locally expressed in chondrogenic regions. 40 It directly regulates chondrogenesis-specific genes, promoting the synthesis of aggrecan and Col-II.41,42 Upregulation of Sox9 can induce the formation of ectopic cartilage. 43
The development of the mandibular condyle includes two stages of cartilage and bone formation. 44 At PN2w, hypertrophic chondrocytes underwent endochondral ossification to form bone, and a small amount of bone trabeculae was formed, which was consistent with previous findings. 45 During endochondral osteogenesis, chondrocyte proliferation needed to be simultaneous with osteoclast-induced resorption of calcified cartilage septum to ensure mandibular bone development.46,47 Furthermore, prehypertrophic chondrocytes changed into hypertrophic cartilage while secreting extracellular matrix and mineralizing it. The bone-like tissue gradually increased, and some chondrocytes began to degrade. 48 In our study, TRAP-positive cells were highly active throughout condylar development, indicating that osteoclast-induced resorption of calcified cartilage matrix was essential for sustained formation of endochondral bone.
Our study demonstrated that there was a huge potential for study of EDA signaling pathway in condylar development. This study had some limitations. Although the spatiotemporal distributions of EDA signaling pathway-related proteins were assessed, the underlying mechanisms were not explored. In addition, the prenatal expression patterns of these proteins were not investigated. It would be better that mouse model to specifically knock out EDA in chondrocytes was constructed to explore the role of EDA in regulating chondrocyte in vivo. We would continue to focus on and elucidate the specific regulatory mechanism underlying this process.
Footnotes
Appendix
Primers Sequences Used in the Quantitative RT-PCR.
| Gene | Forward Primer | Reverse Primer |
|---|---|---|
| EDA | TGCTACCTAGAGTTGCGGTC | CGGCGAACACGCCTACTTT |
| EDAR | AGGAGCCCTACATGTCCTGA | CTTTGTGGCGCCTGCATATC |
| EDARADD | CTCTGCGCTCAGATCACATGG | CACTCTTTAGCTTTAGGGAGGC |
| Col-II | TCCTAAGGGTGCCAATGGTGA | AGGACCAACTTTGCCTTGAGGAC |
| Col-X | TTCTGGGATGCCGCTTGTC | TCGTAGGCGTGCCGTTCTT |
| Aggrecan | CTGAAGTTCTTGGAGGAGCG | CGCTCAGTGAGTTGTCATGG |
| GAPDH | GGAGCGAGACCCCACTAACATC | CTCGTGGTTCACACCCATCAC |
Abbreviations: EDA, ectodysplasin-A; EDAR, EDA receptor; EDARADD, EDAR-associated death domain; GAPDH, glyceraldehyde 3-phosphate dehydrogenase.
Acknowledgements
Financial support was provided by the Shanghai Municipal Health Commission, General Project (grant no: 202140357)
Competing Interests
The author(s) declared no potential conflicts of interest with respect to the research, authorship, and/or publication of this article.
Author Contributions
Data acquisition, Analysis, Methodology, Writing—original draft the manuscript (LX). Software, Validation, Formal analysis (YL). Formal analysis, Writing—review & editing (JW). sample processing and data acquisition (CS). Conceptualization, Project administration, Supervision, Writing—editing (BJ). All authors gave final approval and agreed to be accountable for all aspects.
Funding
The author(s) disclosed receipt of the following financial support for the research, authorship, and/or publication of this article: This study received grants from Shanghai Municipal Health Commission, Grant Number: 202140357.