
Abstract
We tracked prosaposin (PSAP), a trophic factor, using an antibody specific to its proteolytic portion and an antibody to sortilin that traffics PSAP only to the lysosome. Immunostaining revealed that PSAP was distributed mainly on the basal side of seminiferous tubules, where many Sertoli cells and pachytene spermatocytes contained PSAP and its distribution differed depending on the stage of the spermatogenic cycle. The PSAP–sortilin complex was sorted to large lysosomes in the basal cytoplasm of Sertoli cells, where it may be processed into saposins. In contrast, in the thinner apical cytoplasm of Sertoli cells, PSAP in small lysosomes was transported to the apical side around sperm heads or into the lumen for secretion. The results of in situ hybridization analyses suggested that immature tubular cells in young animals produce PSAP to self-stimulate proliferation. However, in adults, not only Sertoli cells but also pachytene spermatocytes produce and secrete PSAP around germ cells or into the tubular lumen to stimulate cell proliferation or differentiation in a paracrine or autocrine manner. In summary, PSAP is not only a precursor of lysosomal enzymes but also a pivotal trophic factor in organogenesis in the immature testis and spermatogenesis in the mature testis.
Keywords
Introduction
Prosaposin (PSAP) is a multifunctional protein that plays pivotal roles both intracellularly as a precursor of the lysosomal cofactors, saposins A, B, C, and D,1,2 and extracellularly as a trophic factor in secreted fluids, such as seminal fluid, milk, and cerebrospinal fluid.3–9
PSAP, also known as sulfated glycoprotein-1 (SGP-1), was initially identified in Sertoli cells. 10 It is found in large quantities in lysosomes and is implicated in the degradation of residual bodies released by spermatids during spermiation. 11
In the nervous system, PSAP has neuroprotective and glioprotective functions (reviewed by Meyer et al. 12 ). We have reported the potent neurotrophic effect of PSAP in ischemic hippocampal neurons 13 and the transected sciatic nerve. 14 Furthermore, a peptide with the PSAP sequence showed neurotrophic activity in vivo and in vitro.15–20
Although PSAP is secreted by Sertoli cells in vitro and in vivo,3,4,11 and it functions as a lysosomal enzyme in residual body degradation in the testis (reviewed by Morales et al. 21 ), the route by which secreted PSAP reaches its site of action is unclear.
Using an antibody to the proteolytic portion of PSAP between saposins C and D, we demonstrated that PSAP expression is altered by kainic acid injection in the rat hippocampus17,19 and cerebellum. 22 In this study, we evaluated the site of PSAP production based on the expression pattern of PSAP mRNA, and how PSAP is transported and secreted in developing and adult testes.
Materials and Methods
Animals
Wistar rats on postnatal days 1 and 3, and weeks 1, 2, 3, 4, 6, 8, 12, and 16 were used in this study. All animals were provided by CLEA Japan (Kyoto, Japan) and were housed at a constant temperature (22C) under a 12:12-hr light/dark cycle with access to food and water ad libitum. The experiments were conducted in accordance with the Animal Research: Reporting of In Vivo Experiments (ARRIVE) guidelines and the Guide for Animal Experimentation of the Ehime University School of Medicine, Japan. The protocol was approved by the Animal Care Committee of Ehime University (Permit Number: 05A261).
Antibodies
The anti-rat PSAP-specific antibody (IM1) was prepared by Medical and Biological Laboratories (Nagoya, Japan). Based on the amino acid sequence of rat PSAP, a synthetic oligopeptide corresponding to the proteolytic portion (the intermediate portion between saposins C and D) of PSAP (aa 409–434) was used to generate a rabbit polyclonal antibody to rat PSAP (Fig. 1). The linker region between saposins C and D has been suggested to be necessary for the secretory routing of PSAP to the extracellular space. 23 This type of epitope from the proteolytic portion does not have good antigenicity, but we succeeded in generating an antibody specific for this epitope. The sequence did not encode any saposins. Therefore, this antibody is suitable for tracking PSAP; most anti-PSAP antibodies react not only with PSAP but also with saposins. Using this specific antibody to the proteolytic portion of PSAP, we described its immunoreactivity as PSAP-IR.19,24–26
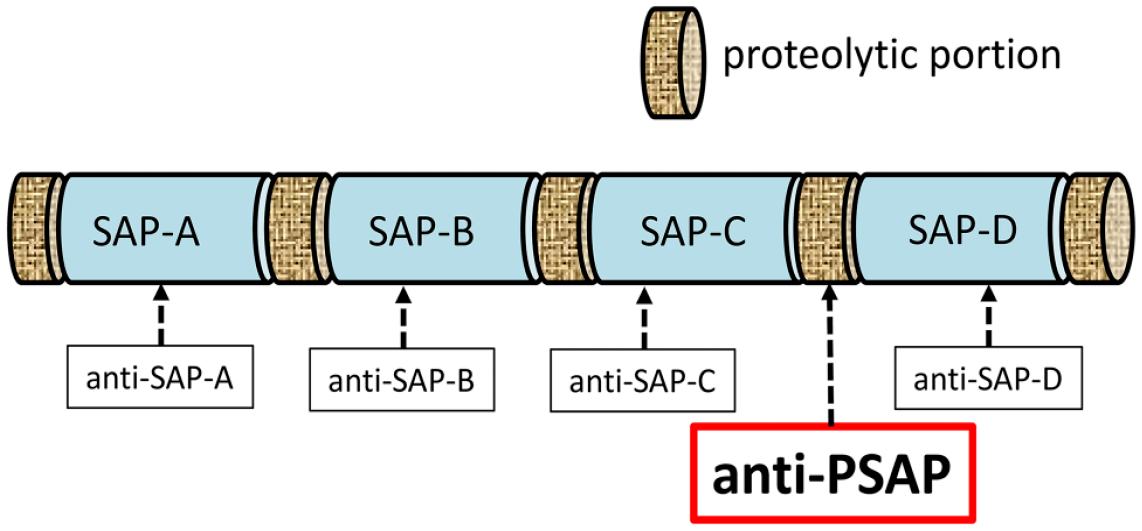
Structure of PSAP and the IM1 antibody. The anti-PSAP antibody was prepared against the proteolytic portion, that is, the intermediate between saposins C and D, of PSAP. Abbreviations: PSAP, prosaposin; IM1, anti-rat PSAP-specific antibody.
A commercial antibody to microtubule-associated protein 2 (MAP2) (Abnova, Taipei, Taiwan) was used because MAP2 was reported to be localized to the cytoplasm of primary and secondary spermatocytes. 27 A commercial antibody to sortilin (EMD Millipore Corp, Billerica, MA) was used because lysosomal trafficking of saposins is mediated by sortilin.25,26,28,29
Immunoblotting
Testes were sonicated in lysis buffer [1:5 w/v; 50 mM Tris, 150 mM NaCl, 1 mM ethylenediaminetetraacetic acid (EDTA), 0.1% sodium dodecyl sulfate (SDS), 0.25% sodium deoxycholate, 1% NP-40, pH 7.4] containing NaVO3 (0.5%), 1% protease inhibitor cocktail (Nacalai Tesque, Kyoto, Japan), and 1% phosphatase inhibitor cocktail (Nacalai Tesque) for 2 min. All procedures were performed on ice. Homogenates were centrifuged for 30 min at 12,000 × g at 4C, and the supernatants were collected. Protein concentration was determined by DC protein assay (Bio-Rad, Hercules, CA) with bovine serum albumin (BSA) as the standard, using a FlexStation 3 Multi-Mode Microplate Reader (Molecular Devices, Sunnyvale, CA). Equal amounts (21 μg) of total protein were loaded onto NuPAGE Bis-Tris mini gels in accordance with the manufacturer’s protocol (Thermo Fisher Scientific, Waltham, MA), and transferred onto 0.45-μm polyvinylidene difluoride (PVDF) membranes (Millipore, Billerica, MA). The membranes were blocked with 55 BSA in 1× Tris-buffered saline + 0.1% Tween 20 (TBST) and incubated at 4C overnight with anti-rat PSAP antibody.
Horseradish peroxidase–conjugated anti-rabbit secondary antibodies (1:5000; Dako, Glostrup, Denmark) and ECL prime Western blotting detection reagent (GE Healthcare, Buckinghamshire, UK) were applied and images of immunoreactive bands were captured using an ImageQuant LAS 4000 imaging system (GE Healthcare, Marlborough, MA). As skim milk contains large amounts of PSAP, 30 the anti-PSAP antibody was preabsorbed with skim milk as a control, and no reaction was detected (Fig. 2B).
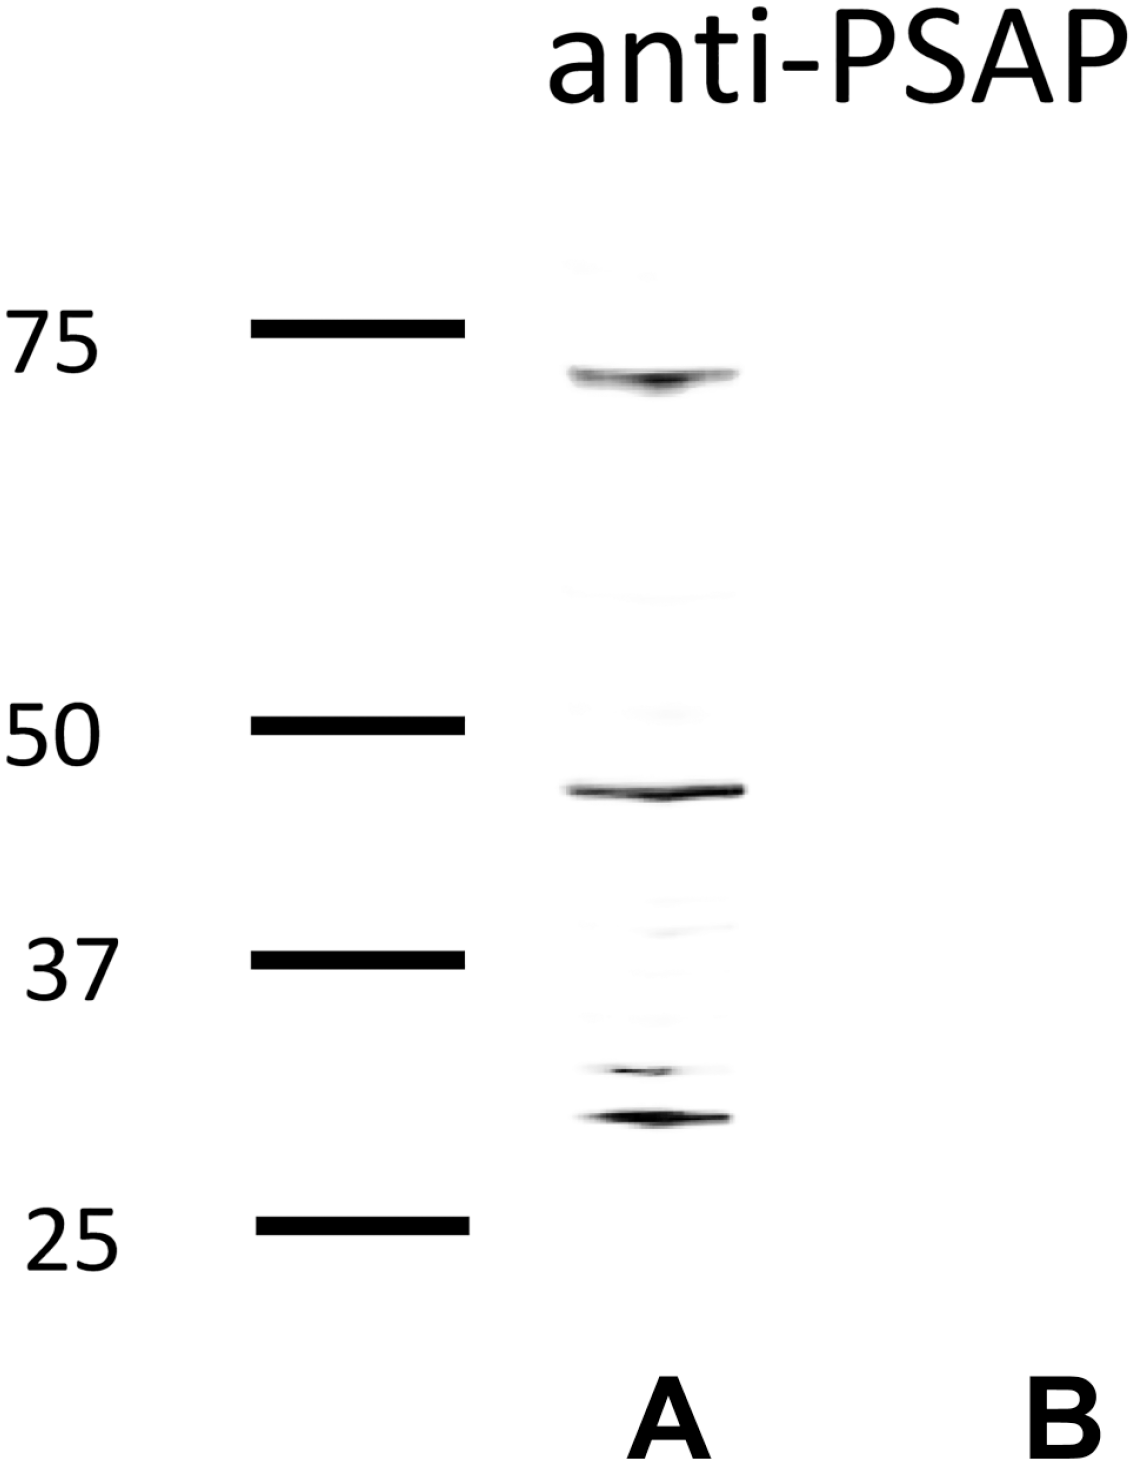
Crude extracts from rat testis were examined using an antibody to PSAP. When stained with anti-PSAP, bands were observed at 67.8, 43.1, and 30 kDa, likely corresponding to prosaposin, trisaposin, and disaposin, respectively (A). No bands were seen using antibody preabsorbed with skim milk, which contains abundant PSAP (B). Abbreviation: PSAP, prosaposin.
Immunohistochemistry of PSAP
Following deparaffinization and a brief rinse in phosphate-buffered saline (PBS), sections were exposed for 2 hr to blocking solution containing 5% normal swine serum (NSS), 5% BSA, and 0.25% carrageenan in PBS. The sections were processed for immunohistochemistry with overnight incubation with anti-PSAP primary antibody at a concentration of 1 µg/ml at 4C. The sections were then rinsed with PBS and incubated with biotinylated anti-rabbit IgG (Dako) for 30 min at room temperature. After rinsing again with PBS, the sections were incubated overnight at 4C with peroxidase-conjugated streptavidin (Dako). Finally, the sections were rinsed with PBS and the color reaction was developed using the diaminobenzidine (DAB) method.
Validation of the Antibody to PSAP
To check the specificity of the anti-PSAP antibody (IM1), we stained serial sections of testis with anti-PSAP (Fig. 4A and B), anti-PSAP preabsorbed with skim milk (Fig. 4C and D), and normal rabbit IgG (Fig. 4E and F).
Immunostaining of PSAP and MAP2, or PSAP and Sortilin
Rats were anesthetized by intraperitoneal injection of medetomidine (0.3 mg/kg), midazolam (4 mg/kg), and butorphanol (5 mg/kg), and perfused transcardially first with 50 ml of saline and then with 300 ml of 4% paraformaldehyde in 0.1 M phosphate buffer. The testes were removed, cut into small pieces, post-fixed in the same paraformaldehyde solution for 4 hr, embedded in paraffin using conventional methods, sectioned, and deparaffinized. Following a brief rinse in PBS, the sections were exposed for 2 hr to blocking solution containing 5% NSS, 5% BSA, and 0.25% carrageenan in PBS. The sections were processed for immunofluorescence using anti-PSAP rabbit IgG and anti-MAP2 mouse IgG as the primary antibodies at 1 µl/ml. After washing with PBS, the sections were treated for 2 hr at room temperature with Alexa Fluor 594-conjugated goat anti-rabbit IgG (1:500; Rockland, Gilbertsville, PA) to detect PSAP and with Alexa Fluor 488-conjugated goat anti-mouse IgG (1:500; Rockland) to detect MAP2, with 4′,6-diamidino-2-phenylindole (DAPI; 1:1000) counterstaining (Figs. 4 to 7). The sections were washed with PBS, mounted in Mowiol (Calbiochem, San Diego, CA), and examined using a Nikon A1 confocal microscope (Nikon, Tokyo, Japan) equipped with a ×60 objective lens (Nikon).
The sections were processed as described above and subjected to immunofluorescence using anti-PSAP rabbit IgG and anti-sortilin mouse IgG as the primary antibodies at 1 µl/ml. After washing with PBS, the sections were treated for 2 hr at room temperature with Alexa Fluor 594-conjugated goat anti-rabbit IgG to detect PSAP and an Alexa Fluor 488-conjugated goat anti-mouse IgG to detect sortilin; DAPI was used as a counterstain.
Immunoelectron Microscopy of PSAP
Following anesthetization as described above, the animals were perfused transcardially with saline followed by 300 ml of 4% paraformaldehyde in 0.1 M phosphate buffer. The tissues were cut into small pieces, then dehydrated with ethanol and immersed in 30%, 60%, and 100% LR White resin, which was polymerized at 55C for 10 hr. Ultrathin sections were cut with a diamond knife, mounted on nickel grids, and incubated in blocking solution consisting of 5% BSA, 10% NSS, 0.1% Triton X-100, and 0.1% sodium azide in PBS for 2 hr. The sections were incubated in blocking solution containing rabbit anti-saposin D serum at 1:50 dilution at 4C overnight. After three rinses with blocking solution, sections were incubated in blocking solution containing gold-conjugated Fab fragment (15-nm gold anti-rabbit IgG) for 3 hr. The sections were rinsed with PBS, fixed in 1% glutaraldehyde in PBS for 10 min, rinsed with distilled water, double-stained with uranyl acetate and lead citrate, and examined by transmission electron microscopy (H800; Hitachi, Tokyo, Japan).
Analysis of PSAP mRNA Using In Situ Hybridization
The probes for hybridization and the primers for polymerase chain reaction (PCR) used in this study were as follows:
Probe name: Sequence
PSAP-AS: 5′-TTCATTACCCTAGACCCACA AGTAGGCGACTTCTGC-3′
PSAP-S: 5′-GCAGAAGTCGCCTACTTGTGGGTCTAGGGTAATAGAA-3′
Rats (n=6 per group) were decapitated and the testes were frozen on dry ice and cut into 20-µm frontal sections using a cryostat. In situ hybridization to detect PSAP was performed as described previously.31–34 Briefly, an antisense 36-mer oligonucleotide probe (PSAP-AS1) and a sense probe (PSAP-S1) were synthesized by Operon Biotechnologies (Tokyo, Japan). PSAP-AS was complementary to bases 1704–1739 in the 3′-untranslated region of PSAP cDNA (M19936) and detected PSAP mRNA. The sense probe PSAP-S, which was complementary to PSAP-AS, was used as a control. The specificities of these 36-mer oligonucleotide probes were demonstrated by dot-blot hybridization in a previous study. 33 The frozen sections were fixed in 4% paraformaldehyde in 0.1 M PBS (pH 7.4) for 15 min, rinsed with 4× standard saline citrate (SSC; pH 7.4), and dehydrated by passage through a graded ethanol series. The sections were then hybridized overnight at 41C with 35 S-labeled antisense or sense probe at 1.0 × 10⁷ cpm/ml in hybridization buffer (50% formamide, 1% Denhardt’s solution, 250 µg/ml tRNA, 0.1 g/ml dextran sulfate, 0.12 M phosphate buffer, and 0.02 mM dithiothreitol (DTT) in 4× SSC). After hybridization, the sections were rinsed three times with 1× SSC at 55C for 20 min, dehydrated by passage through a graded ethanol series, coated with NBT2 emulsion (Eastman Kodak, Rochester, NY), and exposed for 3 weeks at 4C. Finally, the sections were developed using a D-19 developer (Eastman Kodak) and observed under a light microscope. Following in situ hybridization, the testis sections were counterstained with hematoxylin to visualize the nuclei (Fig. 11D to G).
Staging of Spermatogenesis
Staging of spermatogenesis was performed based on the work by Russell et al. 35 In their book, 14 stages were precisely determined, primarily by electron microscopy or light microscopy with well-fixed semi-thin sections using an oil-immersion lens. In this study, we determined the stages mainly by the form, size, and location of cell nuclei or acrosomes in the paraffin sections, so precise staging could not be performed. Russell et al. 35 divided these 14 stages into three cycles in the rat: early, middle, and late. In the early cycle (E-C: stages I–VI, 43.2%), two generations of spermatids and elongate spermatids are present within deep crypts of the Sertoli cells. In the middle cycle (M-C: stages VII–VIII, 27.5%), spermatids come to line the surface of the epithelium just before release. In the late cycle (L-C: stages IX–XIV, 29.5%), there is only one generation of spermatids and they are elongating. The presence of two generations of spermatids indicates that the spermatogenic cycle is not yet in the late stage. We used this simple three-cycle method because it is reliable even on immunofluorescence sections and suited our purpose of classifying the changes in the distribution of PSAP expression.
Results
Western Blotting
Immunoblotting of the testis with the specific antibody against PSAP revealed three bands at approximately 67.8, 43.1, and 30 kDa, likely corresponding to PSAP (A-B-C-D), trisaposin (B-C-D), and disaposin (C-D), respectively (Fig. 2A). The trisaposin band was more intense than the PSAP band in the testis, as also reported in the spleen. 36 No band was detected using antibody preabsorbed with skim milk, which is rich in PSAP (Fig. 2B).
PSAP Immunohistochemistry
To determine the distribution of PSAP, we first performed immunohistochemical analyses in the rat testis at 12 weeks (Fig. 3). PSAP-IR was seen to vary among stages on low-power light micrographs (Fig. 3A).
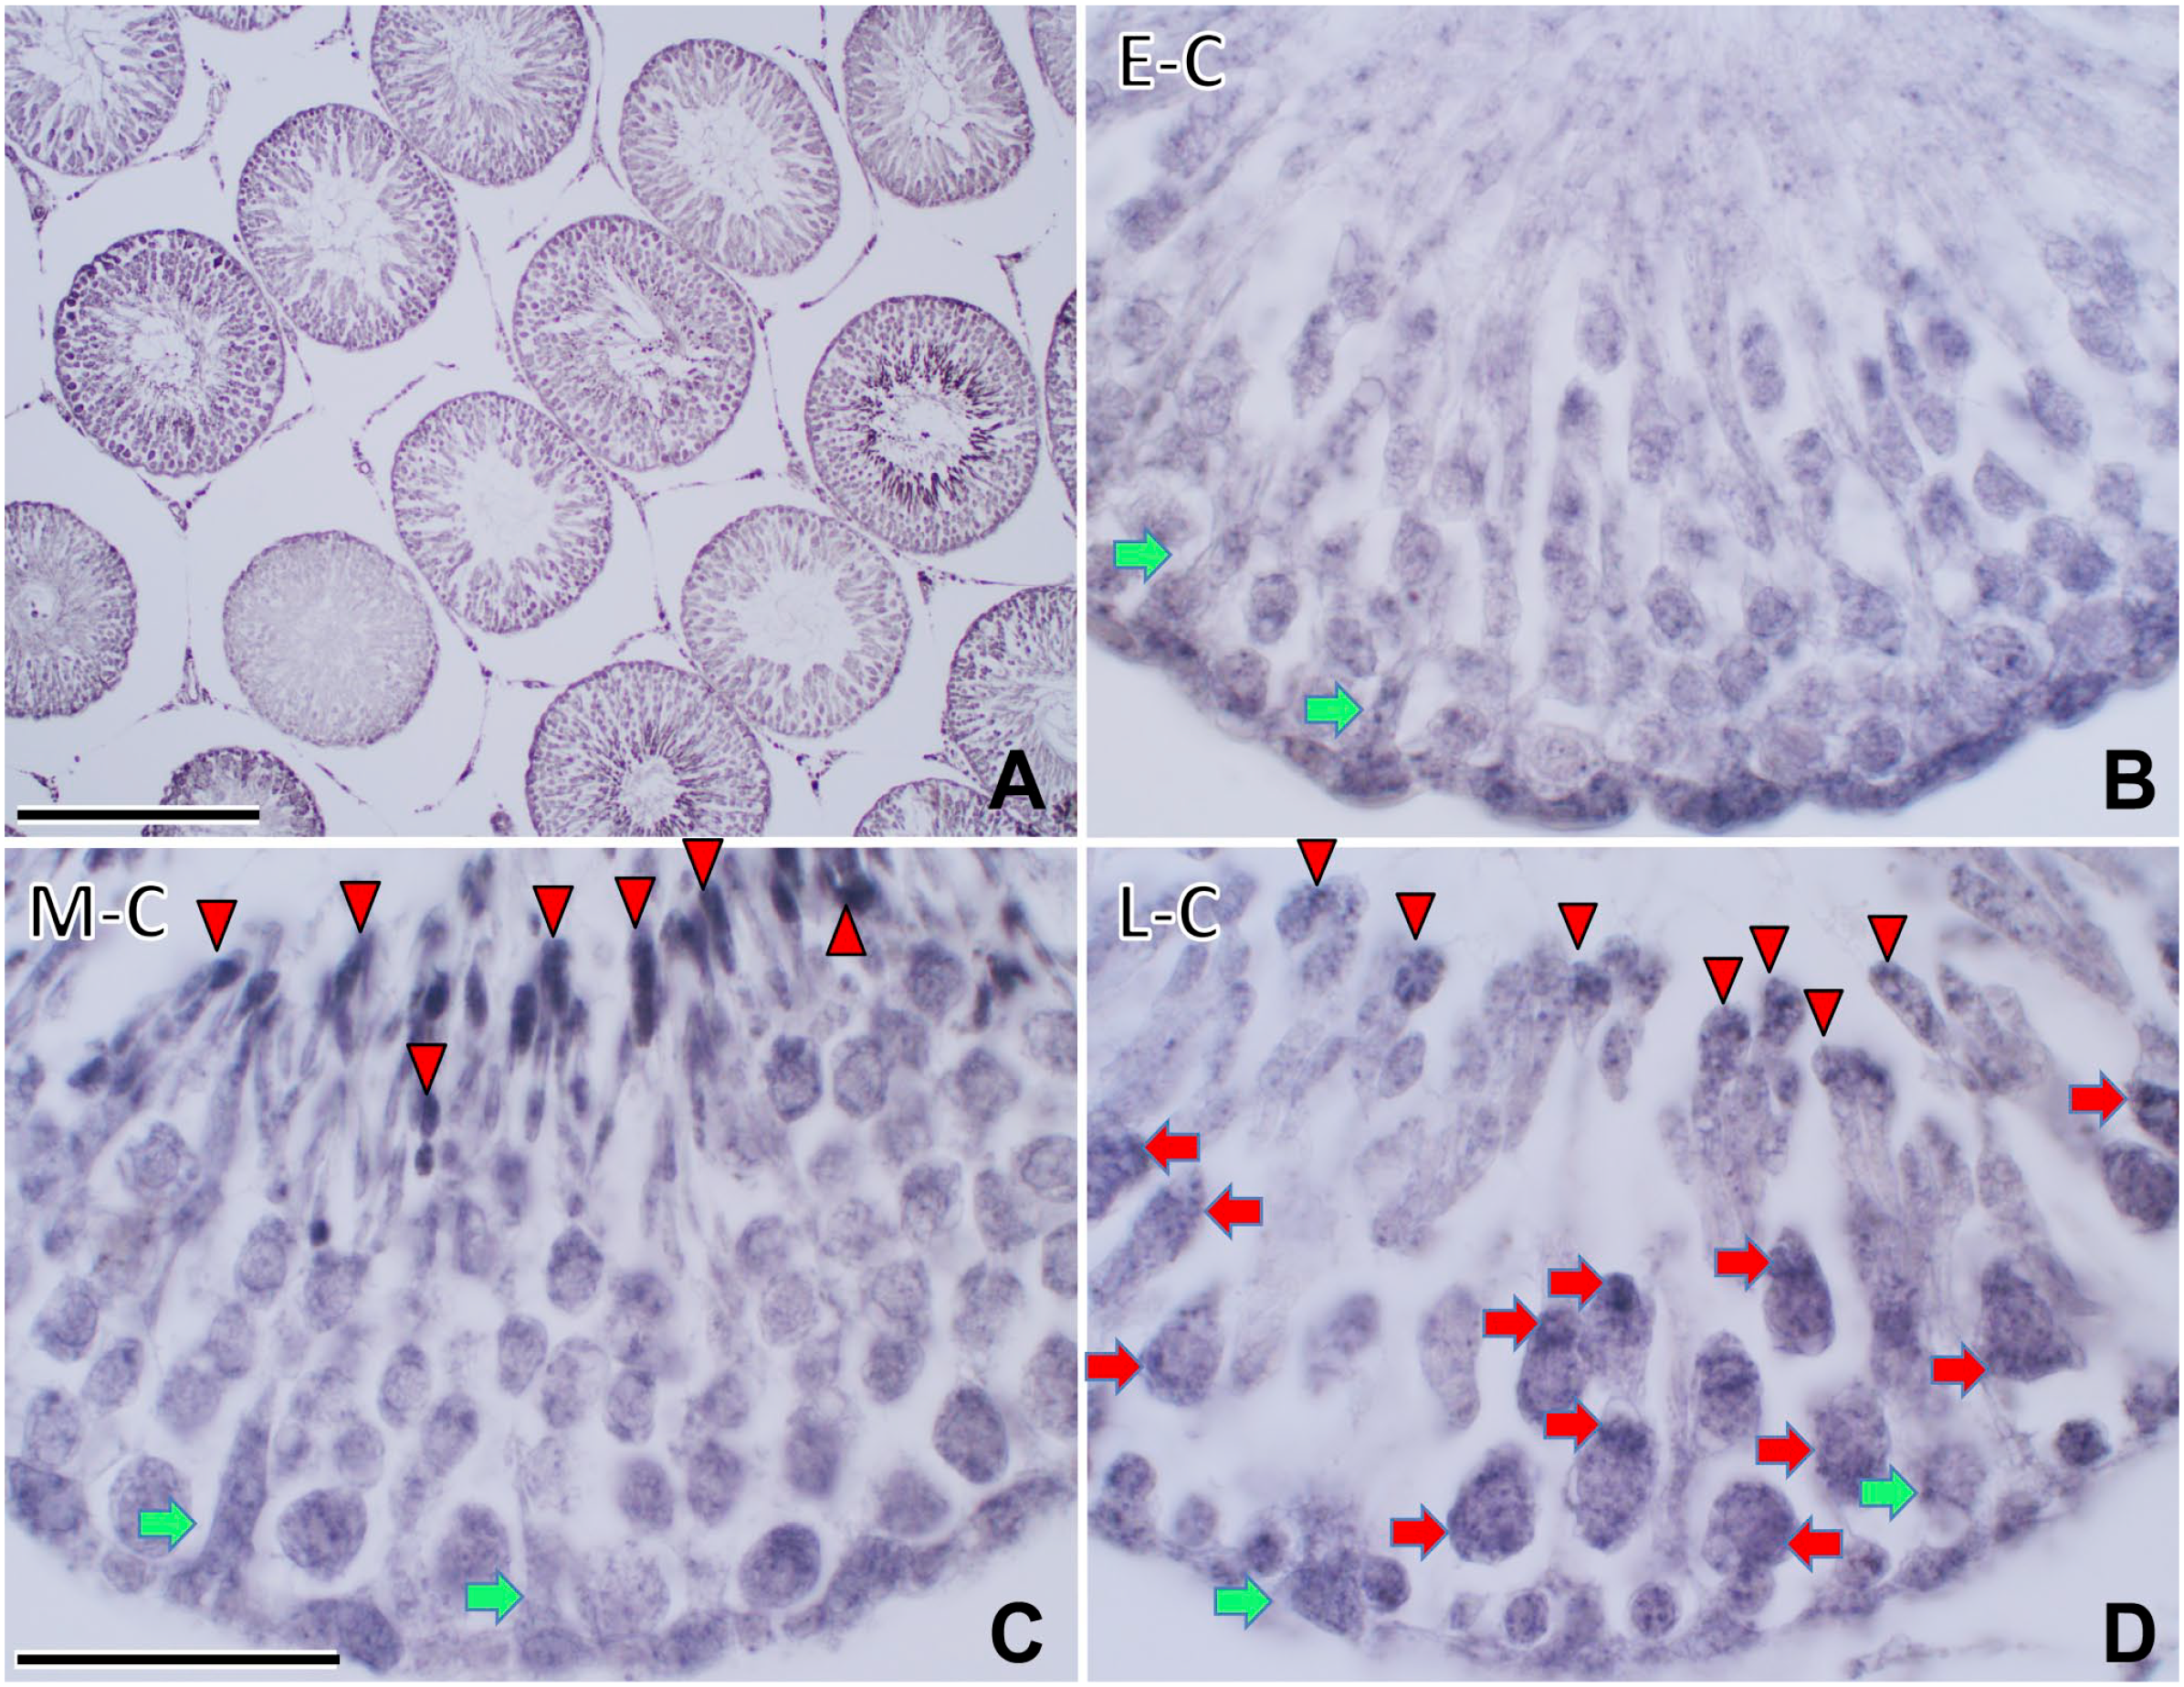
Immunohistochemical light micrographs of rat testis stained with anti-IM1 (PSAP, A–D) at 12 weeks. PSAP-IR was distributed in Sertoli cells (green arrows) during all cycles and was strong in Sertoli cells during the early cycle (E-C) (B). Elongated spermatids lining the apical side (arrowheads) showed strong PSAP-IR during the middle cycle (M-C) (C). In the late cycle (L-C), Sertoli cells and pachytene spermatocytes (red arrows) lining the basal side showed strong PSAP-IR in the cytoplasm and nuclei (D). Apical cytoplasm of spermatids (arrowheads) showed strong PSAP-IR. Numbers on bars are the scale in micrometers. Bars = 500 µm (A), 50 µm (B–D). Abbreviations: IM1, anti-rat PSAP-specific antibody; PSAP, prosaposin.
PSAP-IR was observed in Sertoli cells in all cycles and was particularly strong in the E-C (Fig. 3B). In the M-C, elongated spermatids lining the apical side showed strong PSAP-IR (Fig. 3C). In the L-C, Sertoli cells and pachytene spermatocytes on the basal side showed strong PSAP-IR (Fig. 3D).
Validation of the Antibody to PSAP
Serial sections of rat testis stained with an antibody to PSAP (Fig. 4A and B), absorbed anti-PSAP (Fig. 4C and D), and normal rabbit IgG (Fig. 4E and F) showed that the strong PSAP-IR signals in Sertoli cells on the basal, middle, and apical sides were specific (Fig. 4).
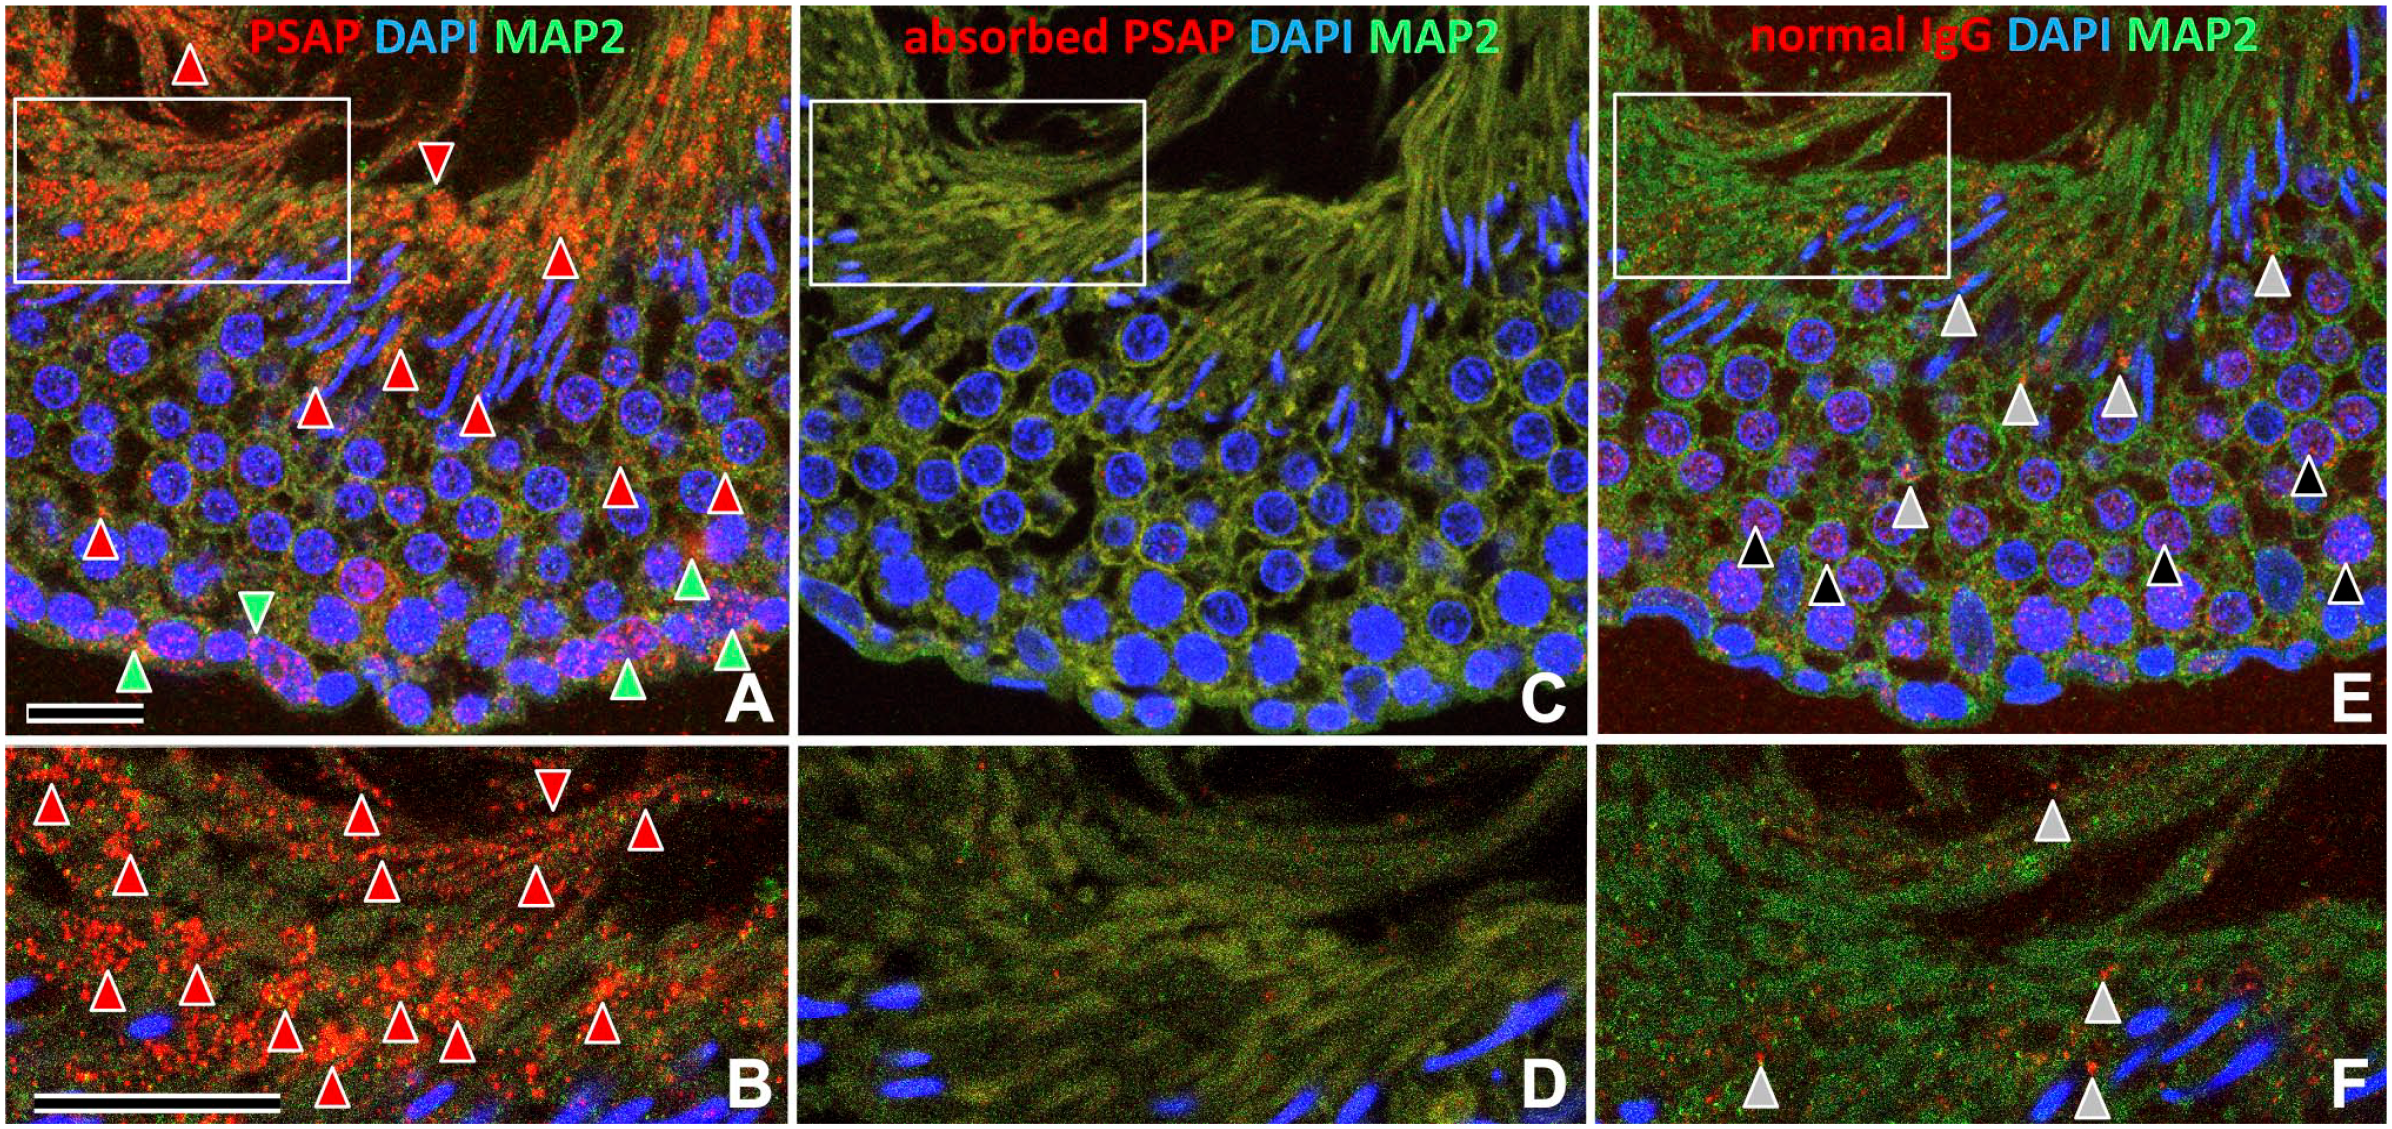
Validation of the antibody to PSAP by immunofluorescence of serial sections (A–F) of 12-week-old rat testis; B, D, and F are higher-magnification images of the boxed areas in A, C, and E, respectively. One section was stained with anti-PSAP IgG (A, B), and the neighboring section was stained with anti-PSAP IgG absorbed with skim milk containing PSAP (C, D), and normal rabbit IgG (E, F). Strong PSAP-IR in the cell debris on the apical side (red arrowheads) and in the Sertoli cells on the basal side (green arrowheads) (A, B) was absent in control sections (C–F). Normal rabbit IgG (E, F) showed weak nonspecific IR in the cytoplasm (gray arrowheads) and nuclei (black arrowheads), but not in cell debris on the apical side or the basal side of Sertoli cells. Numbers on bars are the scale in micrometers. Bars = 20 µm. Abbreviation: PSAP, prosaposin; IgG, immunoglobulin G; DAPI, 4′,6-diamidino-2-phenylindole; MAP2, microtubule-associated protein 2.
PSAP in the Developing Testis
The developmental changes in PSAP-IR in rat testis on postnatal days 1, 3, and 7 and weeks 2, 3, 4, and 6 were evaluated by immunostaining using anti-PSAP and anti-MAP2 antibodies with DAPI counterstaining (Fig. 5). On postnatal days 1, 3, and 7, PSAP-IR was very weak (Fig. 5A to C). At 2 weeks, PSAP-IR was strong, mainly on the apical side of the seminiferous tubules (Fig. 5D). At 3 weeks, PSAP-IR was observed in all layers of the tubules (Fig. 5E). After 4 weeks, PSAP-IR was strong on the basal side of almost all seminiferous tubules (Fig. 5F). At 6 weeks, the tubules grew rapidly and were twice as large as at 5 weeks. At 6 weeks, the incomplete seminiferous cycle began, but no mature spermatids were observed (Fig. 5G to I). PSAP-IR was strong on the basal side of seminiferous tubules (Fig. 5G to I) and some was detected on the apical side (Fig. 5I).
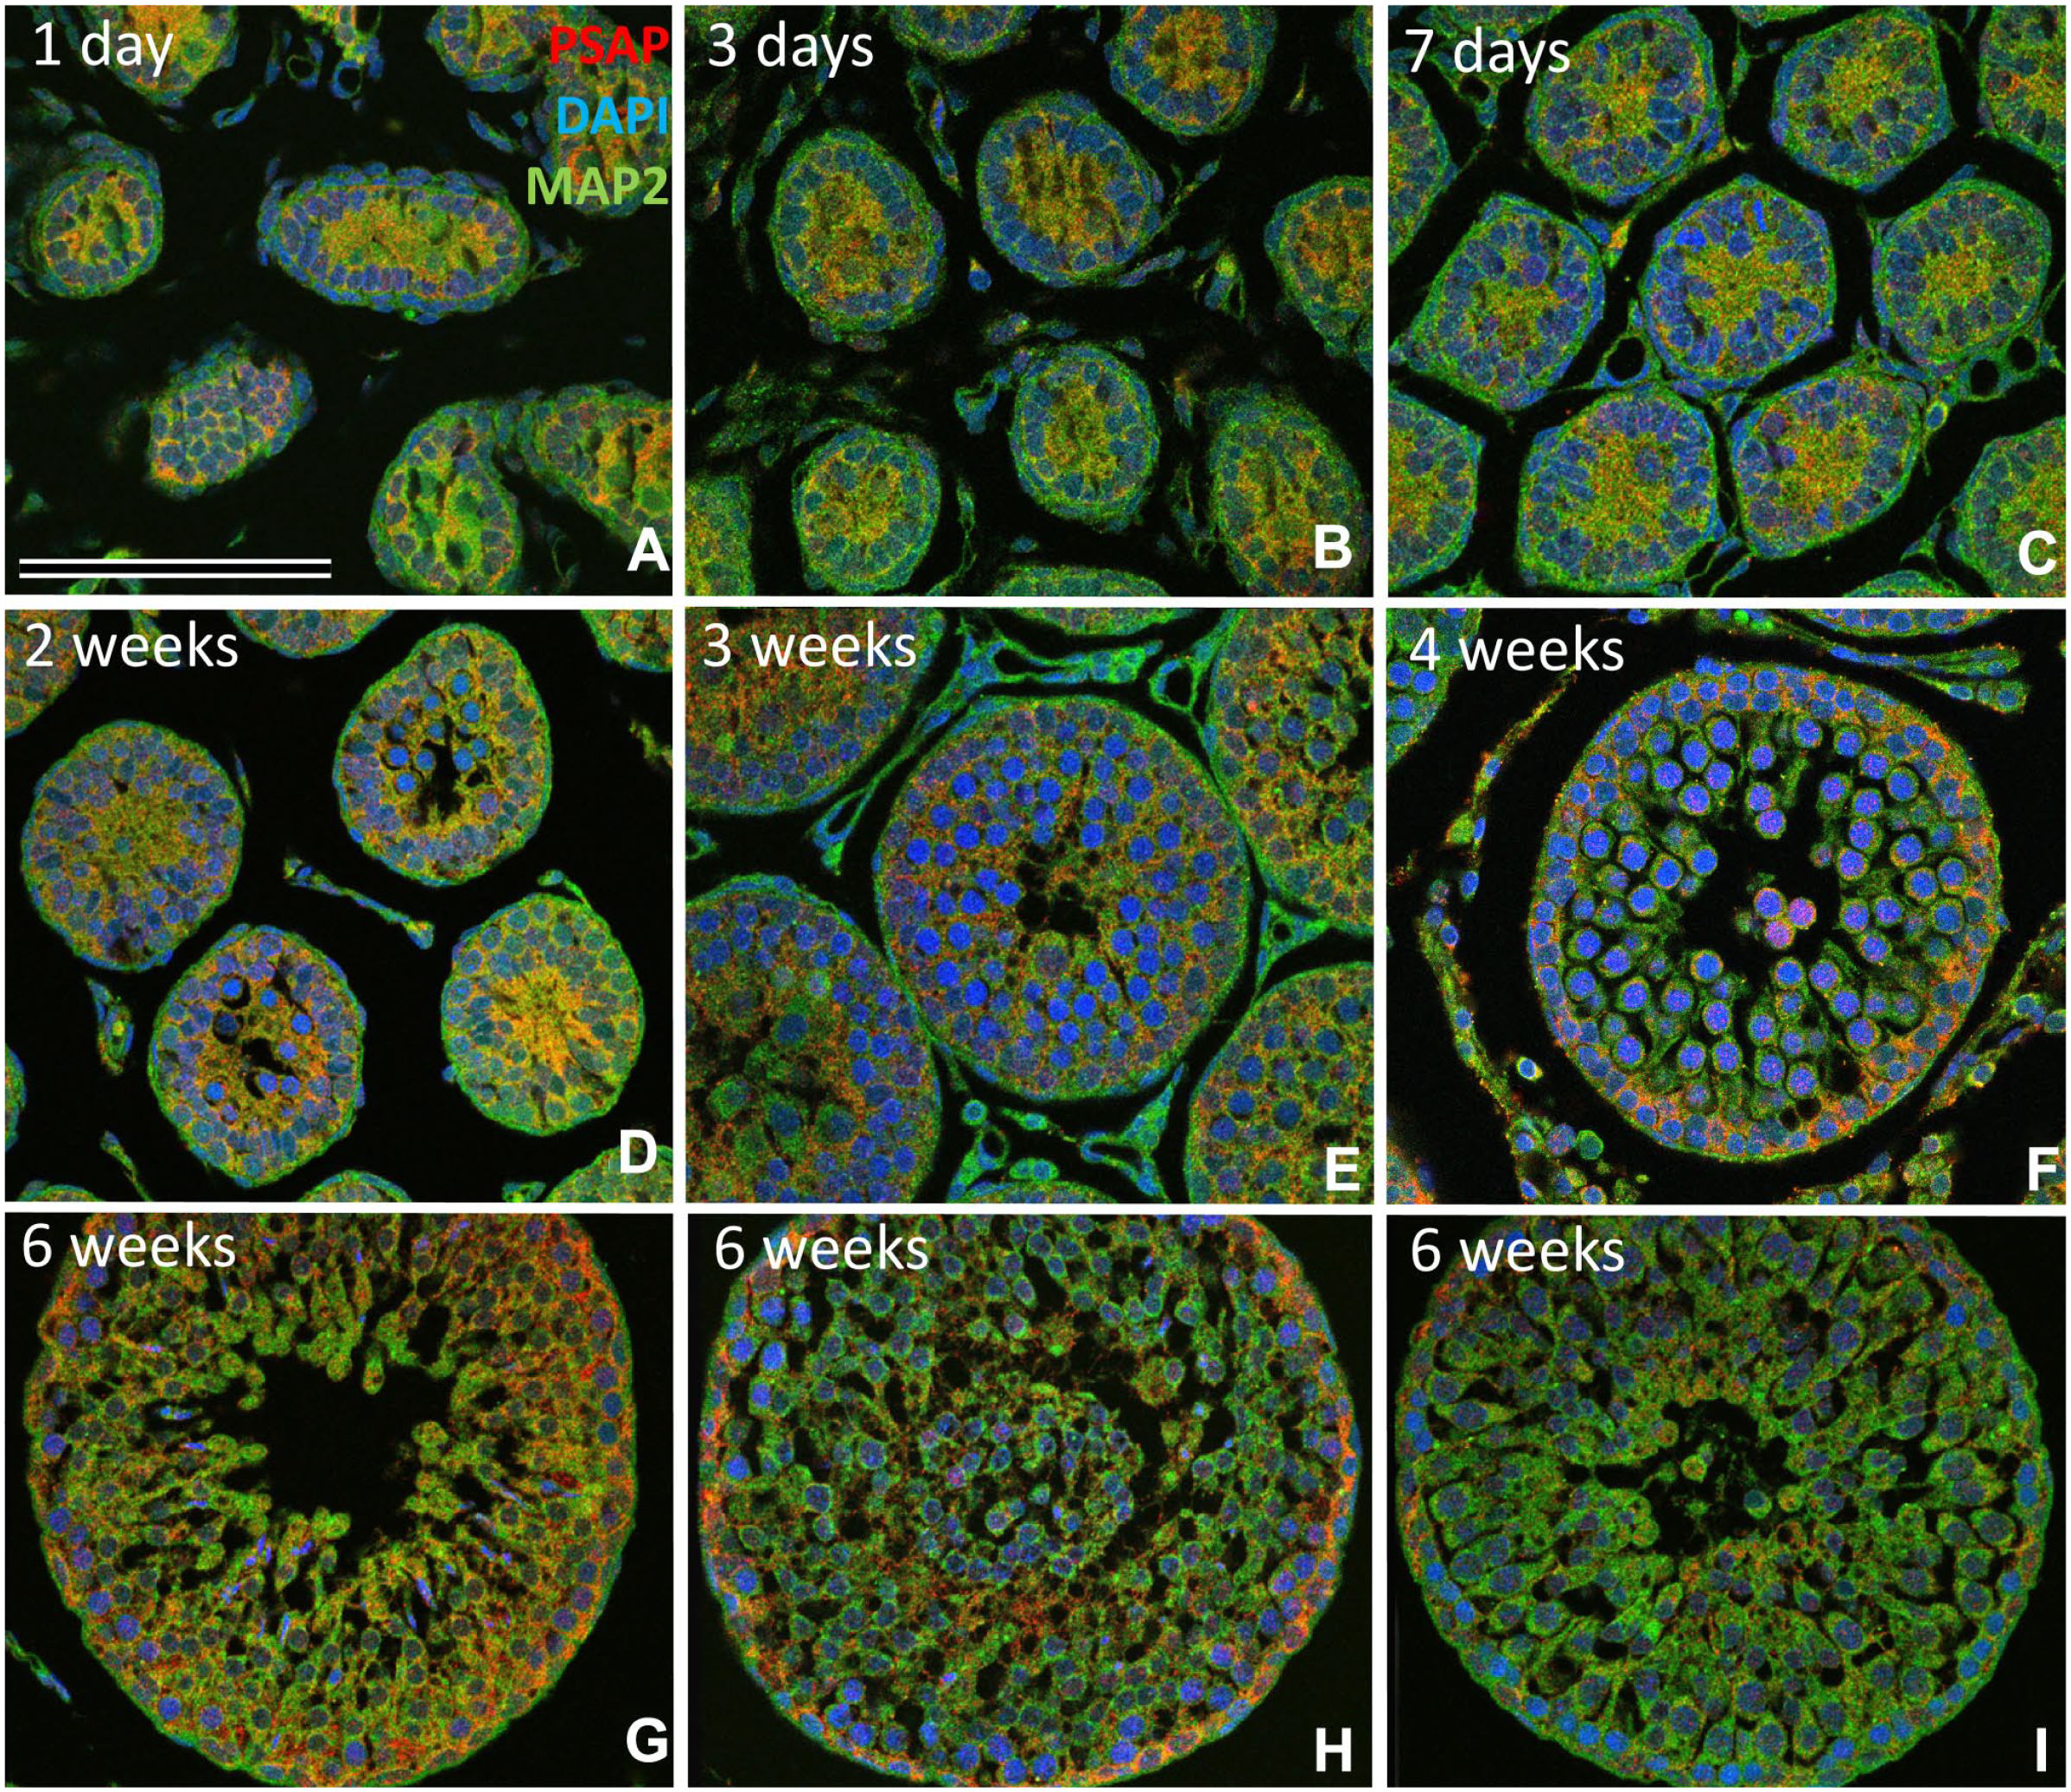
Immunofluorescence light micrographs of developing rat testis stained with anti-PSAP (IM1, red) and anti-MAP2 (green) antibodies and with DAPI (blue) on postnatal days 1 (A), 3 (B), and 7 (C) and weeks 2 (D), 3 (E), 4 (F), 6 (G–I), 8 (J–L), and 12 (M–O). Until 2 weeks, PSAP-IR was strong, mainly on the apical side of immature seminiferous tubules (A–D). At 3 weeks, PSAP-IR was observed in all layers of the tubules (E). After 4 weeks, strong PSAP-IR was observed on the basal side of seminiferous tubules (F). After 6 weeks, seminiferous tubules showed incomplete seminiferous cycles with different distributions of PSAP-IR (G–I), but no mature spermatocytes with MAP2-positive cilia were observed. Bar = 100 µm. Abbreviations: PSAP, prosaposin; IM1, anti-rat PSAP-specific antibody; DAPI, 4′,6-diamidino-2-phenylindole.
PSAP in Mature Testis
The distribution of PSAP-IR was similar at weeks 8 and 12 (Fig. 6), and special attention was paid to the stages of the seminiferous cycle 35 (Figs. 6 and 7). After 8 weeks, corresponding to cell development and maturation, PSAP-IR differed among the seminiferous cycles (Fig. 6A to F). As described above, we divided the 14 stages into three cycles according to the work by Russell et al. 35 PSAP-IR was strong on the basal side in the E-C (Fig. 6A and D), and in all layers during the M-C (Fig. 6B and E), but PSAP-IR was weak in the L-C (Fig. 6C and F).
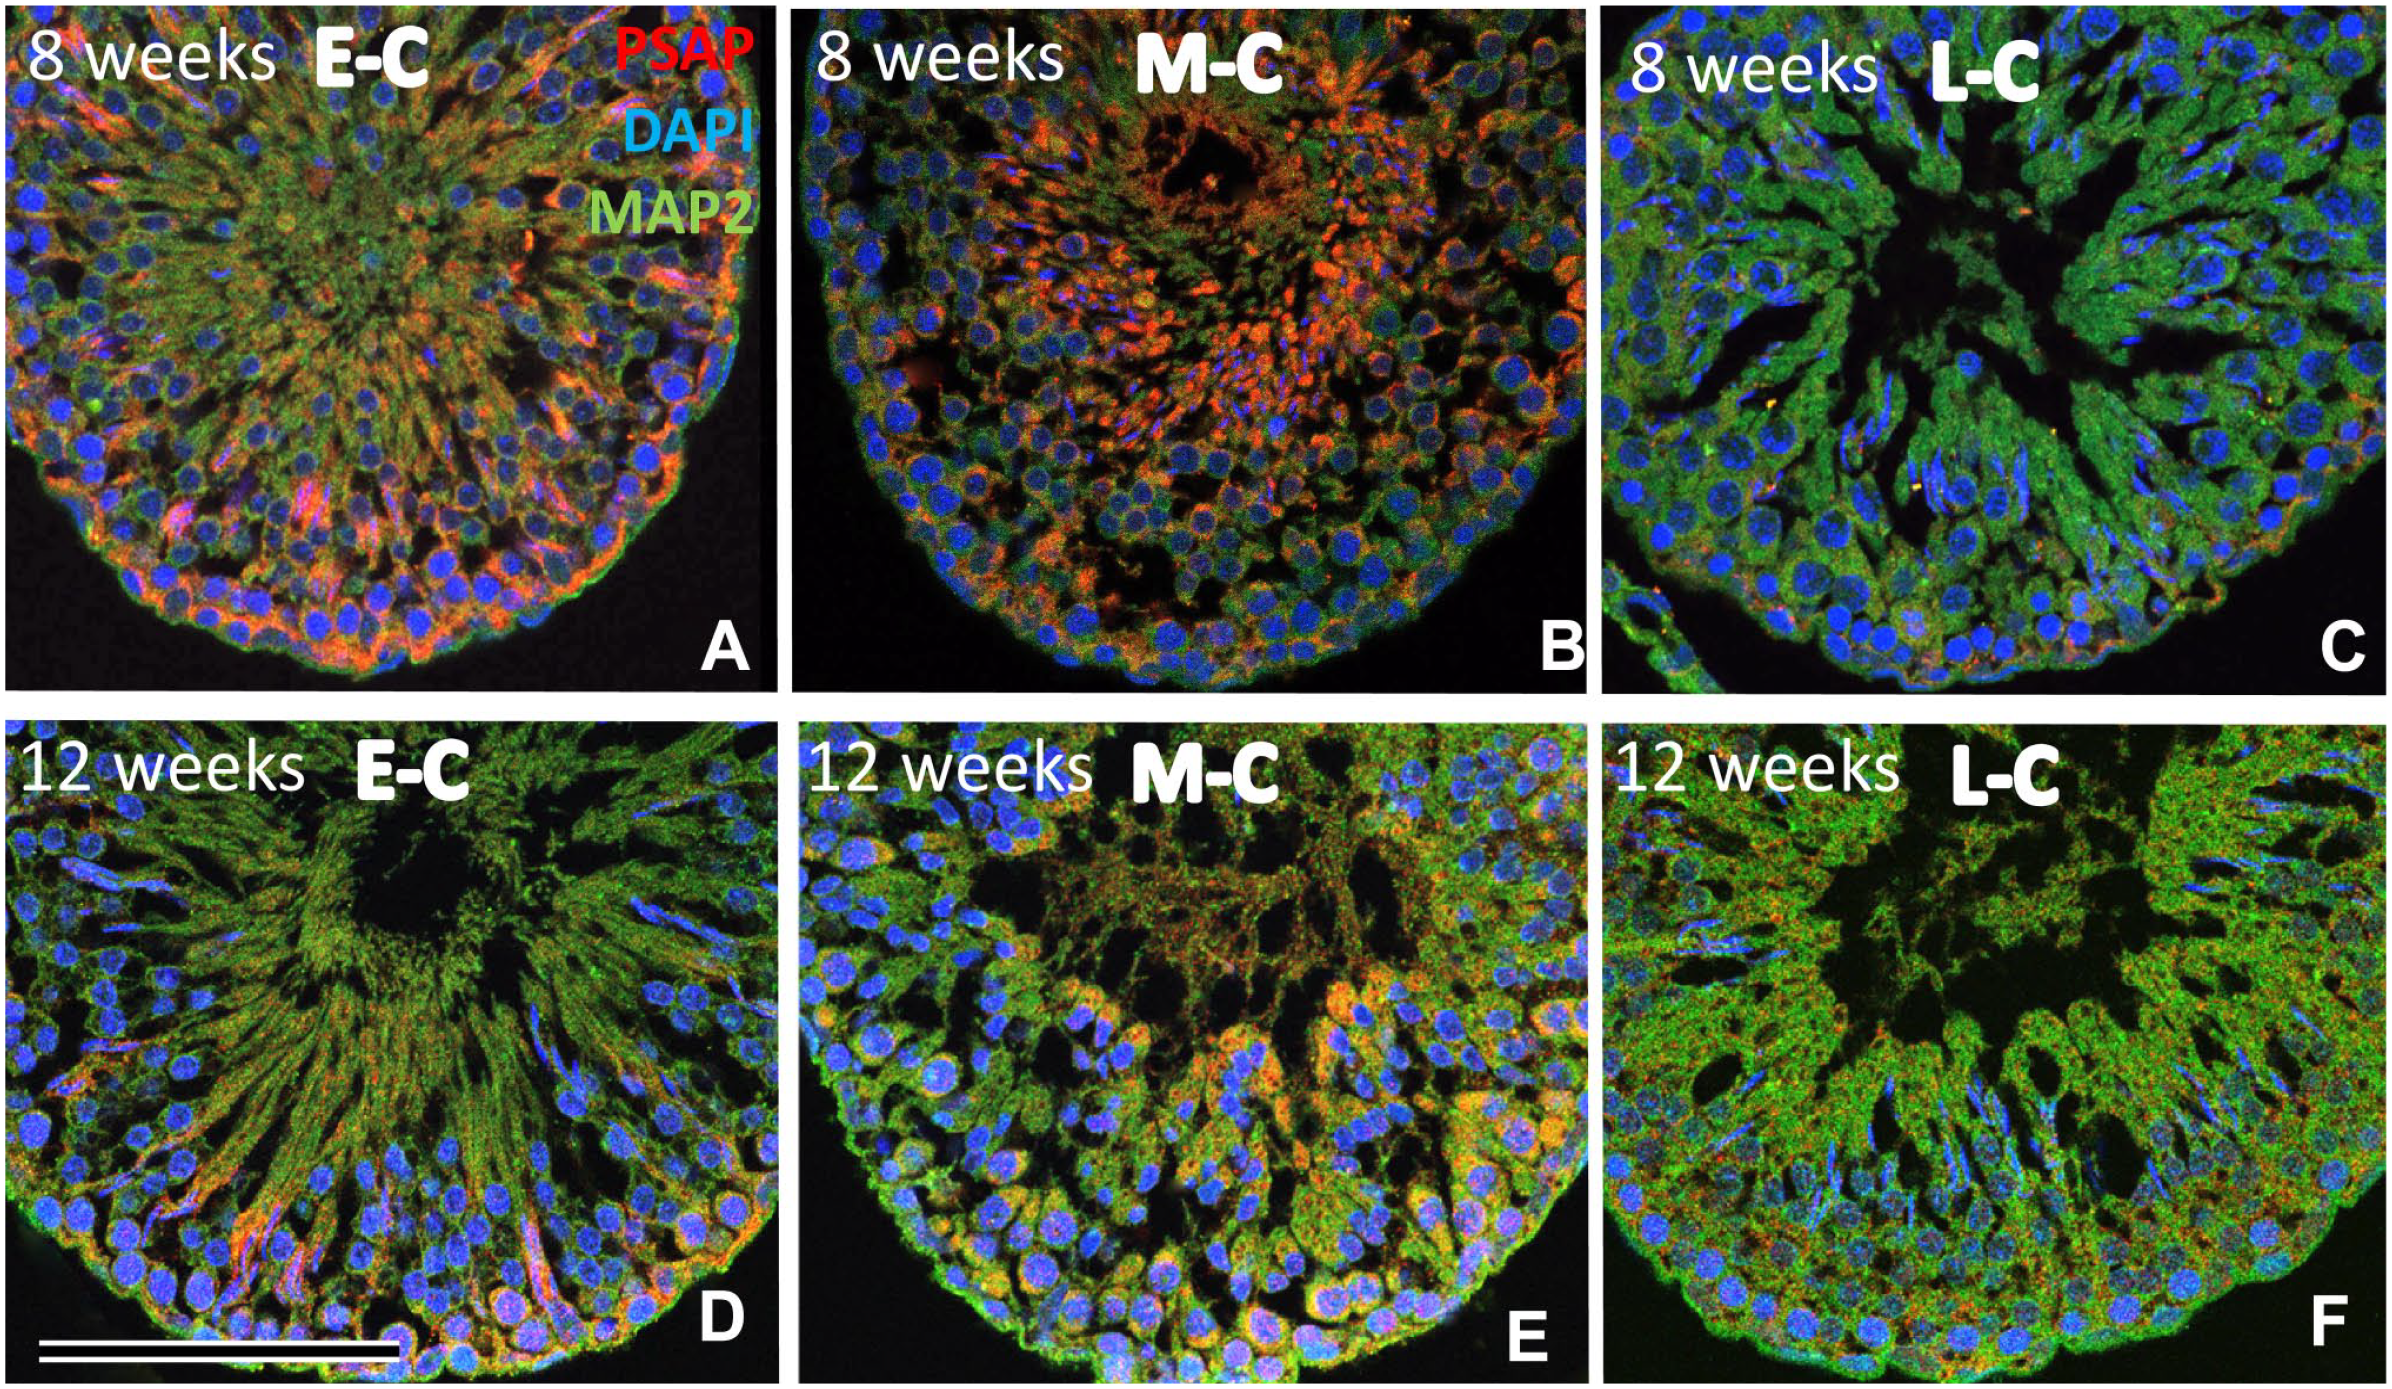
After 8 weeks, PSAP-IR varied among seminiferous cycles (A–F). PSAP-IR was strong on the basal side in the early cycle (E-C) (J, M) and in all layers in the middle cycle (M-C) (K, N) but PSAP-IR was weak in the late cycle (L-C) (L, O). Mature spermatocytes with MAP2-positive cilia were observed in the early and middle cycle (A, B, D, E), but not in the late cycle (C, F). Numbers on bars are the scale in micrometers. Bar = 100 µm. Abbreviation: PSAP, prosaposin; DAPI, 4′,6-diamidino-2-phenylindole.
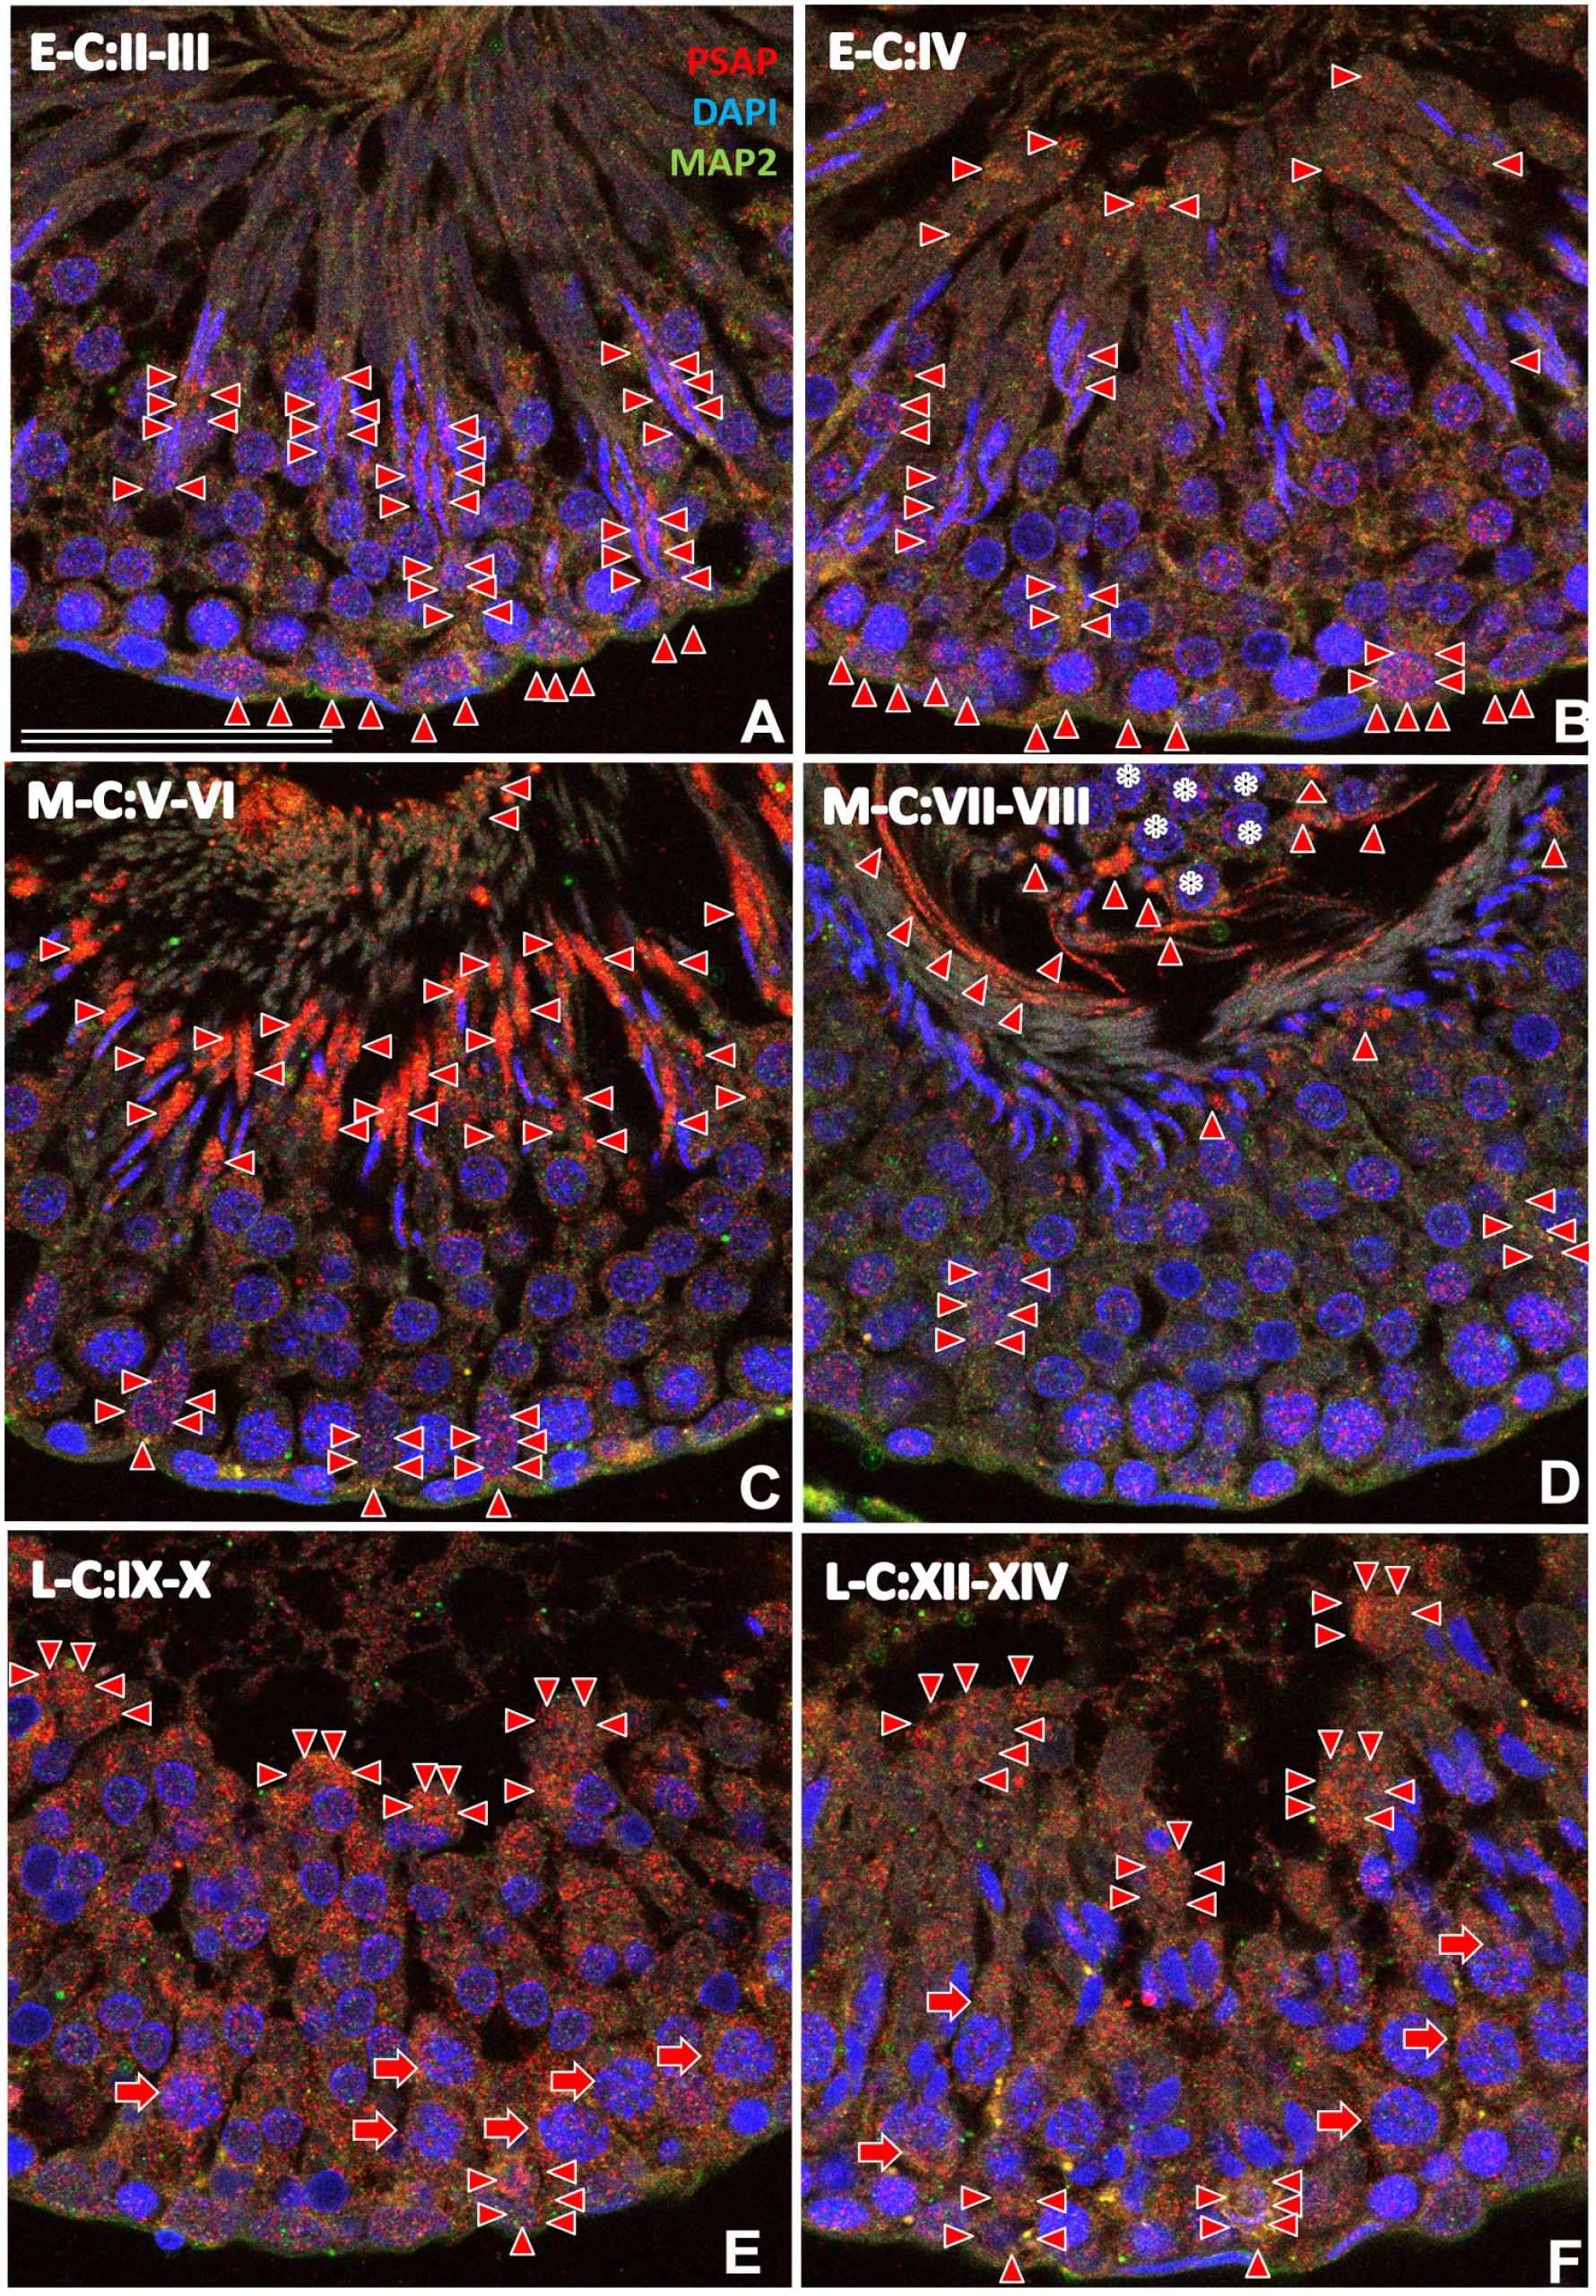
Immunofluorescence light micrographs of rat testis during postnatal week 12 stained with anti-PSAP (IM1, red) and anti-MAP2 (green) antibodies and with DAPI (blue) (A–F). Stages were defined according to the rat spermatogenesis cycle map (Russell et al. 35 ). The green intensity is reduced to show PSAP-IR (red) and the shape of the acrosome (blue). PSAP-IR (red arrowheads) was mainly observed in the apical cytoplasm of Sertoli cells around acrosomes, and their basal perinuclear cytoplasm during the early cycle (E-C; stages II–III; A). PSAP-IR increased on the apical side during stage IV (B). PSAP-IR was strongest on the apical side (red arrowheads) during the middle cycle (M-C; stages V–VIII; C, D). Cell debris with nuclear debris (*) aggregated in the center of the lumen (D) during these stages but had little PSAP-IR. PSAP-IR was strong in the pachytene spermatocytes (red arrows) and spermatids lining the apical side (red arrowheads) during the late cycle (L-C; E, F). Strong PSAP-IR was also observed in the basal cytoplasm of Sertoli cells (red arrowheads) at all stages. Numbers on bars are the scale in micrometers. Bar = 50 µm. Abbreviations: PSAP, prosaposin; IM1, anti-rat PSAP-specific antibody; DAPI, 4′,6-diamidino-2-phenylindole.
Micrographs of the rat testis at postnatal week 12 are shown in Fig. 7 according to the 14 stages of Russell et al. 35 In the E-C (stages I–VI), two generations of spermatids and elongated spermatids were present in the deep crypts of Sertoli cells, with strong PSAP-IR (Fig. 7A and B). PSAP-IR was observed in the cytoplasm of Sertoli cells around thin/narrow acrosomes at stages II–III (Fig. 7A), and some PSAP-IR was observed on the apical side. PSAP-IR increased on the apical side during stage IV (Fig. 7B).
In the M-C (stages V–VIII, Fig. 7C and D), especially just before spermatid release (stages VII–VIII, Fig. 7D), mature spermatids with strong PSAP-IR lined the surface of the epithelium, and Sertoli cells on the basal side showed moderate PSAP-IR (Fig. 7C and D). PSAP-IR was strongest in the cytoplasm of Sertoli cells around spermatid heads and in the cytoplasmic lobes of spermatids on the apical side during stages V–VI (Fig. 7C). Cell debris aggregated in the center of the lumen at stages VII–VIII (Fig. 7D) and showed weak PSAP-IR.
In the L-C (stages IX–XIV), PSAP-IR was strong in pachytene spermatocytes and spermatids and moderate in the spermatogonia on the basal side (Fig. 7E and F). PSAP-IR was strong in the basal cytoplasm of Sertoli cells.
PSAP-IR Detection by Electron Microscopy
We examined the cellular localization of saposin D-IR in the basal part (Fig. 8), middle part (Fig. 9), and apical part (Fig. 10) of testis by immunoelectron microscopy. In low-power electron micrographs of basal part, lysosome-like high-density organelles with many saposin D-IR gold particles were observed on the basal side of seminiferous tubules in Sertoli cells with triangle-shaped nuclei and clear nucleoli (Fig. 8A). In these Sertoli cells, the lysosome-like organelles were present mainly in the cytoplasm on the apical side and were of various sizes (Fig. 8B). In the large lysosomes (>2 µm), dense granular structures characteristic of residual bodies were observed. In contrast, the smaller organelles (<0.3 µm) with much saposin D-IR contained no residual body (Fig. 8B to D). Saposin D-IR was also observed in the low-density organelles in spermatogonia (Fig. 8E to I) on the basal side.
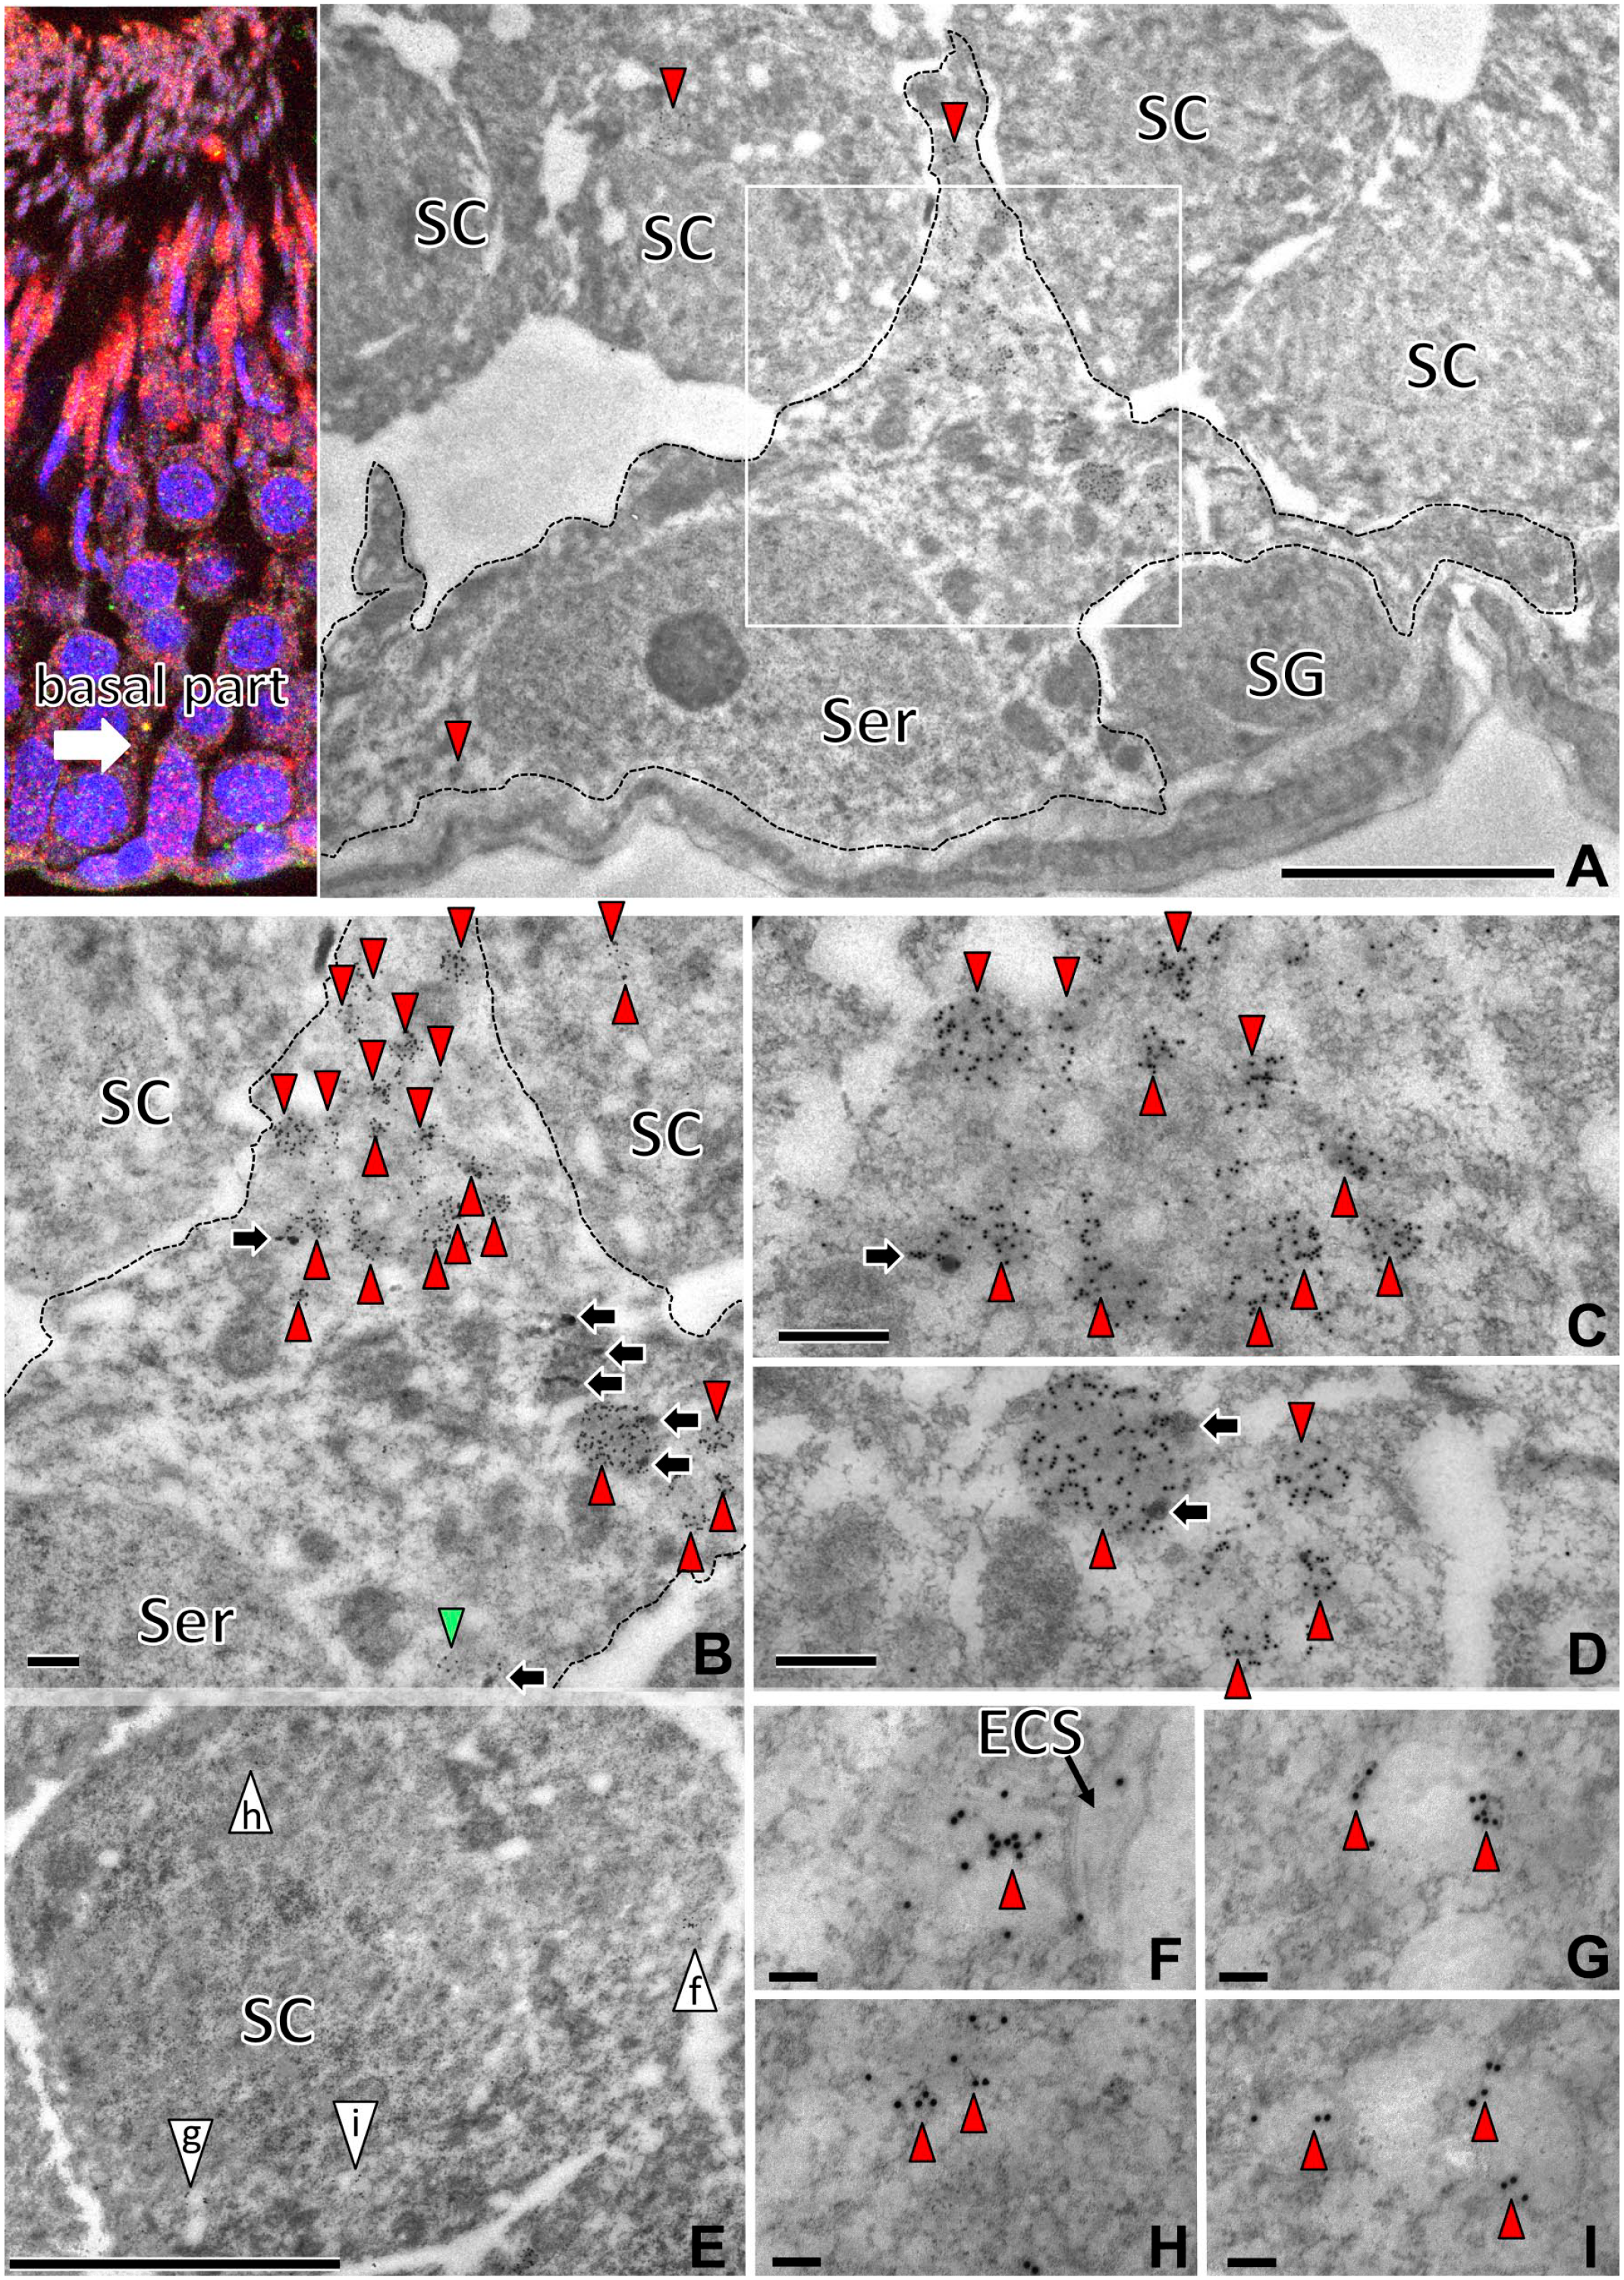
Immunoelectron micrographs of the basal part of the seminiferous tubule with saposin D-IR (15 nm) labeling using an anti-saposin D antibody. Saposin D-IR gold particles in lysosome-like organelles (arrowheads) were mainly in the cytoplasm of Sertoli cells (Ser, A–D), with a few in SC. The boxed area of the Sertoli cell cytoplasm (A) is shown at higher magnification (B–D). In large lysosomes (>2 µm), dense granular structures characteristic of residual bodies (black arrows) were observed. In contrast, the smaller lysosome-like organelles (<0.3 µm) with saposin D-IR contained no residual body (B). Saposin D-IR organelles in the pachytene SC (E) contained fewer gold particles (arrowheads) and were paler than those of Sertoli cells (F–I). Numbers on bars are the scale in micrometers. Bars = 5 µm (A, E), 1 µm (B–D), 0.1 µm (F–I). Abbreviation: SC, spermatocytes; SG, spermatogonia; ECS, empty cyst of spermatozoa.
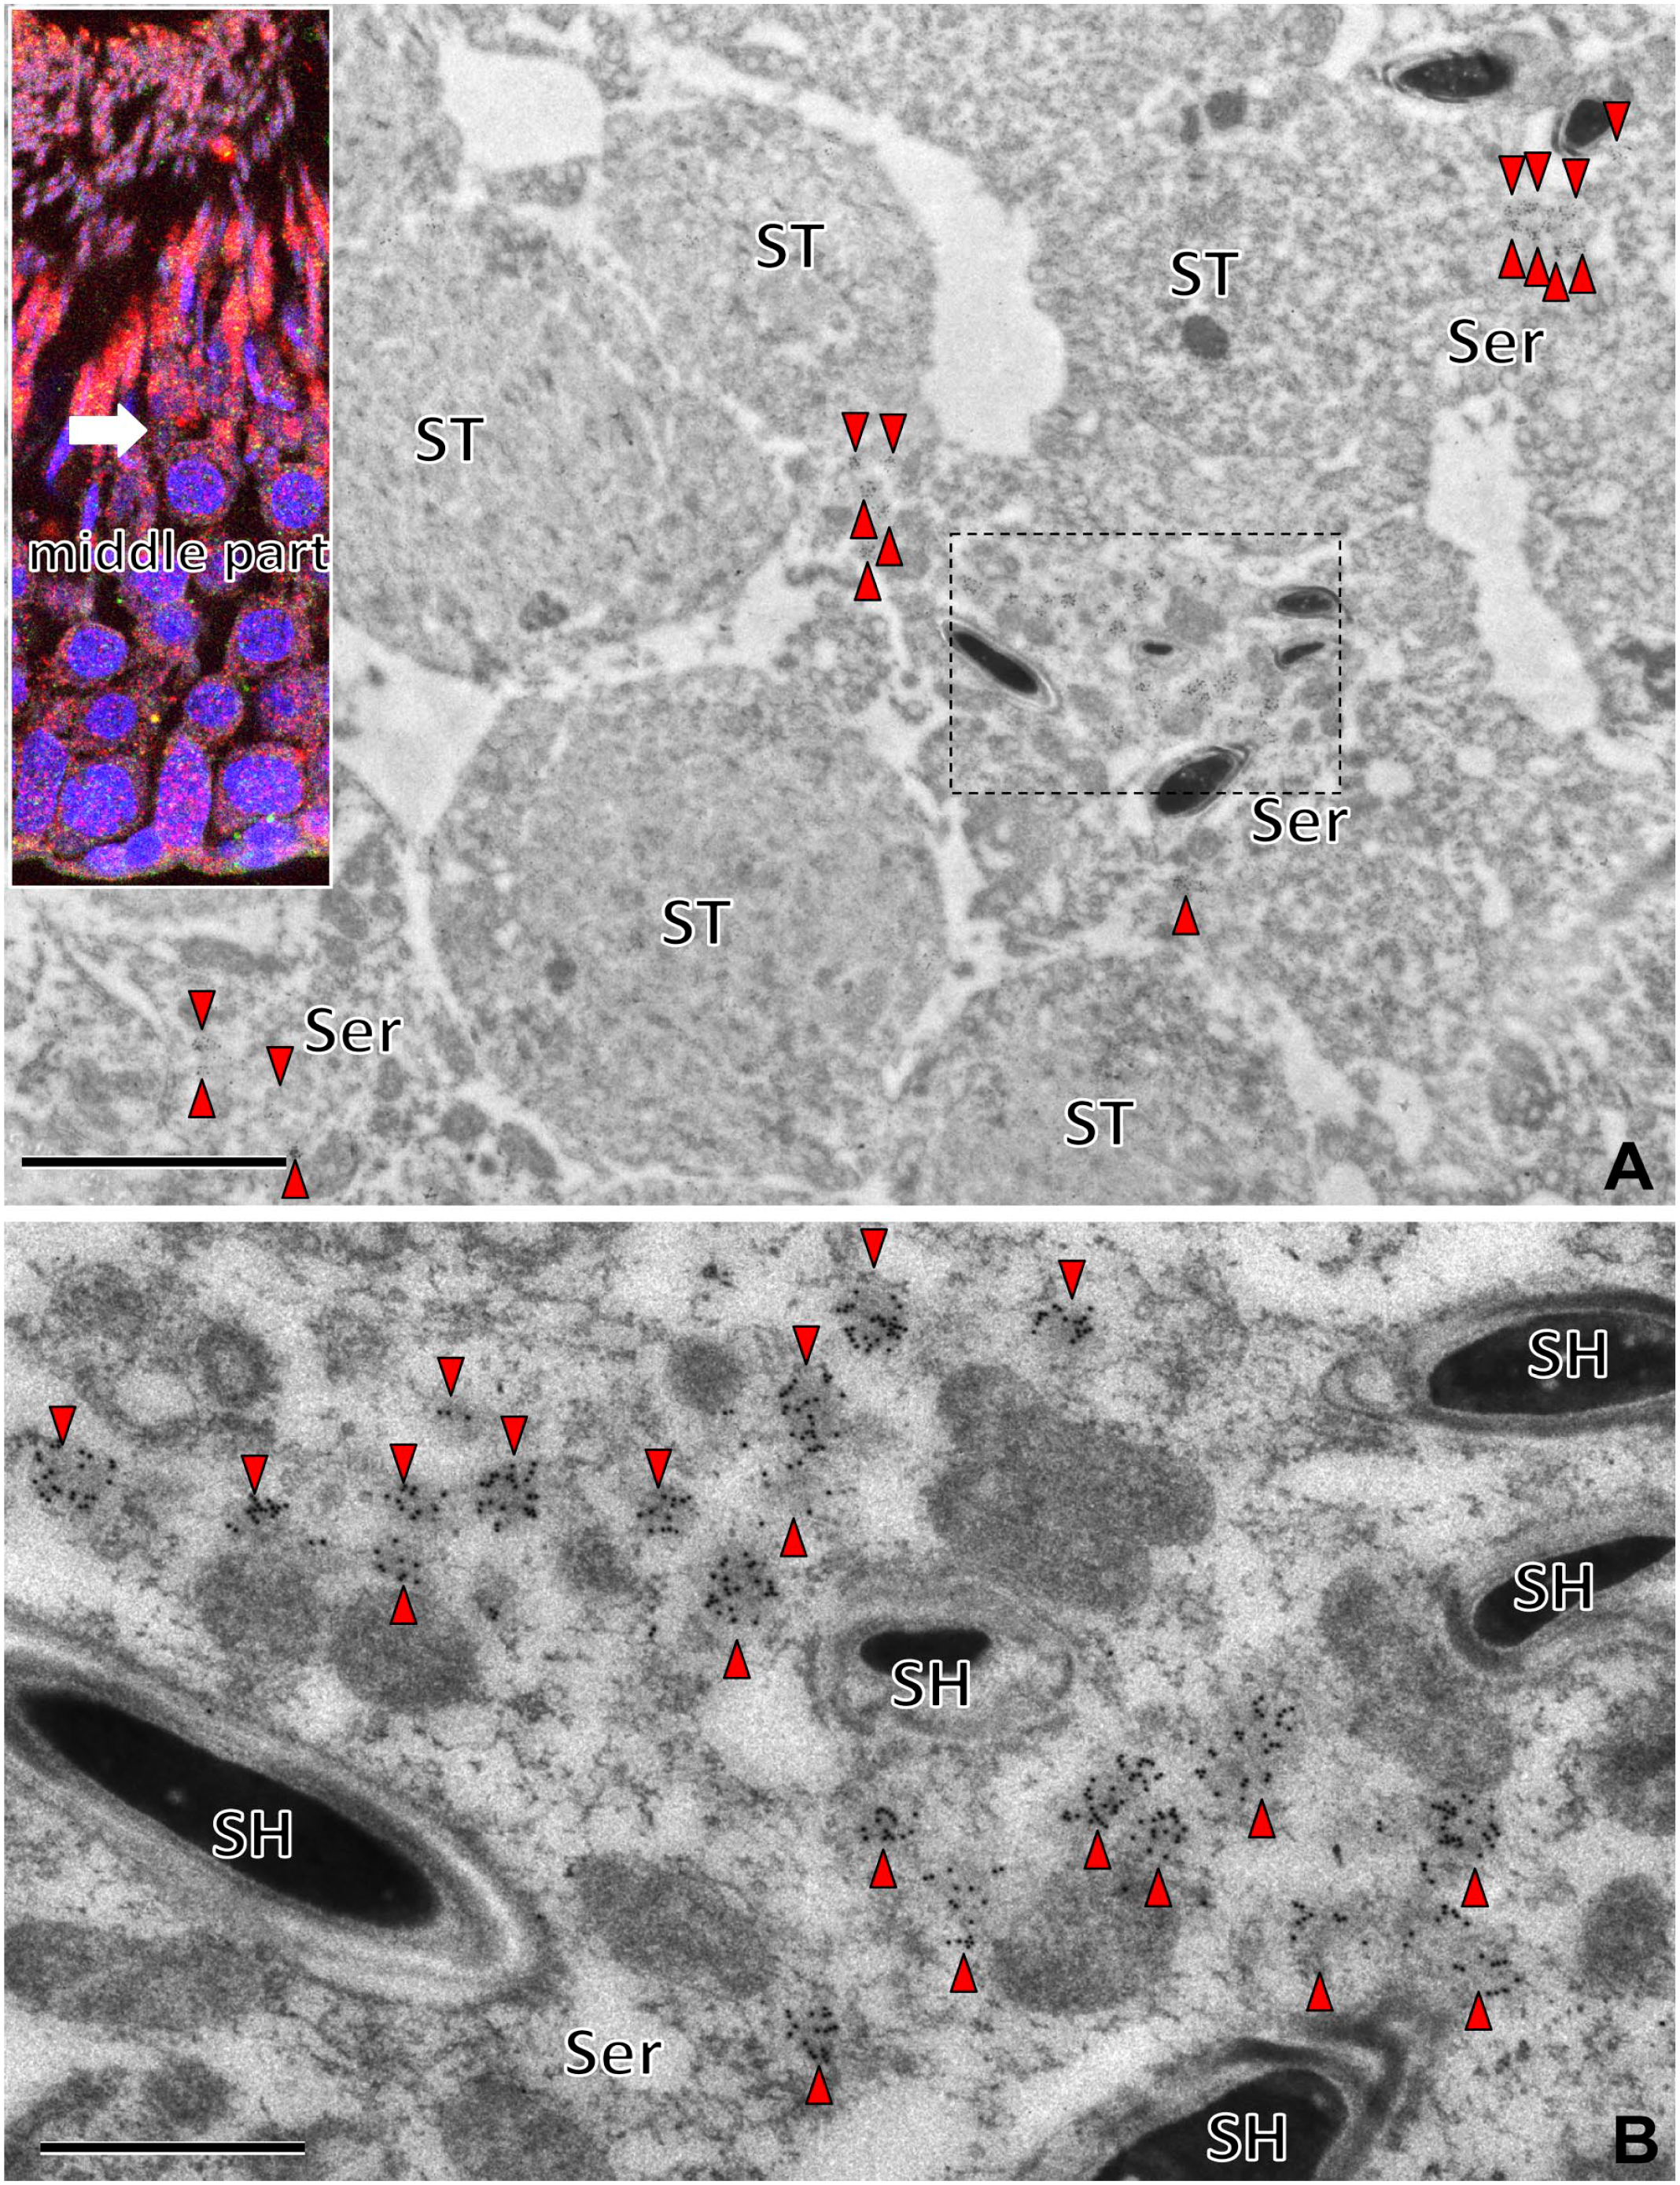
Immunoelectron micrographs of the middle part of the seminiferous tubule with saposin D-IR (15 nm). The saposin D-IR gold particles in the lysosome-like organelles (arrowheads) were observed mainly in the cytoplasm of the Sertoli cells (Ser), with a few in the ST. The area in the rectangle in the Sertoli cell cytoplasm (A) is shown at higher magnification (B). Many lysosome-like organelles with saposin D-IR gold particles were observed around the SH. Note that these saposin D-IR lysosome-like organelles were smaller (<0.3 µm), without the granular dense structures characteristic of residual bodies. Numbers on bars indicate the scale in micrometers. Bars = 5 µm (A), 1 µm (B). Abbreviations: ST, spermatids; SH, spermatid heads.
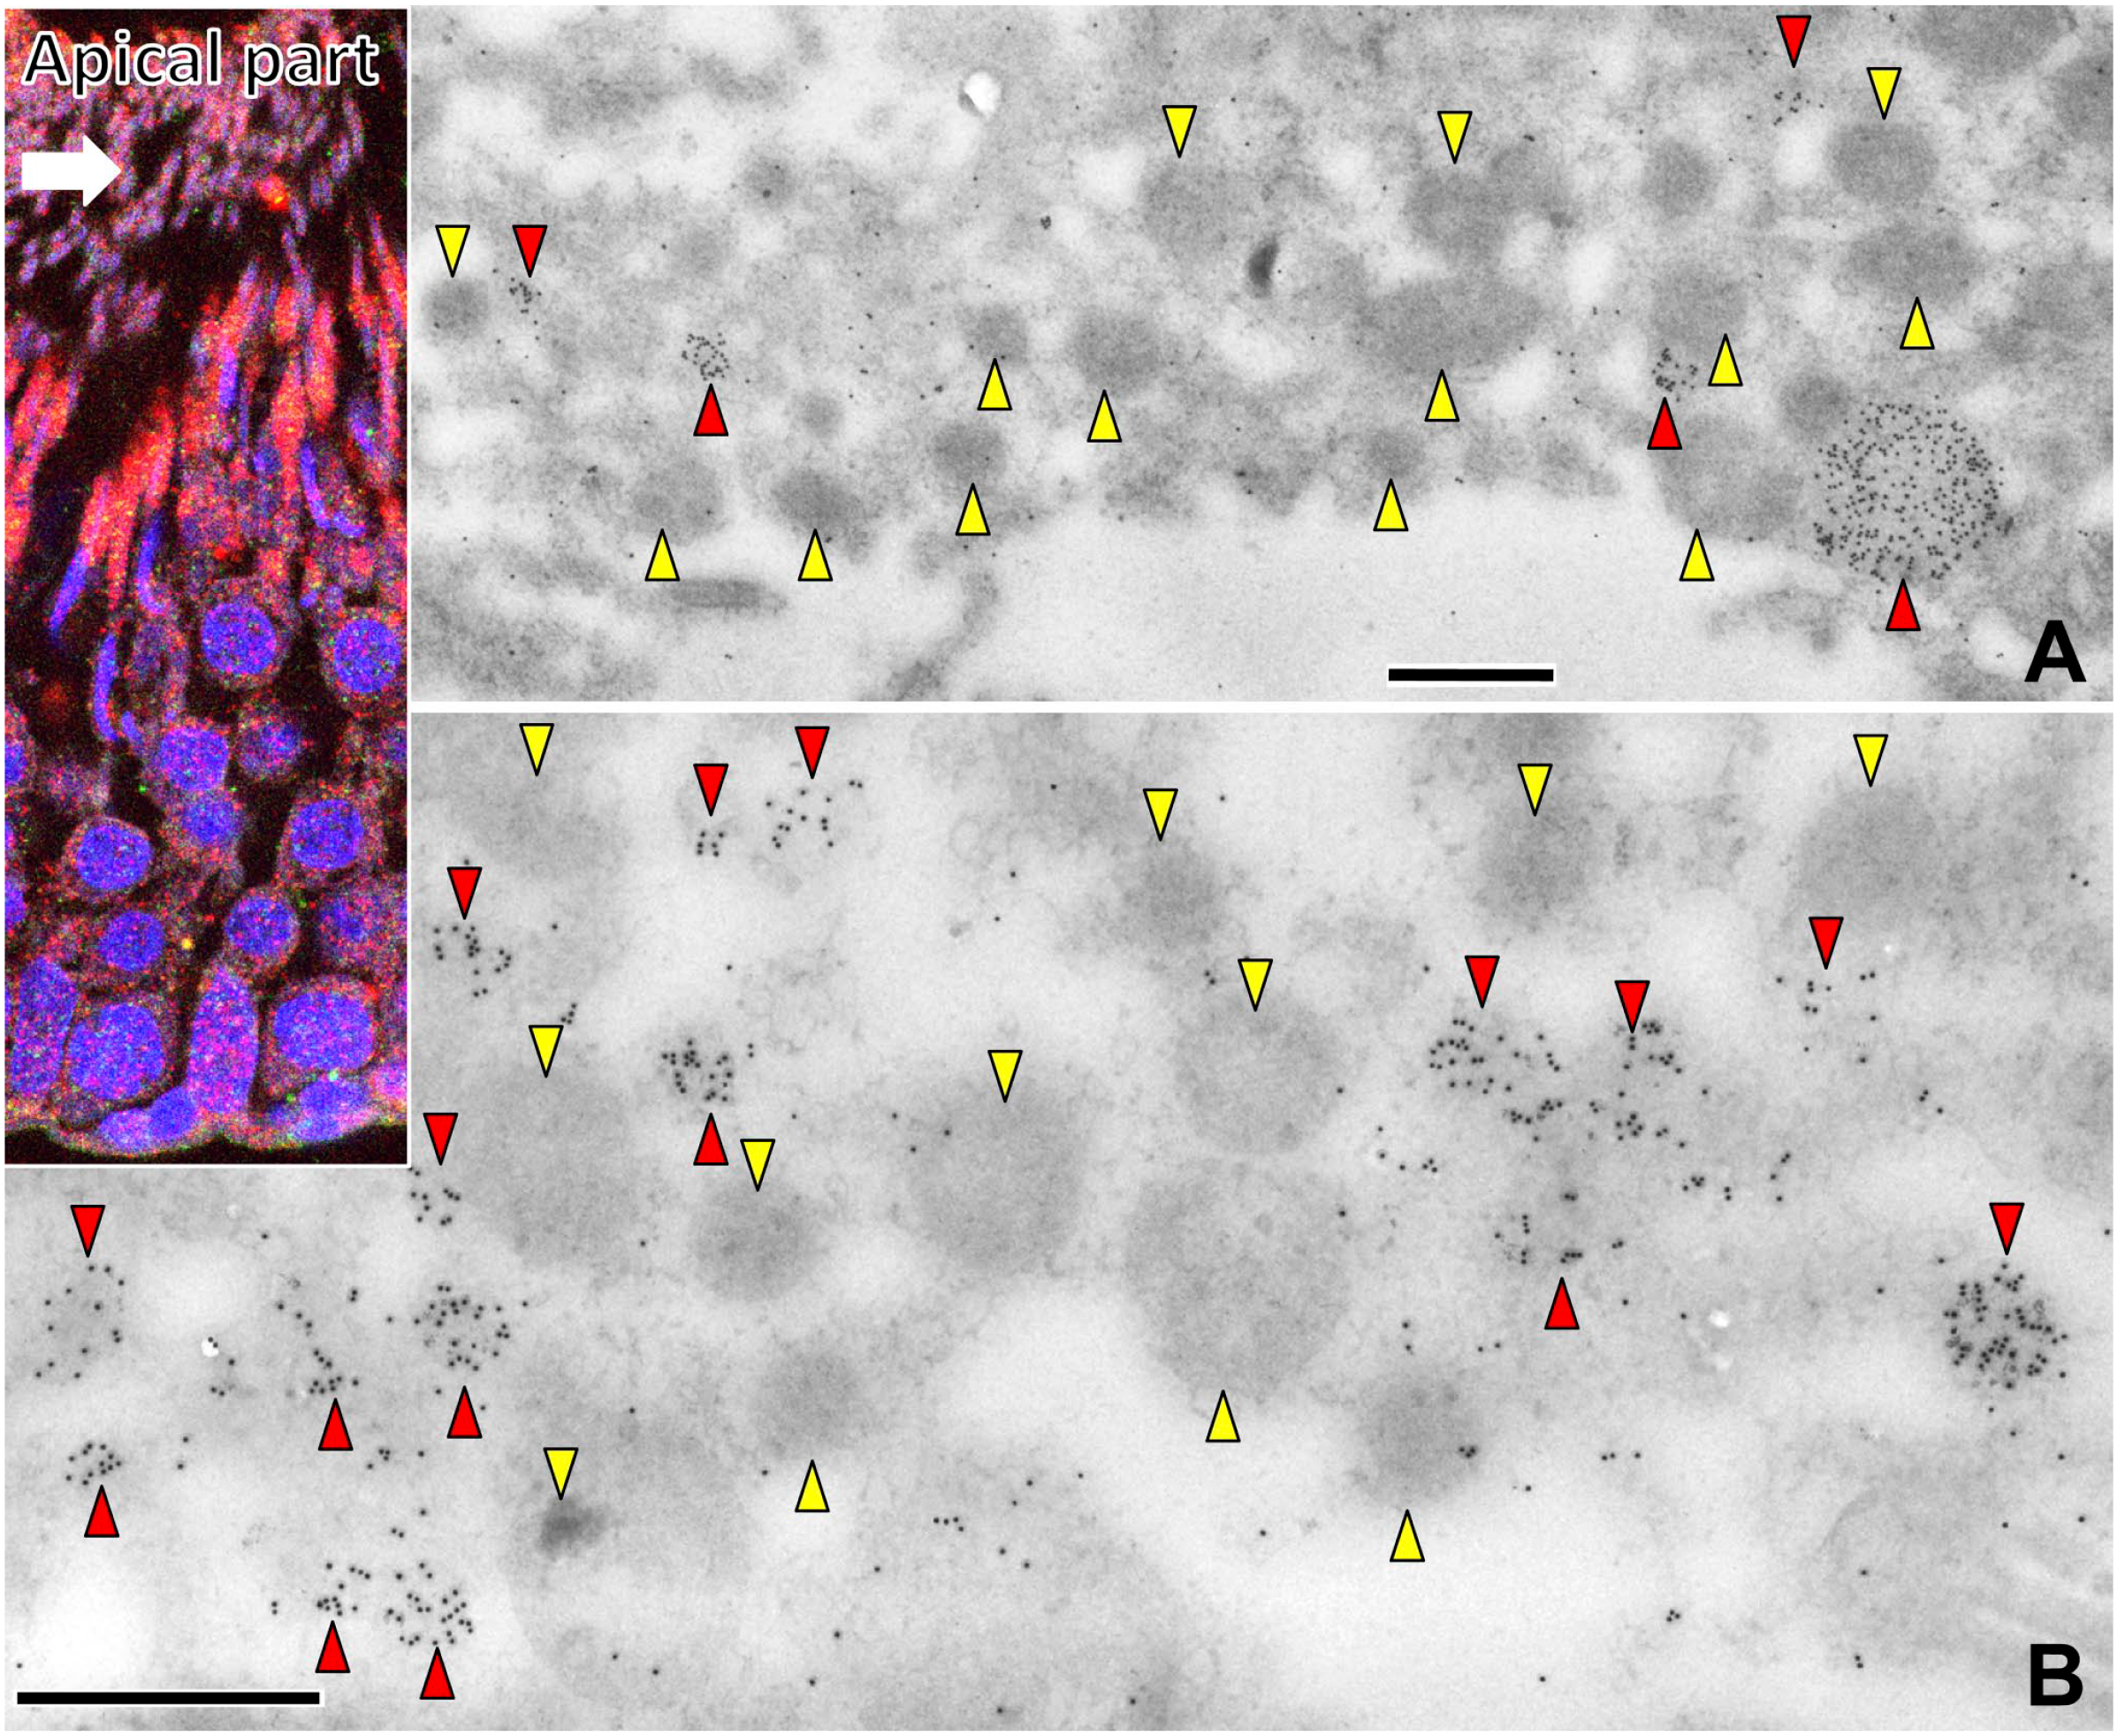
Immunoelectron micrographs of the broken cytoplasm in the luminal part of the seminiferous tubule with labeling of saposin D-IR (15 nm). Pale granules (red arrowheads) with saposin D-IR gold particles and dark granules (yellow arrowheads) without saposin D-IR gold particles were observed in the cytoplasm. Note that granules with saposin D-IR are <0.3 µm. The cell boundary was unclear (A), other organelles were not observed in low-magnification (A) and high-magnification (B) images, and the contents of these granules were degraded and secreted to the lumen. Numbers on bars are the scale in micrometers. Bars = 1 µm (A, B).
In the middle of seminiferous tubules, many lysosome-like high-density organelles with many saposin D-IR gold particles were observed in Sertoli cell bodies, especially around the heads of spermatids (Fig. 9A and B). Compared with the basal side of Sertoli cells (Fig. 9B), the apical side contained many small lysosome-like organelles with saposin D-IR (Fig. 9B), and no residual body was observed in the small organelles in the middle part (Fig. 9).
In the apical part of seminiferous tubules, many lysosome-like organelles with saposin D-IR gold particles were observed (Fig. 10). Pale granules with and dark granules without saposin D-IR were observed. The former were smaller than 0.3 µm, while the latter were variable in size. The cell boundary was unclear and other organelles were not observed, indicating that the cell body was degraded and the granule contents were secreted into the lumen.
PSAP mRNA Expression in the Testis (In Situ Hybridization)
We examined PSAP mRNA expression in the testis by in situ hybridization. Strong and weak signals were observed at the basal part of each seminiferous tubule (Fig. 11A). Although considerable differences in signal intensity were observed in these tubules, the cells constituting each tubule showed similar intensities on low-power micrographs (Fig. 11A). Controls for in situ hybridization using the sense probe (PSAP-S) showed no specific signals (Fig. 11B). Under higher magnification (Fig. 11C), both the strong and weak signals were localized on the basal sides of tubules. This distribution pattern differed slightly from that of PSAP-IR, which was also present in the middle layer of the tubules as well as the basal side (Figs. 3 to 7). This difference in distribution between PSAP-IR and PSAP-mRNA indicated that PSAP produced on the basal side is transported to the apical side of the Sertoli cells and spermatids.
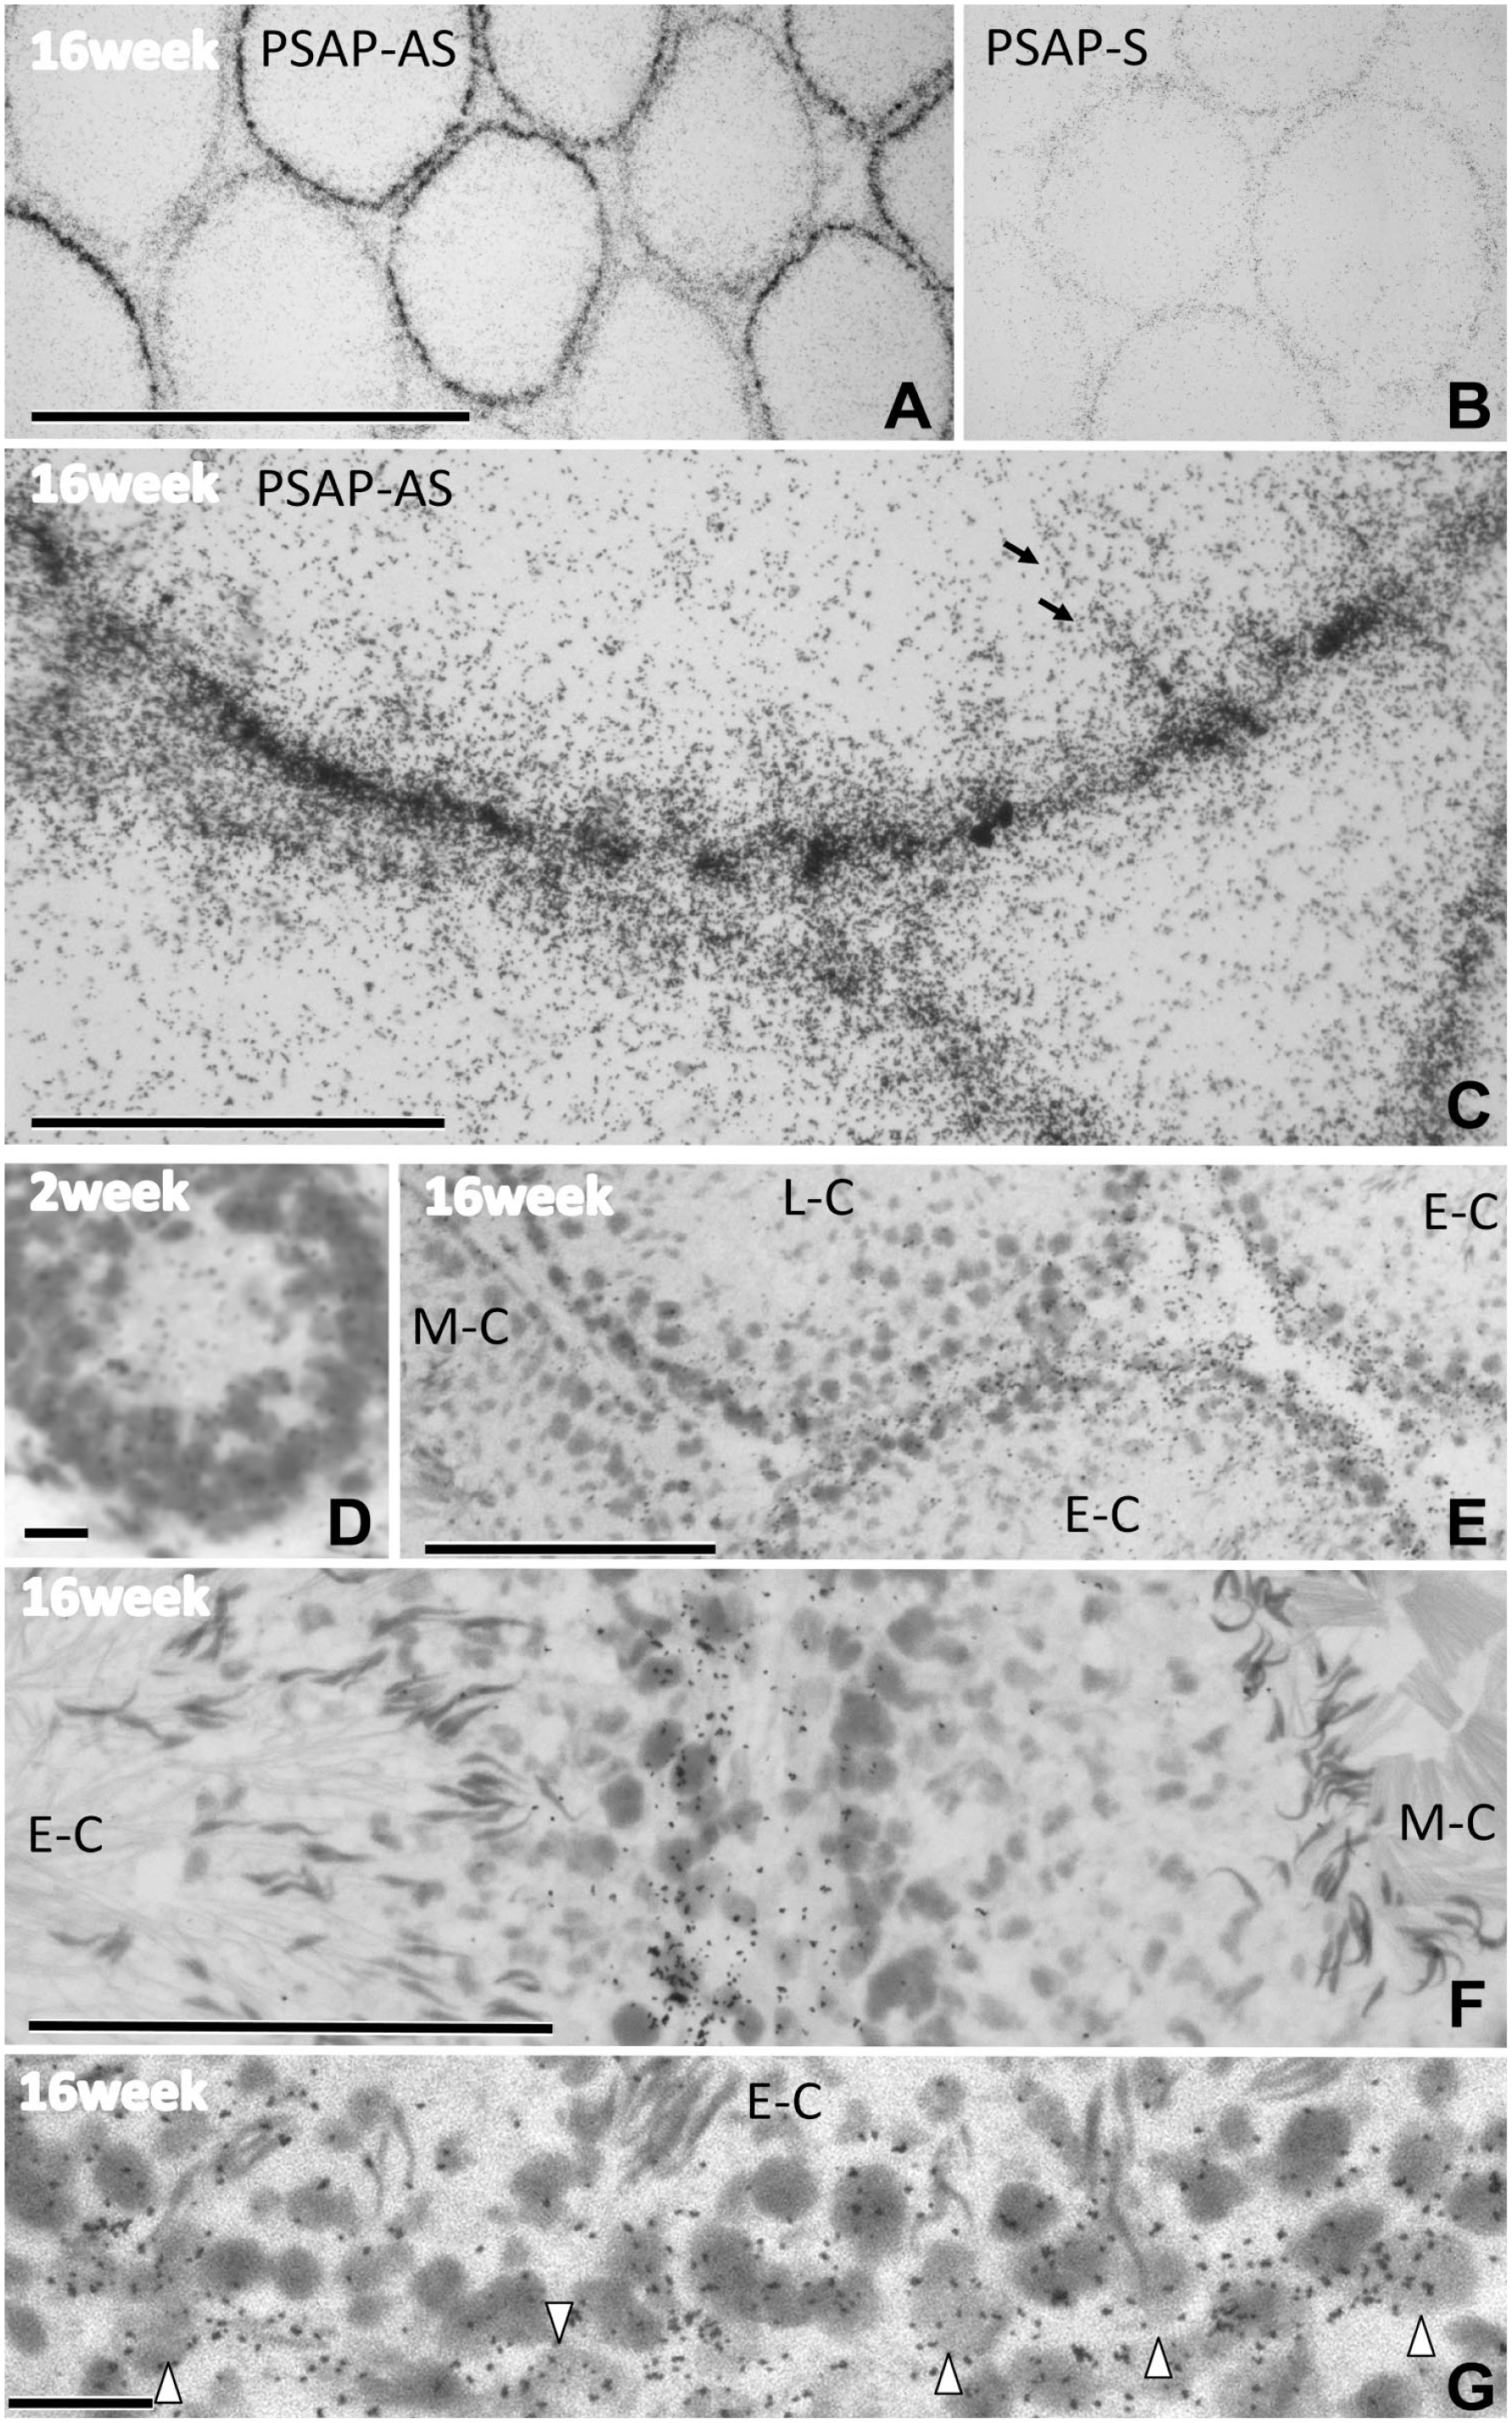
In situ hybridization of testis showing PSAP mRNA expression. PSAP-AS signals were observed as tiny black dots; strong and weak signals were mainly observed at the basal part of each seminiferous tubule (A). Signals of PSAP-S, the control for PSAP-AS, were very weak (B). At higher magnification (C), both the strong and weak signals were distributed only on the basal side of the tubules. In the upper tubule (C), moderate signals elongated (arrows) from strong signals on the basal side. Hybridized sections were stained with hematoxylin, which stained the nuclei (D–G), and the stages of the tubules were identified (F). At 2 weeks after birth, the signals were dispersed in all layers of the tubules (D), while in mature tubules the signals were localized on the basal side (E). Note the large signal difference between the early cycle (E-C) and the middle cycle just before sperm release (M-C) (E). At higher magnification, the signal difference between these two cycles was clear (F). Two types of cells with strong hybridization signals at the E-C were present on the basal side: Sertoli cells with triangle-shaped lager pale nuclei (arrowheads) and spermatids with oval-shaped dense nuclei (G). Numbers on the bars indicate the scale in micrometers. Bars = 500 µm (A, B), 100 µm (C, E, F), 10 µm (D, G). Abbreviation: PSAP, prosaposin.
In the sections subjected to in situ hybridization and staining with hematoxylin (Fig. 11D to G), cell nuclei and spermatid heads were also visible, allowing the stages of the tubules to be easily identified. The tubules with strong signals were seen in the E-C (stages I–VI) because many elongated spermatids were observed in all layers. In contrast, tubules with weak signals were seen in the M-C (stages VII–VIII), before the release of spermatids that came to line the apical surface of the epithelium (Fig. 11F). In higher-magnification micrographs (Fig. 11G), two types of cells with strong signals were evident on the basal side: Sertoli cells with triangle-shaped pale nuclei and spermatids with oval-shaped dense nuclei. In the interstitial space, Leydig cells also showed weak hybridization signals (data not shown).
Immunostaining of PSAP and Sortilin
During the E-C (Fig. 12A, D, and E), PSAP-IR was strong in the cytoplasm of Sertoli cells and weak in germ cells, and sortilin-IR was strong in the cytoplasm of Sertoli cells and weak on the surface of germ cells. During the M-C (Fig. 12B and F), PSAP-IR was strongest on the apical side, and sortilin-IR was observed on the surface of germ cells and the basal side of flattened Sertoli cells. During the L-C (Fig. 12C and G), PSAP-IR was weak in the cytoplasm of cells in all layers. PSAP-IR and sortilin-IR colocalization is shown in Fig. 12D. PSAP–sortilin complexes were distributed exclusively on the basal side in all three testis cycles (Fig. 12E to G).
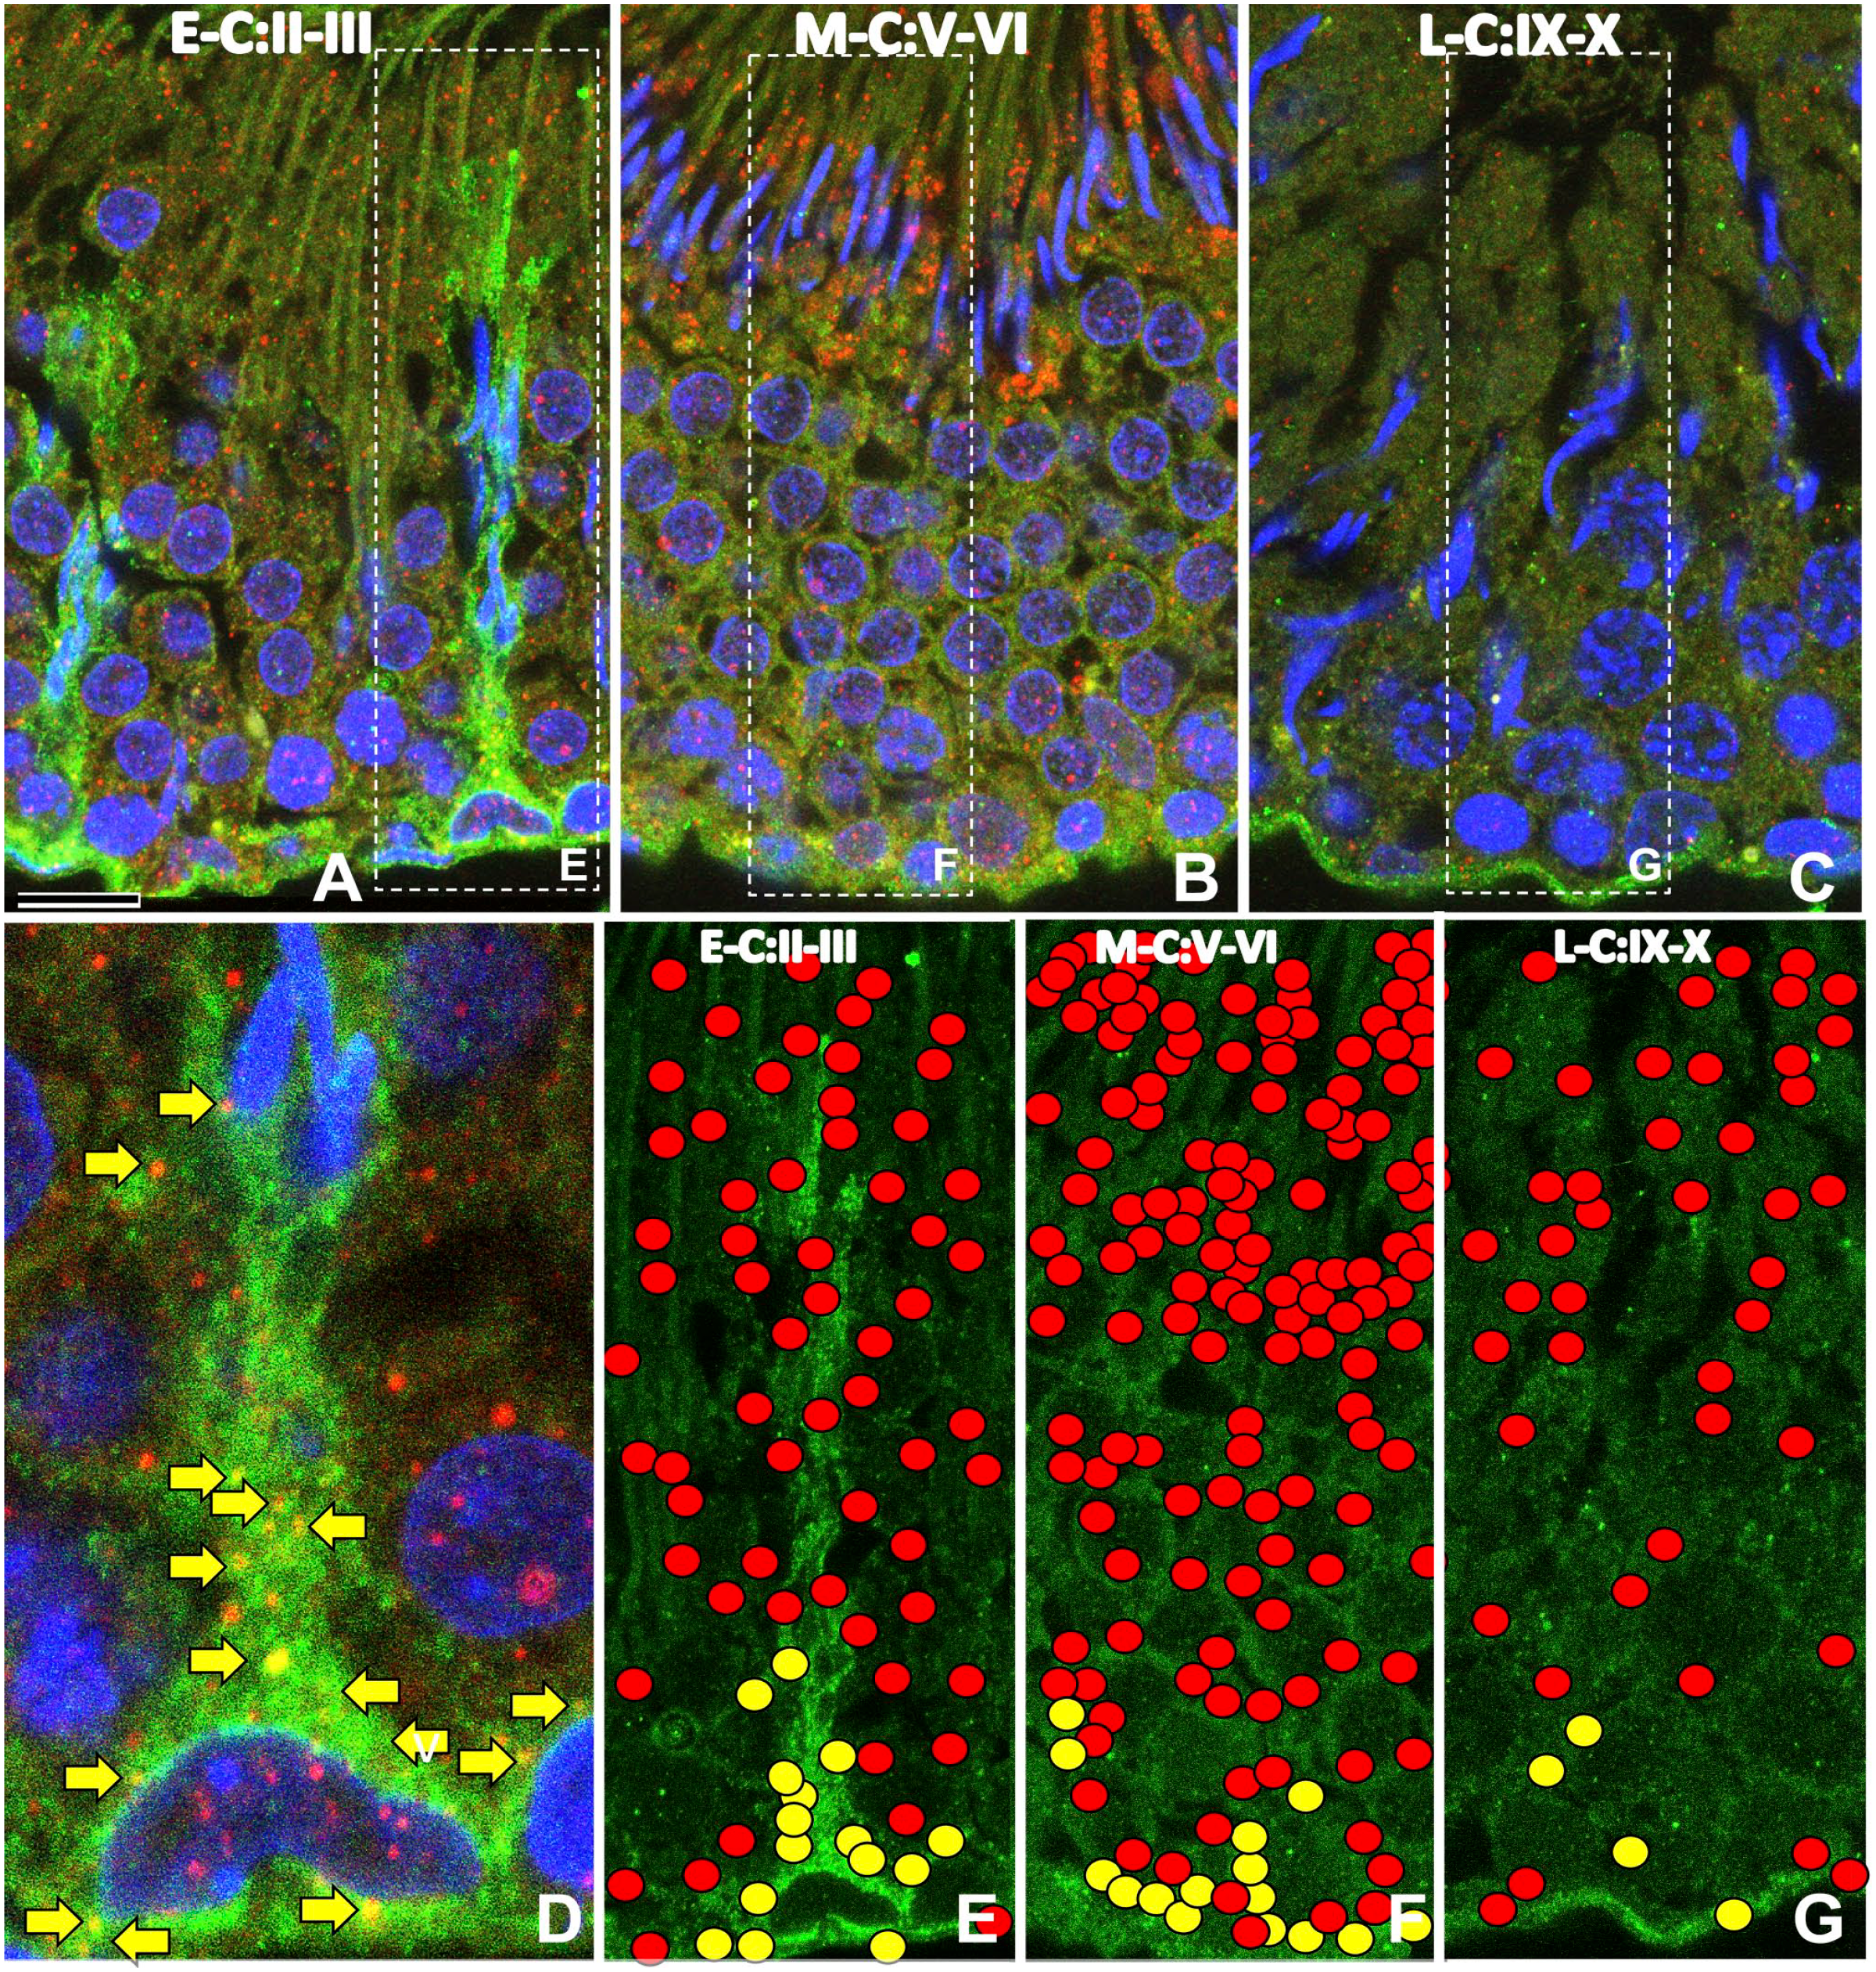
Immunofluorescence light micrographs of the rat testis at the early cycle (E-C; A, D, F), middle cycle (M-C; B, F), and late cycle (L-C; C, G) during postnatal week 12 stained with anti-PSAP (IM1, red) and anti-sortilin (green) antibodies and DAPI (blue). During the early cycle (A, D, E), PSAP-IR was localized to the cytoplasm of Sertoli cells and weakly in germ cells, and strong sortilin-IR was observed in the cytoplasm of Sertoli cells and weakly on the surface of germ cells. During the middle cycle (B, F), PSAP-IR was strongest on the apical side and weak on the surface of germ cells and some basal cells. During the late cycle (C, G), PSAP-IR was weak in the cytoplasm of cells in all layers. To assess the colocalization of PSAP-IR and sortilin-IR (yellow arrows), the Sertoli cell in (A) is shown at higher magnification (D). The distribution of PSAP (red circle) and PSAP–sortilin complex (yellow circle) was plotted on the figures of three testis cycles (E–G). The PSAP–sortilin complex was distributed only on the basal side in all three cycles. Numbers on bars are the scale in micrometers. Bar = 10 µm. Abbreviations: PSAP, prosaposin; IM1, anti-rat PSAP-specific antibody; DAPI, 4′,6-diamidino-2-phenylindole.
Discussion
The major proteolytic pathway of PSAP has been reported to begin with the cleavage of saposin A from PSAP and progress from trisaposin B-C-D to disaposins B-C or C-D, and finally to monosaposin. 2 The anti-PSAP IgG used in this study was prepared against a synthetic oligopeptide corresponding to the proteolytic portion between saposins C and D (Fig. 1) and reacted with PSAP but not with any of the four saposins. 24 Immunoblotting of the testis with this antibody revealed three bands at approximately 67.8, 43.1, and 30 kDa, likely corresponding to PSAP, trisaposin, and disaposin, respectively (Fig. 2A). As this antibody detected PSAP or proteolytic PSAP, but not saposins, it was useful for tracking PSAP.
Previous studies demonstrated the trophic activity of PSAP and an 18-mer amino acid derived from PSAP in the nervous system.13,15,17,18,24,37 PSAP is also involved in the development and maintenance of accessory sex glands, as well as the testis.21,23,38 Fragments of PSAP from rooster sperm promoted sperm–egg binding and improved fertility in chickens. 39 There is some debate regarding whether PSAP functions as a major secretory product or as a lysosomal enzyme for residual body degradation.3,4,11,40 In their review, Morales et al. 21 reported “Although PSAP (70kDa) was first considered as being exclusively secreted to the extracellular space and PSAP (65kDa) to the lysosome, recent immunocytochemical studies demonstrated the presence of PSAPs (70kDa, 65kDa) and 15kDa saposins in lysosomes.” Morales et al. 9 also reported that “because the antibody used in this study binds PSAP as well as all four saposins, 11 the identity of the immunolocalized molecule in the tissue is unknown.” Therefore, the route by which the secreted PSAP reaches its site of action was unclear.
Although Morales et al. 23 presented a schematic representation of direct secretion of 70-kDa PSAP, our findings indicated a different route of secretion (Fig. 13). Our findings showed that the PSAP–sortilin complex is targeted to large endosomes/lysosomes on the basal side of Sertoli cells (Fig. 12E to G), and free PSAP is targeted to small lysosome-like structures on the apical side of Sertoli cells (Figs. 12 and 13). Prominent PSAP production occurred in Sertoli cells after 8 weeks. Immunoelectron microscopy showed accumulation of small lysosome-like organelles with PSAP-IR around many spermatid heads (Fig. 9). In these small lysosomes on the apical side of Sertoli cells (Fig. 9A and B), no residual bodies were observed, unlike on the basal side (Fig. 8B to D). Strong PSAP-IR on the apical side of Sertoli cells or in the cytoplasmic lobe of spermatids (Fig. 6B to E) was not the IR of saposins but rather PSAP-IRs because the anti-PSAP antibody does not react with saposins. Therefore, PSAP not only degrades residual bodies but is also secreted around spermatids on the apical side of Sertoli cells. PSAP in the cytoplasmic lobe detached from sperm or Sertoli cell was released into the seminiferous tubule lumen and stimulated spermatogenesis.
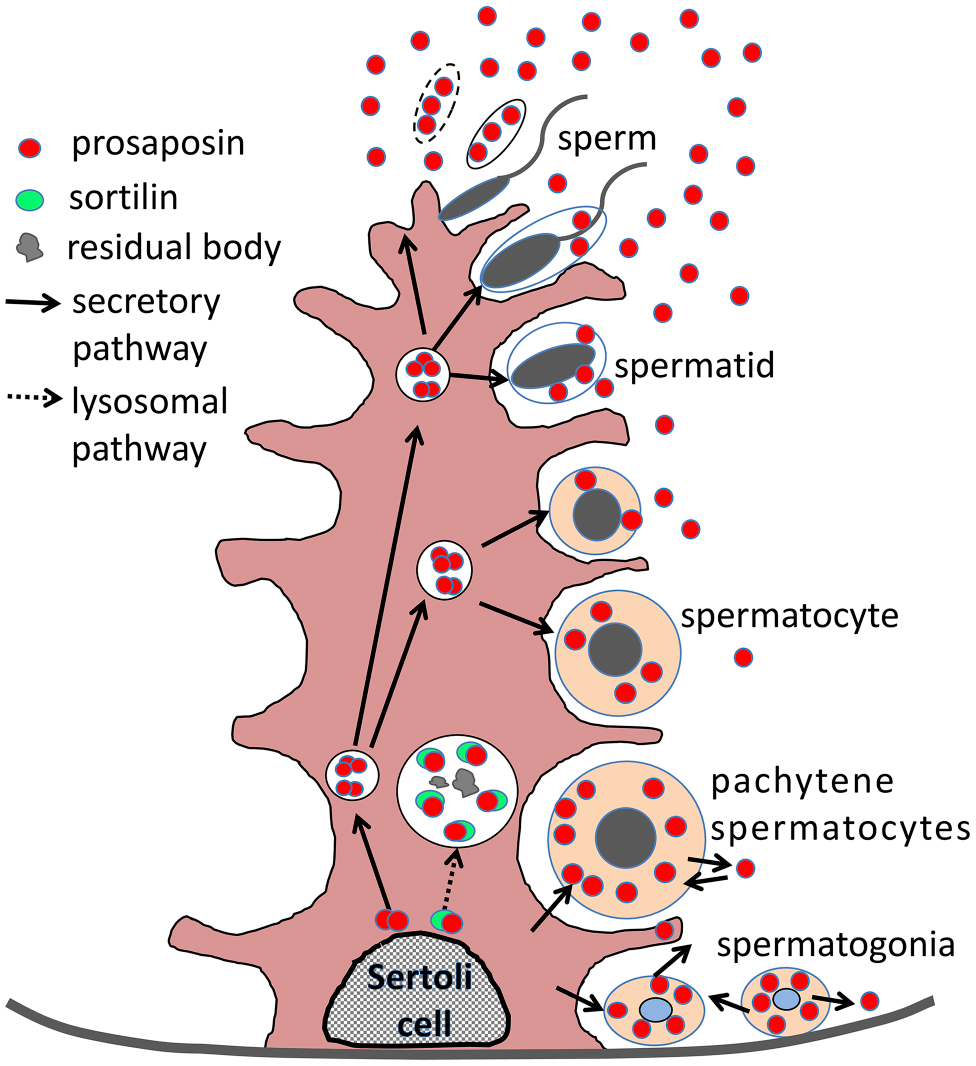
Schematic of the relationship between PSAP and germinal cells in adult testis. Sertoli cells produce PSAP, and large phagolysosomes use PSAP to degrade spermatocytes in the basal cytoplasm of Sertoli cells. Sertoli cells also secrete PSAP in a paracrine manner to germinal cells. On the basal side, spermatogonia and pachytene spermatocytes produce PSAP and use it in an autocrine manner. On the apical side, cells containing many granules disassemble to release PSAP. Abbreviation: PSAP, prosaposin.
PSAP was reported to be present predominantly in Sertoli cells. 9 However, our results of immunohistochemical and immunofluorescence analyses also showed strong PSAP-IR in the spermatogonia, especially in the E-C and L-C (Figs. 3B and D, 6B and E). Immunoelectron microscopy also revealed saposin D-IR in the spermatogonia on the basal side of the seminiferous tubules (Fig. 8E to I). PSAP mRNA expression in the round cells on the basal side of tubules was as strong as in the Sertoli cells (Fig. 11G). These spermatogonia or early spermatocytes also produce abundant PSAP and may secrete it to stimulate immature germ cells in a paracrine or autocrine manner.
Trafficking of PSAP to lysosomes is mediated by sortilin 29 and oligomerization of PSAP is crucial for its entry into the secretory pathway. 41 PSAP-IR and sortilin-IR colocalization is shown in Fig. 12D; also, there were fewer large lysosomes containing PSAP–sortilin complex on the basal side than small lysosomes containing only PSAP (Fig. 12E to G). PSAP movement in the testis is shown in Fig. 13. PSAP is produced mainly on the basal side of Sertoli cells and conveyed to the lysosome after binding with sortilin, or to the apical side of Sertoli cells in small lysosomes for secretion.
The PSAP mRNA level in the testis was high, as in the choroid plexus.19,33 However, the PSAP mRNA level in the testis varied significantly (Fig. 11A and C). After staining with hematoxylin, the nuclei and spermatid heads were clearly observed (Fig. 11E to G) and three cycles (early, middle, and late) could be identified (Fig. 11E). A high PSAP mRNA level was detected in the E-C, when two generations of spermatids and elongate spermatids were within the deep crypts of the Sertoli cells, but not in the M-C when mature spermatids lined the surface of the epithelium (Fig. 11E to G).
PSAP-IR was also observed in the nuclei of the germ cells on the basal side of the tubules (Fig. 3D). Although nonspecific IR in the nuclei were observed in the section stained with normal IgG (Fig. 4E), Sun et al. 42 showed that exogenous PSAP is predominantly localized in nuclei and suggested that endogenous PSAP enters the nucleus under certain conditions. PSAP is involved in signal transduction pathways18,37 and overexpressed in nuclei following Kainic acid–induced neurotoxicity. 24 In testis, immature germ cells on the basal side of seminiferous tubules may use PSAP for signal transduction.
In conclusion, with specific antibodies to PSAP and sortilin, we demonstrated two pathways of targeting PSAP to large lysosomes for degradation or to small lysosomes for secretion. In situ hybridization also suggested that some types of tubular cells in young and adult animals produce PSAP for pivotal trophic functions in organogenesis and spermatogenesis.
Footnotes
Acknowledgements
The authors wish to thank D Shimizu for his excellent technical support.
Competing Interests
The author(s) declared no potential conflicts of interest with respect to the research, authorship, and/or publication of this article.
Author Contributions
Conceptualization: HN, SS, FH, SM. Data curation: KY, XL, SK, FK. Formal analysis: KY, XL, HN, SK, FK, SS. Funding acquisition: HN, SM. Investigation: SS. Methodology: SK, FK. Project administration: HN, SS, SM. Resources: HN, SK, FK, HW, FH. Software: HN, HW, SS. Supervision: SS, FH, SM. Validation: SS. Visualization: KY, XL, HN. Writing – original draft: KY, HN. Writing – review & editing: SS, FH, SM.
Funding
The author(s) disclosed receipt of the following financial support for the research, authorship, and/or publication of this article: This study was supported by grants from the Japan Society for the Promotion of Science KAKENHI (No. 21K06736, No. 21K09126).
Ethical Approval
All applicable international, national, and institutional guidelines for the care and use of animals were followed. This article does not discuss any studies with human participants performed by any of the authors.