
Abstract
We previously demonstrated that 8 weeks of moderate-intensity endurance training is safe and improves muscle function and characteristics of sickle cell disease (SCD) patients. Here, we investigated skeletal muscle satellite cells (SCs) in SCD patients and their responses to a training program. Fifteen patients followed the training program while 18 control patients maintained a normal lifestyle. Biopsies of the vastus lateralis muscle were performed before and after training. After training, the cross-sectional area and myonuclear content in type I fibers were slightly increased in the training patients compared to non-training patients. The SC pool was unchanged in type I fibers while it was slightly decreased in type II fibers in the training patients compared to non-training patients. No necrotic fibers were detected in patients before or after training. Therefore, the slight myonuclear accretion in type I fibers in trained SCD patients may highlight the contribution of SCs to training-induced slight type I fiber hypertrophy without expansion of the SC pool. The low training intensity and the short duration of training sessions could explain the low SC response to the training program. However, the lack of necrotic fibers suggests that the training program seemed to be safe for patients’ muscle tissue.
Introduction
Sickle cell disease (SCD) is the most frequent genetic disorder worldwide, and the number of patients is continually increasing, constituting a major global health burden. 1 This hemoglobinopathy is related to the synthesis of abnormal hemoglobin S (HbS). When deoxygenated, HbS may polymerize, potentially resulting in the sickling of its host red blood cells (RBCs). 1 Sickle RBCs are less deformable and adhere more to the endothelium, promoting their entrapment in the microcirculation that could progress to painful vaso-occlusive crises (VOC). 1 Sickle RBCs are also fragile, causing massive hemolysis, and severe chronic hemolytic anemia. 1 Moreover, SCD patients are subjected to arterial oxygen Hb desaturation.2,3
Anemia, arterial Hb desaturation, altered hemodynamics, iterative vaso-occlusions, and low levels of physical activity, all contribute to a profound remodeling of skeletal muscle observed in SCD patients. 4 This remodeling is characterized by a capillary network rarefaction, a hypotrophy of type I and IIa fibers, an altered muscle oxidative potential, and the expansion of satellite cell (SC) pool compared with healthy control counterparts. 5
SCs play an essential role in muscle homeostasis and growth. Located under the basal lamina of myofibers, 6 SCs typically reside in a quiescent state. However, following muscle injury, they become active, migrate to the site of the injury and start to proliferate. Following proliferation, some SCs differentiate into myoblasts and either fuse with each other forming new myofibers or fuse to an existing muscle fiber, giving them their nucleus, thereby leading muscle fiber hypertrophy. 7 – 9 Other SCs return to a state of quiescence to reconstitute the SC pool. 7 – 9
The activation and expansion of the SC pool also occur in response to exercise. Resistance training is a well-recognized trigger of SC pool expansion and myonuclei addition to promote muscle growth.10–12 Studies have shown more contrasted results on the effects of endurance exercise training on SC pool. One study showed no response in the SC pool following endurance training in obese type 2 diabetes patients, 13 whereas other studies have shown an increase in the SC pool in elderly subjects, 14 healthy young men, 15 and sedentary adults. 16 Joanisse et al. 17 also reported an increase in SCs activation without expansion in non-hypertrophic exercise training protocols in healthy subjects. Interestingly, SC pool response to endurance training was fiber type-specific.15–17
Due to anemia and complications of SCD on cardiopulmonary system, the physical ability of SCD patients is poor. 18 Moreover, SCD patients are often apprehensive of physical exercise/activity. Indeed, blood acidosis associated with intense activity can promote Hb polymerization, sickle cell formation and potentially vaso-occlusions. 19 Consequently, SCD patients often display hyper-sedentary lifestyles worsening their already low physical ability.4,18 However, recent studies have demonstrated the safety and feasibility of endurance training in children and adults with SCD, with potential benefits for their functional capacity and quality of life.20–24 Our previous study 24 reported several muscle benefits after 8 weeks of endurance training, such as slight hypertrophy of type I muscle fibers. This specific adaptation of type I fibers is related to the nature of the moderate-intensity endurance training program which recruited this type of fibers in particular. 25 Such an adaptation could possibly be explained by the activation and/or expansion of the SC pool. Moreover, given the profound remodeling of the skeletal muscle in SCD patients and the fact that exercise is a potential novel therapeutic strategy,21,23,24 it might be interesting to investigate the safety of the training program for the muscle tissue. In that matter, the analysis of signs of muscle damage, such as necrotic fibers, 26 is of paramount importance.
The aim of the present study was to analyze the skeletal muscle SCs in SCD patients and their responses to 8 weeks of moderate-intensity endurance training. It was hypothesized that (1) the training program would activate and/or expand the SC pool in type I fibers, implying that SCs would contribute to the slight type I fiber hypertrophy previously observed by our team 24 and (2) no necrotic fibers would be detected after the training program.
Materials and Methods
Patients
Thirty-three patients completed this study (34 ± 10 years old, 18 [55%] men and 15 [45%] women). Patients were randomly assigned either to a training (n=15) or a non-training group (n=18). Patients in the training group completed a specific 8-week endurance training program, while the patients of the non-training group maintained during the same period their usual lifestyle. Patients’ baseline characteristics were reported separately21,23 but are repeated here for the convenience of the reader (Table 1). Anthropometric, hemoglobinic or hematologic data of SCD patients were similar between groups.21,23 This study took place in the referral center for major sickle cell syndromes and the cardiac rehabilitation unit of Hôpitaux Universitaires Henri Mondor (AP-HP) at Créteil (France). Eligible volunteers were informed about the nature and potential risks of the experimental procedures prior to giving their written consent. This study was approved by the ethics committee and conforms to the standards set by the Declaration of Helsinki for human studies. The University Hospital of Saint-Etienne was the promoter of this study (ClinicalTrials.gov NCT02571088).
Baseline Characteristics of SCD Patients.
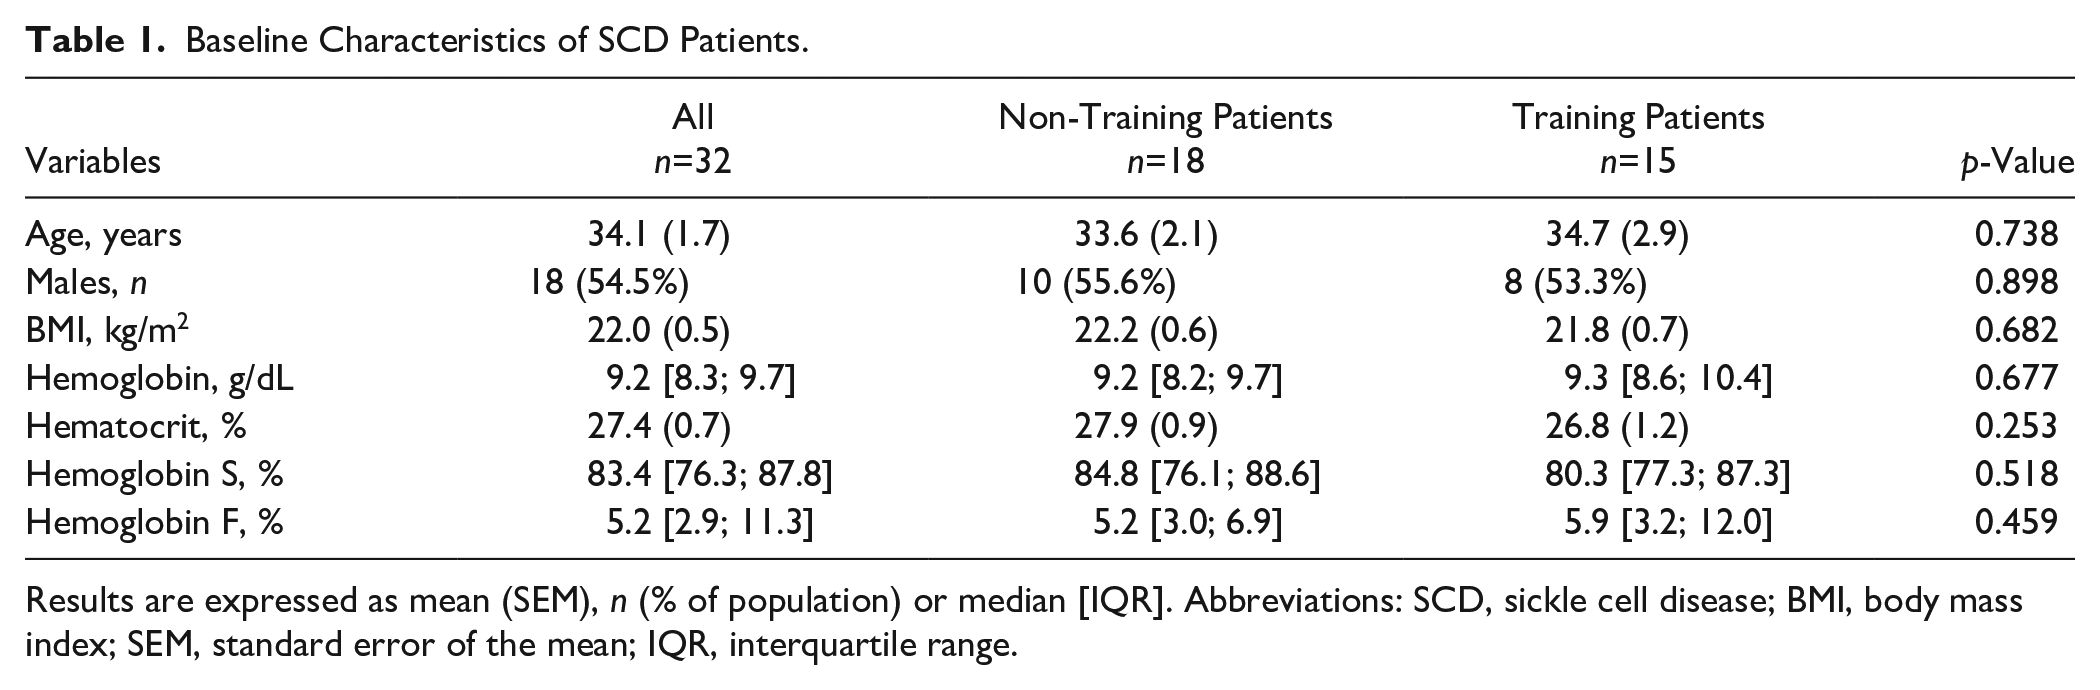
Results are expressed as mean (SEM), n (% of population) or median [IQR]. Abbreviations: SCD, sickle cell disease; BMI, body mass index; SEM, standard error of the mean; IQR, interquartile range.
Patients were not included if they had (1) any other hemoglobinopathy than SCD, (2) experienced a vaso-occlusive episode in the 6 weeks preceding the protocol, (3) been transfused for less than 3 months, (4) been receiving cardiac antiarrhythmic therapy or medical treatment modifying the activity of the autonomic nervous system like beta-blockers, sympathomimetics and atropine, and (5) unresolved inflammatory illnesses, type I or II diabetes, obesity (body mass index [BMI] above 35) or AIDS. Patients who were pregnant, postpartum, or breastfeeding were also not included. Patients who did not adhere to the protocol were excluded.
Study Design
Muscle Biopsies
Muscle biopsies were obtained from the vastus lateralis muscle before and after the 8-week period in the same conditions. After shaving, asepsis, and local anesthesia, a small incision (~7 mm) cutting superficial tissues including epimysium was performed. A Weil-Blakesley forceps (Lawton, Tittlingen, Germany) was introduced in the subjacent muscle, and the sample extracted (approximately 150 mg). Parts of the biopsy sample containing well-identified fascicles were oriented under a stereo microscope, frozen in isopentan (Chevron Phillips Chemicals International, Overijse, Belgium) and finally stored in liquid nitrogen until histochemical and immunohistochemical analyses were performed. The second biopsy was performed ~ 1 week after the last training session and was collected a few centimeters proximal from the first one.
Endurance Training Program
Patients of the training group underwent a 24-session endurance training program (8 weeks, 3 sessions a week, 2 successive sessions at least 1 day apart). Each session was performed on a cycle ergometer and consisted of (1) an initial warm-up (5 min), (2) a constant-load endurance exercise (30 min leading to steady state in blood lactate concentrations at approximately 2.5 mmol.L-1), (3) a cool-down (5 min), and finally (4) a light stretching period (5 min). All sessions were performed under the supervision of a physician to ensure the clinical observation of the patients and that patients were sufficiently hydrated. During the training sessions, peripheral oxygen saturation, heart rate, and blood lactate concentrations were measured to ensure the safety of exercise and the absence of drift in lactate concentrations. Based on the blood lactate concentrations recorded during each training session, and assuming a target set approximately at 2.5 mmol.L-1, exercise workload was adjusted for the following session, as previously described. 18
Histochemical and Immunohistochemical Analyses
On each muscle biopsy, histochemical and immunohistochemical analyses were performed on four serial cross-sections to analyze fibers morphology and phenotype, SCs, myonuclei and necrotic fibers of SCD patients at baseline and after the training period. All muscle analyses were performed in a double-blind manner. Figure 1 shows the immunohistochemical analyses to identify muscle SCs per fiber type.
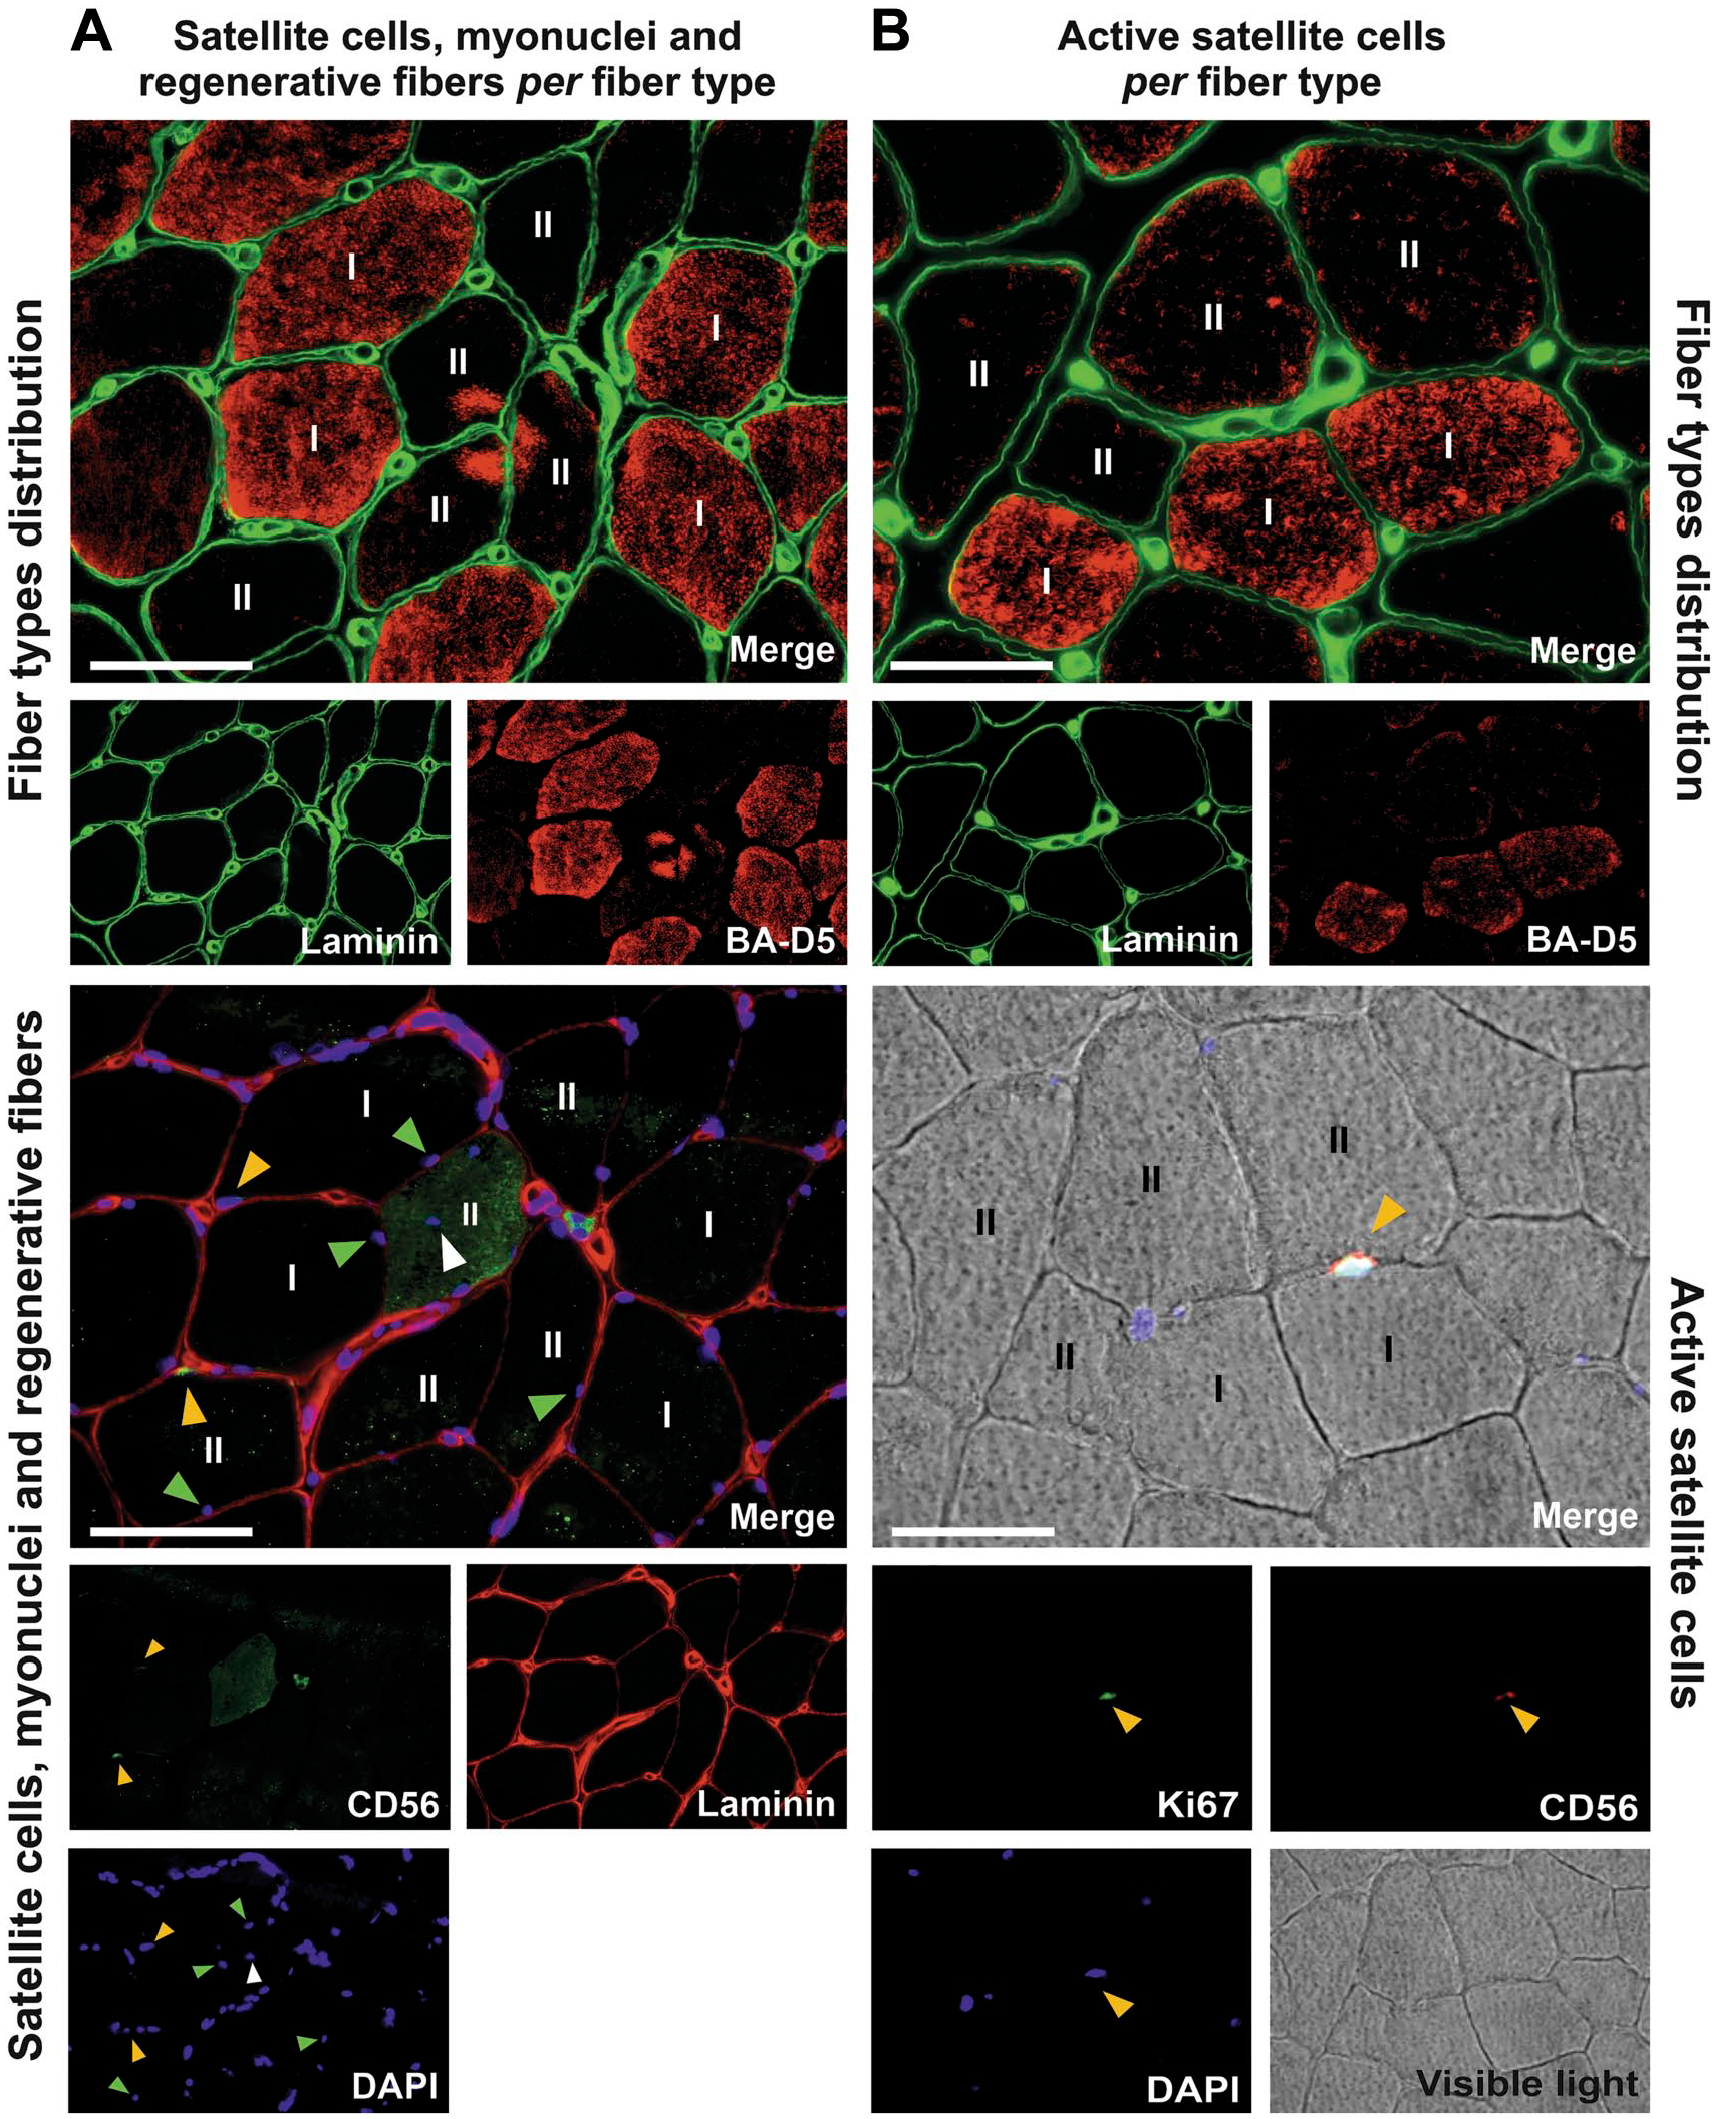
Identification of skeletal muscle SCs per fiber type in sickle cell disease patients. (A) SC pool, myonuclei and regenerative fibers per fiber type were analyzed using serial the cross-sections. At the top, the first serial cross-section shows BA-D5 staining (red) used to determine the fiber type. [BA-D5+ fibers were considered as type I fibers (I), and BA-D5- fibers were considered as type II fibers (II)] Below, the second cross-section shows the nuclei (DAPI, blue), and SCs (CD56, green) labeling. In both cross-sections, laminin (green on top and red below) was used to visualize the extracellular matrix. Yellow arrows point at SCs (CD56+ cells), green arrows point at myonuclei and the white arrow point at an internalized nucleus within a regenerative fiber (CD56+ fiber, stained in green). (B) Active SCs per fiber type were analyzed using serial cross-sections. On the top, the first serial cross-section shows BA-D5 staining (red) used to determine the fiber type, as explained above. Below, the second cross-section shows the nuclei (DAPI, blue), SCs (CD56, red), and active SCs (Ki67, green) labeling. Arrows point at an active SC (CD56+ Ki67+ cell). Scale bars represent 50 μm. Abbreviations: SC, satellite cell; DAPI, 4’6-dia-midino-2-phenylindole.
Fiber Types Distribution
The first muscle cross-section was performed to identify fiber types distribution. BA-D5 and anti-laminin-α1 primary antibodies were used to identify type I myosin heavy chain and the extracellular matrix, respectively (Fig. 1A and B, top). Muscle fibers with BA-D5+ were considered as type I fibers and those with BA-D5- as type II fibers. The staining procedure was as follows. Cross-sections were air-dried for 1 hr. Thereafter, muscle cross-sections were incubated with a 10% bovine serum albumin (BSA) diluted in a phosphate-buffered saline solution (PBS) for 15 min at room temperature. Next, cross-sections were incubated for 1 hr at +37C with primary antibodies: anti-laminin-α1 (1:200, rabbit, Sigma, Saint-Quentin-Fallavier, France) and BA-D5 (2:3, mouse, Developmental Studies Hybridoma Bank). Cross-sections were washed in PBS (1 short wash followed by a 10-min one), and then incubated for 1 hr in the dark at +37C with the appropriate secondary antibodies: Alexa Fluor 546 (1:400, goat anti-mouse, Invitrogen, Cergy-Pontoise, France), and Alexa Fluor 488 (1:400, goat anti-rabbit, Invitrogen), diluted in 10% BSA and PBS. Again, cross-sections were washed and mounted with Fluoromount (Invitrogen). The sections were allowed to dry overnight at +4C in the dark and stored in the same conditions until further analysis.
SCs, Myonuclei, Regenerative Fibers, and Fiber Morphology
The second muscle cross-section was performed to identify SCs, myonuclei, and regenerative fibers (Fig. 1A, below). Myonuclei were stained with 4’6-dia-midino-2-phenylindole (DAPI). The co-staining between DAPI and CD56 served to identify SCs. 27 CD56 was also used to identify regenerating fibers (CD56+ fiber). 27 Anti-laminin-α1 was used to identify the extracellular matrix and measure the cross-sectional area (CSA). The myonuclear domain was determined as follows: CSA/number of myonuclei. 28 The percentage of fibers with one or more centrally located nuclei, called internalized nuclei, was determined. The staining procedure was done entirely at room temperature as follows. Muscle cross-sections were air-dried for 30 min, then fixed (10 min in 4% formaldehyde). After 2 short washes in PBS, cross-sections were incubated for 1 hr with a buffer agent (10% human serum, 90% PBS). Cross-sections were then washed in PBS (1 short wash followed by a 10-min one). Thereafter, cross-sections were incubated for 2 hr with the primary antibodies: CD56 (1:50, mouse, Dako, Santa Clara, CA) and anti-laminin-α1 (1:200, rabbit, Sigma, Saint-Quentin-Fallavier, France), diluted in a 10% human serum and a PBS solution. Again, cross-sections were washed in PBS, and then incubated for 1 hr in the dark with the appropriate secondary antibodies: Alexa Fluor 568 (1:400, goat anti-rabbit, Invitrogen), and Alexa Fluor 488 (1:400, goat anti-mouse, Invitrogen), diluted in 10% human serum and PBS. After a final wash in PBS, the cross-sections were mounted with DAPI (Invitrogen). The sections were allowed to dry overnight at +4C in the dark and then stored in the same conditions until further analysis.
Active SCs Content
The third muscle cross-section was used to identify active SCs (Fig. 1B. below). Ki67 is a proliferating marker which, combined with DAPI and CD56, enables identification of active SCs (CD56+ Ki67+ cells). 29 The number of active SCs was expressed for 100 SCs, in accordance with others studies.29,30 The staining procedure was the same as described for cross-sections 2 except that 0.2% Triton was added to the buffer agent and to the antibody solutions, and Ki67 (1:500, rabbit, Abcam, Cambridge, UK) was used instead of laminin. Secondary antibodies were Alexa Fluor 546 (1:400, goat anti-mouse, Invitrogen) and Alexa Fluor 488 (1:400, goat anti-rabbit, Invitrogen).
Necrotic Fibers
A hematoxylin-eosin-saffron (HES) staining was performed on the fourth muscle cross-section to assess necrotic fibers. This parameter was analyzed on the entire cross-section and expressed in number of patients showing histological signs. Muscle cross-sections were air-dried for 1 hr. Next, cross-sections were dipped in hemalum for 5 min and then washed several times with distilled water. After, cross-sections were dipped in eosin for 2 min and then washed twice in absolute alcohol baths. Thereafter, cross-sections were dipped in saffron for 5 min and then washed in 3 successive alcohol baths: 95% alcohol, 100% alcohol, and 100% alcohol, respectively. Finally, cross-sections were dipped in xylene for a few seconds and then mounted with Eukitt (Eukitt®, EUK 100, CML, Nemours, France). The sections were dried 1 hr under a hood and then stored in the dark at room temperature.
Microscopy and Data Analyses
From the muscle cross-sections, all images were captured using an inverted epifluorescence microscope (IX-81, Olympus Corp., Tokyo, Japan)—objective was 10 and magnification was 100—coupled with a microscope digital camera (DP74, Olympus, Japan) with a X0.63 adapter and the software CellSens Dimension (Olympus, Germany). Images from the fiber-type cross-sections were captured at a resolution of 1920 x 1200 pixels while images from cross-sections used for SCs and active SCs were captured at a high resolution of 5760 x 3600 pixels. Image processing and analysis were done using ImageJ software (U.S. National Institute of Health, Bethesda, MD). CSA of muscle fibers was measured with ImageJ software. All measured parameters (CSA, SC content, myonuclei content, internalized myonuclei, regenerative fiber, active SC content), except for necrotic fibers, were analyzed in relation to fiber types (type I, BA-D5+; type II, BA-D5-). In accordance with the recommendations provided by Mackey et al. 29 to reliably evaluate the myonuclear content and the SC number in human skeletal muscle biopsies, the mean number of analyzed fibers per sample was 284 (min: 121; max: 515), except for the myonuclear content and domain analyses (mean: 65 [min: 39; max: 121]).
Statistics
The normality of each variable was assessed with the Shapiro-Wilk test. Descriptive results are expressed as mean (standard error of the mean [SEM]) when they follow a normal distribution, or median (inter-quartile range [IQR]) when they do not. The statistical analyses compared the absolute mean change (before versus after) between groups (training and non-training). We chose to compare the absolute mean change between groups, not the relative, because several parameters are equal to 0. T-tests for independent groups were used for variables following a normal distribution, while in the absence of a normal distribution, Mann-Whitney tests were used for independent variables by group. Categorical variables, presented as numbers (percentage of population), were compared with Fisher’s exact test. Statistical significance was set at p<0.05, while a trend was considered for 0.05≤p<0.10. All calculations were performed using Statistica 8 (StatSoft Inc., Tulsa, OK).
Results
Baseline Data and Comparisons
Table 2 shows the baseline CSA, SCs and myonuclei of all SCD patients and separated into non-training and training groups. Most patients displayed regenerative fibers (CD56+ fibers) (22 of the 33 patients, 67%) and internalized myonuclei (21 of the 33 patients, 64%). Active SCs (CD56+ Ki67+) were observed in 8 of the 33 patients (24%). No necrotic fibers were detected in any patient. The comparison between the two groups at baseline highlighted that the myonuclear domain in type I fibers and the SC pool in type II fibers were significantly higher in training compared with non-training patients. No significant between-group differences were found for any other parameters.
Baseline Muscle CSA, SCs and Myonuclei of Non-Training and Training SCD Patients.
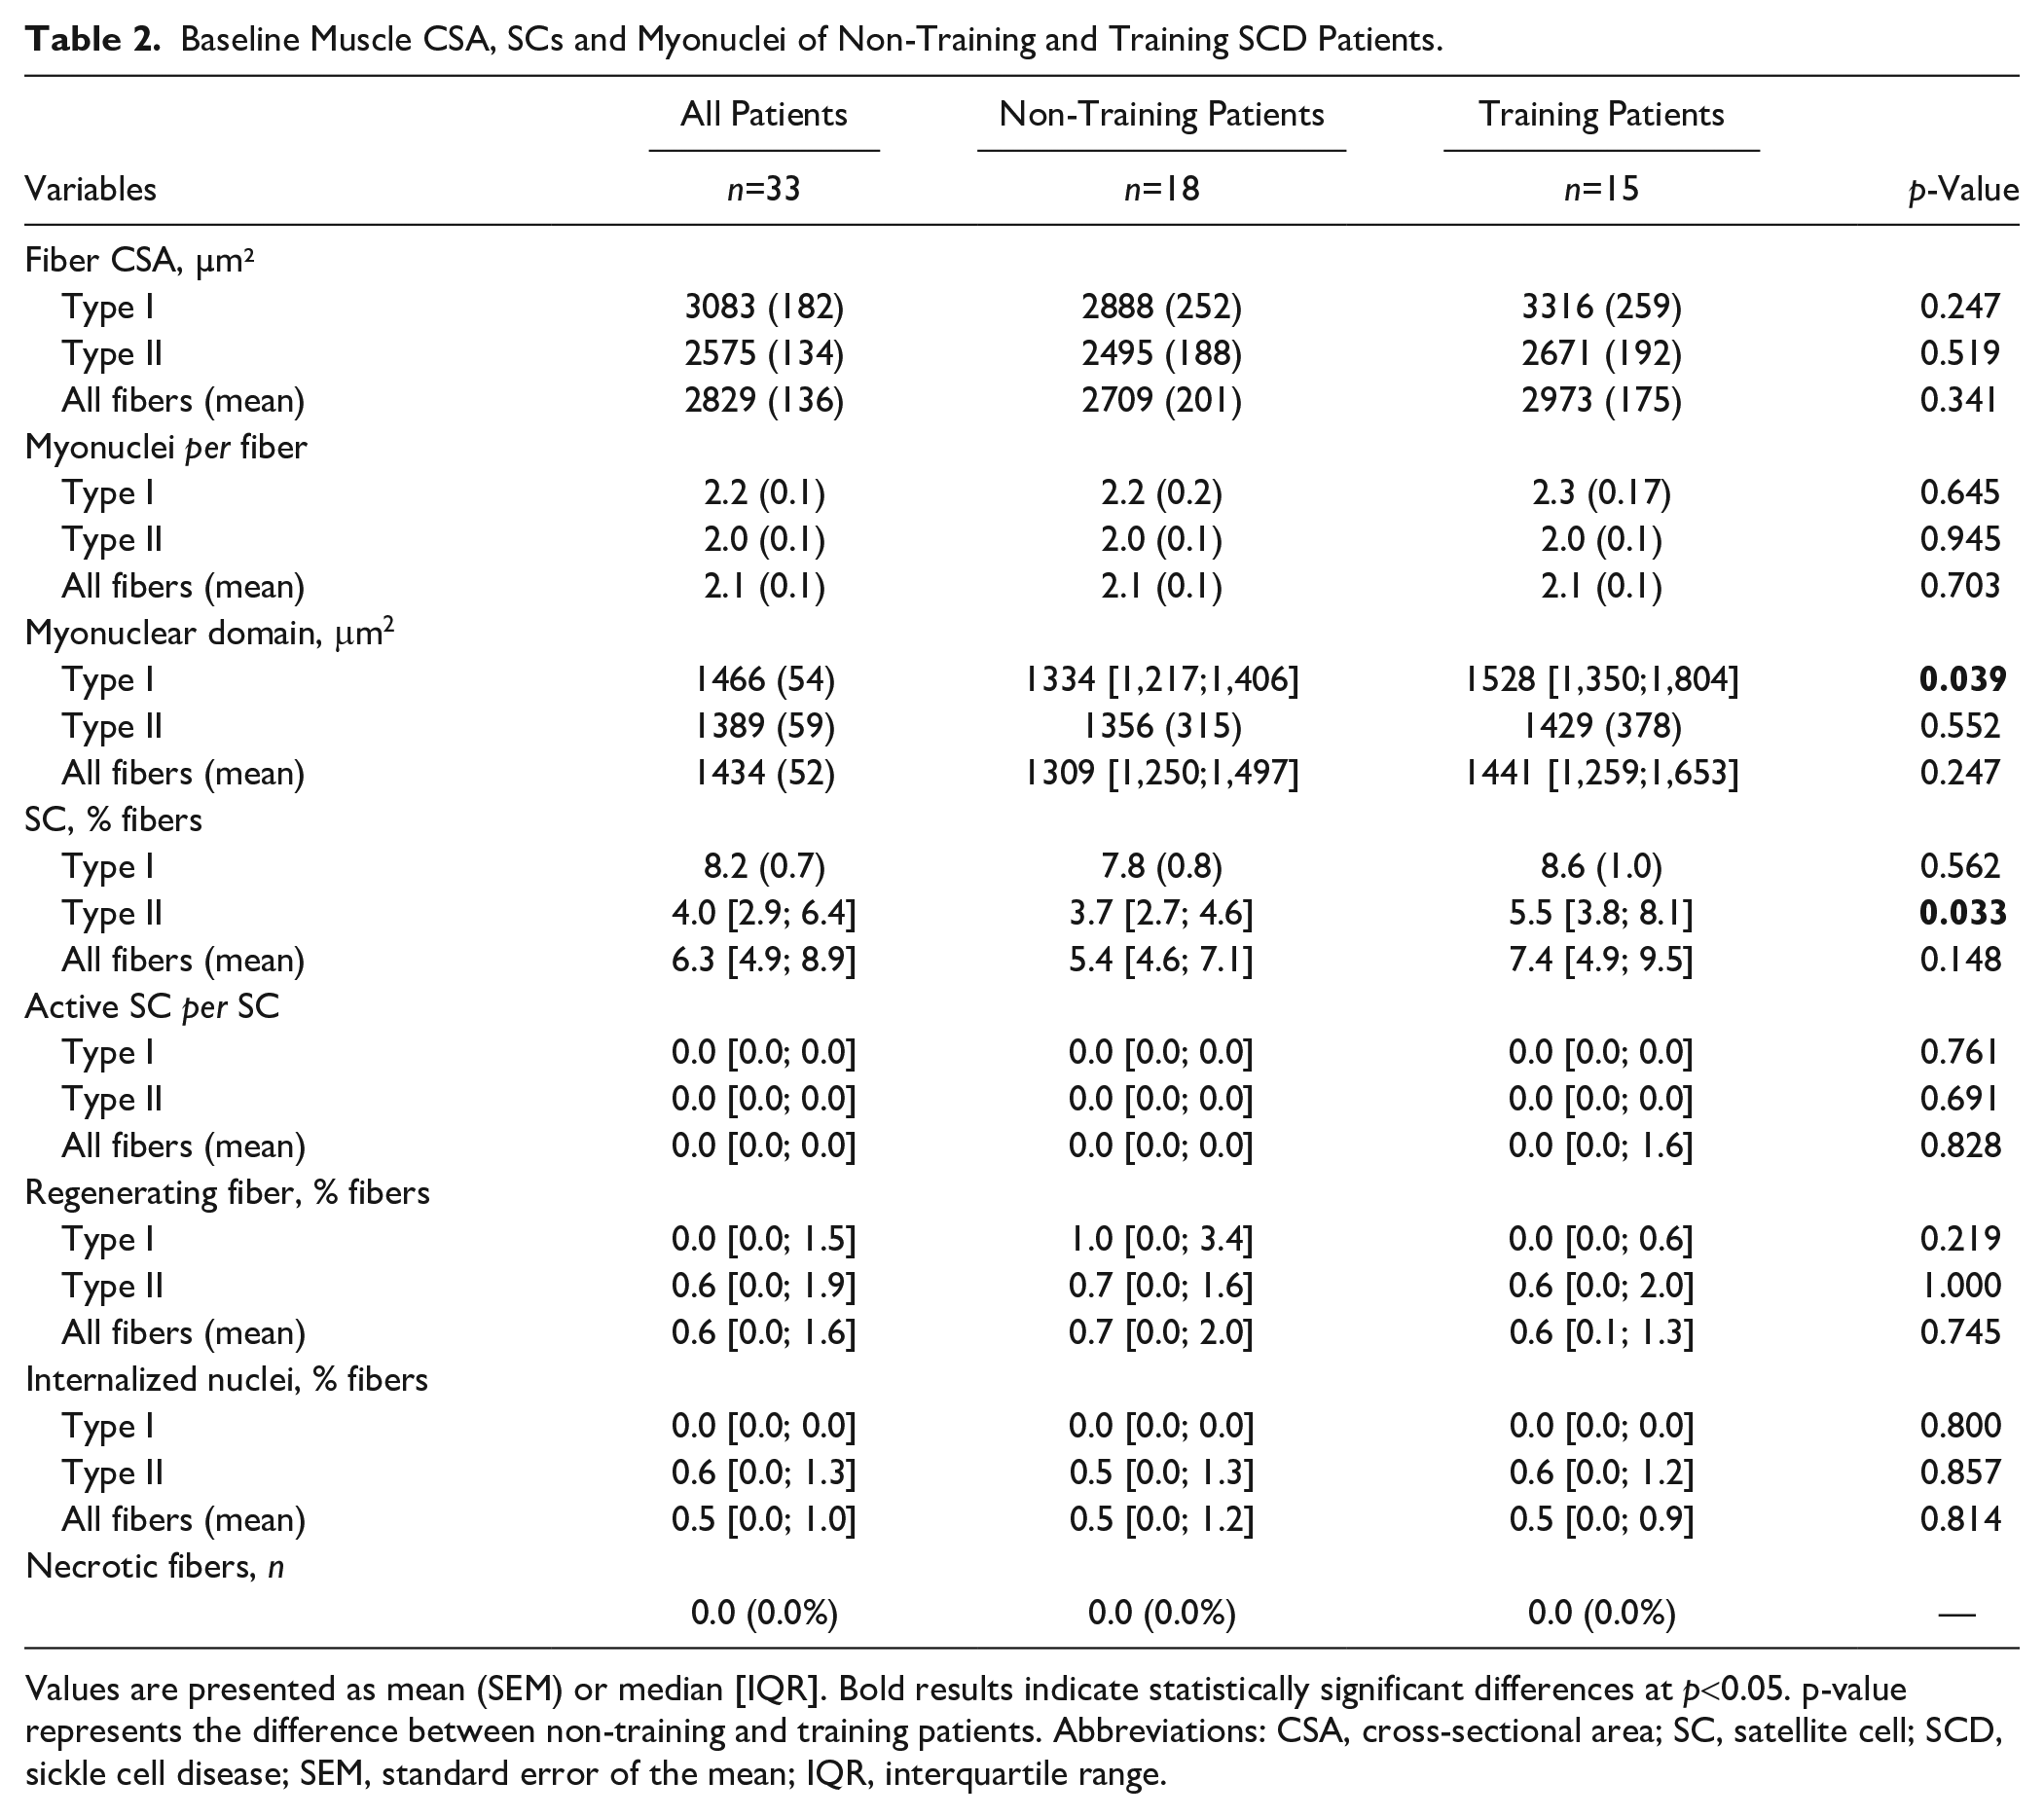
Values are presented as mean (SEM) or median [IQR]. Bold results indicate statistically significant differences at p<0.05. p-value represents the difference between non-training and training patients. Abbreviations: CSA, cross-sectional area; SC, satellite cell; SCD, sickle cell disease; SEM, standard error of the mean; IQR, interquartile range.
Responses to Endurance Training
Fiber Size, Myonuclei Content and Myonuclear Domain
The mean CSA of muscle fibers remained unchanged in both groups in response to endurance training. The per fiber-type analysis showed that changes of the mean CSA in type I fibers in response to endurance training strongly tended to be different between the training and non-training groups, i.e., type I fiber CSA tended to increase in the training group and decrease in the non-training group (median: +180.7 vs −156.7 µm2, respectively; p=0.051; Fig. 2A). No difference between groups was observed with regard to the absolute change of type II fiber mean CSA (Fig. 2A). A statistical trend was observed for the absolute change in the myonuclear content with a relative increase among training patients as compared to their non-training counterparts (median: +0.1 vs −0.02 myonuclei per fiber; p=0.072; Fig. 2B). The per fiber-type analysis also revealed a statistical trend in the changes of myonuclei per type I fibers with a relative increase in the training patients compared to non-training patients (median: +0.3 vs −0.2 myonuclei per fiber; p=0.068; Fig. 2B). Concerning the myonuclear content of type II fibers, no differences in changes were observed between groups (Fig. 2B).
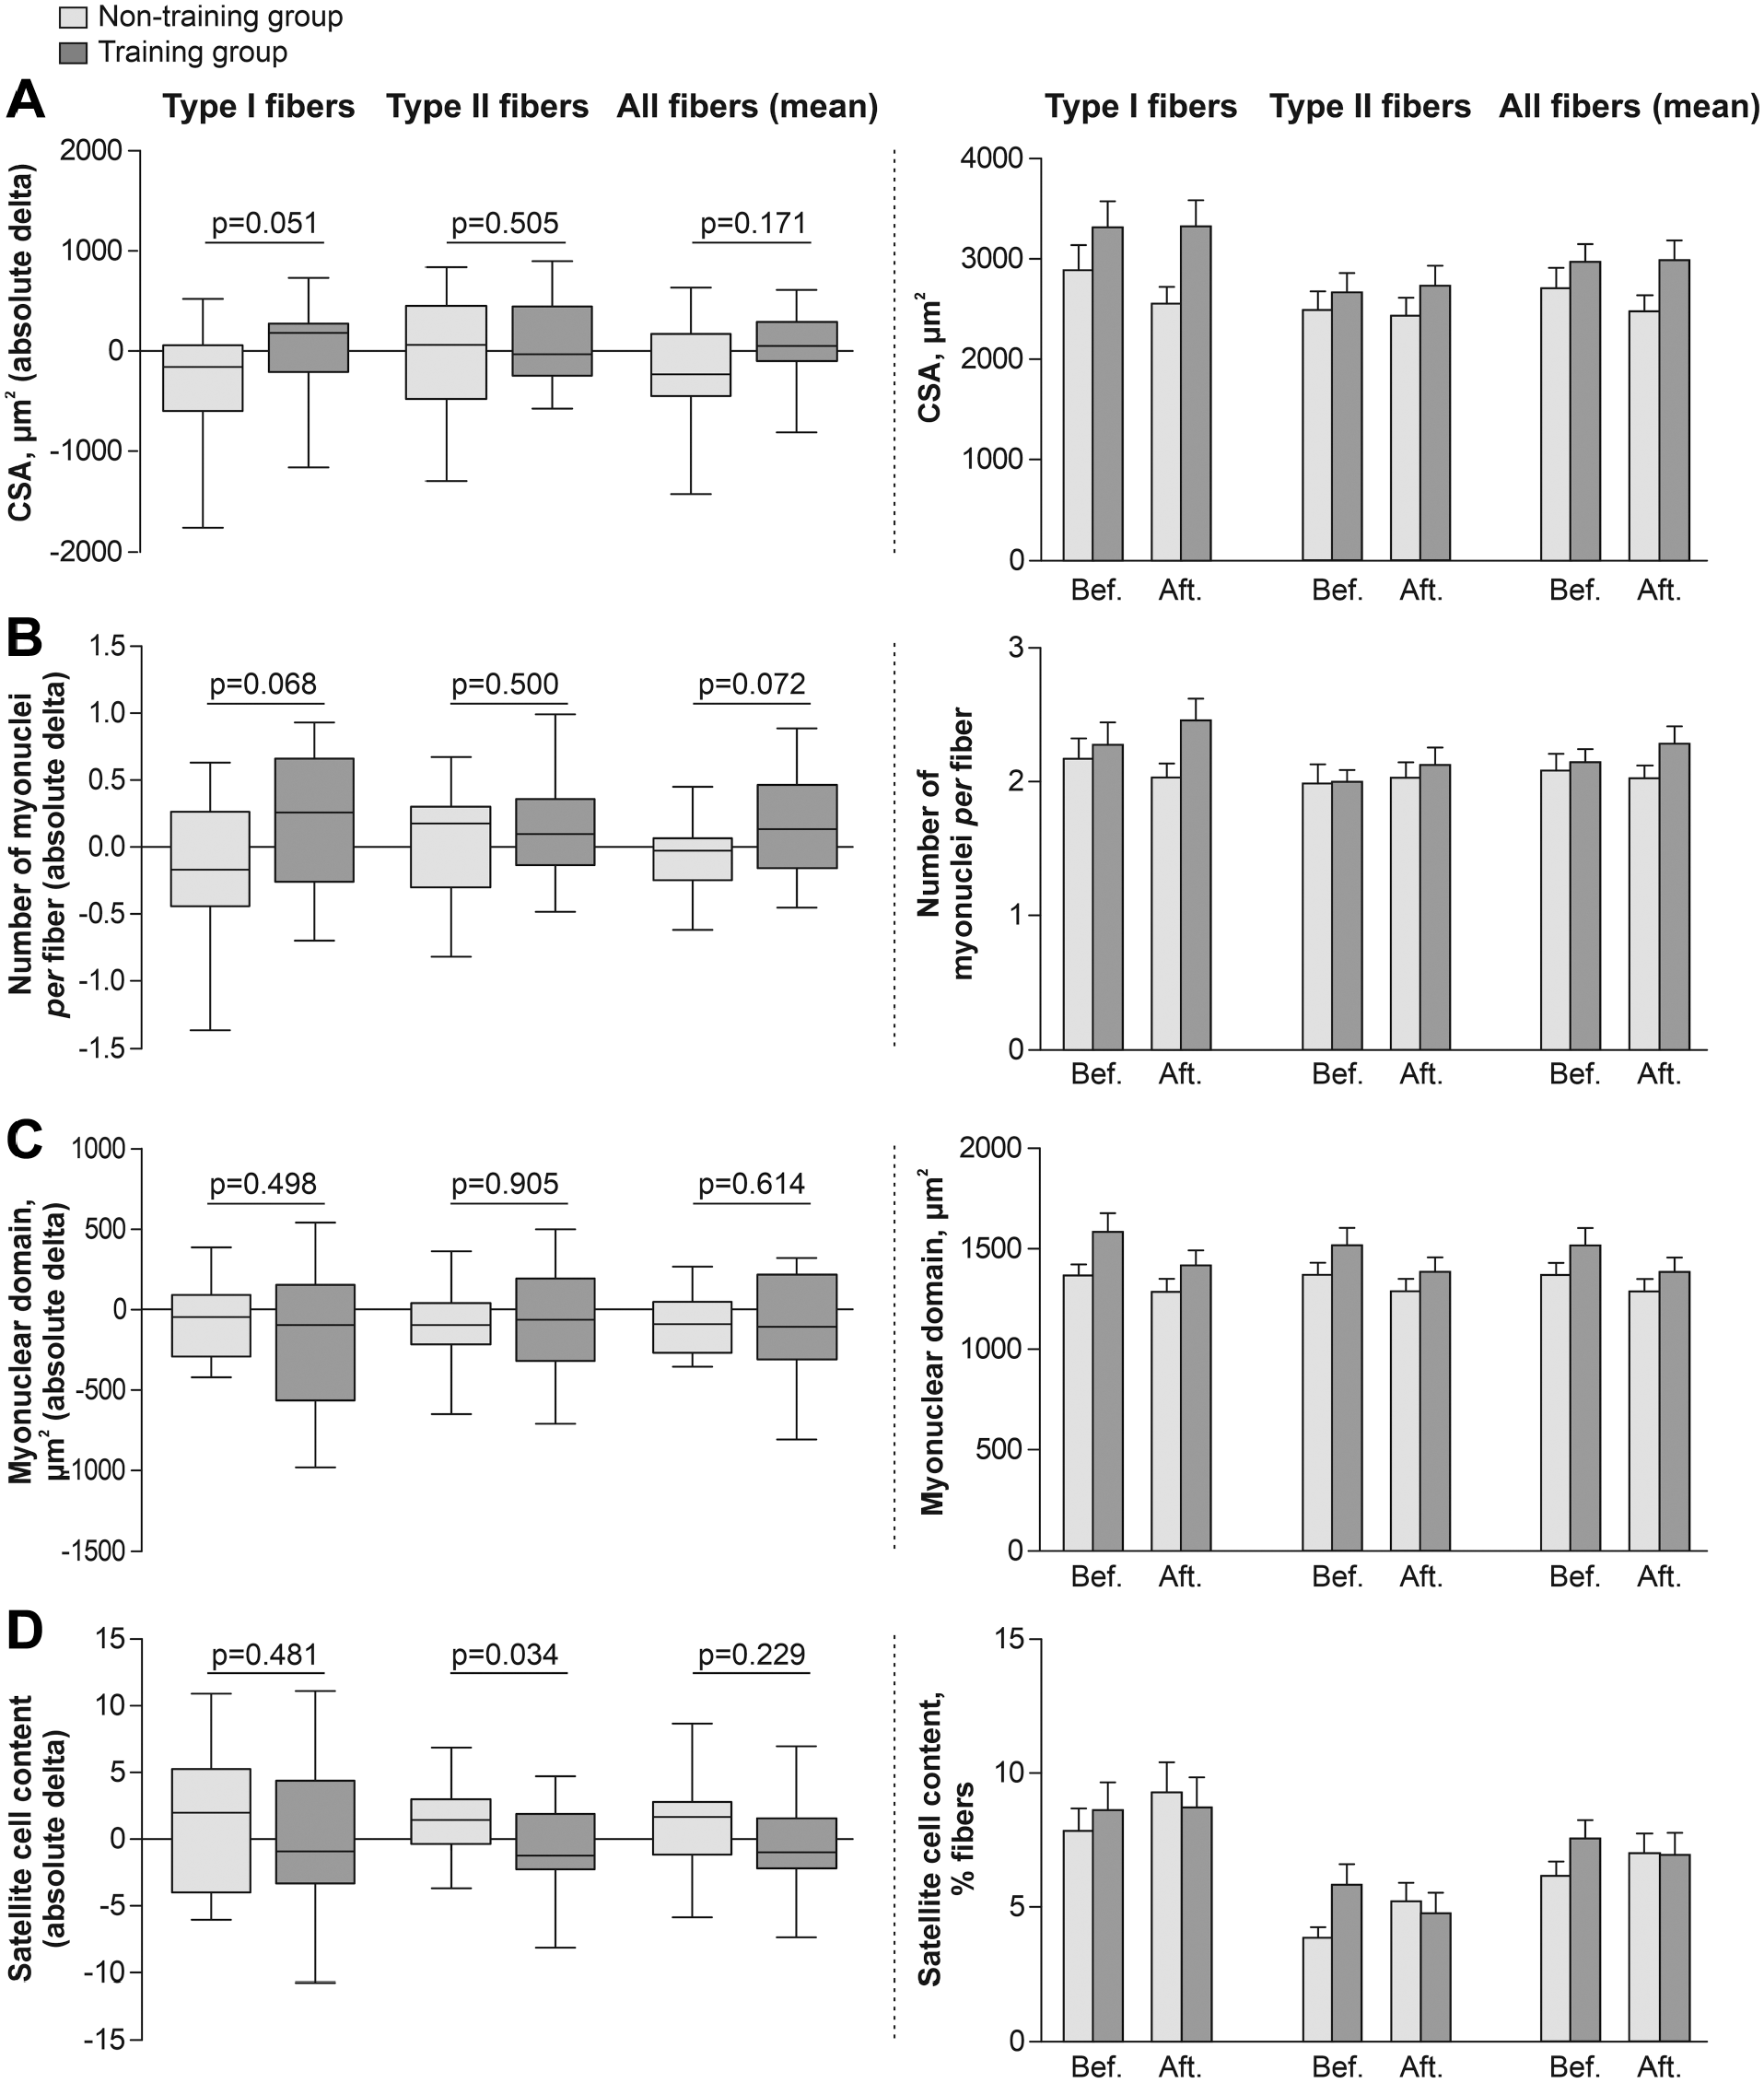
Effects of endurance exercise training on muscle CSA, myonuclei and SCs in training compared with non-training patients. Mean absolute changes (on the left) and raw data before and after the period (on the right) in (A) fiber CSA, (B) number of myonuclei, (C) myonuclear domain, and (D) SCs content per fiber type in training and non-training patients. Abbreviations: CSA, cross-sectional area; SCs, satellite cells.
SCs and Necrotic Fiber
After 8 weeks of endurance training, a significant difference in the SC pool in type II fibers was observed in the training patients compared to the non-training patients (median: −1.3 vs +1.4 SC, % of fibers, respectively; p=0.034; Fig. 2D). No change was observed for type I fibers (Fig. 2D). Quantification of SCs expressing Ki67 showed that prior to intervention and after treatment, only a few patients out of the 33 had active SCs: 8 (24%) and 11 (33%), respectively. No significant difference between groups was detected in the absolute change in the number of active SC per total SC over time (Table 3). Quantification of fibers expressing CD56+ and internalized nuclei showed no significant change over time between groups (Table 3). No necrotic fibers were detected in any patients, before or after the training period (Table 3).
Effects of Endurance Exercise Training on Active SCs, Internalized Nuclei, Regenerative and Necrotic Fibers in Training Compared With Non-Training Patients.
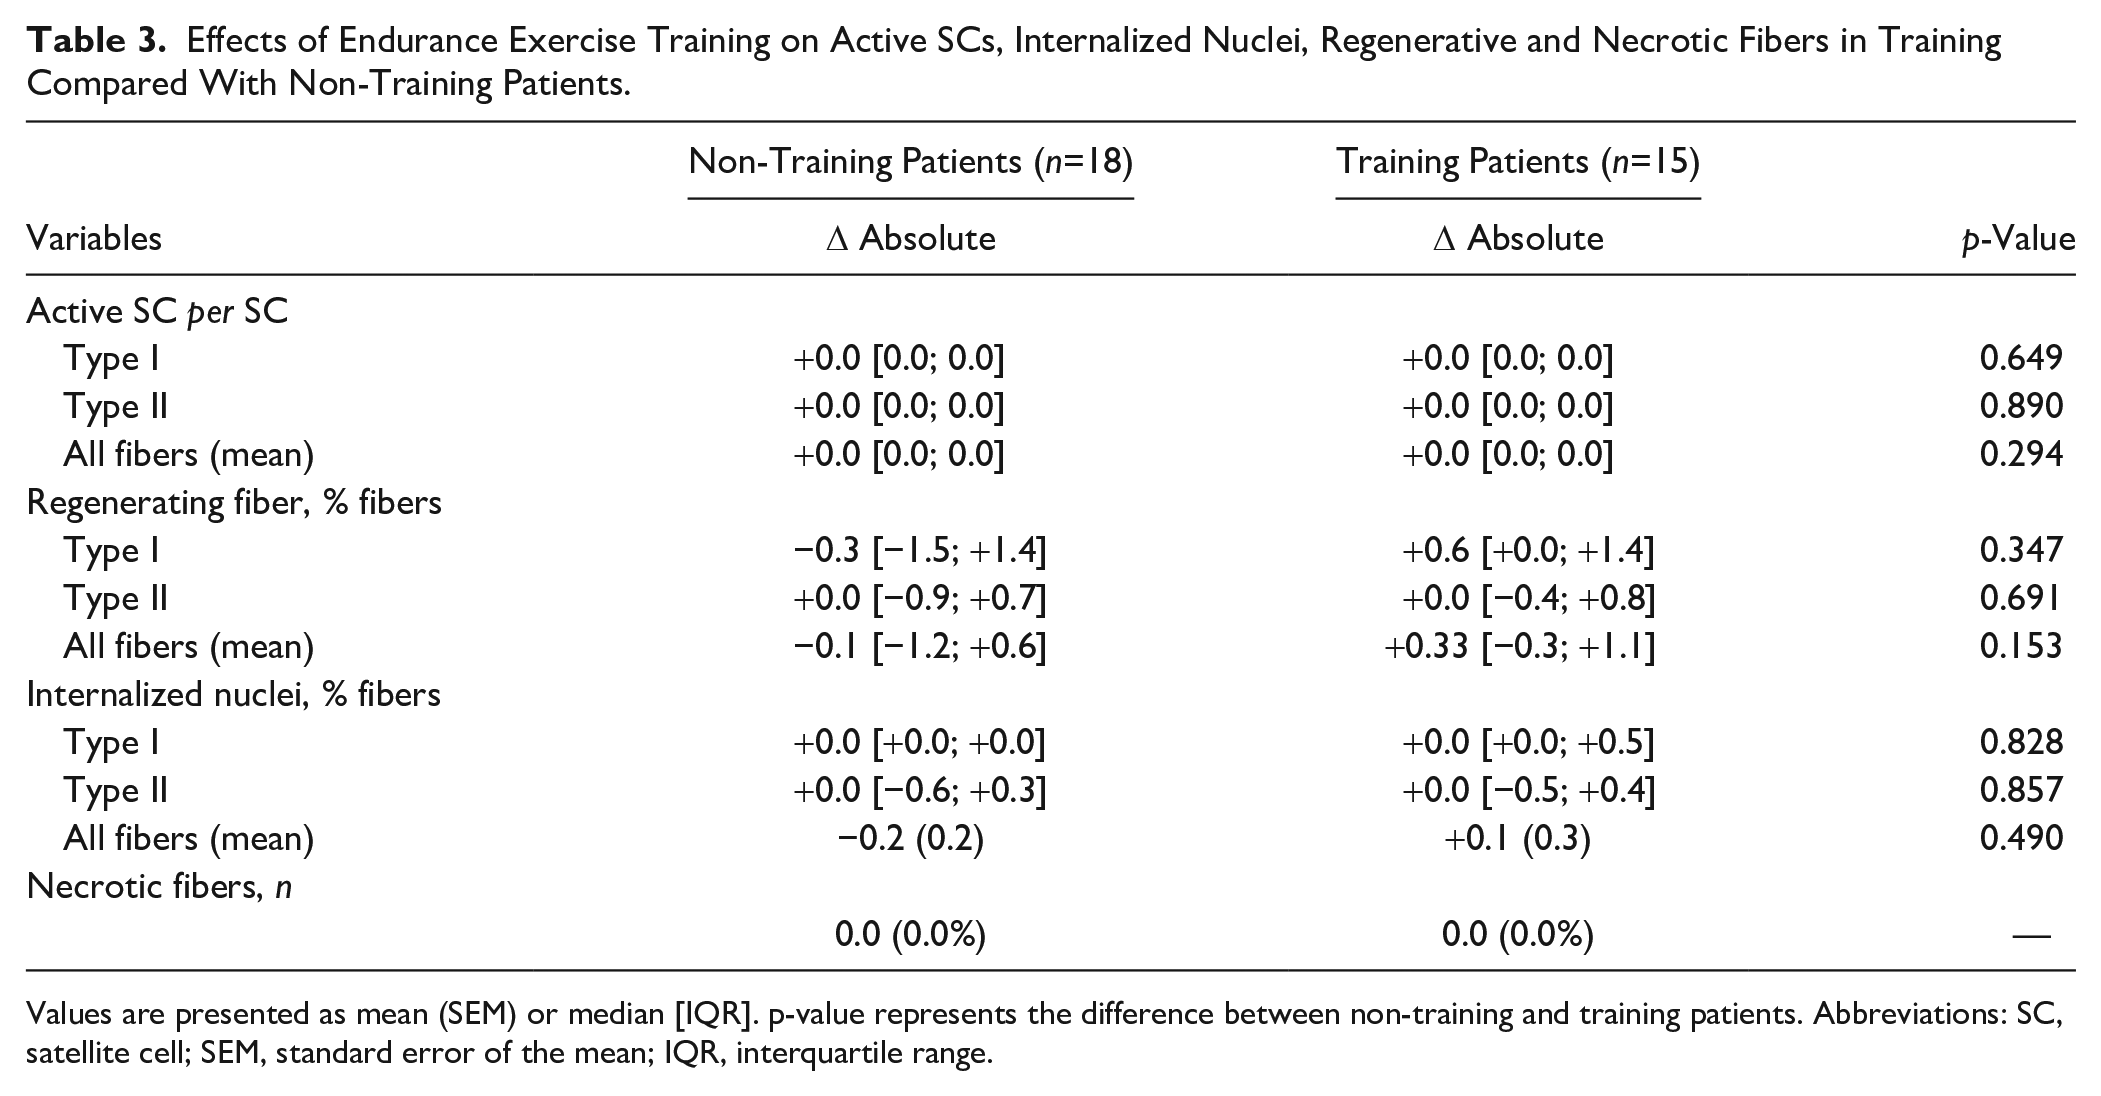
Values are presented as mean (SEM) or median [IQR]. p-value represents the difference between non-training and training patients. Abbreviations: SC, satellite cell; SEM, standard error of the mean; IQR, interquartile range.
Discussion
The present study was the first clinical randomized controlled trial evaluating skeletal muscle SCs in adult SCD patients without severe chronic complications and their responses to an 8-week moderate-intensity endurance training program. The main findings are that (1) a slight myonuclear accretion in type I fibers was reported in trained SCD patients without expansion of the SC pool and (2) no necrotic fibers were reported in patients before or after the program, suggesting that this mode of training is safe for patients’ muscle tissue.
Muscle SCs of Adult SCD Patients at Baseline
At baseline, the low type I and IIa muscle fibers CSA (Table 2) confirmed the hypotrophy of these fiber types reported in Cameroonian SCD patients. 5 However, in the present study, mean CSA of type II fibers was significantly lower than in type I fibers (−20%, p=0.009). This latter finding was accompanied by a significant lower SC pool in the type II than in the type I fibers (−51%, p<0.001). Note that in healthy subjects, the SC pool has been reported as similar between type I and type II muscle fibers.29,31 Interestingly, a senescent muscle is also characterized by both a preferential hypotrophy and SC decline in type II fibers.12,28,31,32 Although the mechanisms responsible for the hypotrophy, or sarcopenia in elderly, remain largely unknown, 33 the present results suggest that, as in elderly,31,33 the lower SC pool in type II fibers would play a role in the etiology of the larger hypotrophy in the type II than in the type I fibers in SCD. Besides, the SC decline in type II fibers may, in part, be related to the older age and the more pronounced capillary rarefaction among the SCD patients in the present study 23 as compared to our previous study. 5 Indeed, muscle regeneration processes are altered by age 34 and basal microvasculature.35,36 Studies have reported a spatial association between SC and muscle capillaries, highlighting that the distance of a SC to its nearest capillary may be an important factor in SC activation.35–37 For example, Nederveen et al. 36 observed that age increased SC-capillary distance, which may contribute to impair muscle’s ability to remodel and, in extreme circumstances, to regenerate.
Effects of Endurance Training on CSAs, SCs and Myonuclei
After 8 weeks of moderate-intensity endurance exercise training, a slight relative increase of type I fiber mean CSA was observed among training patients while a slight decrease was reported in the non-training patients, resulting in a very strong tendency between trained and non-training patients (p=0.051, Fig. 2A). The statistical difference between the present study (strong tendency) and our previous measurements (significant difference) 24 on change in CSA may stem from the fact that the two analyses were performed on different areas of the muscle biopsies. No change was reported in type II fiber mean CSA (Fig. 2A). The fiber-type specific response to exercise can be explained by the preferential recruitment of type I fibers during the moderate-intensity endurance exercises. 25 The relatively modest effect on mean CSA observed in our study, when compared with studies in healthy and other pathological conditions,38,39 can probably be attributed to the low intensity of the training and to the shortness of training sessions in order to maintain patient safety. 24
The fiber-type-specific slight hypertrophic response to endurance training could result from the activation and/or expansion of the SC pool. Some studies reported SC pool expansion and/or activation after 10, 12, or 14 weeks of endurance exercise training on cycle ergometer in healthy15,16 or elderly subjects. 14 Another study did not report change in the SC pool following continuous endurance-type exercise in obese type 2 diabetes patients. 13 Conversely to our hypothesis, we reported no significant change in the activation and/or expansion of the SC pool in type I fibers after endurance training in SCD patients (Table 3 and Fig. 2D). Surprisingly, a significant difference in the SC pool in type II fibers was observed between groups (Fig. 2D). This parameter decreased slightly in the training patients, whereas it increased slightly in the non-training patients. Although these pre- and post-program changes within each group were not significantly different (non-training, p=0.075; training, p=0.244, paired t tests), it cannot be excluded that the slight decrease in the SC pool in type II fibers induced by training might highlight dysregulated SC activity that impairs muscle regenerative processes in response to exercise.
Although there was a lack of change in the activation and/or expansion of the SC pool in type I fibers after training (Table 3 and Fig. 2D), we observed that the slight type I fiber hypertrophy induced by training was accompanied by a slight increase of their number of myonuclei (Fig. 2B). Since SCs are the sole source of new myonuclei within skeletal muscle, 40 it can be supposed that the myonuclei incorporation, through activation of SCs and their subsequent fusion into type I fibers, 41 may highlight their indirect contribution to training-induced slight type I fiber hypertrophy. Although this explanation remains hypothetical due to the lack of significant results, the unchanged myonuclear domain of type I fibers in training patients compared with non-training patients (Fig. 2C) supports this hypothesis. Indeed, each myonuclei in a fiber is responsible for governing mRNA transcription and protein synthesis/breakdown over a defined volume of cytoplasm. 42 If this volume exceeds the capacity of a given nucleus (i.e., under hypertrophic conditions), the addition of new nuclei (supplied by muscle SCs) is necessary to keep the myonuclear domain (relatively) constant during muscle fiber hypertrophy.10,43 Therefore, in the present study, the slight hypertrophy in type I fibers seems support by the addition of new myonuclei. However, we also cannot exclude that existing myonuclei also increase their rates of protein synthesis to elicit the slight hypertrophy.44,45 Moreover, we did not report change in internalized myonuclei and regenerative fibers, other signs of muscle remodeling, in training patients (Table 3). The low SC response to the training program may also be explained by the fact that in our study (1) the training intensity was low, (2) the duration of training sessions was short, and (3) the delay between the final training session and the latter biopsy was long (a week). Indeed, Mackey et al. 29 recommended analyzing active SCs 12 to 72 hours after exercise.
Another important finding is that the moderate-intensity endurance training program did not seem harmful for the muscle tissue of SCD patients since no signs of muscle damage were reported. Indeed, no necrotic fibers were observed in any muscle cross-section of patients, either before or after training (Table 3). This result reinforces our previous studies which stated that this mode of training is safe for SCD patients.21,24 Indeed, no major adverse events such as VOC have been reported in the training patients. 21 We also observed that the training program did not change the muscle content of proteins involved in pH regulation, suggesting that acid/base balance was not challenged further supporting the idea that this mode of training seems to be safe. 24
Interestingly, some studies showed that microvascularization plays an important role in the activation and expansion of the SC pool during the process of skeletal muscle repair.37,46 Our recent data showed an improvement of the capillary density, the number of capillaries in contact with muscle fibers, and the functional exchange surface between capillaries and muscle fibers in patients who followed the training program. 23 In line with these previous data and those of the present study, significant relationships were observed between the mean SC pool and two microvascular characteristics (the number of capillaries around a fiber and the functional exchange surface between capillaries and muscle fibers) in the SCD patients after the training program (r=0.75, p=0.021; r=0.69, p=0.038, respectively; Fig. 3), whereas these same relationships were non-significant before training. Therefore, training-induced microvascular enhancements in SCD 23 might participate in muscle regeneration processes by providing better conditions for the SC activation/expansion, as observed in healthy subjects. 37 Further analyses are needed to explore these mechanisms. In conclusion, the present study demonstrated for the first time the effects of an 8-week moderate-intensity endurance exercise program on the skeletal muscle SCs in adult SCD patients without severe chronic complications. Following the training program, a slight myonuclear accretion in type I fibers of trained SCD patients was observed. Besides, the training program did not induce muscle damage, as no necrotic fibers were detected in patients before or after the training program, reinforcing previous findings suggesting that this type of training seems to be safe and could be considered as a novel therapeutic strategy in SCD.21,23,24
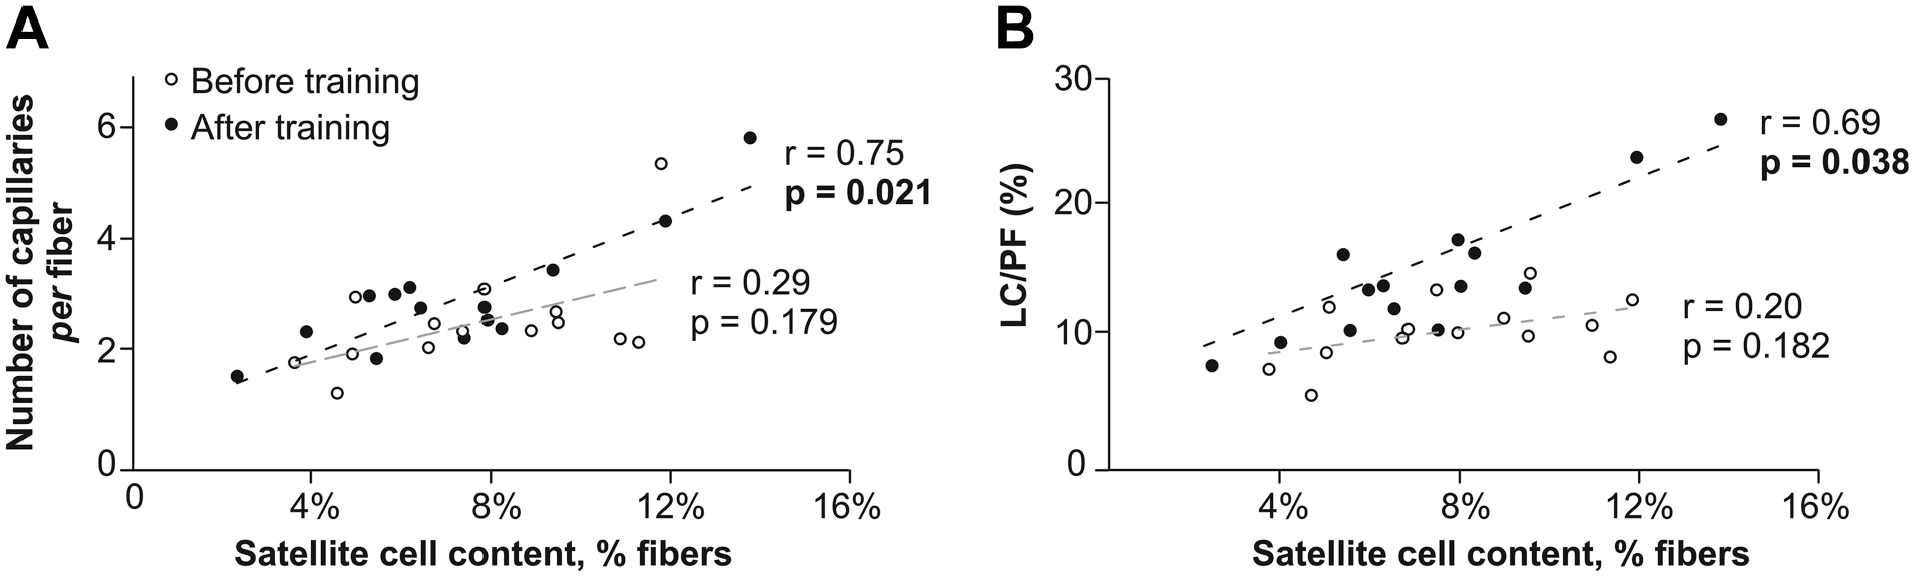
Relationships between the mean satellite cell pool and some microvascular characteristics in the training group before and after the endurance training program. Relationships between the mean satellite cell pool and (A) the number of capillaries around a fiber and (B) the functional exchange surface between capillaries and muscle fibers [length of capillaries (LC)/perimeter fiber (PF)] before (white circle) and after (black circle) the endurance training program.
Footnotes
Acknowledgements
We thank Crane Rogers for editorial assistance. We thank Marie-Pierre Blanc, Dominique Gouttefangeas and Marion Ravelojaona (Myology Unit, Referent Center of Rare Neuromuscular Diseases, Euro-NmD, University Hospital of Saint-Etienne, France) for helpful technical assistance.
Competing Interest
The author(s) declared the following potential conflicts of interest with respect to the research, authorship, and/or publication of this article: PB and LAM declare no conflict of interests for this study but report conflict of interests related to the general field of sickle cell disease. Other authors declare that there are no competing interests associated with the manuscript.
Author Contributions
L.A.M., L.F., B.G., F.G., and P.B. designed and conducted this study. A.N.M., L.J., and L.F. design the histochemical and immunohistochemical analyses and A.N.M. and L.J. carried them out. C.H. and Z.H. contributed to the technical assistance. L.J. and A.N.M. did the analysis and wrote the first draft of the article. All authors critically reviewed the draft and approved the final version for publication.
Funding
The author(s) disclosed receipt of the following financial support for the research, authorship, and/or publication of this article: This work was supported in part by research funding from “Société française de cardiologie” and “l’association l’ar