
Abstract
To answer the question of whether the satellite cell pool in human muscle is reduced during aging, we detected satellite cells in 30-μm-thick transverse sections under the confocal microscope by binding of M-cadherin antibody. The basal lamina was detected with laminin. Nuclei were stained with bisbenzimide or propidium iodide. Satellite cells were counted by applying the disector method and unbiased sampling design. To determine if there are age-related differences in muscle fiber types, morphometric characteristics of muscle fibers were examined on thin sections stained for myofibrillar ATPase. Autopsy samples of vastus lateralis muscle from six young (28.7 ± 2.3 years) and six old (70.8 ± 1.3 years) persons who had suffered sudden death were analyzed. Numbers of satellite cells per fiber length (Nsc/Lfib) and number of satellite cells per total number of nuclei (satellite cell nuclei + myonuclei) (Nsc/Nnucl) were significantly lower in the old group (p<0.05). We demonstrate the importance of proper sampling and counting in estimation of sparsely distributed structures such as satellite cells. Our results support the hypothesis that the satellite cell fraction declines during aging.
S
During postnatal growth, myonuclei are added to growing fibers by fusion of satellite cells (Moss and Leblond 1971). A major fraction (80%) gives rise to myonuclei that fuse to form muscle fibers; a minor fraction remains as reserve satellite cells (Baroffio et al. 1995; Schultz 1996). Muscle injury and altered functional demands, such as overload, denervation, stretch, or immobilization trigger the mitotic activity of reserve satellite cells or alter the satellite cell content (Darr and Schultz 1989; Schultz and Darr 1990; Snow 1990; Rosenblatt et al. 1994; Schultz and McCormick 1994; Viguie et al. 1997; Putman et al. 1999; Kadi and Thornell 2000). Different factors, such as insulin-like growth factor (IGF), fibroblast growth factor (FGF), and transforming growth factor-β (TGFβ), play a crucial role in satellite cell activation or inhibition (for review see White and Esser 1989; Bornemann et al. 1999; Seale and Rudnicki 2000).
According to the literature, in adult muscles satellite cell nuclei represent about 3–6% of all muscle nuclei (Schmalbruch and Hellhammer 1976; Gibson and Schultz 1982). From animal experiments, it has been reported that their percentage differs in different types of muscles and muscle fibers (Schmalbruch and Hellhammer 1977; Gibson and Schultz 1982) and that their fraction is different in young and old muscles (Allbrook et al. 1971; Gibson and Schultz 1983). In old age, the regenerative capacity is reduced (Carlson and Faulkner 1989). However, this reduction might result not only from the reduced number of satellite cells (Allbrook et al. 1971) but, particularly in human muscles, from the number of remaining divisions (Decary et al. 1997).
In human muscles, some authors reported that aged muscle contains a smaller fraction of satellite cells (Schmalbruch and Hellhammer 1976; Renault et al. 2002), whereas others did not find any difference (Hikida et al. 1998; Roth et al. 2000). The reason for this discrepancy probably lies in the very small samples taken for counting satellite cells. All hitherto published results were based on counting very few satellite cells, usually around five cells per muscle. Taking into account that satellite cells are distributed not only sparsely but also unevenly along the muscle fibers, much larger samples must be evaluated to obtain reliable results.
In this study we have worked out a protocol ensuring proper counting of satellite cells, with the aim of determining whether the number of satellite cells in human muscles is reduced during aging. To obtain reliable data on the satellite cell frequency, it was necessary (a) to find a proper method enabling identification of satellite cells, (b) to apply unbiased sampling and counting procedures, (c) to take a sufficiently large sample of satellite cells, and (d) to measure a proper parameter that would express satellite cell frequency comparably under different physiological and pathological conditions.
Satellite cells can be reliably identified on the electron microscopic level by their position between the sarcolemma and the basal lamina of skeletal muscle. Although different markers have been introduced for satellite cell identification, such as M-cadherin (M-cad) (Irintchev et al. 1994), NCAM (Kadi and Thornell 2000), PAX7 (Seale and Rudnicki 2000), c-met (Cornelison and Wold 1997), Myf5, and MyoD (for review see Tajbakhsh and Buckingham 2000), direct comparison between identification by pure morphological parameters and by different markers has not been done. Therefore, it is difficult to judge which marker stains all satellite cells. On isolated mouse muscle fibers, it has been shown that the majority of satellite cells are Myf5/M-cad/CD34-positive (Beauchamp et al. 2000). The significance of the minority, which is left unstained with the former markers, is still unknown. However, Zammit et al. (2002) assume that they might be required for maintenance or restoration of the satellite cell compartment after depletion in response to injury or growth or that they might also be related to the muscle side population, the muscle-derived cells that have both hematopoetic and myogenic potential, or both (Gussoni et al. 1999; Jackson et al. 1999). It has still not been proved whether resting and activated satellite cells are stained with M-cad and whether the fraction of M-cad-stained satellite cells differs among species. In the M-cad-deficient mouse this protein is not essential for normal muscle development and can be replaced by N-cad (Hollnagel et al. 2002). However, the majority of satellite cells remain M-cad-positive, and therefore we chose this kind of staining for our study.
Our main aim was to find out whether this M-cad-positive majority of satellite cells declines with aging, using unbiased stereological methods for cell counting in combination with confocal microscopy. This approach enables us to evaluate satellite cells efficiently so that a sufficiently large sample can be evaluated, i.e., on average approximately 100 satellite cells per sample (Gundersen and Jensen 1987). Furthermore, it is feasible to apply the optical disector principle (Gundersen 1986), which enables unbiased counting of satellite cell nuclei. This method guarantees proper sampling of nuclei irrespective of their size. Last but not least, for comparing satellite cell frequency among different muscles and under different physiological or experimental conditions that muscles undergo, a proper parameter for the description of the satellite cell frequency should be measured. To gain complex information about changes in the satellite cell number in human muscle during aging in relation to other muscle characteristics, we decided to measure and compare the number of satellite cells per unit fiber length (Nsc/Lfib), the number of satellite cells per total number of muscle nuclei (Nsc/Nnucl), and the number of satellite cells per unit muscle volume (Nsc/Vm).
Materials and Methods
Autopsy samples of vastus lateralis muscle were excised from the border between the middle and the distal part of the femur in two groups of men who had suffered sudden death, one young group (aged 28.7 ± 2.3 years) and the other old (aged 70.8 ±1.3 years). Samples were excised 6–24 hr postmortem from one leg only, i.e., one muscle was studied in each subject. Six muscles from each group were analyzed. From each muscle six samples were taken, three from the superficial and three from the deep part. They were protected by Tissue Tek OCT and aluminum foil frozen in liquid nitrogen. Sections were cut with a Reichert-Jung Frigocut 2800 at −23 to −25C. The following set of sections was cut from each sample: (a) three 30-μm-thick transverse sections with an interval of 100 μm to demonstrate basal lamina, satellite cells, and their nuclei for satellite cell counting per fiber length using the unbiased optical disector principle, which is based on focusing through a thick tissue section (see below); (b) one additional 30-μm-thick transverse section to demonstrate nuclei and basal lamina, for counting all muscle nuclei (i.e., myonuclei + satellite cell nuclei) per fiber length, also using the optical disector principle; (c) one 10-μm-thick longitudinal section to demonstrate the z-line with desmin, for measuring sarcomere length; and (d) two 10-μm-thick transverse sections from each sample to stain for myofibrillar ATPase activity at pH 9.4 and pH 4.3 for determination of morphometric characteristics of muscle fiber types.
Immunohistochemical Procedures
All sections were pretreated in PBS with 0.2% Triton X-100 (PBS-T), fixed in 2% paraformaldehyde in PBS-T for 10 min, and further rinsed in PBS-T. All antibodies were diluted in PBS-T except for M-cadherin (M-cad), which was diluted in PBS-carrageenan solution (Irintchev et al. 1994).
(a) Satellite cells were demonstrated by double staining of M-cad and laminin. After rinsing in PBS-T, normal goat serum 1:5 was applied for 25 min to reduce background staining. Sections were further incubated overnight in primary rabbit polyclonal antibody against M-cad (1:50) (Institute of Physiology; Bonn, Germany) and 2 hr with goat anti rabbit Alexa Fluor 488 (1:500) (Molecular Probes; Eugene, OR). After rinsing in PBS-T, the basal lamina was detected by overnight incubation with monoclonal antibodies against laminin (1:1000) (Sigma; St Louis, MO) followed by 2 hr with goat anti-mouse Alexa-546 antibody (1:500) (Molecular Probes). Bisbenzimide (1 mg/ml PBS, diluted 1:1000; 4–7 min) was used to stain nuclei.
Sections were analyzed with a two-channel Zeiss LSM 510 confocal microscope using the Zeiss Plan-Neofluar oil immersion ×40 objective (NA 1.3), M-cad in green and laminin in red fluorescence. Green and red fluorescence was excited with an argon (488 nm) and He/Ne (543 nm) laser. Emission signal was filtered using a narrow band (505–530 nm) and a LP 560-nm filter. Because it was not possible to use UV excitation in our confocal microscope, the position of nuclei was controlled under a conventional fluorescent Zeiss microscope.
(b) On additional sections, laminin and myonuclei were demonstrated. After rinsing in PBS-T, normal goat serum 1:5 was applied for 25 min. Sections were further incubated overnight with monoclonal anti-laminin antibodies (1:1000) (Sigma), and 2 hr with goat anti-mouse Alexa Fluor 488 antibody (1:500). Nuclei were stained with propidium iodide (Molecular Probes) diluted 1:1500 in 0.3 M NaCl and 0.03 M sodium citrate, pH 7.0, for 5 min. Red myonuclei beneath the green basal lamina were analyzed using the above confocal microscope with the ×40 objective.
Longitudinal sections were incubated with normal rabbit serum 1:5 for 30 min and overnight with monoclonal anti-human desmin (1:100) antibody (DAKO; Glostrup, Denmark), followed by secondary peroxidase-conjugated rabbit anti-mouse antibodies (1:80) (DAKO) for 1 hr. Peroxidase was visualized with diaminobenzidine. The sections were analyzed under a Nikon Eclipse E800 microscope using a plan-fluor ×60 objective (NA 0.85).
Histochemistry
Transverse sections were fixed with 2% paraformaldehyde in 0.1 N cacodylate buffer, pH 7.2, with addition of 0.4 M sucrose for 5 min and further incubated in the calcium medium at pH 9.4 (Padykula and Herman 1955). Unfixed sections were preincubated in 0.2 M acetate buffer, pH 4.3, for 10 min and further incubated in the calcium medium at pH 9.4 (Guth and Samaha 1969).
Sampling
Sampling procedures for satellite cells and myonuclei counting are described in detail in Sajko et al. (2002). Briefly, satellite cells were counted in stacks of sharp optical sections captured by a confocal microscope from fields of view sampled systematically (with a random start) from the three thick transverse sections in each of the six samples per muscle. Every third field of view was evaluated. Nuclei (i.e., myonuclei + satellite cell nuclei) were counted from six confocal stacks captured at random from one transverse section per sample. Sarcomere length was measured from five randomly chosen muscle fibers from one longitudinal section per sample. Samples in which type I and type II muscle fiber characteristics were determined contained about 200 muscle fibers.
Stereological Analysis
Satellite cells and myonuclei were counted by the optical disector principle (Gundersen 1986) under the confocal microscope applying the Disector software (Tomori et al. 2001). Briefly, in this method the disector probe is represented by a “virtual box” that is placed inside the thick physical section. During focusing up from the bottom we count only those nuclei within the box that disappear during focusing (i.e., they are not intersected by the box upper side) and at the same time are not intersected by the left and front sides of the disector box (i.e., their sections are not intersected by the exclusion lines of the unbiased counting frame). Because the thick physical sections used for the disector method were cut perpendicular to the muscle longitudinal axis, i.e., the fibers were cut transversely, the length of a muscle fiber lying in the disector box was equal to the height of the box.
The following stereological parameters were estimated: number of satellite cells per fiber length, Nsc/Lfib; number of satellite cells per number of nuclei (i.e., myonuclei + nuclei of the satellite cells), Nsc/Nnucl; number of nuclei per fiber length, Nnucl/Lfib; number of satellite cells and nuclei in 1 cm3 of muscle tissue, Nsc/Vm.
To enable comparison of data obtained from specimens frozen at different sarcomere length, the number of satellite cells per fiber length, Nsc/Lfib, and the number of nuclei per fiber length, Nnucl/Lfib, were corrected to a reference sarcomere length (2.5 μm).
The number of satellite cells per fiber length was thus calculated by the following formula:
where Nsc is the total number of the satellite cell nuclei counted in all disector boxes applied, Lfib is the total length of myofibers within the disector boxes, and c is the correction factor for the sarcomere length.
The number of nuclei per fiber length was calculated by the following formula:
where Nnucl is the total number of nuclei counted in all disector boxes, L'fib is the total length of myofibers within the disector boxes used for nuclei counting (i.e., not within the disector boxes applied for counting satellite cells), and c is the correction factor for the sarcomere length. The percentage of satellite cell nuclei Nsc/Nnucl in all muscle nuclei was then estimated simply by the ratio of Nsc/Lfib to Nnucl/Lfib times 100%.
To enable comparison with similar studies in which satellite cell profiles and profiles of myonuclei were counted in thin sections, Nsc/Lfib was recalculated to the number of satellite cells per fiber profile (Nsc/Nfib) within a 10-μm transverse section. This value was not corrected by the sarcomere length because such correction was not applied in other studies.
The number of satellite cells per fiber profile Nsc/Nfib was determined as a ratio between the satellite cell number and the number of fiber profiles (within a 10-μm-thick section) multiplied by 100%.
Morphometric Analysis
From each section stained for myofibrillar ATPase at pH 9.4 and pH 4.3, images were captured by the Image Analyzing System Lucia GF Ver. 4.50 (Laboratory Imaging; Praha, Czech Republic). Altogether, about 200 muscle fibers were analyzed per muscle. Sections stained for myofibrillar ATPase at pH 4.3 served as control for distinguishing type I and type II fibers. Dark- and pale-stained fibers were outlined separately and from them the following morphometric characteristics were determined: numerical (Nn) and volume (Vv) percentage of type I and type II fibers, their cross-sectional area (A), diameter (min feret) (D), and perimeter (P).
Statistics
The differences between the young and the old group were judged by the non-parametric Mann-Whitney two-sided test.
Results
The number of satellite cells was determined by counting their nuclei, positioned between the basal lamina and M-cad stained satellite cell membranes (Figure 1a). The number of nuclei was provided by counting all nuclei positioned underneath the basal lamina (Figure 1b) (see Sajko et al. 2002).
On average, 117 satellite cells (35–200) within 3824 myofiber profiles (1352–5350) were counted per muscle. The number of satellite cells per fiber length was significantly larger in the young than in the old group, and so was the number of satellite cells per number of nuclei and number of satellite cells per number of fiber profiles in a 10-μm transverse section. Although the number of satellite cells in 1 cm3 of muscle tissue (Nsc/Vm) appeared to be higher in young muscles, it was not significantly different between the two groups because of large interindividual variability (relative SE 20% in the young vs 12% in the old group). All above parameters exhibited larger interindividual variability in the young than in the old group (Table 1).
On average, 1329 nuclei (410–1652) within 638 myofiber profiles (138–1167) were counted per muscle. The average number of myonuclei per fiber length was increased in the old group compared to the young one; however, the difference was not significant. The number of satellite cells per fiber profile in a 10-μm-thick transverse section (Nsc/Nfib), which is just Nsc/Lfib recalculated to 10 μm instead of to 1 mm, was significantly different among both groups similarly to Nsc/Lfib (Table 1). Because Nsc/Nfib was not corrected to the sarcomere length, this might mean that the differences in sarcomere length, at which muscles were frozen, were rather random, i.e., not dependent on the age of muscles, and so they did not essentially affect the final result. To get data on the sarcomere length we cut the same sample which had been cut transversally also longitudinally, assuming that we measured at least some identical fibers that were captured in transverse sections. Correction was based on six randomly chosen fibers from each sample, i.e., altogether on 36 fibers per muscle.
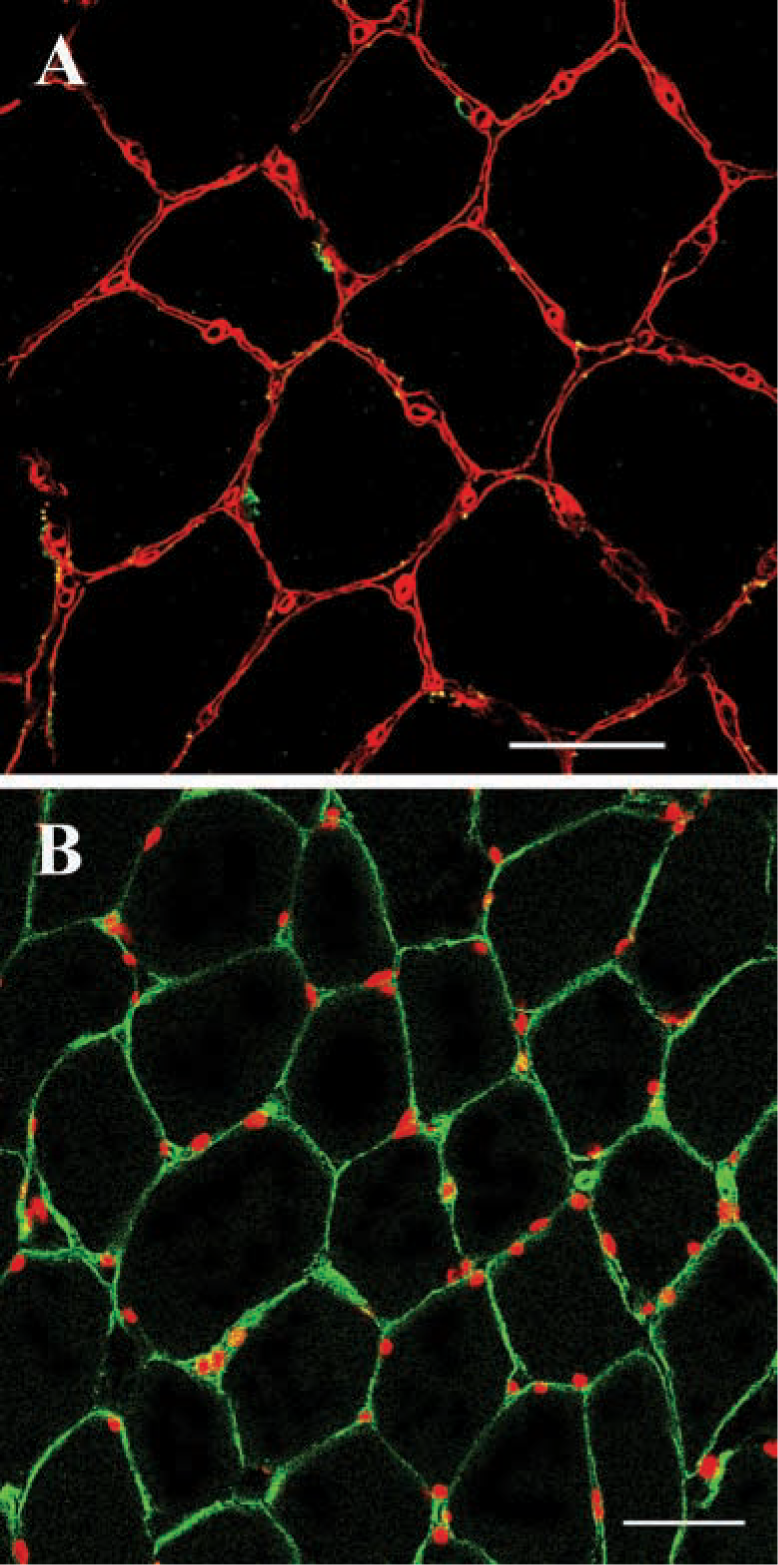
Skeletal muscle fibers, satellite cells and nuclei. (
In our samples we found no significant differences among morphometric features of muscle fiber types (Vv, Nn, A, D, P) between the young and the old group (Table 2).
Frequency of satellite cells in six young vs six old human vastus lateralis muscles a
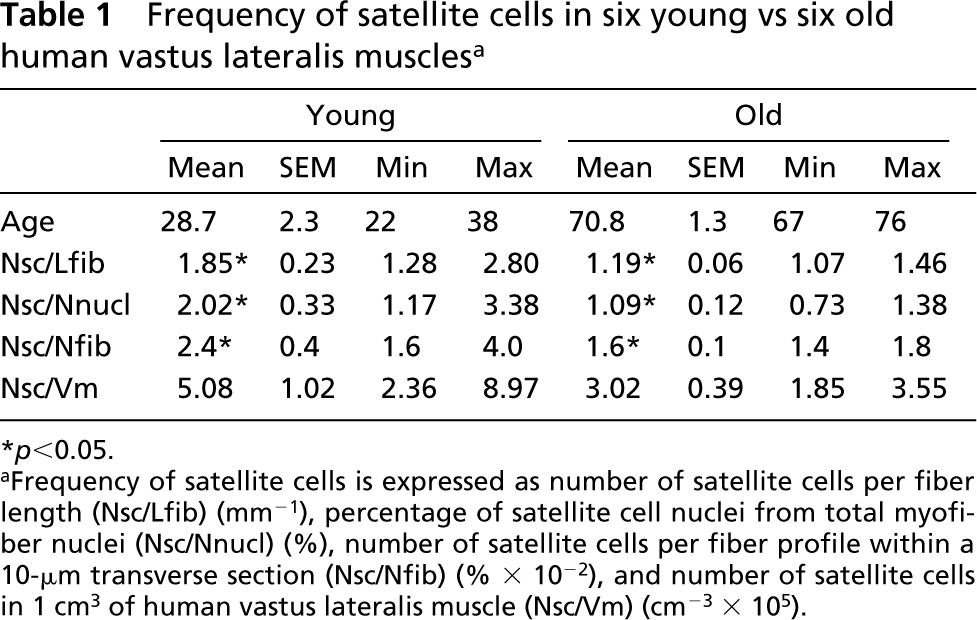
∗ p<0.05.
aFrequency of satellite cells is expressed as number of satellite cells per fiber length (Nsc/Lfib) (mm–1), percentage of satellite cell nuclei from total myofiber nuclei (Nsc/Nnucl) (%), number of satellite cells per fiber profile within a 10-μm transverse section (Nsc/Nfib) (% × 10–2), and number of satellite cells in 1 cm3 of human vastus lateralis muscle (Nsc/Vm) (cm–3 × 10⁵).
Morphometric characteristics of type I and type II fibers in human vastus lateralis muscle (eight young and seven old) a
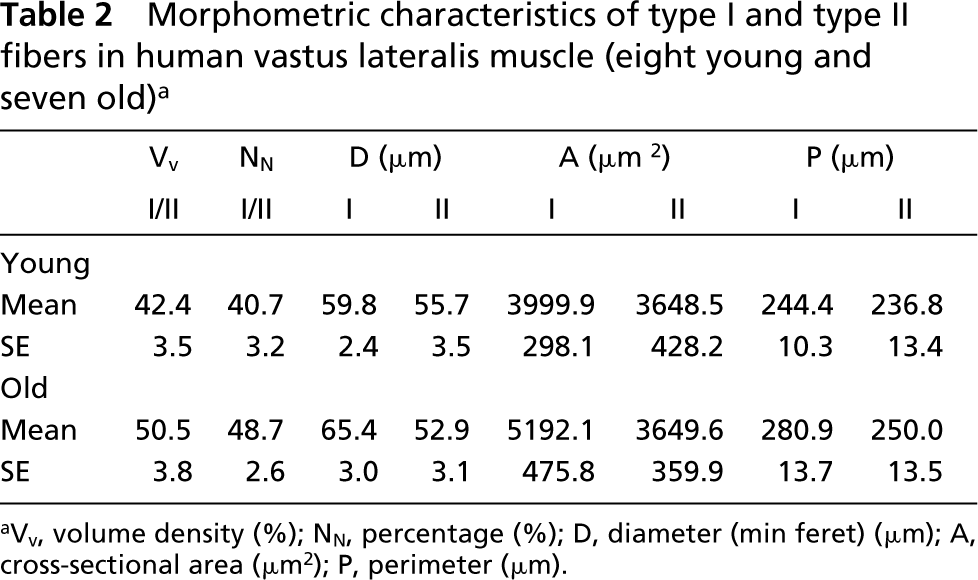
aVv, volume density (%); NN, percentage (%); D, diameter (min feret) (μm); A, cross-sectional area (μm2); P, perimeter (μm).
Discussion
In this study, our original contributions to the knowledge of satellite cell distribution in human muscles include the following: (a) for the first time M-cad was applied as a marker for satellite cells in a quantitative study in human muscles; (b) satellite cells were sampled according to the rules of systematic uniform random sampling; (c) an unbiased method for satellite cell counting was applied; and (d) a sufficiently large sample was analyzed.
Applying M-cad as a marker for satellite cells, we have proved that, in human vastus lateralis muscle, the frequency of satellite cells declines during aging. We are aware that, thus far, no one has unequivocally proved that M-cad or any other marker stains all satellite cells in human muscles. Therefore, our results hold true only for those satellite cells that are M-cad-positive, which is, we assume, the majority.
From our own experiences, M-cad is a very sensitive marker that most probably deteriorates very quickly. It evidently deteriorates if the morphology of the tissue is not very well preserved or else if the tissue section does not stick tightly to the coverslip. Such samples were excluded, and consequently that muscle was not analyzed. Compared to mouse or rat, in human muscles M-cad stained membranes are thinner, which means that the staining needs more enhancement. Special care should be taken that bleaching is minimized as much as possible to keep satellite cells detectable. Some satellite cells could well be lost because of being beyond the sensitivity of the method. Poor penetration of antibodies into the thick tissue section could also be a reason for the calculated low frequency of satellite cells. In this regard, we have carefully focused through all our captured stacks of images and have noted a similar incidence of satellite cells in images within the upper and lower portions of the 20-μm-thick stacks. This probably means that antibodies penetrated similarly into all our thick sections and that the possible poor penetration similarly affected all our muscle samples. More detailed discussion on the binding of M-cad antibodies to human satellite cells, penetration of antibodies, bleaching of fluorescent markers, and other problems regarding the sampling and counting procedures, as well as corrections to the different sarcomere lengths, can be found in Sajko et al. (2002).
We have made every effort to carefully minimize any bias in our measurements, whether due to technical reasons or to sampling and counting procedures. Taking into account that satellite cells are very sparse and unevenly distributed in skeletal muscles, to obtain reliable data it is absolutely crucial to measure satellite cells according to a very carefully prepared protocol.
In previous studies on satellite cell frequency in a human muscle, the size of samples was too small, and therefore our data are hardly comparable with such studies. In studies using electron microscopy, satellite cell counting is much more tedious, and it is therefore very difficult to evaluate a satellite cell sample of sufficient size. This is probably the reason why, often, such small samples of satellite cells were taken in such studies (6 satellite cells per person, Schmalbruch and Hellhammer 1976; 4.2 satellite cells per person, Roth et al. 2000).
To relate satellite cell number to the number of myonuclei, we also counted muscle nuclei (satellite cell nuclei + myonuclei). Thus far, only a few authors have counted numbers of nuclei per human muscle fiber (Vassilopoulos et al. 1977; Hikida et al. 2000; Kadi and Thornell 2000). Compared to the published values, 2 ± 0.4 nuclei per fiber within a 5-μm-thin cross-section, as reported by counting profiles (Kadi and Thornell 2000), we found up to six, rarely seven, and exceptionally eight profiles per fiber. As to the actual number of nuclei (i.e., not just nuclear profiles seen in a thin section), we found from zero to two nuclei per muscle fiber within a 10-μm cross-section (on the average 1.31, SEM = 0.09 in the young and 1.67, SEM = 0.16 in the old group). This means that counting nuclei by counting their profiles in a single cell section overestimates the real number of nuclei. Comparison of our data with other studies is even more difficult because in most studies the sampling procedure is not described in detail and data on sample size have not been provided.
It should be noted that the number of nuclei, whether myonuclei or satellite cell nuclei, is not equal to the number of nuclear profiles found in a thin histological section. However, if the nuclei have the same size, the higher frequency of nuclear profiles indicates also the higher frequency of nuclei. Because counting nuclear profiles in a thin section can be faster than applying the disector principle to thick sections, this method can be used when a large number of samples must be evaluated in a short period of time, e.g., in the case of muscle biopsies for diagnostic purposes. However, tests for the size of nuclei should be made on the material of the same type. In such cases, when comparing frequency of nuclei estimated by both, profile counting and disector method, the results reflect the same trend (Renault et al. 2002).
It was evident that variability in satellite cell parameters among subjects in the young group was much higher than in the old group. Several authors (Schultz and Darr 1990; Snow 1990; Rosenblatt et al. 1994; Viguie et al. 1997; Putman et al. 1999; Kadi and Thornell 2000) reported that altered functional demands, such as denervation, exercise, low-frequency electrical stimulation, stretch, immobilization, and overload, provoke satellite cell division and results in a higher frequency of satellite cells. We possess no information on the physical activity of persons involved in this study. However, it is quite probable that persons pertaining to the young group differed much more in their physical activity than did persons of the old group. We assume that no well-trained athletes were included in the study. Muscle fiber diameters varied from muscle to muscle, but no extremely small or extremely large fibers were found in the samples analyzed. There was no significant difference in fiber diameter between the young and the old group, although at least a slight atrophy is expected in the old group. On macroscopic inspection, muscles from the old group were not atrophic. With the aim of collecting only “healthy” muscles, we excluded all muscles from old persons that exhibited severe muscle atrophy and fiber type grouping. Therefore, we presume that our muscle samples represent average healthy young and old Slovenian populations.
The number of satellite cells per fiber length (Nsc/Nfib) proved to be a suitable parameter characterizing the satellite cell pool because it directly reflected changes in satellite cell number in relation to the individual muscle fibers. As expected, its variance is lower than that of Nsc/Nnucl because the density of myonuclei is not constant in different muscles. On the other hand, because myonuclei mostly represent progeny of satellite cells, the ratio between satellite cell numbers and numbers of total myonuclei gives an insight into the activity of satellite cells and their potential to divide.
In conclusion, our results support the assumption that the satellite cell pool is reduced during aging. Similar data have been provided in experimental animals. Snow (1977) reported a 50% decrease in satellite cell number between young and old rat and mice. On the basis of morphological criteria, he suggested that satellite cells in older muscles were less metabolically active than satellite cells in young animals. This assumption has been additionally proved by animal experiments in which muscles of young animals were transplanted to old hosts and, vice versa, muscles of old animals to young hosts (Carlson and Faulkner 1989). These experiments have clearly proved that the age of the host determines the success of the regeneration. Moreover, the loss of satellite cells during aging could be due to a defect in the restoration of the quiescent satellite cell pool. The mechanism for the maintenance of a pool of reserve cells implies an asymmetric division during the regenerative process. The decline in the number of satellite cells with age could be due to a deregulation in the mechanisms that control asymmetric cell division to restore the satellite cell reserve pool and/or death of satellite cells that have reached the end of their proliferative lifespan (Renault et al. 2002).
Footnotes
Acknowledgements
Supported by the European programme QLKG-1999–02034. It is a pleasure to acknowledge the most stimulating discussions on methods and results led on several meetings of the consortium.
This study was approved by the National Medical Ethics Committee of Slovenia. The valuable technical assistance of Jerneja Kmecl, Ivan Blažinovič, Marko Slak, Majda Črnak-Maasarani, Andreja Omahen, Katarina Kanc, Nataša Pollak, and Milan Števanec is highly acknowledged.