
Abstract
The poor clinical prognosis and microvascular patterns of glioblastoma (GBM) are of serious concern to many clinicians and researchers. However, very few studies have examined the correlation between microvascular niche patterns (MVNPs) and proteomic distribution. In this study, CD34 immunofluorescence staining and matrix-assisted laser desorption ionization-mass spectrometry imaging (MALDI-IMS) technology were used to investigate the protein distributions in MVNPs. CD34+ microvascular phenotype could be divided into four types: microvascular sprouting (MS), vascular cluster (VC), vascular garland (VG), and glomeruloid vascular proliferation (GVP). Based on such characteristics, MVNPs were divided into two types by cluster analysis, namely, type I, comprising primarily MS and VC, and type II, comprising many VGs and GVPs. Survival analysis indicated the type of MVNPs to be an independent prognostic factor for progression-free and overall survival in GBM. MALDI-IMS results showed the peaks at m/z 1037 and 8960 to exhibit stronger ion signals in type II, while those at m/z 3240 and 3265 exhibited stronger ion signals in type I. The findings may assist future research on therapy and help predict prognosis in GBM. However, due to the limited number of studies, more well-designed studies are warranted to further verify our results.
Keywords
Introduction
Glioblastoma (GBM) remains the most common primary malignant brain tumor in adults, with an annual incidence of five cases per 100,000. 1 Current GBM treatment standards include maximal resection followed by chemoradiotherapy and antiangiogenic therapies.2–4 Despite such aggressive therapeutic strategies, the majority of the patients experience recurrence due to heterogeneous vascular regeneration of GBM. 5
Angiogenesis is a prominent feature of primary GBM. Recent studies have suggested that the microvasculature of GBM may vary with tumor type, tumor cell heterogeneity, and tumor stage. 6 Further studies on the characteristics of tumor microvasculature heterogeneity and relationship of the same with tumor structure types would help us to understand the role of microvasculature in oncobiology. While microvascular density, microvascular area (MVA), and microvascular fractal dimension are the most important and best predictive factors for patient outcomes in GBM,6–8 some reports have suggested microvascular niche patterns (MVNPs) to play a pivotal role in patients with GBM.9,10 Our previous study confirmed that heterogeneity of MVNPs in GBM may reflect the different mechanisms of neoangiogenesis, and therefore, be associated with patient prognosis. 11 However, very few studies have investigated the differences after classifying MVNPs in GBM on the basis of their distinct characteristics based on different protein compositions. Hence, we used k-means cluster analysis to classify the different CD34+ MVNPs to explore the prognosis of GBM and analyze the protein distribution characteristics of MVNPs.
Matrix-assisted laser desorption ionization-mass spectrometry imaging (MALDI-IMS) is emerging as a powerful tool that provides new insights into the molecular pathology of diseases as well as other analytes. 12 The technique is widely used as a label-free method that ultimately provides powerful information on the spatial distribution of proteins, peptides, and small molecules in tissues.13,14 In addition, MALDI-IMS provides reproducible high-resolution mass measurements of molecules in complex biological matrices, such as cells and other samples.15,16 MALDI-IMS plays a key role in the discovery of biomarkers for the diagnosis of cancer and classification of disease pathology.17,18 Considering its ability to localize proteins and smaller molecules across an entire tissue section, MALDI-IMS analysis holds promise for the elucidation of molecular processes underlying GBM.19,20
Here, we demonstrate that each GBM has a different vascular distribution, belonging to either type I or type II MVNPs. 21 Imaging mass spectrometry revealed that MVNPs in GBM are associated with differential expression of proteins. This knowledge helps to understand interactions between proteins and their vascular microenvironment in tumors, which, in turn, are important for elucidating the mechanisms underlying the development and progression of GBM, as well as for the development of novel therapeutic strategies.
Materials and Methods
Patients and Tissue Samples
(1) To analyze the prognosis of GBM after MVNP classification, all patients who had undergone initial surgery for primary GBM between January 2016 and December 2017 at the Department of Neurosurgery, Sanbo Brain Hospital of Capital Medical University, were included in this retrospective study. Patients with recurrent GBM, who had undergone simple biopsy without any preoperative adjuvant therapy (radiotherapy, chemotherapy, and/or antivascular therapy), were excluded. Finally, 73 patients were enrolled in the study. Informed consent was obtained from all patients according to the research proposal approved by the local ethics committee of the Sanbo Brain Hospital in Beijing. This study was not preregistered. Tumor specimens were reviewed and confirmed by two experienced neuropathologists who were blinded to the study. All tumor specimens were reviewed and confirmed to be GBM, according to the current WHO definition. 22 Follow-up information was updated every 2 months via a clinic visit, telephone interview, or review of death certificate. The observed clinical characteristics are shown in Table 1.
(2) The four types of CD34-labeled (RRID: SC-7045, 1:100 human IgG; Santa Cruz Biotechnology) microvessel formation in GBM [formalin-fixed and paraffin-embedded (FFPE)], as described in our previous article 21 and by Birner et al. 9 and Chen et al., 11 were as follows: (1) microvascular sprouting (MS), defined as delicate capillary-like microvessels, resembling those observed during classical angiogenesis, distributed evenly throughout the major parts of the vital tumor tissue (Fig. 1A); (2) vascular cluster (VC), defined as distinct focal aggregations of vessels (≥3) without connective stroma (Fig. 1B); (3) vascular garland (VG), defined as clustered vessels arranged in garland-like formation, with or without connective stroma, frequently located around necrotic tissue (Fig. 1C); and (4) glomeruloid vascular proliferation (GVP), defined as clustered vessels (≥3) ensheathed by connective stroma (Fig. 1D). Stained lumen or separate CD34-positive cells were regarded as single countable microvessels, with the exception of those with muscular walls. When a single lumen is regular and the diameter of the lumen is larger than 10 cells, and a large number of red blood cells are present in the lumen, the vessel is excluded. All types of CD34-labeled microvessel formation were selected for each tumor specimen and evaluated by two trained investigators, who were blinded to the pathological diagnosis and clinical data; they analyzed multiple staining and classified the microvascular patterns.
(3) Immunofluorescence staining: Tissue sections were deparaffinized in xylene, dehydrated in graded alcohol, and conditioned. Antigens were retrieved with All-purpose Powerful Antigen Retrieval Solution (1:10, cat. no. P0088; Beyotime, China). Slides were blocked for 30 min with QuickBlock Blocking Buffer (cat. no. P0220; Beyotime). Primary antibodies were applied at optimized concentrations previously determined on control tissues, and the following primary antibodies were used: anti-Nestin (1:150, cat. no. ab22035; Abcam, UK), anti-CD133 (1:100, cat. no. orb99113; Biorbyt, UK), and anti-CD34 antibody (1:100, cat. no. SC-7045; Santa Cruz Biotechnology), which were prepared according to the manufacturer’s instructions with predetermined dilutions. Slides were counterstained with DAPI (4′,6-diamidino-2-phenylindole, C1002; Beyotime) at 5 mg/ml in PBS for 10 min, mounted with Antifade Mounting Medium and kept at −20C.
(4) To analyze the polypeptide protein composition of tissues, we selected 12 of the 73 cases of primary GBM (frozen sections), which were used for microvascular pattern classification (Table 1). Fluorescent images were captured under a high objective using a Zeiss LSM 780 motorized microscope (Zeiss Microsystems; Germany) with a high-sensitivity gallium arsenide phosphide (GaAsP) detector. Images were obtained by sequentially scanning the entire section to ensure reliable quantification. To guarantee reliability, sections in the experiment were continuously under immunofluorescence-stained conditions, and images were captured under the same exposure settings at 1024 × 1024 pixel resolution. Mass spectra were acquired using an ultrafleXtreme MALDI-time of flight (TOF)/TOF mass spectrometer (Autoflex III; Bruker Daltonics, Germany) controlled by flexControl (Bruker Daltonics) and flexImaging (Bruker Daltonics), equipped with a 200-Hz Smart Beam Nd:YAG 355-nm laser. A linear positive ion mode was used with 500 shots per raster point and 50% laser intensity. The raster range was set at 200 μm. MALDI-MS spectra were acquired in the m/z range of 1000–10000. Following MS analysis, image acquisition was performed using FlexImaging software. Behavioral experiments were performed between 9 am and 5 pm.
Clinical and Histopathologic Features of 73 Patients With Primary Supratentorial Glioblastoma.
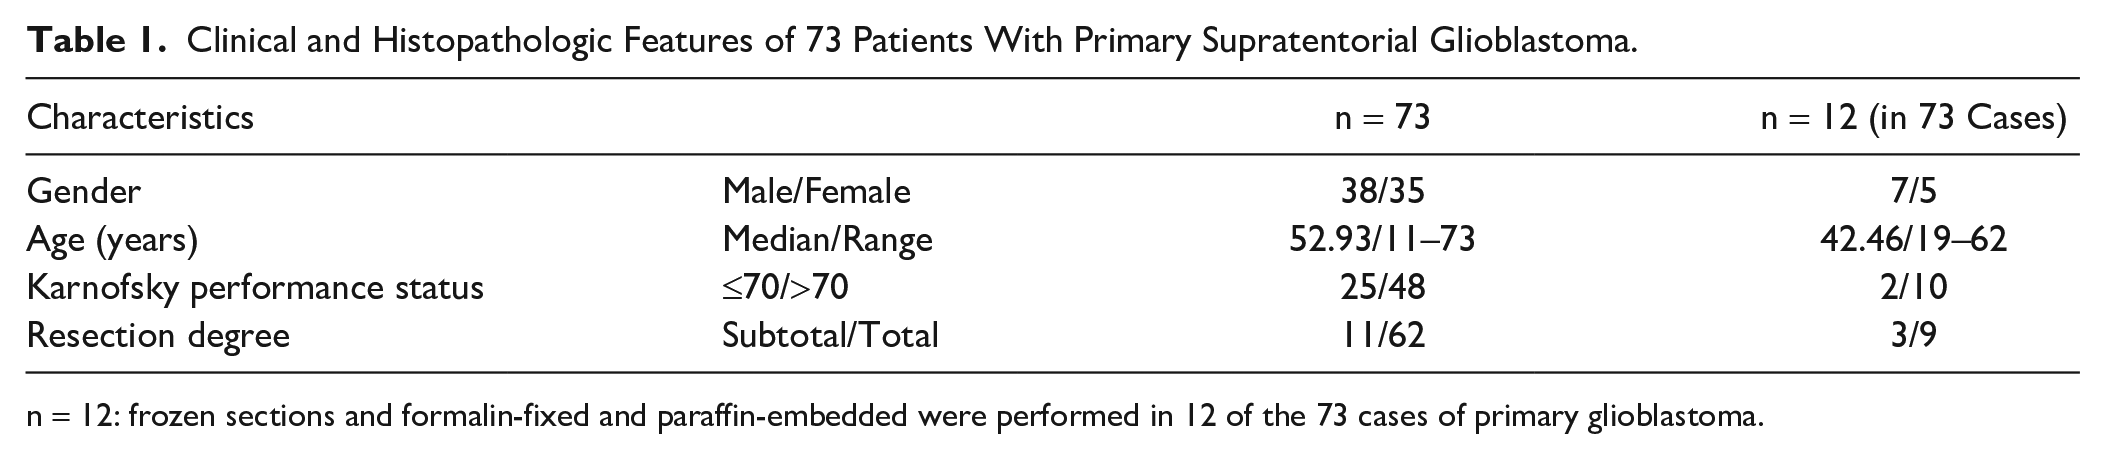
n = 12: frozen sections and formalin-fixed and paraffin-embedded were performed in 12 of the 73 cases of primary glioblastoma.
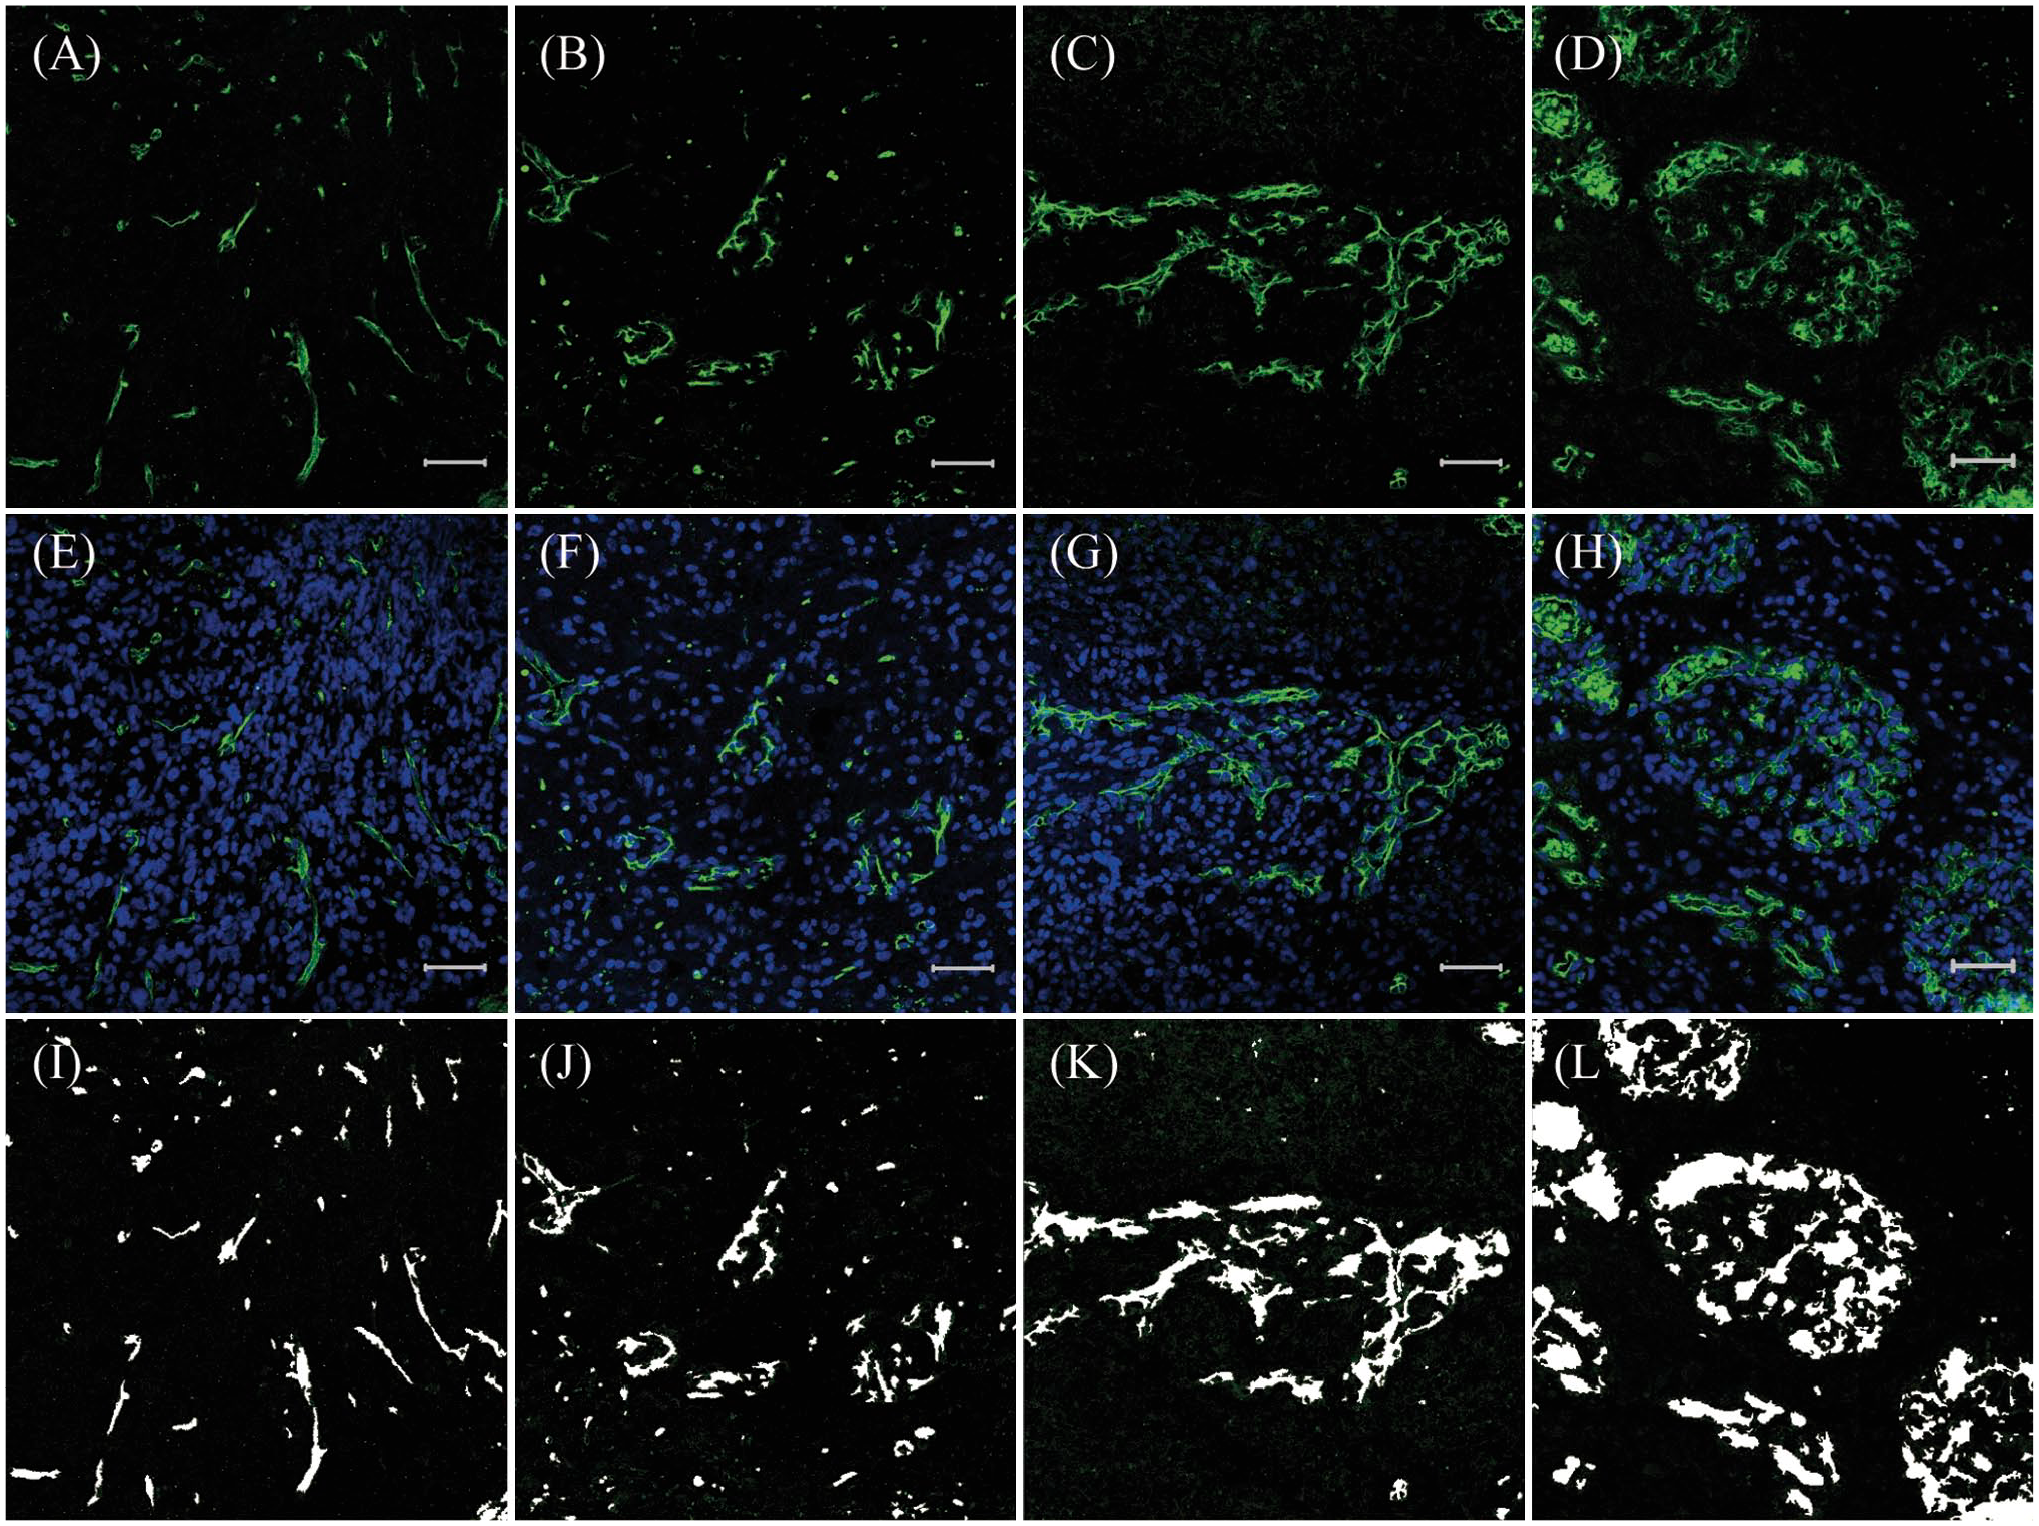
CD34/DAPI expression in glioblastoma; CD34 (green), DAPI (blue). (A, E) Microvascular sprouting (MS); (B, F) vascular cluster (VC); (C, G) vascular garland (VG); (D, H) glomeruloid vascular proliferation (GVP) (200×); and (I, J, K, L) the area of CD34+ cells or lumina analyzed by Image-Pro Plus. Scale bars: 50 µm. Abbreviation: DAPI, 4′,6-diamidino-2-phenylindole.
Statistical Analysis
All images were transferred to proprietary format, and then subjected to further processing and analysis using Image-Pro Plus for Windows (v6.0; Media Cybernetics, Silver Spring, MD) (Fig.1 I/J/K/L). The proportion of each positive area was calculated using the following formula: positive area = (positive area/measurement area) × 100. All data were analyzed using SPSS software (v20.0). The area of each type of microvascular formation was subjected to k-means clustering to partition the tumor samples into several groups. Progression-free survival (PFS) was defined as the time between the day of initial surgery and that of documented tumor recurrence, as revealed by either MRI or the occurrence of new neurological symptoms. Overall survival (OS) was defined as the time between the day of surgery and that of the patient’s tumor-related death. Survival probabilities were computed using the Kaplan–Meier method. The log-rank test and Cox proportional hazards regression model were used for the univariate and multivariate analyses of PFS and OS. No randomization was performed in this study.
Results
CD34+ Microvascular Niche
In GBM samples, perivascular glioma stem cell (GSC) niches are the most frequently described niches. The endothelial cells are the essential cell type of perivascular niches that control GSC stemness and can be visualized by immunofluorescence staining of markers such as CD34. CD34 expression was observed in the cytoplasm of tumor vascular endothelial cells. The microvascular formations varied and included single endothelium and tubular vessels in primary GBM tissues (Fig. 2). We classified CD34+ (green) vessels into four patterns. We found that CD133 (purple) or Nestin (red) were not only expressed on GSCs but were also expressed in the brain capillaries on endothelial cells as Codrici et al. 23 described (Fig. 2). We found that most of the CD133+ and Nestin+ cells exhibited a scattered distribution in MS and VC (Fig. 2A and B) but that CD133+ and Nestin+ cells surrounded heterogeneous microvessels in most of the VG and GVP areas (Fig. 2C and D) as described in our previous article. 21
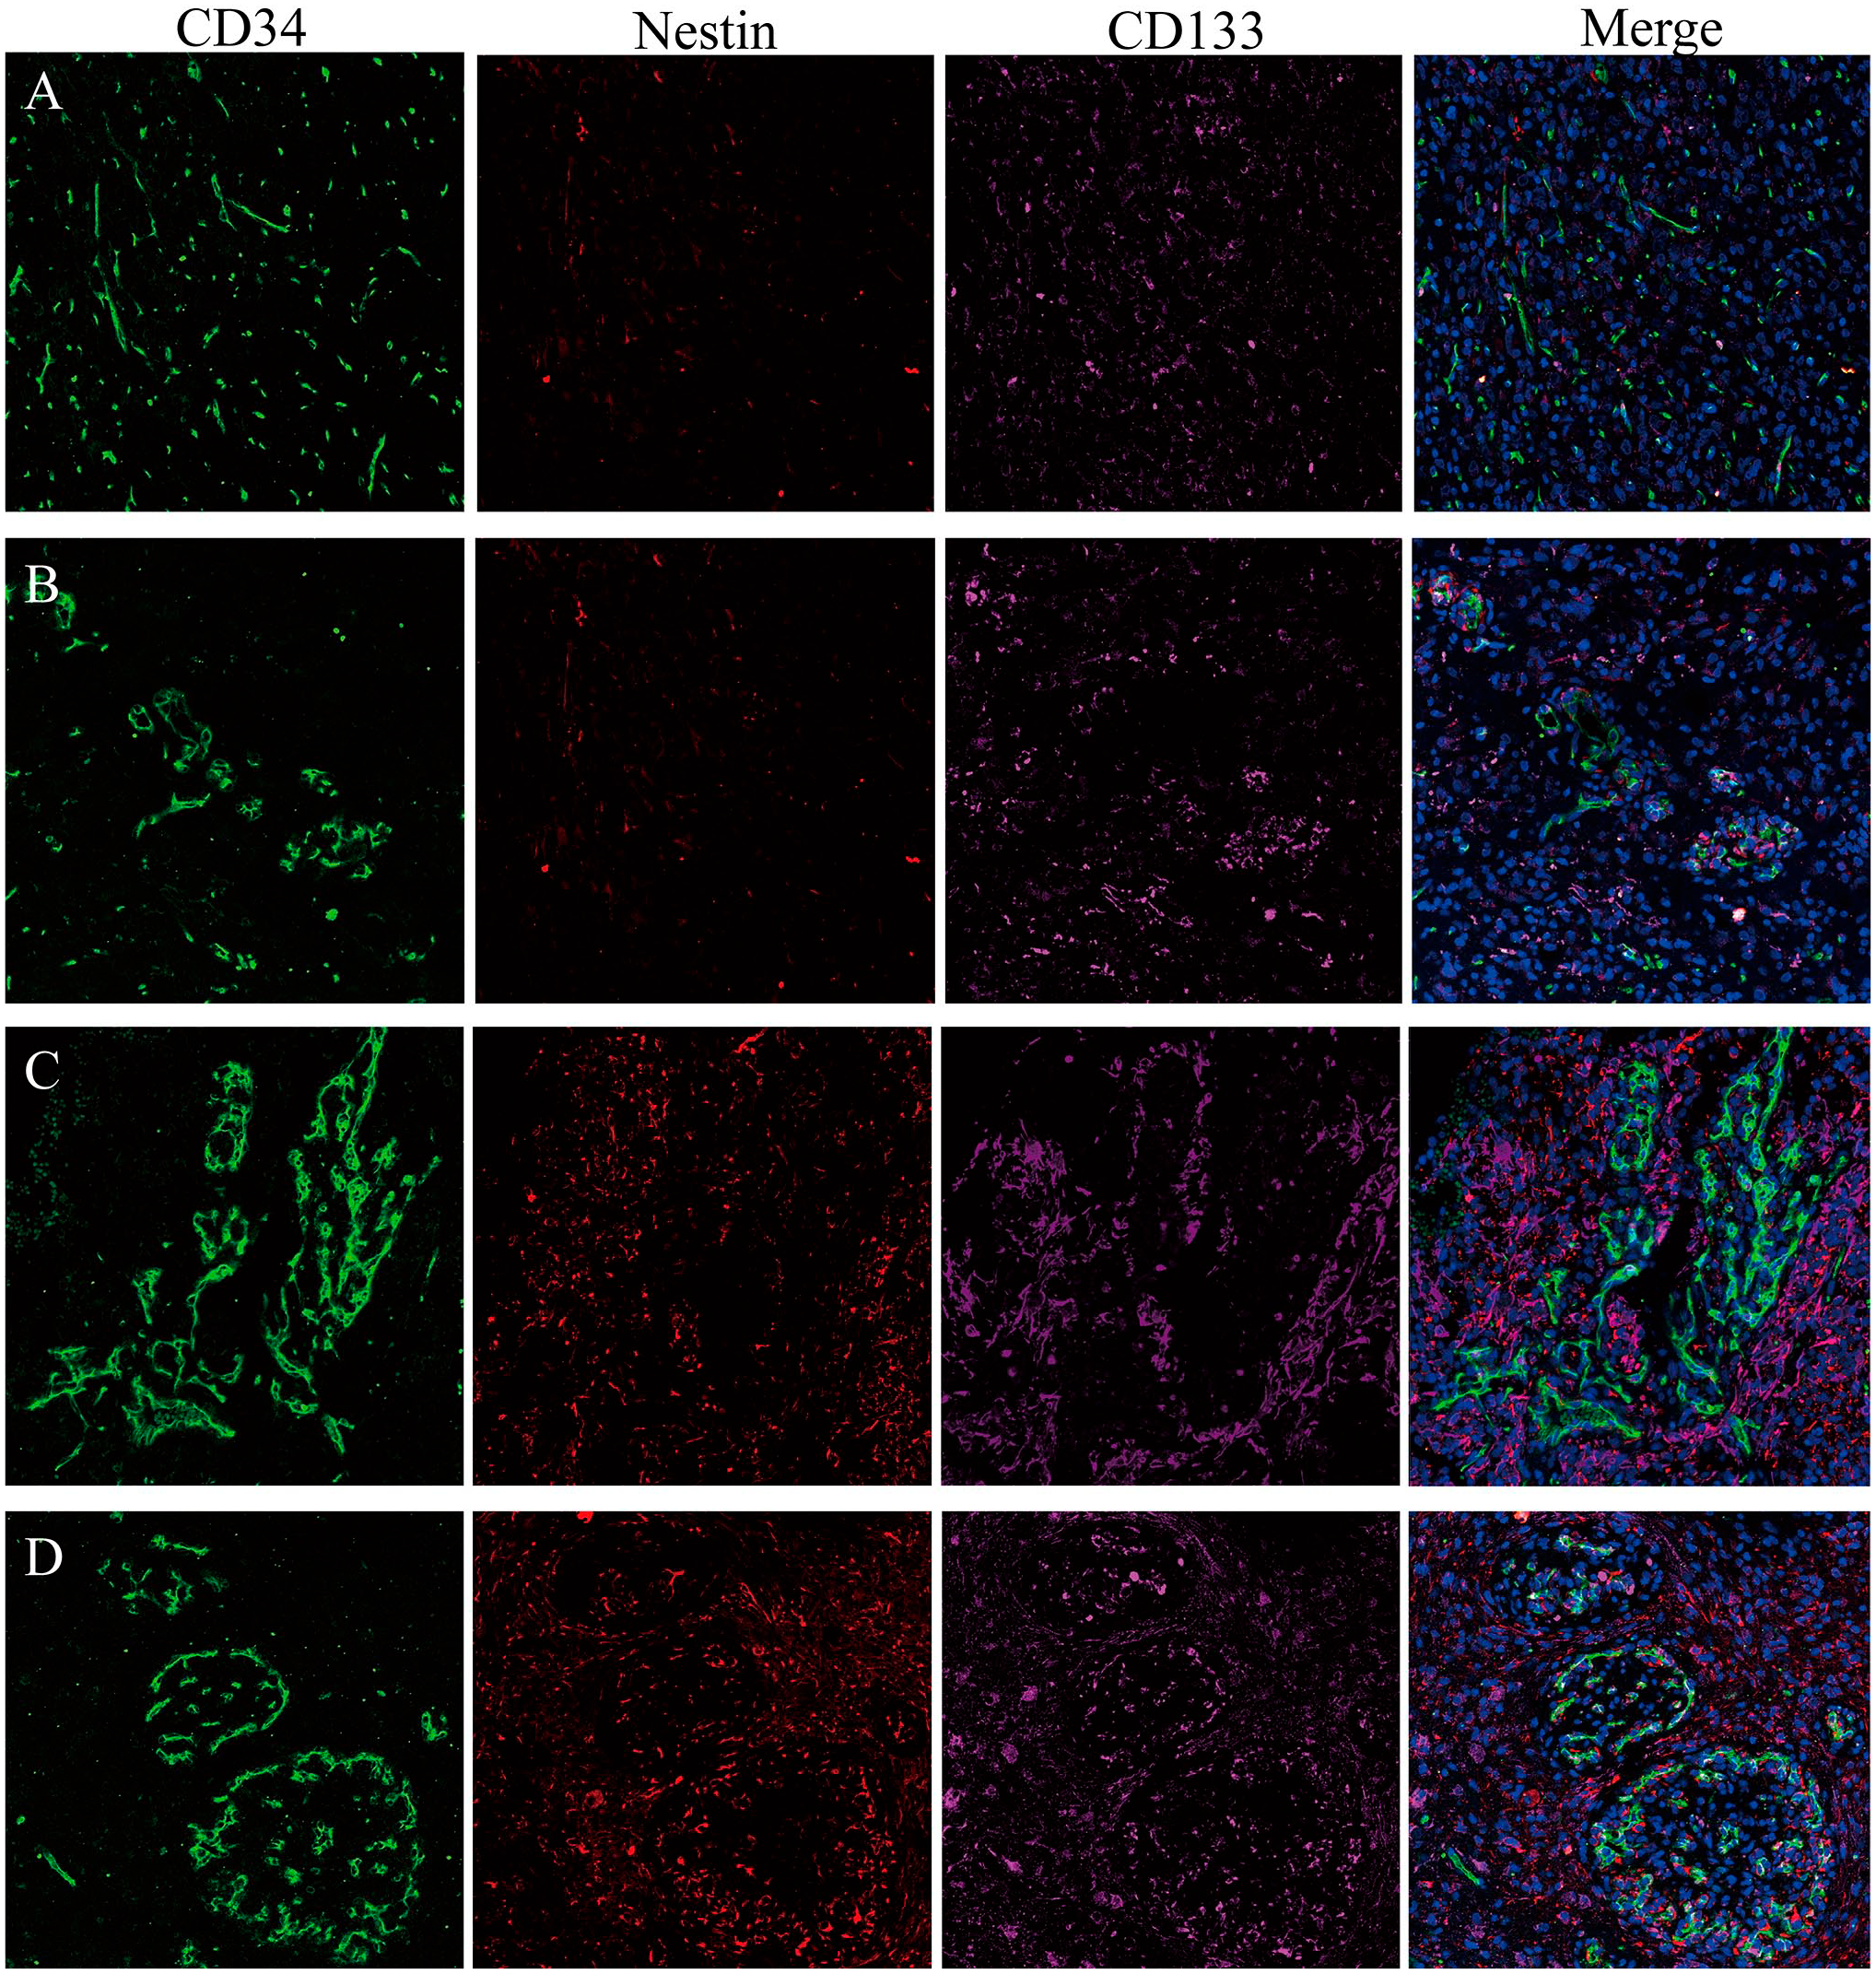
CD34/Nestin/CD133 expression in glioblastoma, CD34 (green), Nestin (red), CD133 (purple). Nuclei are counterstained with DAPI (blue). (A) MS, Nestin, and CD133-positive cells are scattered; (B) VC, Nestin, and CD133-positive cells have a regional maldistribution; (C) VG, a mass of Nestin-positive cells are accumulated as a cluster. Nestin was expressed not only on GSCs but also in the brain capillaries on endothelial cells, and CD133-positive cells reside closely to endothelial cells; and (D) GVP, the glomeruloid vascular that are surrounded by a large number of Nestin and CD133-positive cells and fewer in the avascular area. Abbreviations: DAPI, 4′,6-diamidino-2-phenylindole; MS, microvascular sprouting; VC, vascular cluster; VG, vascular garland; GSC, glioma stem cell; GVP, glomeruloid vascular proliferation.
Classification of MVNPs in GBM
MVNPs were evaluated in all 73 patients with GBM; a variable prominence of the four types of microvascular formation (MS, VC, VG, and GVP) was observed; this finding illustrated the heterogeneity of MVNPs (Table 2). With the aim of selecting an appropriate classification for MVNPs, we performed cluster analysis twice, with two or three clusters as the input parameters. Although the two values (Table 3) differentiated the MVNPs with distinct characteristics, we regarded a two-cluster classification system as optimal for this study, owing to its simplicity and practicability in clinical applications. We hypothesized that two types of MVNPs exist in GBM, one (type I) comprising primarily MSs and VCs, and the other (type II) comprising many VGs and GVPs. By analyzing the proportions of the two types, we determined the GBM with few MSs and VCs to have a substantial number of GVPs and VGs.
Characteristics of MVPs in the Overall Cohort.
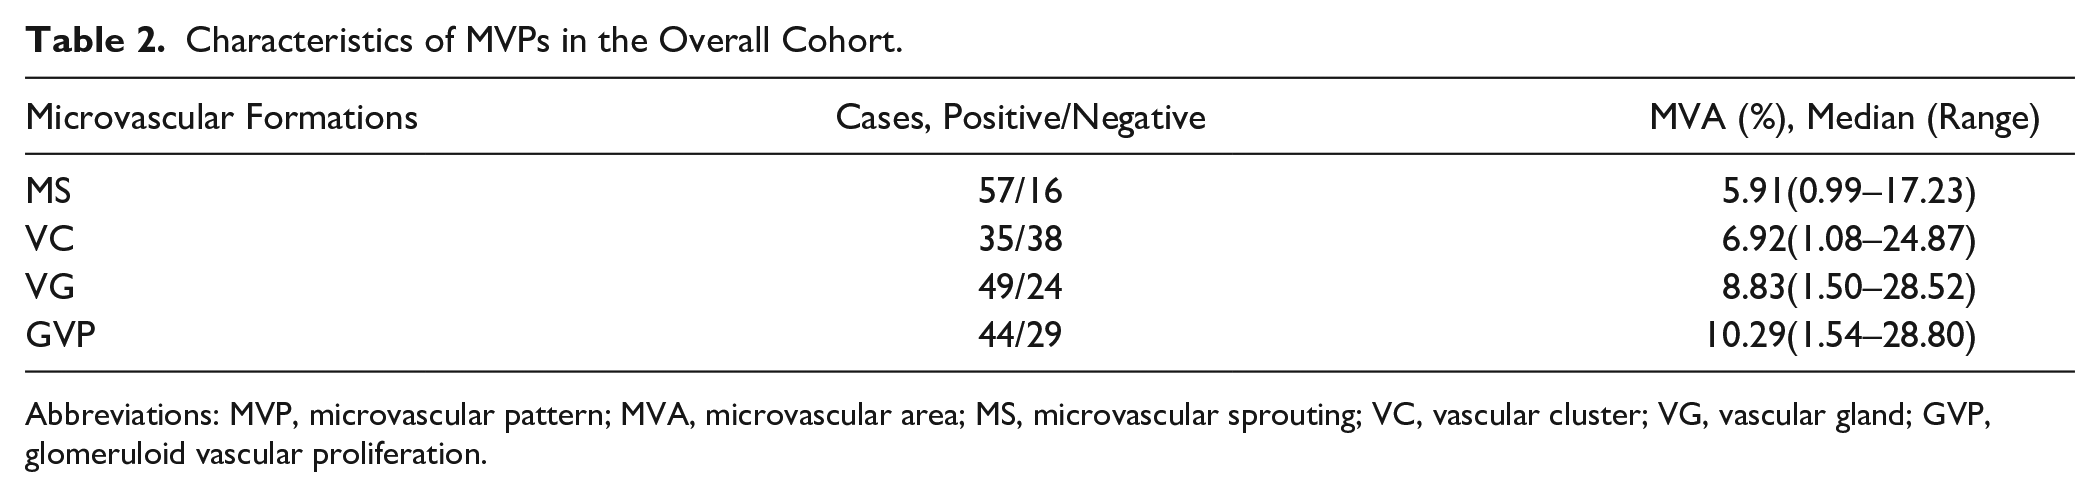
Abbreviations: MVP, microvascular pattern; MVA, microvascular area; MS, microvascular sprouting; VC, vascular cluster; VG, vascular gland; GVP, glomeruloid vascular proliferation.
Classifications of MVPs With Different Number of Clusters (K-Means Clustering Analysis).
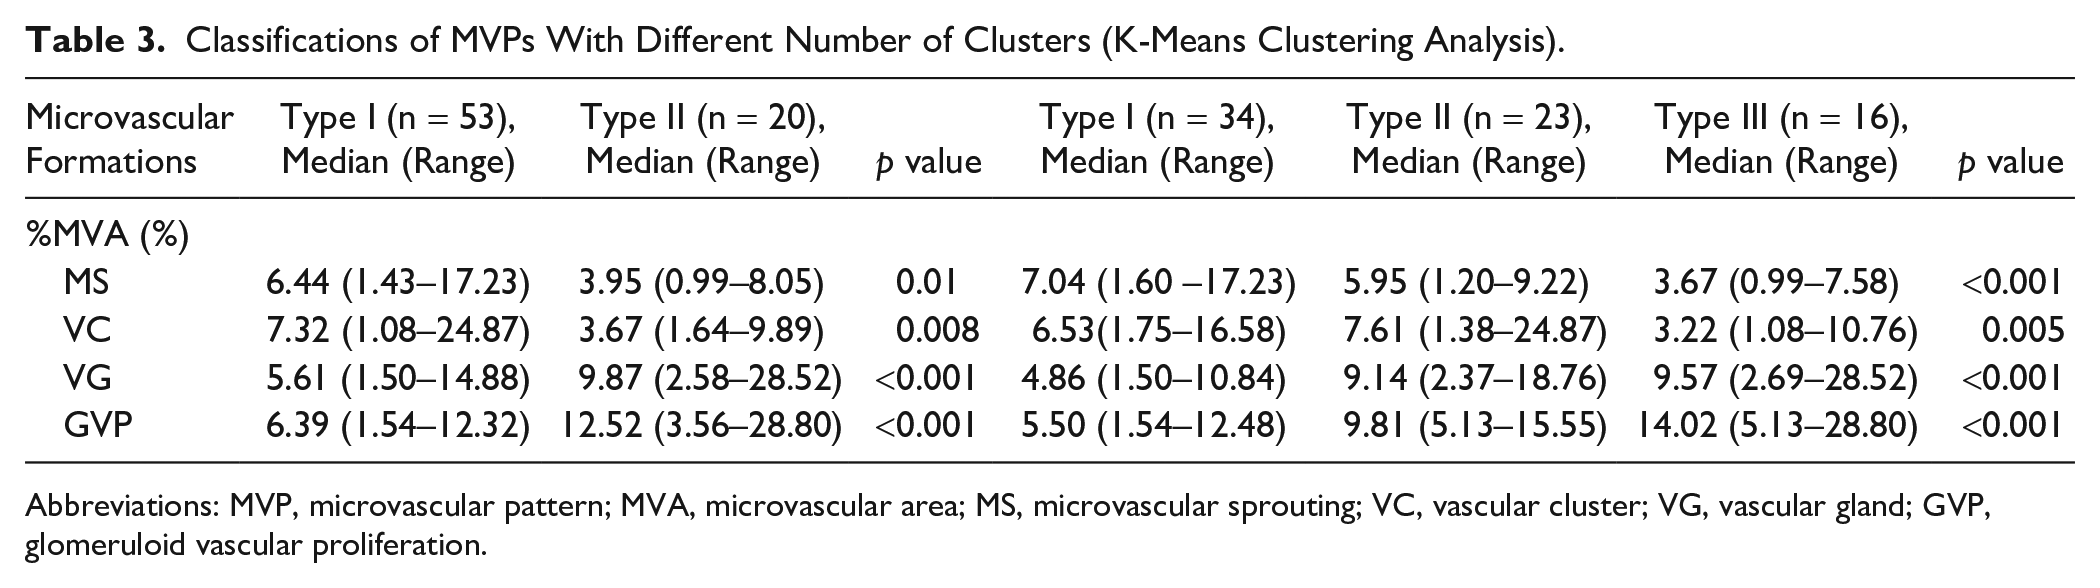
Abbreviations: MVP, microvascular pattern; MVA, microvascular area; MS, microvascular sprouting; VC, vascular cluster; VG, vascular gland; GVP, glomeruloid vascular proliferation.
Survival Analysis
Univariate analysis showed that the survival of patients with type II MVNPs was significantly lower than that of patients with type I MVNPs (p<0.05; Table 4, Fig. 3). Multivariate analysis confirmed type II MVNPs as a significant prognostic factor for shorter PFS [hazard ratio (HR), 0.531; 95% confidence interval (CI): 0.296–0.954; p=0.034] and OS (HR, 0.484; 95% CI: 0.253–0.927; p=0.029), independently of age, preoperative Karnofsky performance status, adjuvant therapy, and expression of molecular markers (Table 5).
Differences Between Glioblastomas With Type I and Type II MVPs.
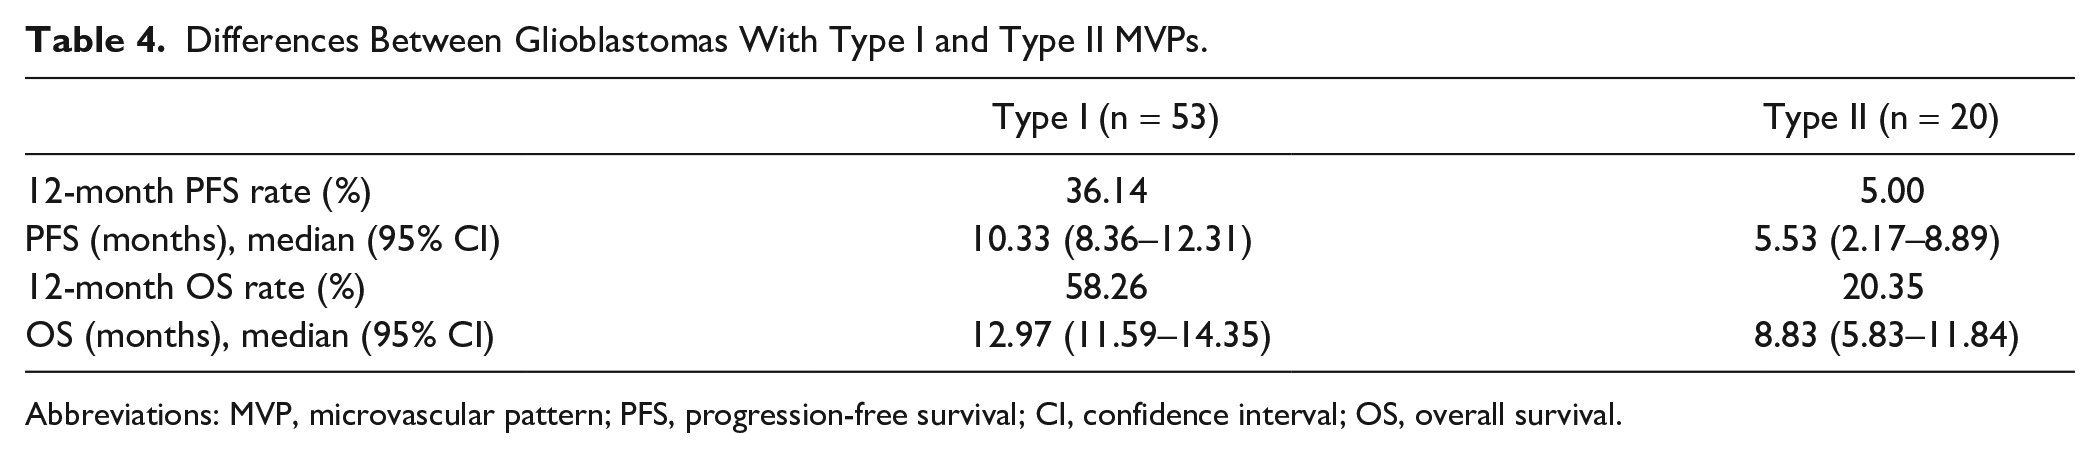
Abbreviations: MVP, microvascular pattern; PFS, progression-free survival; CI, confidence interval; OS, overall survival.
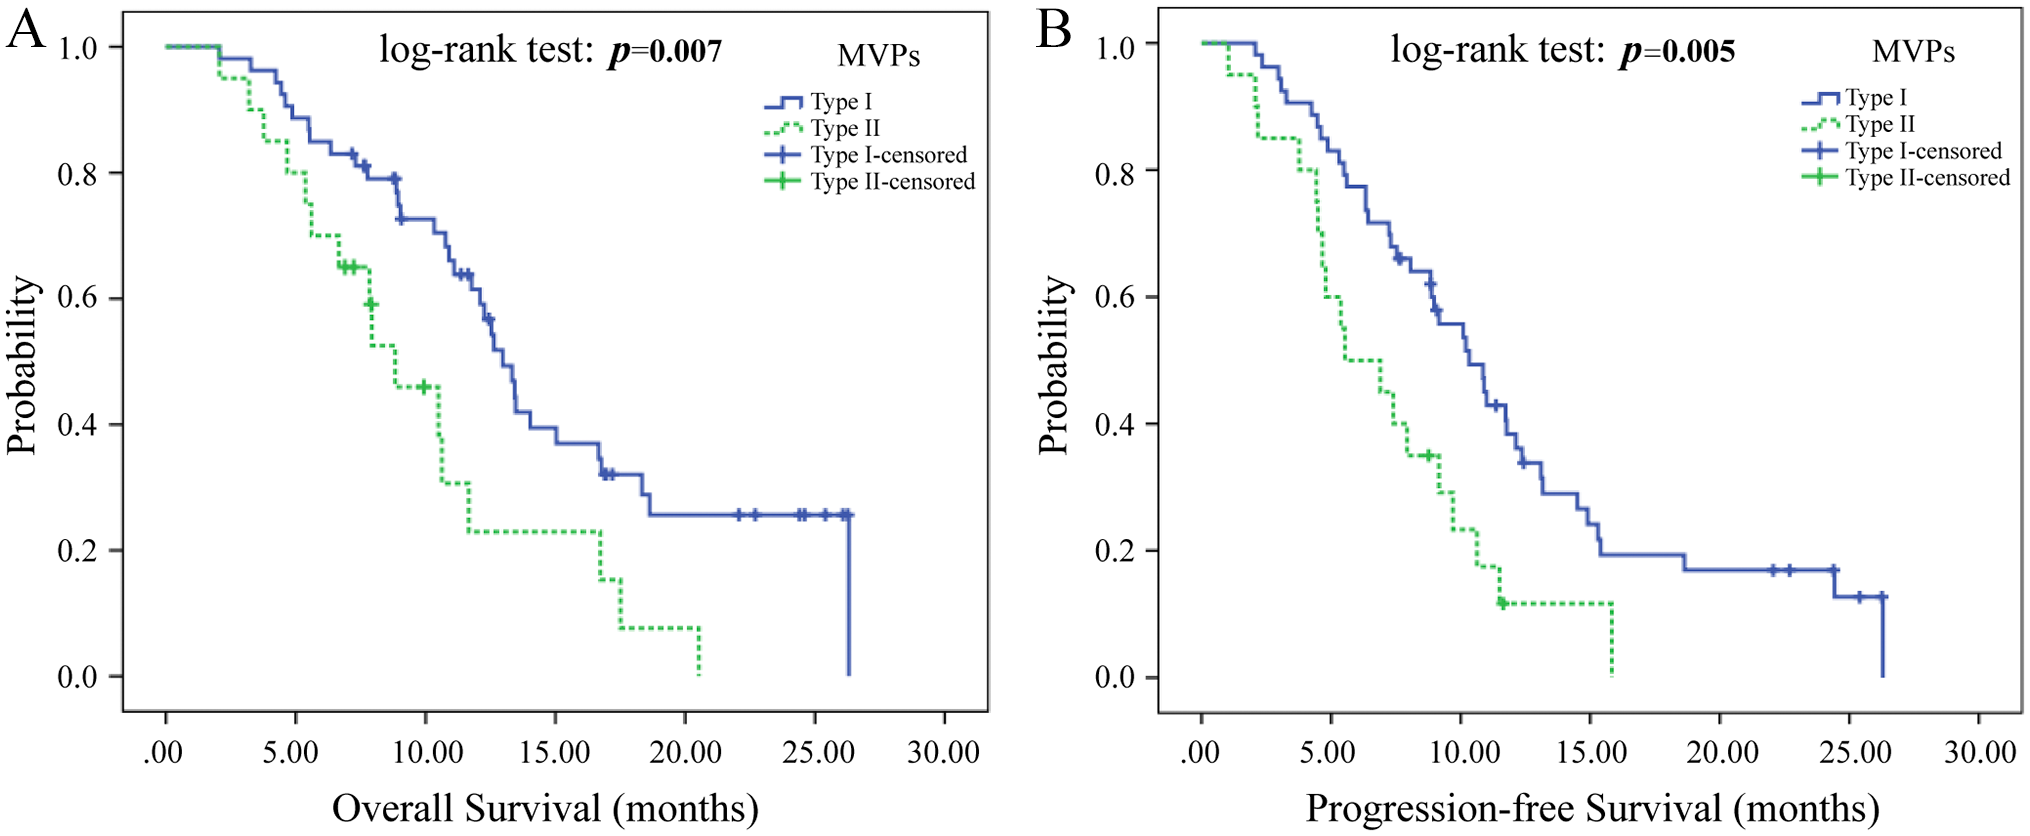
The correlation of different types of MVNPs with survival of patients with glioblastoma. Kaplan–Meier curves showing cumulative OS (A) and PFS (B) of patients with glioblastoma having different MVNPs (p<0.05). Abbreviations: MVNP, microvascular niche pattern; PFS, progression-free survival; OS, overall survival; MVP, microvascular pattern.
Multivariate Analysis of Cumulative PFS/OS of 73 Patients With Primary Glioblastoma (Cox Regression).
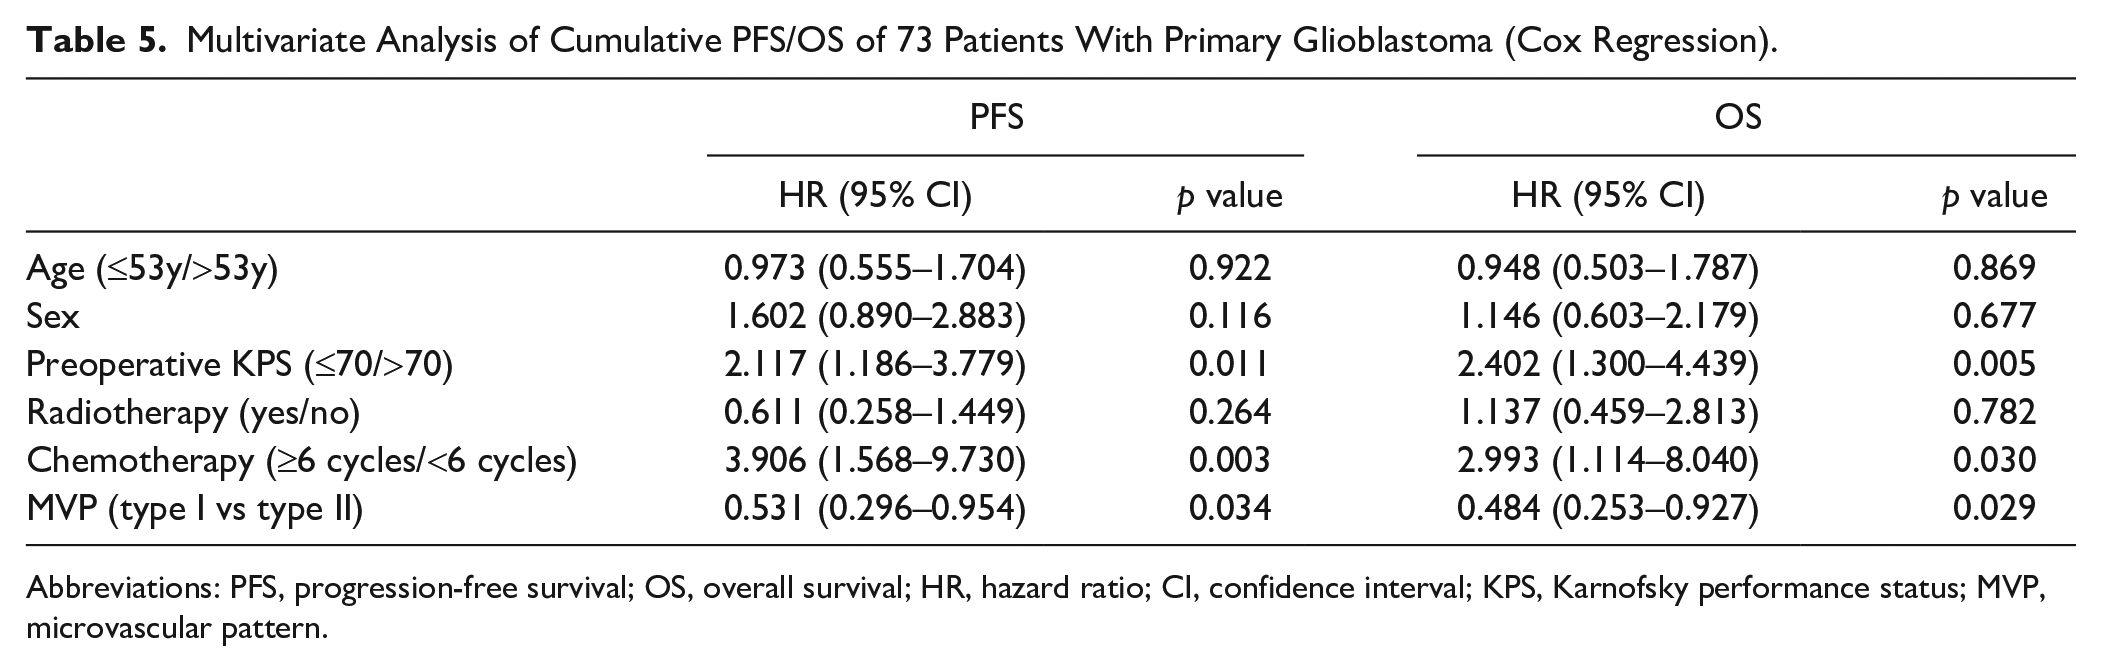
Abbreviations: PFS, progression-free survival; OS, overall survival; HR, hazard ratio; CI, confidence interval; KPS, Karnofsky performance status; MVP, microvascular pattern.
MALDI-IMS
Our first goal was to determine whether signatures derived from MALDI-IMS data were capable of robustly distinguishing the different histopathological features of GBM. Twelve FFPE GBM slides, each taken from 12 individual blocks, were analyzed by MALDI-IMS and immunofluorescence staining (Table 6). Each tumor was serially sectioned in two or more parts, which guaranteed the immunofluorescence staining results to be similar to those obtained with MALDI imaging. All tumors were primary GBMs. Various sample preparation protocols have been developed, for different imaging techniques, to prepare a sample suitable for analysis while maintaining the original spatial distribution of the analytes in the samples. 21 In this study, all MSI results were only relatively quantitative in the mass spectrometric sense; no internal standard was used. We found the different molecules to be distributed differently across the tumor samples (Figs. 4 and 5).
The Relationship Between Type I/Type II and Four Kinds of Different Polypeptide Protein Peak.
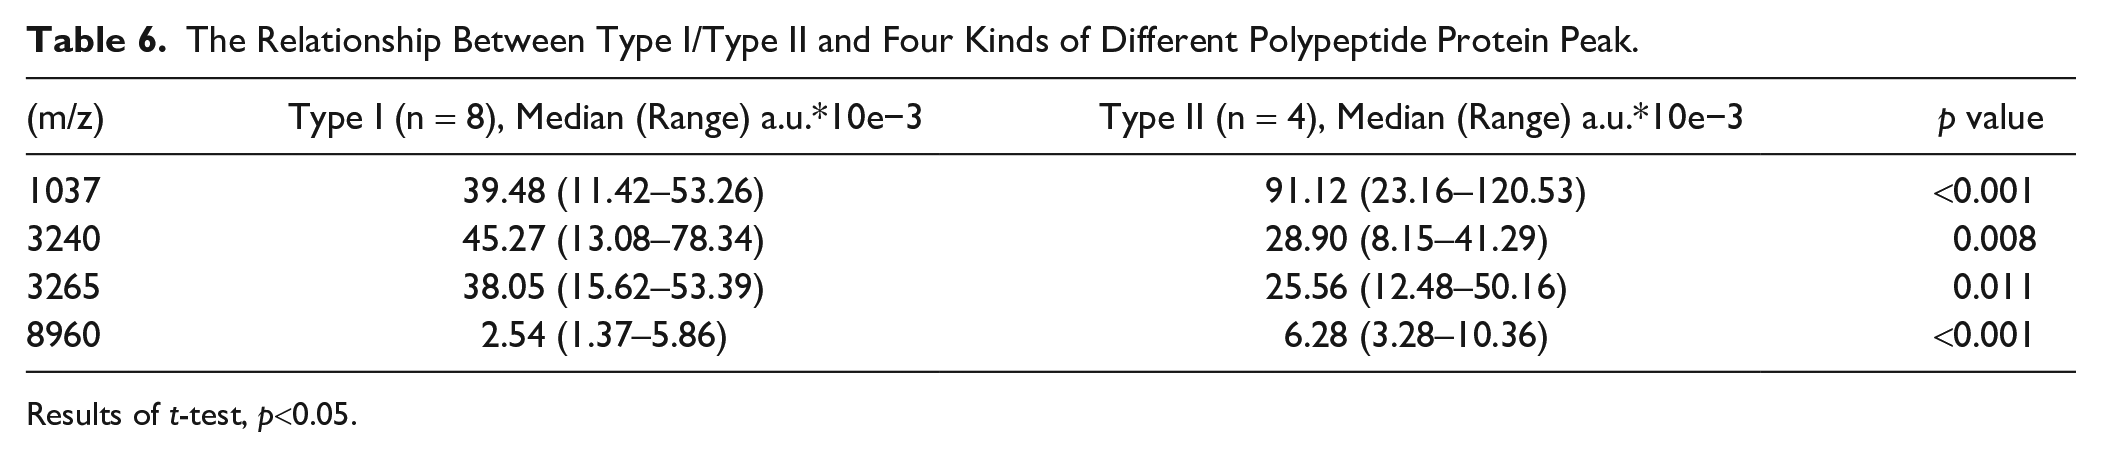
Results of t-test, p<0.05.
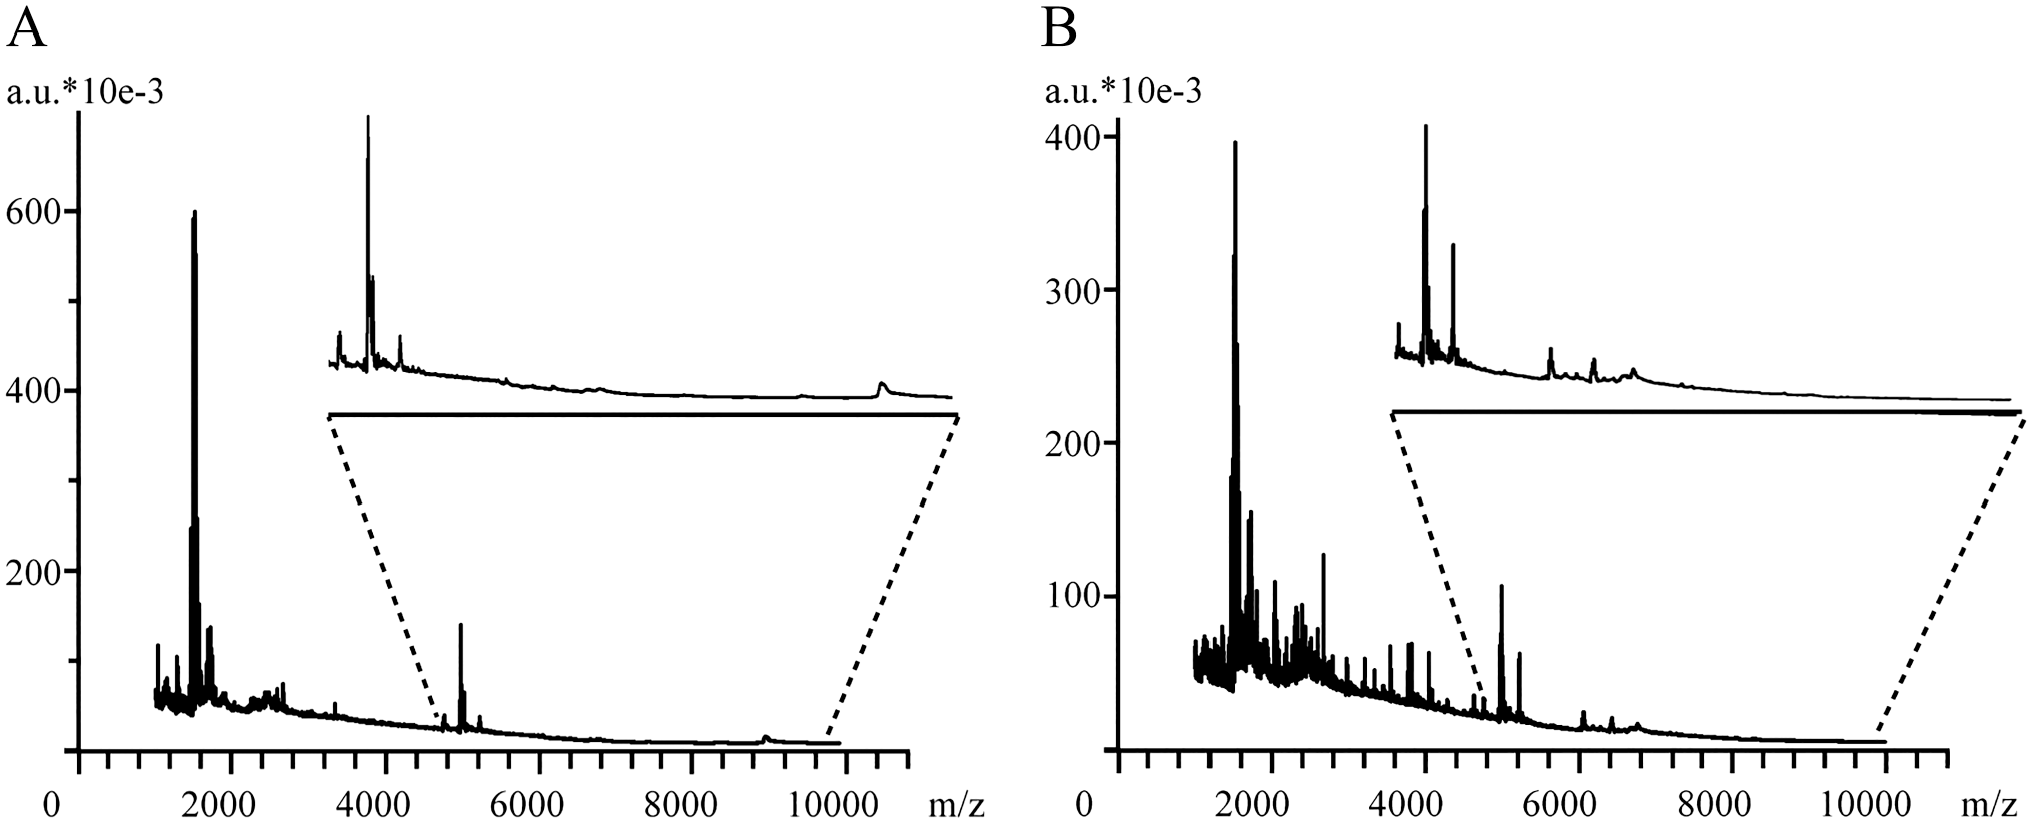
MALDI-IMS ion maps and associated mass spectra obtained using the optimized electrospray-on-tissue derivatization method. (A) Type II and (B) type I.
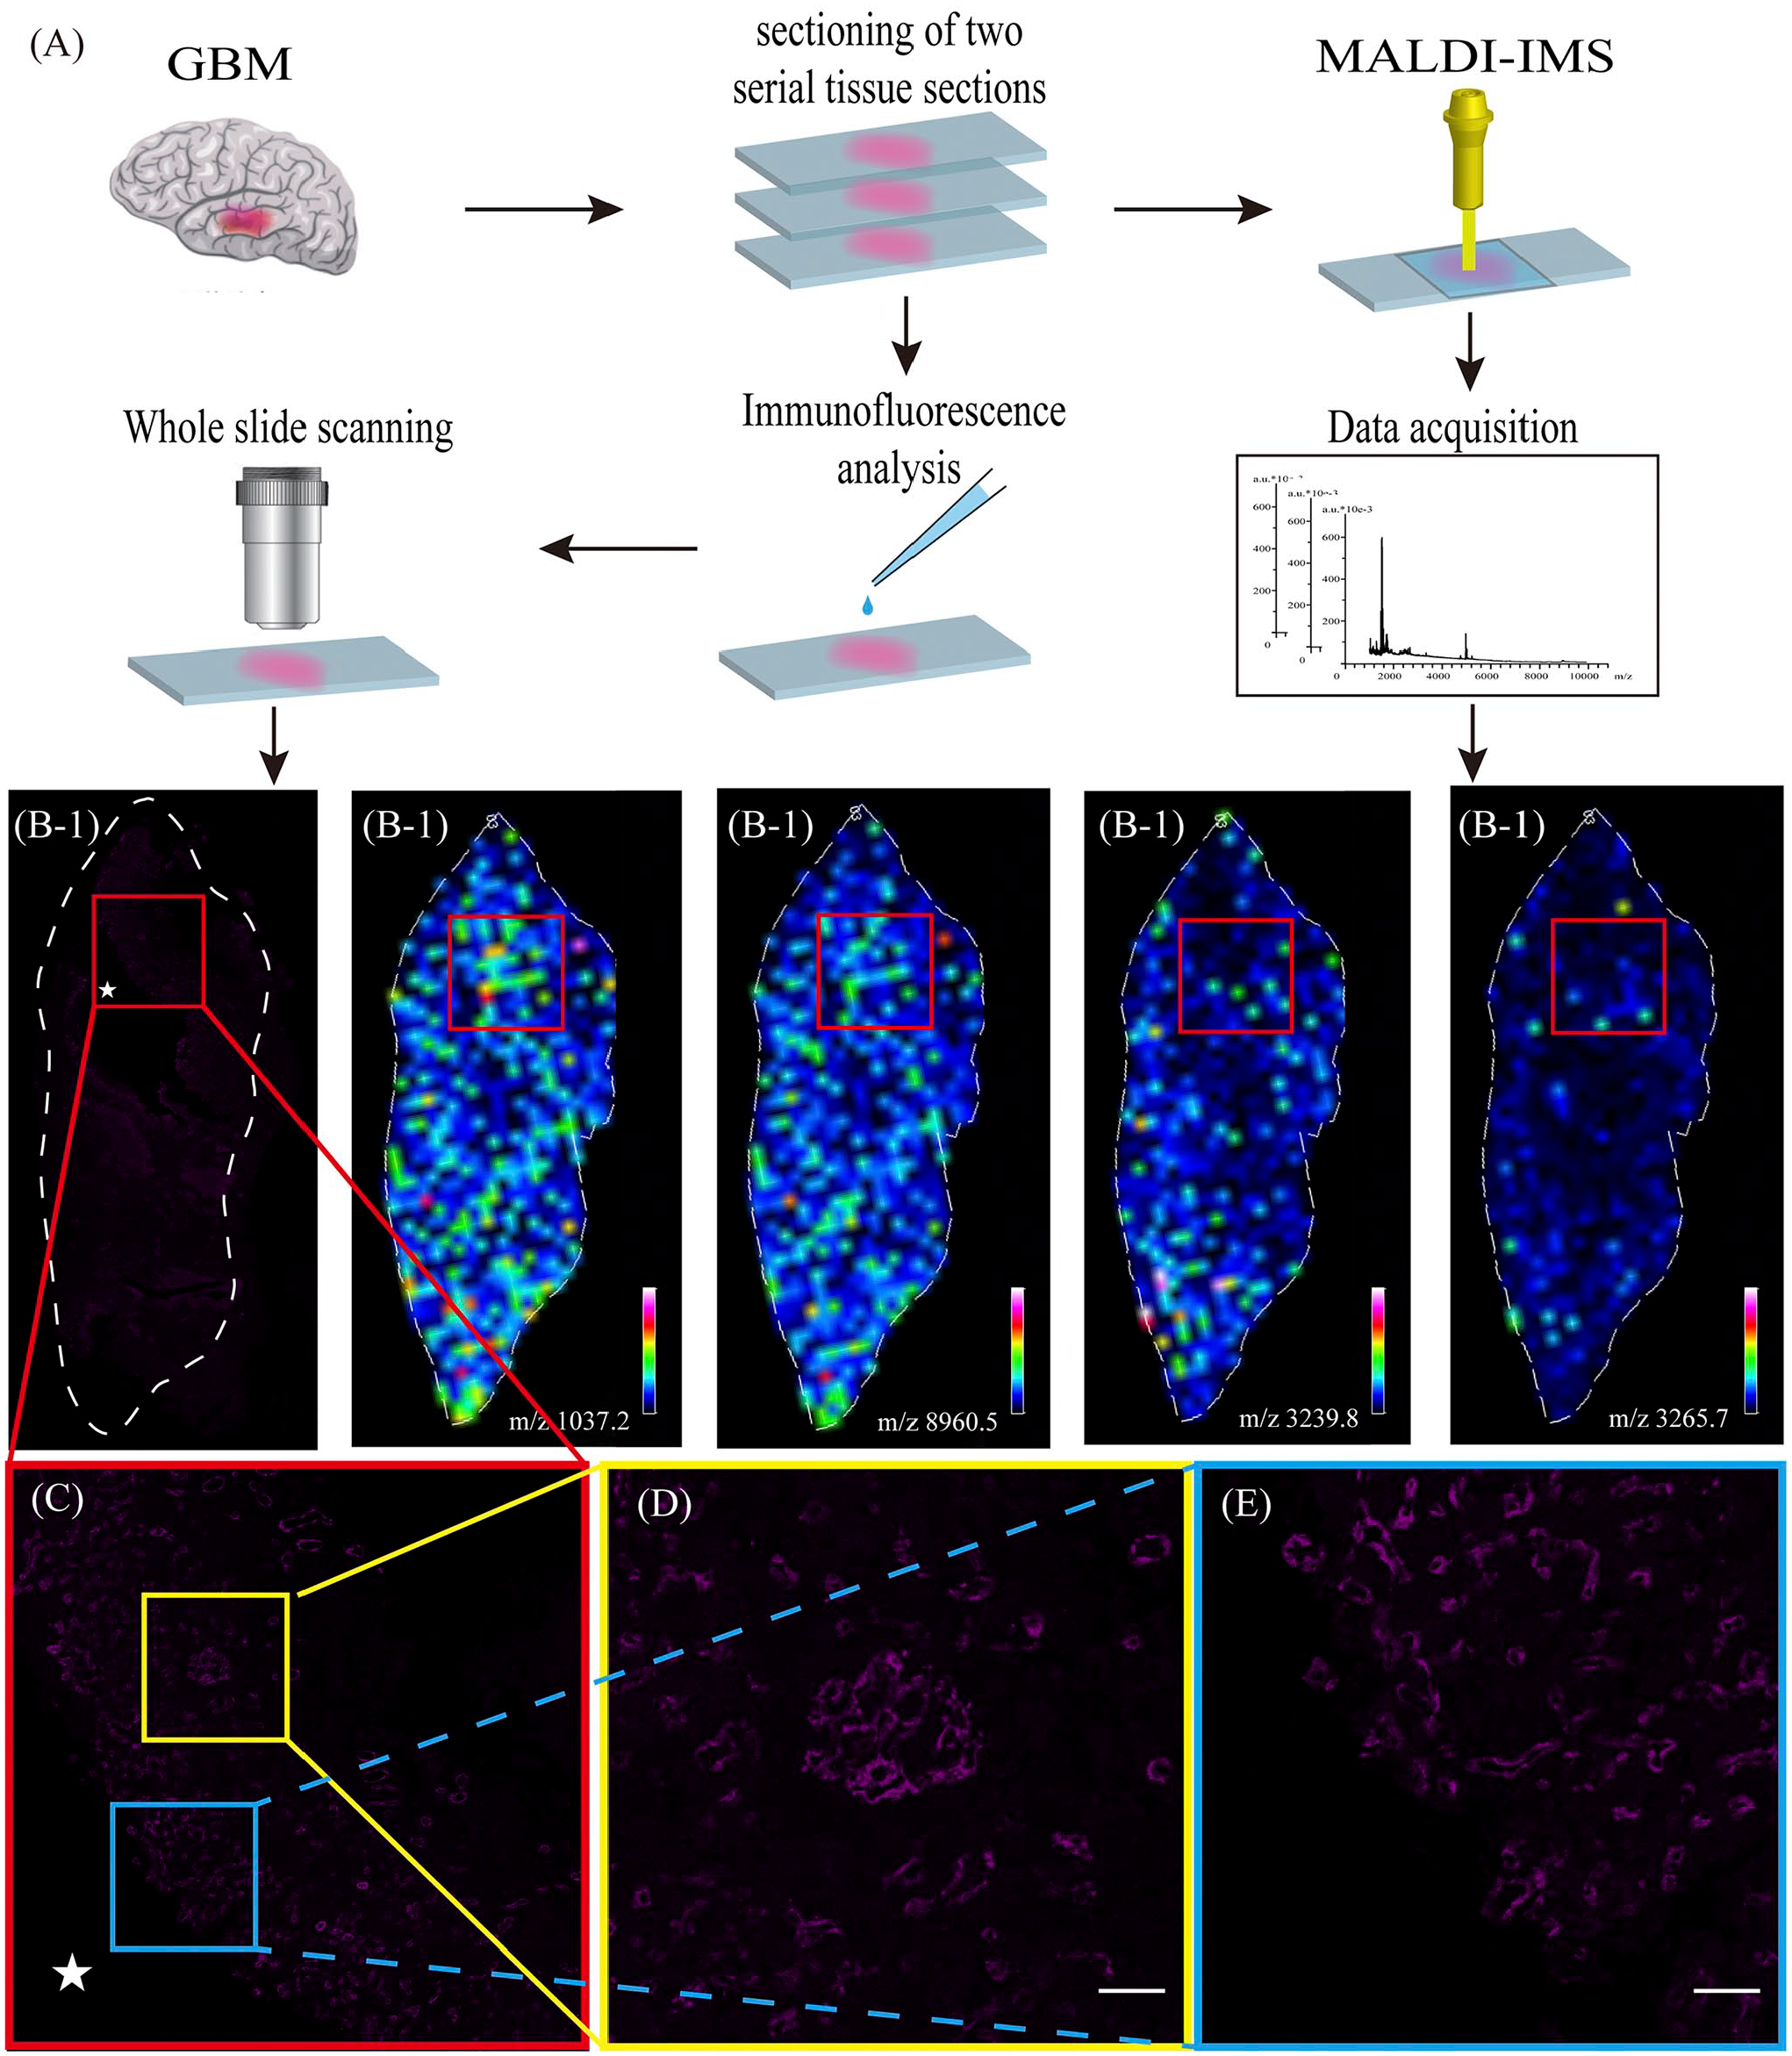
Serial GBM tissue sections for immunofluorescence and MALDI-IMS were prepared and coregistered to identify cell types and regions of interest (A). Distribution of proteins in the brain section (B). CD34 expression in glioblastoma (purple) (A/B/D/E). Amplification immunofluorescence staining: vascular pattern in glioblastoma (C/D/E). Distributions of the ions at m/z 3239.8, m/z 1037.2, m/z 3265.7, and m/z 8960.5 in glioblastoma section (B). Scale bars: D–E, 50 µm. Abbreviations: GBM, glioblastoma; MALDI-IMS, matrix-assisted laser desorption ionization-mass spectrometry imaging.
The generated segments were then correlated with tumor morphology by visual comparison with immunofluorescence-stained sections of the same specimens (Fig. 6). This methodology required expert pathology to determine the best segment correlation for each histological region. Gross tissue regions were assessed using MSI resolution of 200 µm, rather than considering the intricacies observed by optical microscopy of stained sections. However, we used relatively large blood vessel areas for contrast, ensuring the resolution. The data demonstrated that MSI signatures can successfully discriminate between the different types of molecules in tissue specimens that are associated with vascular distribution. Mass peaks at m/z 1037 and 8960 clearly exhibited stronger ion signals in the type II MVNPs of heterogeneous vessel regions, whereas those at 3240 and 3265 exhibited stronger ion signals in the type I MVNPs of less-vessel regions (p<0.05; Table 6, Fig. 4). We like to suggest that valuable complementary profiles of small metabolites, peptides, and proteins in GBM are achieved by combining the described protocols and that these differences are common to all tissues.
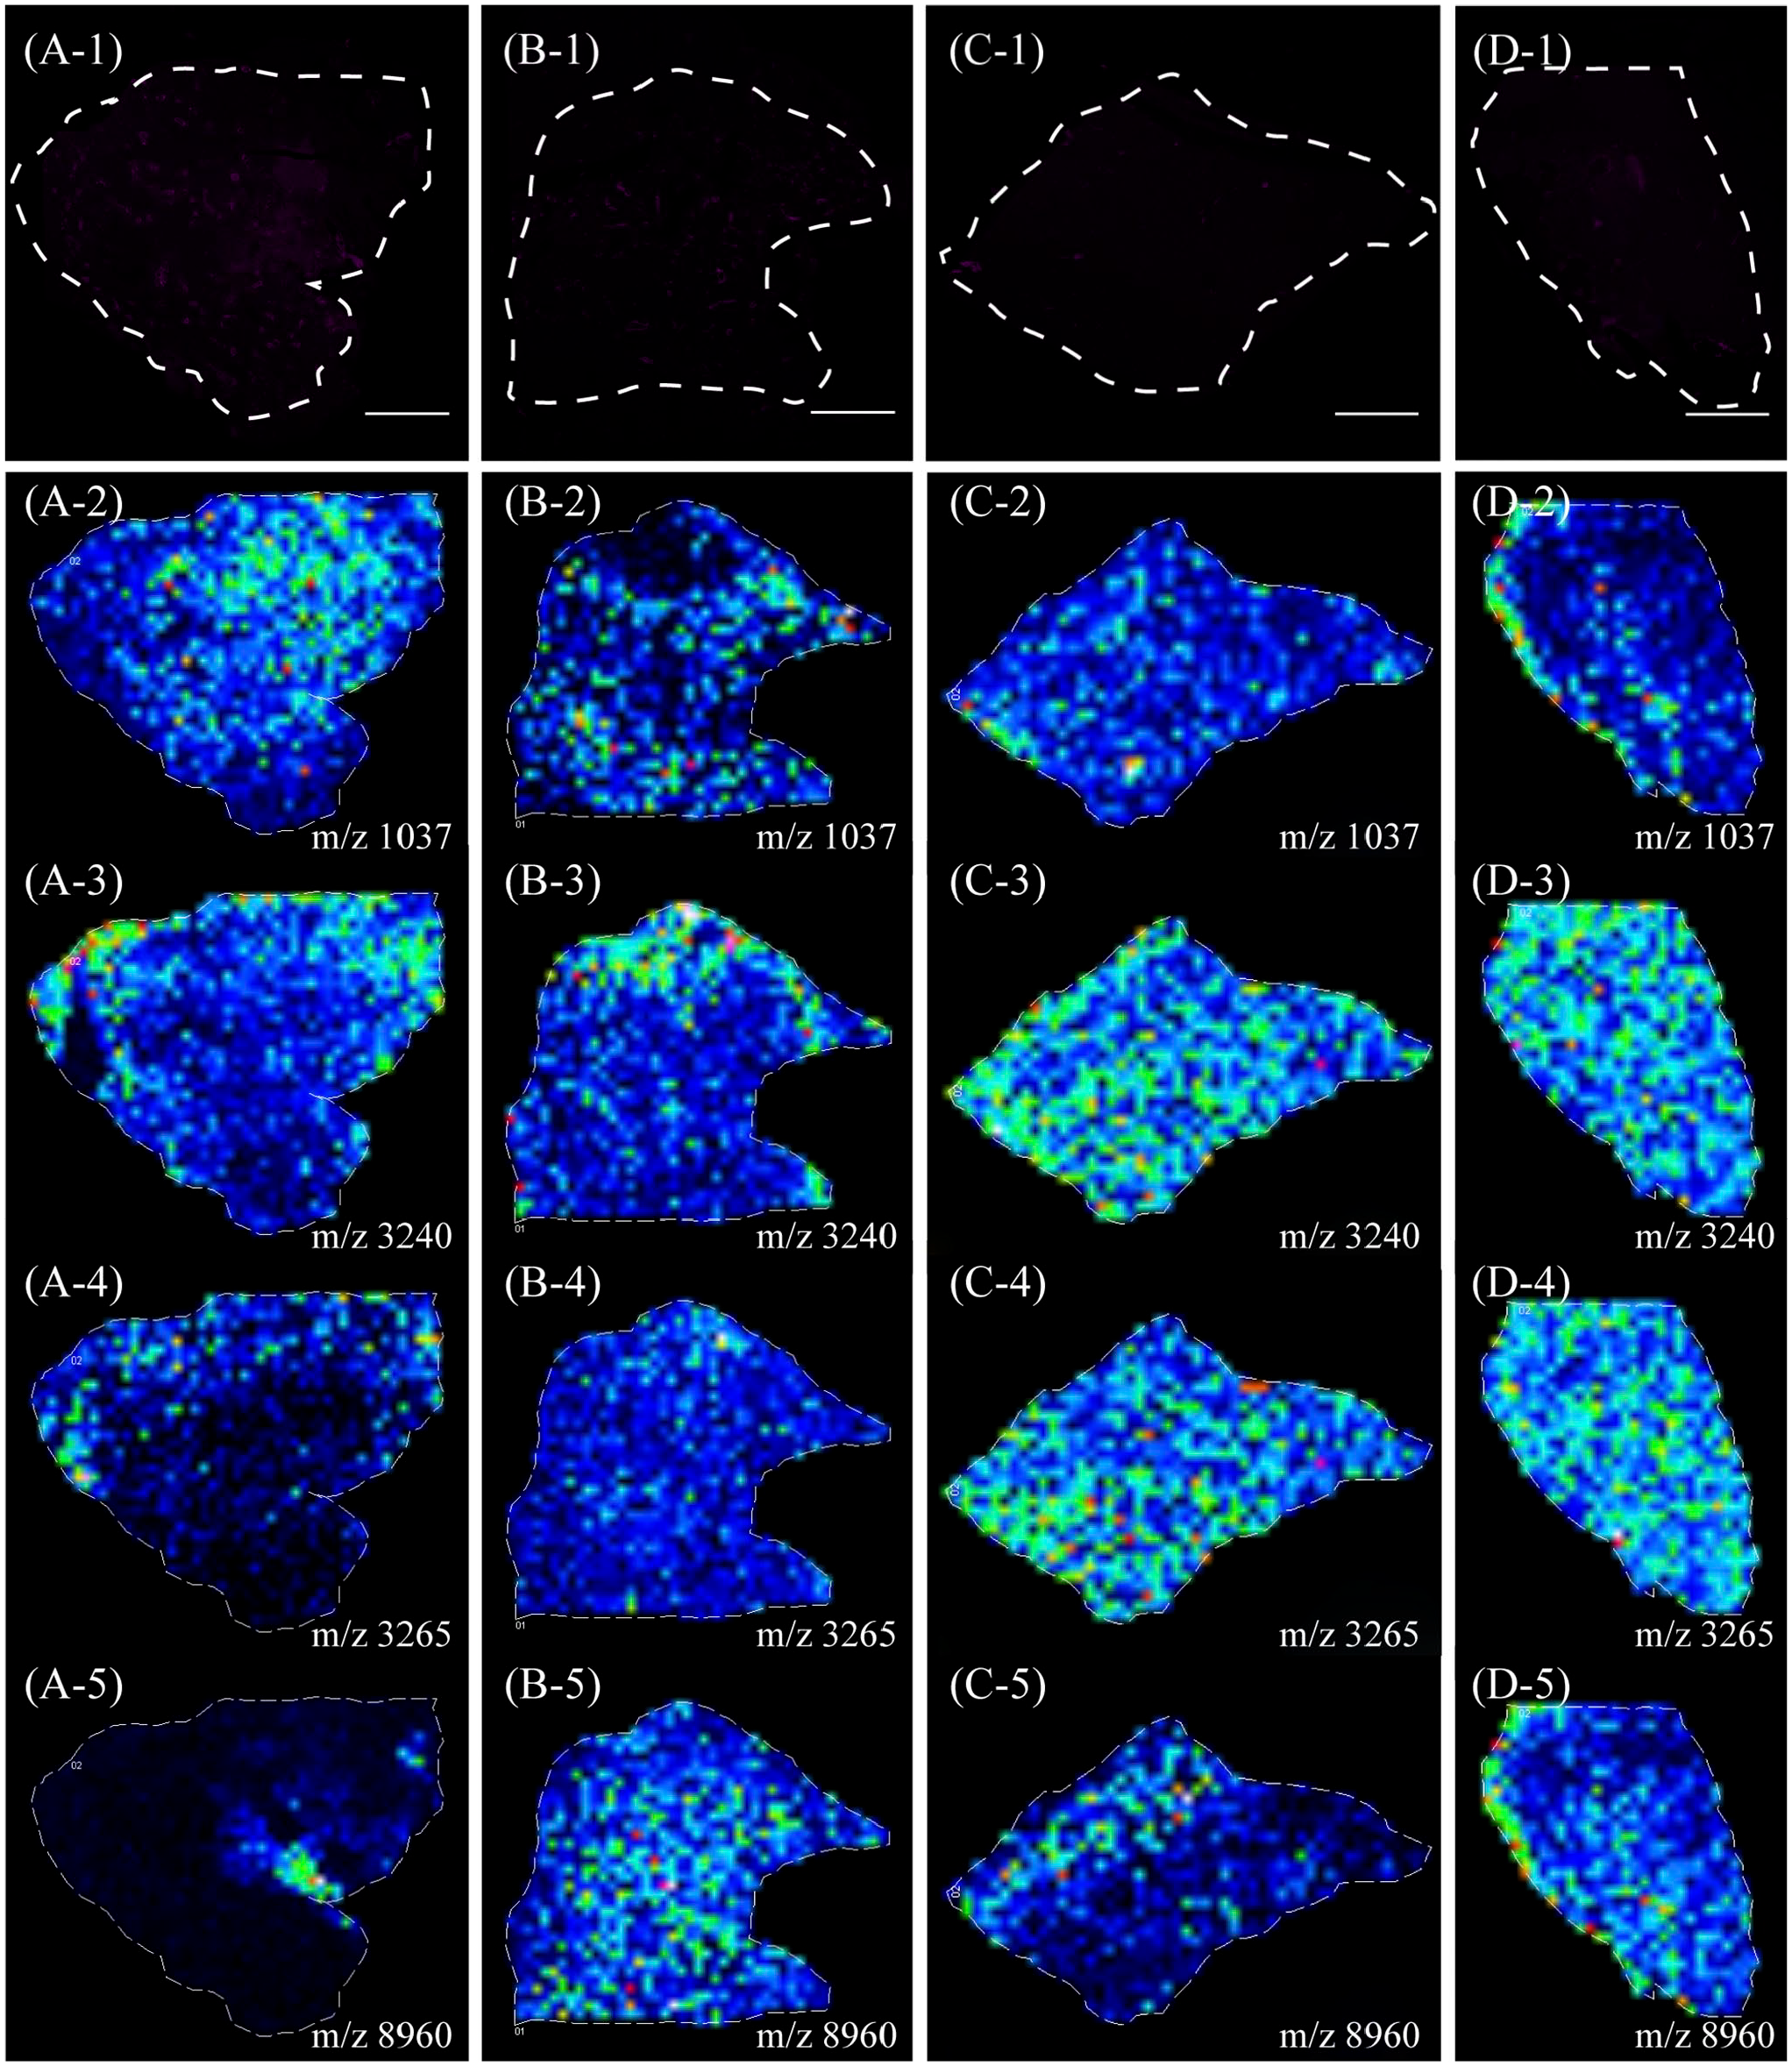
MALDI-IMS analysis of glioblastoma. Immunofluorescence staining: CD34 expression in tumor (type I MVP: A and B; type II MVP: C and D). Distribution of an exemplary component (m/z 1037 and 8960) relatively upregulated in the heterogeneous vessel regions (A-2, B-2, A-4, B-4). Distribution of an exemplary component (m/z 3240 and 3265) relatively upregulated in the less-vessel regions (C-2, D-2, C-3, D-3). Scale bars: A-1 to D-1, 2 mm. Abbreviations: MALDI-IMS, matrix-assisted laser desorption ionization-mass spectrometry imaging; MVP, microvascular pattern.
Discussion
GBM is one of the most vascularized human tumors with an abundance of disorganized microvessels. 11 Most studies thus far have focused on the role of microvascular density in GBM. The prognosis of GBM is usually dismal, and the effects of conventional antiangiogenesis therapies are limited. 24 Thus, novel therapies based on angiogenesis are of urgent importance. Birner et al. 9 and other studies11,25 had reported GBM to be associated with uneven distribution of microvessels in tumor tissues, which is relevant for clinical prognosis of GBM. However, none of the studies investigated the different components of MVNPs. In this study, we analyzed the types of MVNPs related to prognosis and investigated the relationships across different microvessels and proteins in GBM in order to improve our understanding of the structural features of MVNPs.
This study analyzed the relationship between GBM MVNPs and prognosis. K-means cluster analysis of the %MVA of distinct microvascular formations in GBM was used to classify the MVNPs into two types. The type I MVNPs consisted primarily of MSs and VCs, whereas type II MVNPs predominantly had VGs and GVPs. The results collectively showed that the two types of MVNPs correlated clearly with characteristic pathological differences; type II MVNPs contained large numbers of endothelial cells and vascular matrix, which may play a role in enhancing the vascular patterns resistant to traditional radiation and chemotherapy. Moreover, the results of our statistical analysis indicated that significant differences in prognosis existed between the two types of MVNPs. Patients with tumors that displayed type II MVNPs exhibited poorer PFS and OS than those with type I MVNPs. This indirectly explained that type II MVNPs, which contain many VGs and GVPs, may interact with GSCs to protect the latter through the heterogeneity of endothelial cells, making it easy to recur, and eventually leading to poor prognosis of GBM.
On the basis of our analysis, different types of MVNPs may be considered to have different prognoses, owing to the different compositions across MVNPs. Therefore, studying the components of MVNPs is critical. The primary objective of this study was to explore the spatiotemporal protein pattern of GBM by immunohistochemical staining, which could detect one or at most two proteins.8,26 We showed that protein images can be acquired by sequential MALDI-IMS of the same tissue section. We found the distribution of polypeptides at different m/z in type I and type II MVNPs to be different. Compared with that in type II MVNPs, the amount of polypeptides with m/z 3240 and 3265 were higher in type I MVNPs. In contrast, polypeptides with m/z 1037 and 8960 were densely distributed in type II MVNPs. This showed that the two polypeptide clusters are potential biomarkers of type II MVNPs in GBM.
The results showed the usefulness of MALDI-IMS in the identification and mapping of molecules associated with highly vascularized regions. Some of the proteins were in opposite distribution relative to the vasculature. This phenomenon revealed that newly formed tumor microvessels may be related to the perivascular microenvironment, which provides all kinds of nutritional factors. This is the first study that used MALDI-IMS to identify proteins in the perivascular microenvironment, thereby allowing protein identification using a single thin tissue section while preserving the inherently critical spatial information within the microenvironment of the tissue. The abundance and components of tumor molecules in type II MVNPs are different from those in type I MVNPs. Although their contribution to MVNPs needs to be further determined, molecules in different types of MVNPs appear to provide a new avenue for anticancer strategies.
In conclusion, cluster analysis of microvascular formations allowed us to classify the tumors into two types. Patients with tumors of type II MVNPs, consisting mainly of VGs and GVPs, have a poorer clinical outcome than those with type I MVNPs, which is richer in MS and VC. Based on the above classification, different polypeptide proteins, distributed in different types of MVNPs, were identified using MALDI-IMS technology. We have established a research method for internal differentiation of polypeptides in different types of MVNPs based on MALDI-IMS. In this way, we may find new substances promoting vascularization for personalized antiangiogenesis therapy. In addition, therapies directed to annihilate a fixed target, such as GSCs, which are responsible for growth, resistance, and recurrence of the tumor, should be converted into therapies aimed at molecular modifications of the microenvironment.
Footnotes
Acknowledgements
The authors thank the Department of Pathology, Sanbo Brain Hospital, Capital Medical University, Beijing, for their help in the design of immunofluorescence study, and Fujian Medical University, Fujian, China, for assistance in data processing and statistical analysis.
Competing Interest
The author(s) declared no potential conflicts of interest with respect to the research, authorship, and/or publication of this article.
Author Contributions
J-ML and Z-XL contributed to the conception of the study; JC, SM, and ZH performed the experiment; LY and JZ contributed significantly to analysis and article preparation; JC, J-ML, and Z-XL performed the data analyses and wrote the article; and JC, LY, JZ, J-ML, and Z-XL helped perform the analysis with constructive discussions.
Funding
The author(s) disclosed receipt of the following financial support for the research, authorship, and/or publication of this article: This work was supported by the National Natural Science Foundation of China (grant number 21435002) and Professor Fund of Fujian Medical University (grant number JS15006).
Ethical Approval
All procedures performed in this study were in accordance with the ethical standards of the institutional and national research committee and with the 1964 Helsinki Declaration and its later amendments.
Data Accessibility Statement
The data used to support the findings of this study are included in this article.
Supplemental Material
Sample Preparation for MALDI-IMS
For this analysis, fixation time was set at 24 hr following the surgical procedure, as previously described. Representative formalin-fixed and paraffin-embedded blocks encompassing the minimum amount of necrosis, inflammation, and/or artifacts were selected for each case. Five-µm-thick sections were cut and mounted onto conductive indium tin oxide glasses.
Paraffin removal and antigen retrieval was performed as previously described. Then, trypsin deposition (100 ng/μl; Sigma-Aldrich USA) was performed using the iMatrixSpray (Tardo Gmbh; Subingen, Switzerland) automated spraying system and then left in a humid chamber overnight at 40C. Finally, matrix deposition for matrix-assisted laser desorption ionization (MALDI) analysis was performed by spraying α-cyano-4-hydroxycinnamic acid (10 mg/ml in 50:50 acetonitrile: water w/0.4% trifluoroacetic acid) using the iMatrixSpray (Tardo Gmbh) with an optimized method.19,20
For each glioblastoma (GBM) tissue section, mass spectra were acquired using an ultrafleXtreme (Bruker Daltonik GmbH) MALDI—time of flight mass spectrometer. The instrument was equipped with a smart beam laser operating at 2-kHz frequency in reflectron-positive mode (mass-to-charge range: m/z 1000–10,000). A mixture of standard peptides within the mass range of m/z 750–3150 (PepMix I; Bruker Daltonik) was used for external calibration. MALDI-MS images were acquired with a laser diameter of 50 μm and a raster sampling of 100 μm.
Following MALDI-MSI analysis, the matrix was removed with increasing concentrations of ethanol (70 and 100%) and the slides were stained using hematoxylin and eosin and Congo red. The slides were converted to digital format using a ScanScope CS digital scanner (Aperio; Park Center Dr, Vista, CA), thus allowing for the direct overlap of images and the integration of proteomic and morphological data. Regions of interest were annotated by the pathologist, including GBM intratumoral areas suggestive of microvascular patterns.