
Abstract
Fluoro-Jade C (FJC) staining has been used to detect degenerating neurons in tissue sections. It is a simple and easy staining procedure and does not depend on the manner of cell death. In some experiments, double staining with FJC and fluorescent immunostaining (FI) is required to identify cell types. However, pretreatment for FJC staining contains some processes that are harsh to fluorophores, and the FI signal is greatly reduced. To overcome this issue, we improved the double staining protocol to acquire clear double-stained images by introducing the labeled streptavidin–biotin system. In addition, several studies indicate that FJC can label non-degenerating glial cells, including resting/reactive astrocytes and activated microglia. Moreover, our previous study indicated that degenerating mesenchymal cells were also labeled by FJC, but it is still unclear whether FJC can label degenerating glial cells. Acute encephalopathy model mice contained damaged astrocytes with clasmatodendrosis, and 6-aminonicotinamide-injected mice contained necrotic astrocytes and oligodendrocytes. Using our improved double staining protocol with FJC and FI, we detected FJC-labeled degenerating astrocytes and oligodendrocytes with pyknotic nuclei. These results indicate that FJC is not specific to degenerating neurons in some experimental conditions:
Introduction
Historically, cell death has been morphologically classified into three types: necrosis, apoptosis, and autophagy.1,2 An increasing number of studies on the molecular mechanisms of cell death have indicated that this classification is too simple, and there are other manners of cell death or overlapping mechanisms. 3 At present, cell death is mainly classified into two types: accidental cell death and regulated cell death defined by the Nomenclature Committee on Cell Death. 3
Neurons are the most vulnerable cell type in the nervous system against many insults, including traumatic injury, ischemia, and excitotoxicity. An examination of the cell death mechanisms of neurons is critical for clinical purposes to prevent neuronal cell loss, and detection of dying neurons by histological techniques is essential in experimental animals.
There are many histological techniques to detect dying neurons, including suppressed silver techniques and hematoxylin and eosin staining. Fluoro-Jade (FJ) staining was reported to be a staining method specific for degenerating mature neurons. 4 From the ancestral dye FJ, Fluoro-Jade B (FJB) and Fluoro-Jade C (FJC) dyes have been developed to achieve higher intensity and increased resolution and specification against damaged neurons.5,6 Staining by FJs (FJ, FJB, and FJC) can visualize cell bodies and processes of damaged neurons. Moreover, staining by FJs can be combined in double staining with fluorescent immunostaining (FI). FJs are supposed to react to molecular structures that are specific to degenerating mature neurons, 4 but the detailed mechanism in which FJs stain degenerating neurons remains unclear.
Although FJs have been used to stain degenerating mature neurons, there have been some reports claiming that FJs stain some non-degenerating glial cells: reactive astrocytes, activated microglia, and resting astrocytes.5,7–12 Moreover, it was reported that non-degenerating neurons can also be labeled with FJC in the embryonic brain. 13 In our previous study, we showed that FJC can stain degenerating neuronal cells in all developing stages: mature and immature neurons and neural stem/precursor cells. 14 In addition, damaged mesenchymal cells were also FJC positive (+). 14 These facts indicate that FJs staining is not always specific to degenerating mature neurons in some experimental conditions. In addition, it is still unclear whether degenerating glial cells can be stained by FJC.
To specify the cell types stained by FJs, double staining with FJs and FI using cell-type-specific antibodies is necessary, but, unfortunately, double staining with FJC and FI does not always work well in some situations. 14 The FJC staining requires treatment with potassium permanganate (KMnO4) solution, acetic acid (vehicle of FJC), and xylene. In the standard protocol for double staining with FJC and FI provided by the manufacturer, primary and fluorophore-conjugated secondary antibody reactions are followed by FJC staining procedures (protocol 1 in this study, as described below). However, the pretreatments for FJC staining, especially KMnO4 treatment, are harsh to fluorophores, and fluorescence intensity is greatly reduced in double staining with FJC and FI.5,12,14 If the fluorescence intensity of FI is strong enough, it can be followed by FJC staining. However, the fluorescence intensity of FI depends on several factors, such as the amount of antigen and quality of primary antibodies, and it is not always strong. In that situation, double staining with FJC and FI does not work well. 14
In this study, we optimized the double staining with FJC and FI by introducing the labeled streptavidin–biotin (LSAB) system to overcome the signal reduction in FI through the FJC staining procedure. Using our improved protocol (protocol 2 in this study, as described below), we examined whether FJC could stain degenerating astrocytes and oligodendrocytes in the model mice that contained injured glial cells.
Materials and Methods
Animals
Male and female ICR mice were used. For adult brain analysis, mice older than 6 weeks were used. For embryonic brain analysis, timed pregnant females were used. The day when a vaginal plug was detected was designated as gestational day 0 (G0) and embryonic day 0 (E0). Mice were supplied by Japan SLC (Shizuoka, Japan). All experiments were performed in compliance with the Guidelines for Animal Experimentation of the Faculty of Medicine, Tottori University under the International Guiding Principles for Biomedical Research Involving Animals. All experiments were approved by the Animal Care and Use Committee of Tottori University (approval number 18-Y-45).
Animal Treatment
ENU Treatment
N-ethyl-N-nitrosourea (ENU; Sigma-Aldrich, St. Louis, MO) was injected into pregnant mice on G13 to induce apoptosis in embryonic brains, as described previously. 14 Briefly, ENU was dissolved at 1% concentration in ethanol/phosphate/citrate buffer 15 and injected intraperitoneally (IP) into pregnant mice at a dose of 25 mg/kg. Embryonic brains at E14 were fixed with a fixative as described below.
Acute Encephalopathy Model Mice
To analyze the astrocytes with clasmatodendrosis, acute encephalopathy (AE) model mice were prepared as previously described. 16 Briefly, lipopolysaccharide (LPS; Escherichia coli serotype O127:B8; Sigma-Aldrich) dissolved in phosphate buffered saline (PBS) was injected IP at a dose of 100 µg/kg into postnatal day 8 (P8) mice. Two hours after LPS injection, hyperthermia treatment was performed for 30 min to maintain the rectal temperature at >39C using an electric heater. The rectal temperature was monitored using a rectal probe (RET-4; Physitemp Instruments, Clifton, NJ) connected to a multipurpose thermometer (BAT-10; Physitemp Instruments). Six hours after hyperthermia treatment, mice were perfused as described below.
6-Aminonicotinamide Treatment
To induce the degeneration of glial cells in adult mice, 6-aminonicotinamide (6-AN; Sigma-Aldrich) treatment was performed. 17 6-AN was dissolved in PBS at a concentration of 1 mg/ml and injected IP at a dose of 10 mg/kg. After 2, 3, or 5 days of 6-AN injection, mice were perfused as described below.
Tissue Preparation
Adult and P8 mice were euthanized by pentobarbital (200 mg/kg, IP) and transcardially perfused with PBS, followed by 4% paraformaldehyde in PBS (4% PFA). Brains were removed and postfixed with 4% PFA overnight. Pregnant mice at G14 were euthanized by cervical dislocation, and embryonic brains were immersed in 4% PFA overnight. Fixed brains were cryoprotected with 20% sucrose in PBS, embedded in Super Cryo Mount (Muto Pure Chemicals; Tokyo, Japan), snap-frozen on dry ice, and cut using a cryostat. Adult and P8 brains were cut into 30-µm-thick free-floating sections. Embryonic brains were cut into 12-µm-thick sections and attached to gelatin-coated glass slides.
Standard Fluorescent Immunostaining
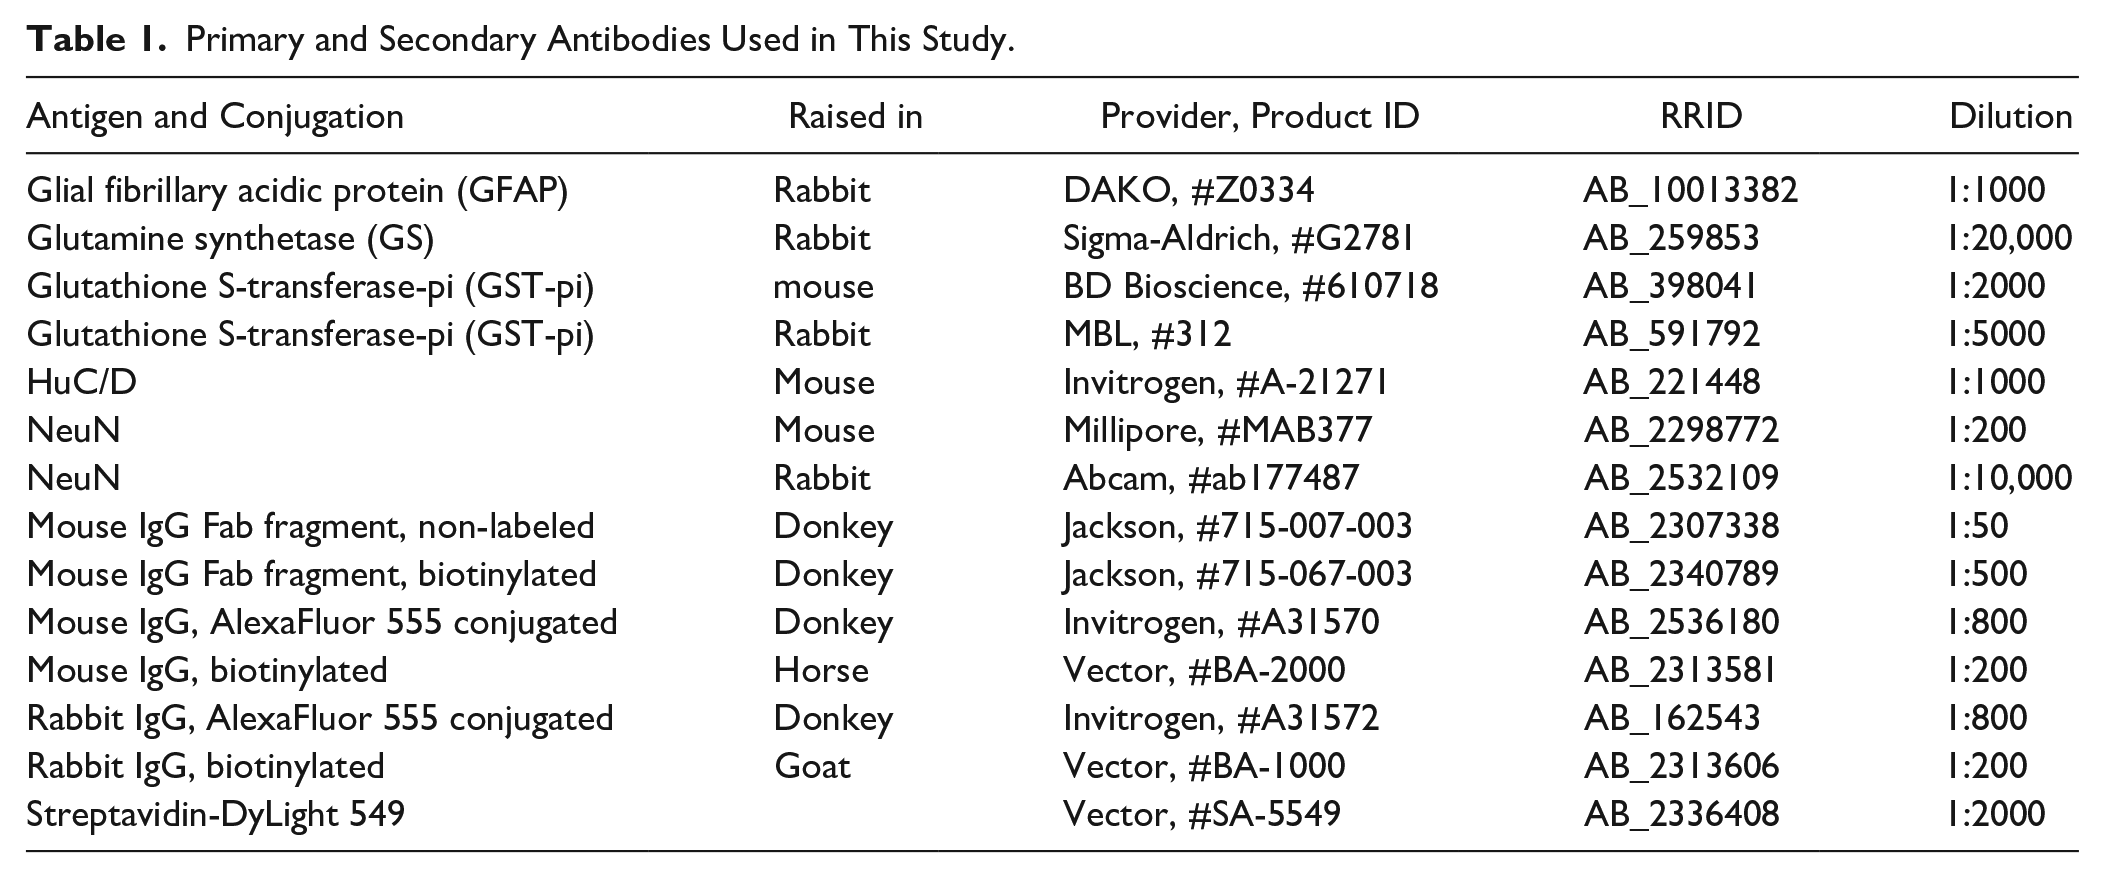
Primary and species-specific secondary antibodies labeled with AlexaFluor 555 [for indirect fluorescent immunostaining (IDFI)] or biotin (for LSAB) (Table 1) were diluted with B-PBST (1% BSA and 0.3% Triton X-100 in PBS). For the analysis of adult brains, free-floating sections were incubated overnight with primary antibodies, with secondary antibodies for 2 hr at 4C, and then attached on gelatin-coated glass slides. For the analysis of P8 brains, free-floating sections were attached on gelatin-coated glass slides, and they were incubated with primary and secondary antibodies as described above. For the analysis of embryonic brains with the anti-HuC/D primary antibody (a mouse-raised antibody), sections were treated with the donkey anti-mouse IgG Fab fragment (non-labeled; Table 1) diluted with 5% normal donkey serum (NDS)/PBST (0.3% Triton X-100/PBS) for 2 hr at 4C to block the nonspecific binding of anti-mouse secondary antibody to the embryonic brain sections. Then, the embryonic brain sections were incubated overnight with the anti-HuC/D antibody and with the AlexaFluor 555–conjugated donkey anti-mouse IgG (for IDFI) or with the biotinylated donkey anti-mouse IgG Fab fragment (for LSAB) diluted with 5% NDS/PBST for 2 hr at 4C. To detect biotin-labeled secondary antibodies, streptavidin-DyLight 549 (Table 1) diluted with 0.9% NaCl (saline) was used. All the washings were performed with saline. In the standard IDFI or LSAB, sections were coverslipped with aqueous mounting medium containing 0.2% n-propyl gallate, 50% glycerol, and 5 µg/ml Hoechst 33258/PBS. In some cases, sections were coverslipped with non-aqueous mounting medium: stained sections were dried at 50C for 5 min, cleared with xylene for 1 min, and coverslipped with non-aqueous mounting medium (PARA mount; Falma, Tokyo, Japan).
Primary and Secondary Antibodies Used in This Study.
Double Staining With FJC and FI
Protocol 1
Tissue sections were reacted with 1 µg/ml of Hoechst 33258/PBS for 10 min and washed 3× for 10 min to visualize the nuclei. Then, they were reacted with a primary antibody and an AlexaFluor 555–labeled secondary antibody as described above. Then, they were treated with 0.06% KMnO4 for 5 min, rinsed with water for 1–2 min, incubated with 0.00002% FJC (Sigma-Aldrich)/0.1% acetic acid for 10 min, rinsed with water 3× for 1 min in each washing, dried at 50C for 5 min, cleared with xylene for 1 min, and coverslipped with PARA mount.
Protocol 2
Tissue sections were reacted with 1 µg/ml of Hoechst 33258/PBS for 10 min and washed 3× for 10 min to visualize the nuclei. Then, they were reacted with a primary antibody and a biotinylated secondary antibody as described above. Then, they were treated with 0.06% KMnO4 for 5 min, washed 3× with saline for 10 min, incubated with streptavidin-DyLight 549/saline for 2 hr at room temperature, and washed with saline 3× for 10 min. They were incubated with 0.00002% FJC/0.1% acetic acid for 10 min, rinsed with water 3× for 1 min in each washing, dried at 50C for 5 min, cleared with xylene for 1 min, and coverslipped with PARA mount.
Analysis of Fluorescence Intensity
The sections of E14 embryos were stained with the anti-HuC/D antibody as described above. Every 10th section was collected, and three sections were analyzed per animal. The sections were processed side-by-side using protocols 1 and 2 and standard FIs (IDFI or LSAB). The images were analyzed to compare the fluorescence intensities. Black-and-white images with 16-bit depth were acquired using an epi-fluorescent microscope (with a ×20 objective lens, Eclipse 80i; Nikon, Tokyo, Japan) equipped with a digital camera (Wraycam SR130M; Wraymer Microscope, Osaka, Japan). To detect red signals of AlexaFluor 555 and DyLight 549, a long-pass emission filter (G-2A; Nikon) was used. Exposure time was adjusted to cover all the fluorescence intensities within the dynamic range of the digital camera. The images were acquired using the same exposure time to compare the fluorescence intensities between each staining condition.
A vertical column from the pial surface to the lateral ventricle was set with an arbitrary width on both sides of the parietal cortex as a region of interest (ROI). The mean fluorescence intensity of ROI was measured using ImageJ software (https://imagej.nih.gov/ij/). Three or four animals were analyzed in each group. Error bars indicated the standard deviation. Statistical analysis was performed using R software (https://www.r-project.org/). The significance level was set at p<0.05.
Image Acquisition and Processing
Confocal microscopy images were acquired using an LSM 780 with 40× and 63× objective lenses (Carl Zeiss, Oberkochen, Germany). To clearly show the fluorescent signals, the brightness and contrast were adjusted in some figures using ImageJ. The brightness and contrast were adjusted by the same degree in the signal intensity comparison panels.
Results
Optimization of Double Staining With FJC and FI
In the FJC staining procedure, there are three critical steps that lead to a loss of the fluorescence intensity of FI: KMnO4 treatment, acetic acid treatment (the vehicle of FJC), and xylene treatment. Xylene treatment for coverslipping with non-aqueous mounting medium is necessary because the FJC signal does not bind to sections firmly in aqueous mounting medium (data not shown). To avoid a reduction in fluorescence intensity through the oxidization with KMnO4, we introduced the LSAB system. Namely, a biotinylated secondary antibody was used to detect the primary antibody, followed by KMnO4 treatment and incubation with a fluorophore-conjugated streptavidin (protocol 2).
As we previously reported, apoptosis could be induced by injecting ENU at E14 embryonic brains, and it was difficult to acquire clear images of double staining with FJC and HuC/D, a marker of postmitotic neurons. 14 First, we analyzed how much the fluorescence intensity had been reduced during the FJC staining procedure in protocol 1 (the standard protocol provided by the manufacturer) and protocol 2. To normalize the fluorescence intensities, we divided the values by that of standard IDFI (protocol 1, Fig. 1) or standard LSAB (protocol 2, Fig. 2) as benchmarks. Clearing of sections with xylene and coverslipping with non-aqueous mounting medium after standard IDFI and standard LSAB greatly reduced the signal intensity to about 40% (Figs. 1 and 2). The final signal intensity was reduced to about 10% with protocol 1 (Fig. 1), but it was reduced to about 15% with protocol 2 (Fig. 2). These results indicated that both KMnO4 treatment and coverslipping with non-aqueous mounting medium were harsh to fluorophores. Although KMnO4 treatment reduced binding of biotin and streptavidin, fluorescence intensity was improved with protocol 2.
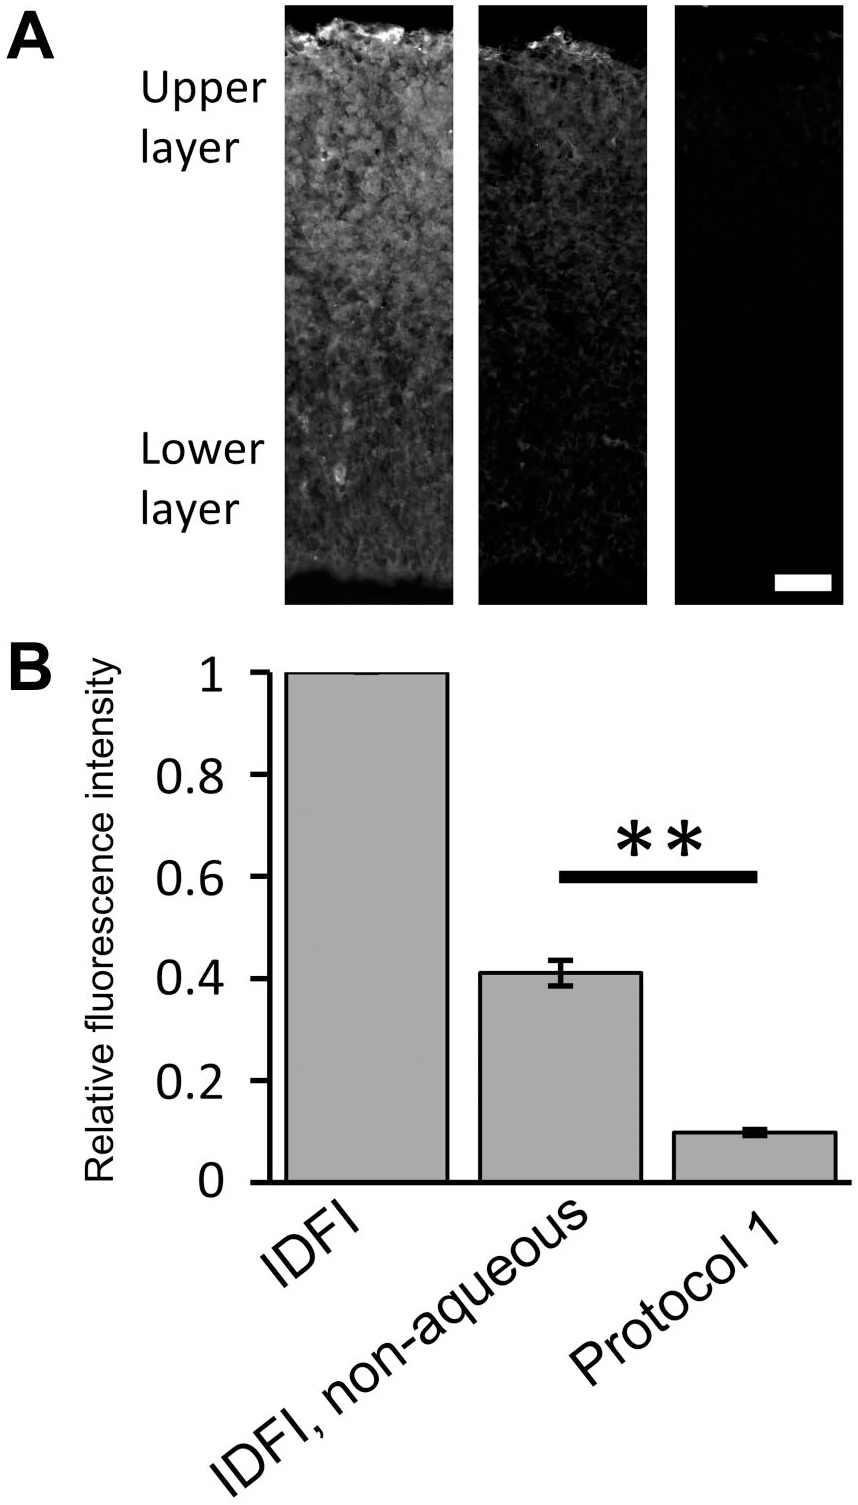
Reduction in signal intensity of fluorescent immunostaining in the standard IDFI through xylene and protocol 1 (including KMnO4 and xylene treatments). (A) The anti-HuC/D antibody labeled the upper layer of the E14 cortex where differentiated neurons are located. Clearing of sections with xylene and coverslipping with non-aqueous mounting medium greatly reduced the fluorescence intensity (IDFI, non-aqueous), and a greater reduction was apparent with protocol 1. To visualize the outline of measured areas, the brightness and contrast were adjusted by the same degree for all epi-fluorescent microscopy images. (B) The mean intensities were normalized with the standard IDFI signal. Student’s t-test was performed. n=three embryos. Abbreviation: IDFI, indirect fluorescent immunostaining. **p<0.01. Scale bar = 40 µm.
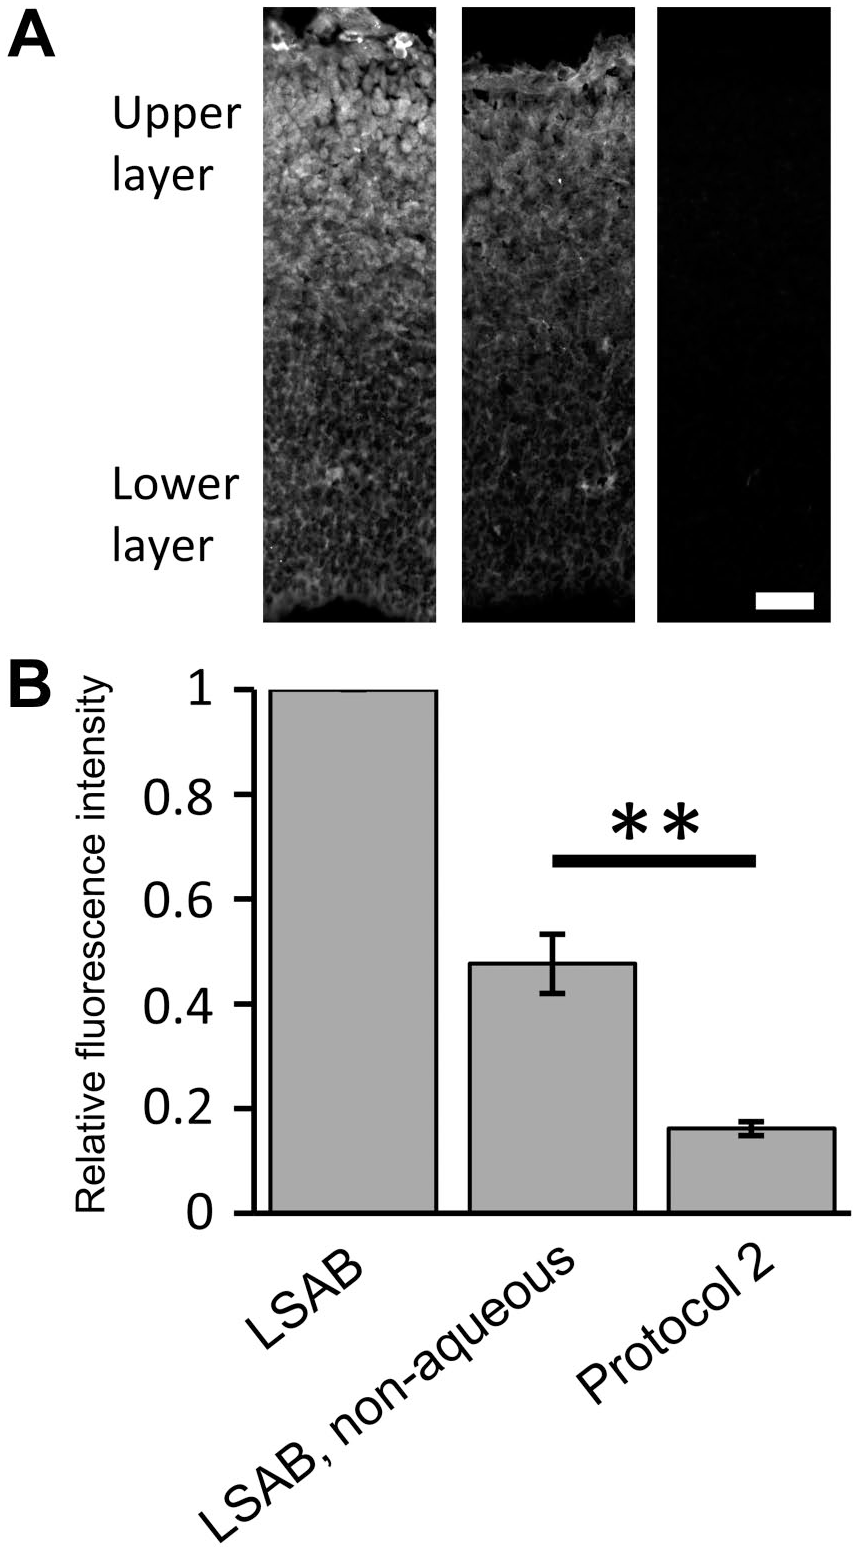
Reduction in signal intensity of fluorescent immunostaining in the standard LSAB system through xylene and protocol 2 (including KMnO4 and xylene treatments). (A) The anti-HuC/D antibody labeled the upper layer of the E14 cortex. Again, coverslipping with non-aqueous mounting medium greatly reduced the fluorescence intensity (LSAB, non-aqueous), and a greater reduction was apparent with protocol 2. To visualize the outline of measured areas, the brightness and contrast were adjusted by the same degree for all epi-fluorescent microscopy images. (B) The mean intensities were normalized with the standard LSAB signal. Student’s t-test was performed. n=three embryos. **p<0.01. Abbreviation: LSAB, labeled streptavidin–biotin. Scale bar = 40 µm.
Next, we directly compared the signal intensities between protocol 1 and protocol 2. First, we confirmed the signal amplification effect of the LSAB system.18,19 The LSAB system gave rise to a stronger signal than the IDFI (Fig. 3A). The signal intensity of FI in protocol 2 was significantly higher than in protocol 1 (Fig. 3B). These results indicated that double staining with FJC and FI was improved using protocol 2.
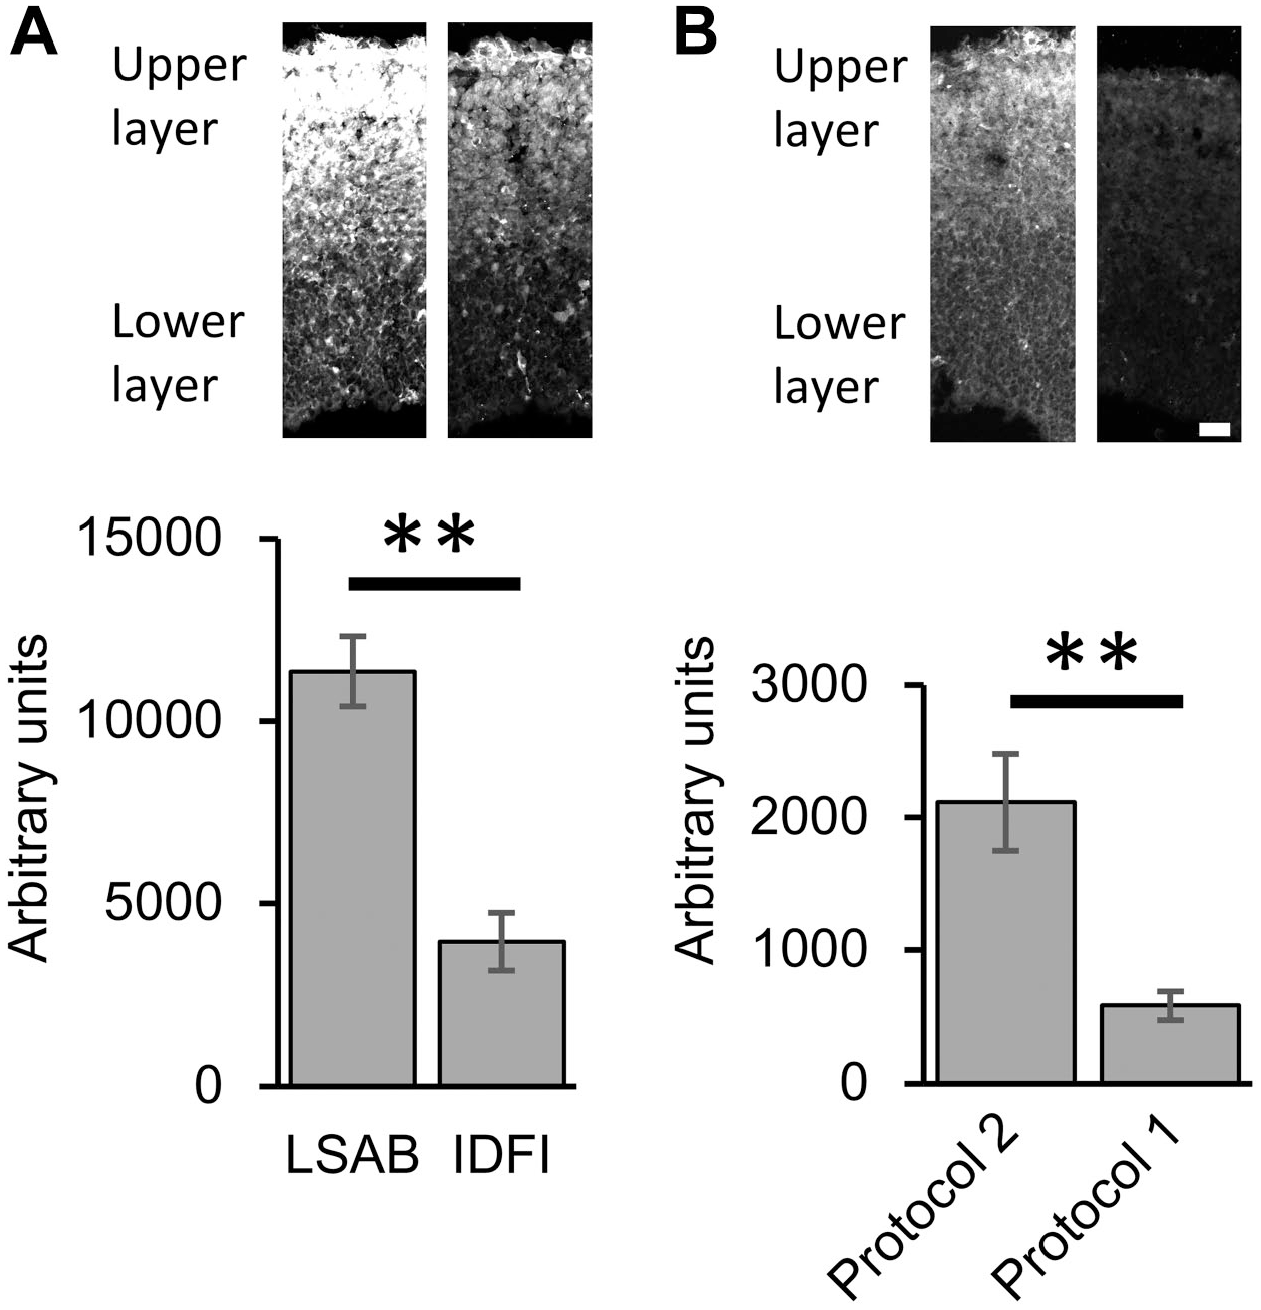
Improved fluorescence intensity in protocol 2. The anti-HuC/D antibody labeled the upper layer of the E14 cortex. The mean signal intensities were directly compared between the standard IDFI and LSAB to confirm the signal amplification effect (A) and between protocol 1 and protocol 2 to confirm improvement in signal intensity of FI (B). To visualize the outline of the measured areas, the brightness and contrast were enhanced by the same degree in each pair of epi-fluorescent microscopy images. Student’s t-test was performed. n=four embryos in each group. **p<0.01. Abbreviations: IDFI, indirect fluorescent immunostaining; LSAB, labeled streptavidin–biotin. Scale bar = 40 µm.
Finally, we performed double staining with FJC and FI using the anti-HuC/D antibody on ENU-treated embryonic brain sections. In our previous study, the HuC/D signal was almost completely bleached with protocol 1 (Fig. 4A), 14 but the result was greatly improved with protocol 2 (Fig. 4B).
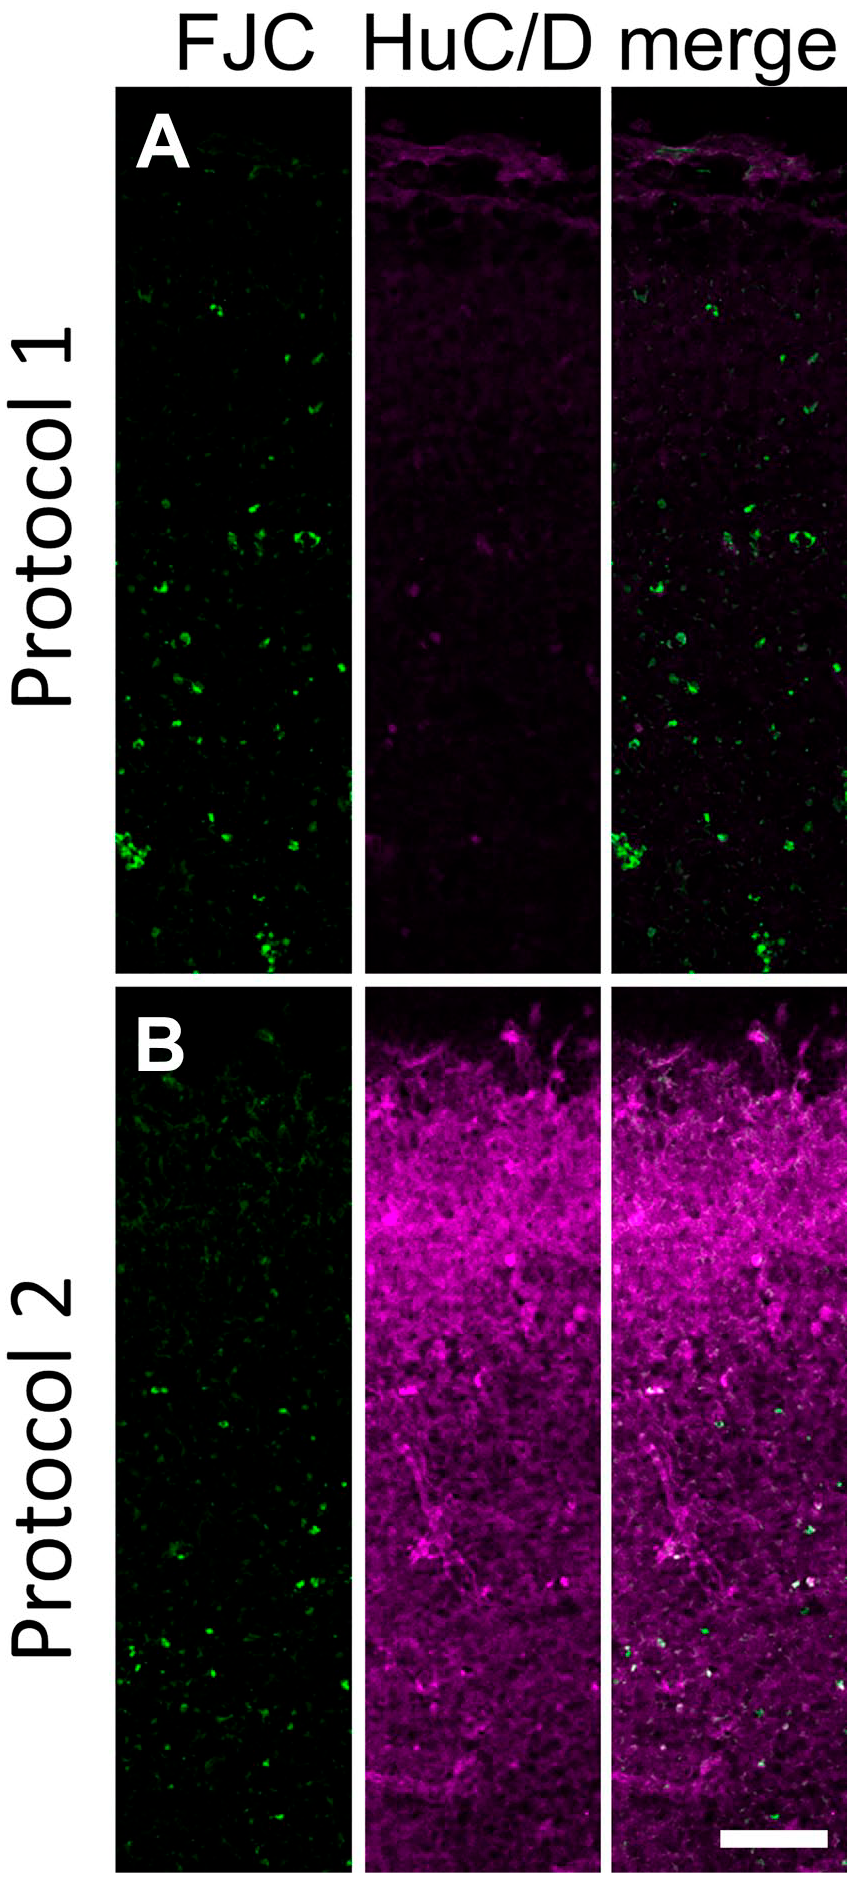
Confocal microscopy images of an ENU-treated E14 embryo processed with protocol 1 (A) and protocol 2 (B) using the anti-HuC/D antibody. FJC signal and HuC/D signal are represented in green and magenta, respectively. Images were acquired using the same laser settings and image processing values. To visualize the HuC/D signal, the brightness and contrast were enhanced by the same degree in the upper and lower panels. Abbreviations: ENU, N-ethyl-N-nitrosourea; FJC, Fluoro-Jade C. Scale bar = 50 µm.
Labeling of Degenerating Glial Cells With FJC
It is claimed that FJC staining can specifically detect degenerating neurons. 5 To test the specificity of FJC staining, we applied protocol 2 on tissue sections containing degenerating glial cells.
First, we tested whether degenerating astrocytes with clasmatodendrosis, an irreversible morphological change of damaged astrocytes,20–23 in the AE model mice were FJC(+). 16 There were no FJC(+) cells in the control brain (Fig. 5A). In contrast, there were two types of FJC(+) cells in the AE model mice: large cells with processes (Fig. 5C, double arrowheads) and small cells without processes (Fig. 5C, arrowheads). The signal intensity of glial fibrillary acidic protein (GFAP), a marker of astrocytes, in the cortical gray matter was much weaker than in the cortical white matter, and the GFAP signal in the cortical gray matter was difficult to observe with protocol 1 (data not shown). In contrast, the GFAP signal in the cortical gray matter was dramatically improved with protocol 2. In the control brain, thick processes of GFAP(+) astrocytes were clearly visualized (Fig. 5D). In the AE model mice, some astrocytes with clasmatodendrosis, but not all degenerating astrocytes, became FJC(+) (Fig. 5E and F, arrows). To confirm this result, we used the anti–glutamine synthetase (GS) antibody, another marker of astrocytes. It was easy to detect astrocytes using anti-GS antibody due to labeling of the cell body with a strong fluorescent signal. In the AE model mice, GS(+)/FJC(+) damaged astrocytes with pyknotic nuclei were detected with protocol 2 (Fig. 5G, arrows). It is notable that processes of degenerating astrocytes were not stained by FJC (Fig. 5E–G).
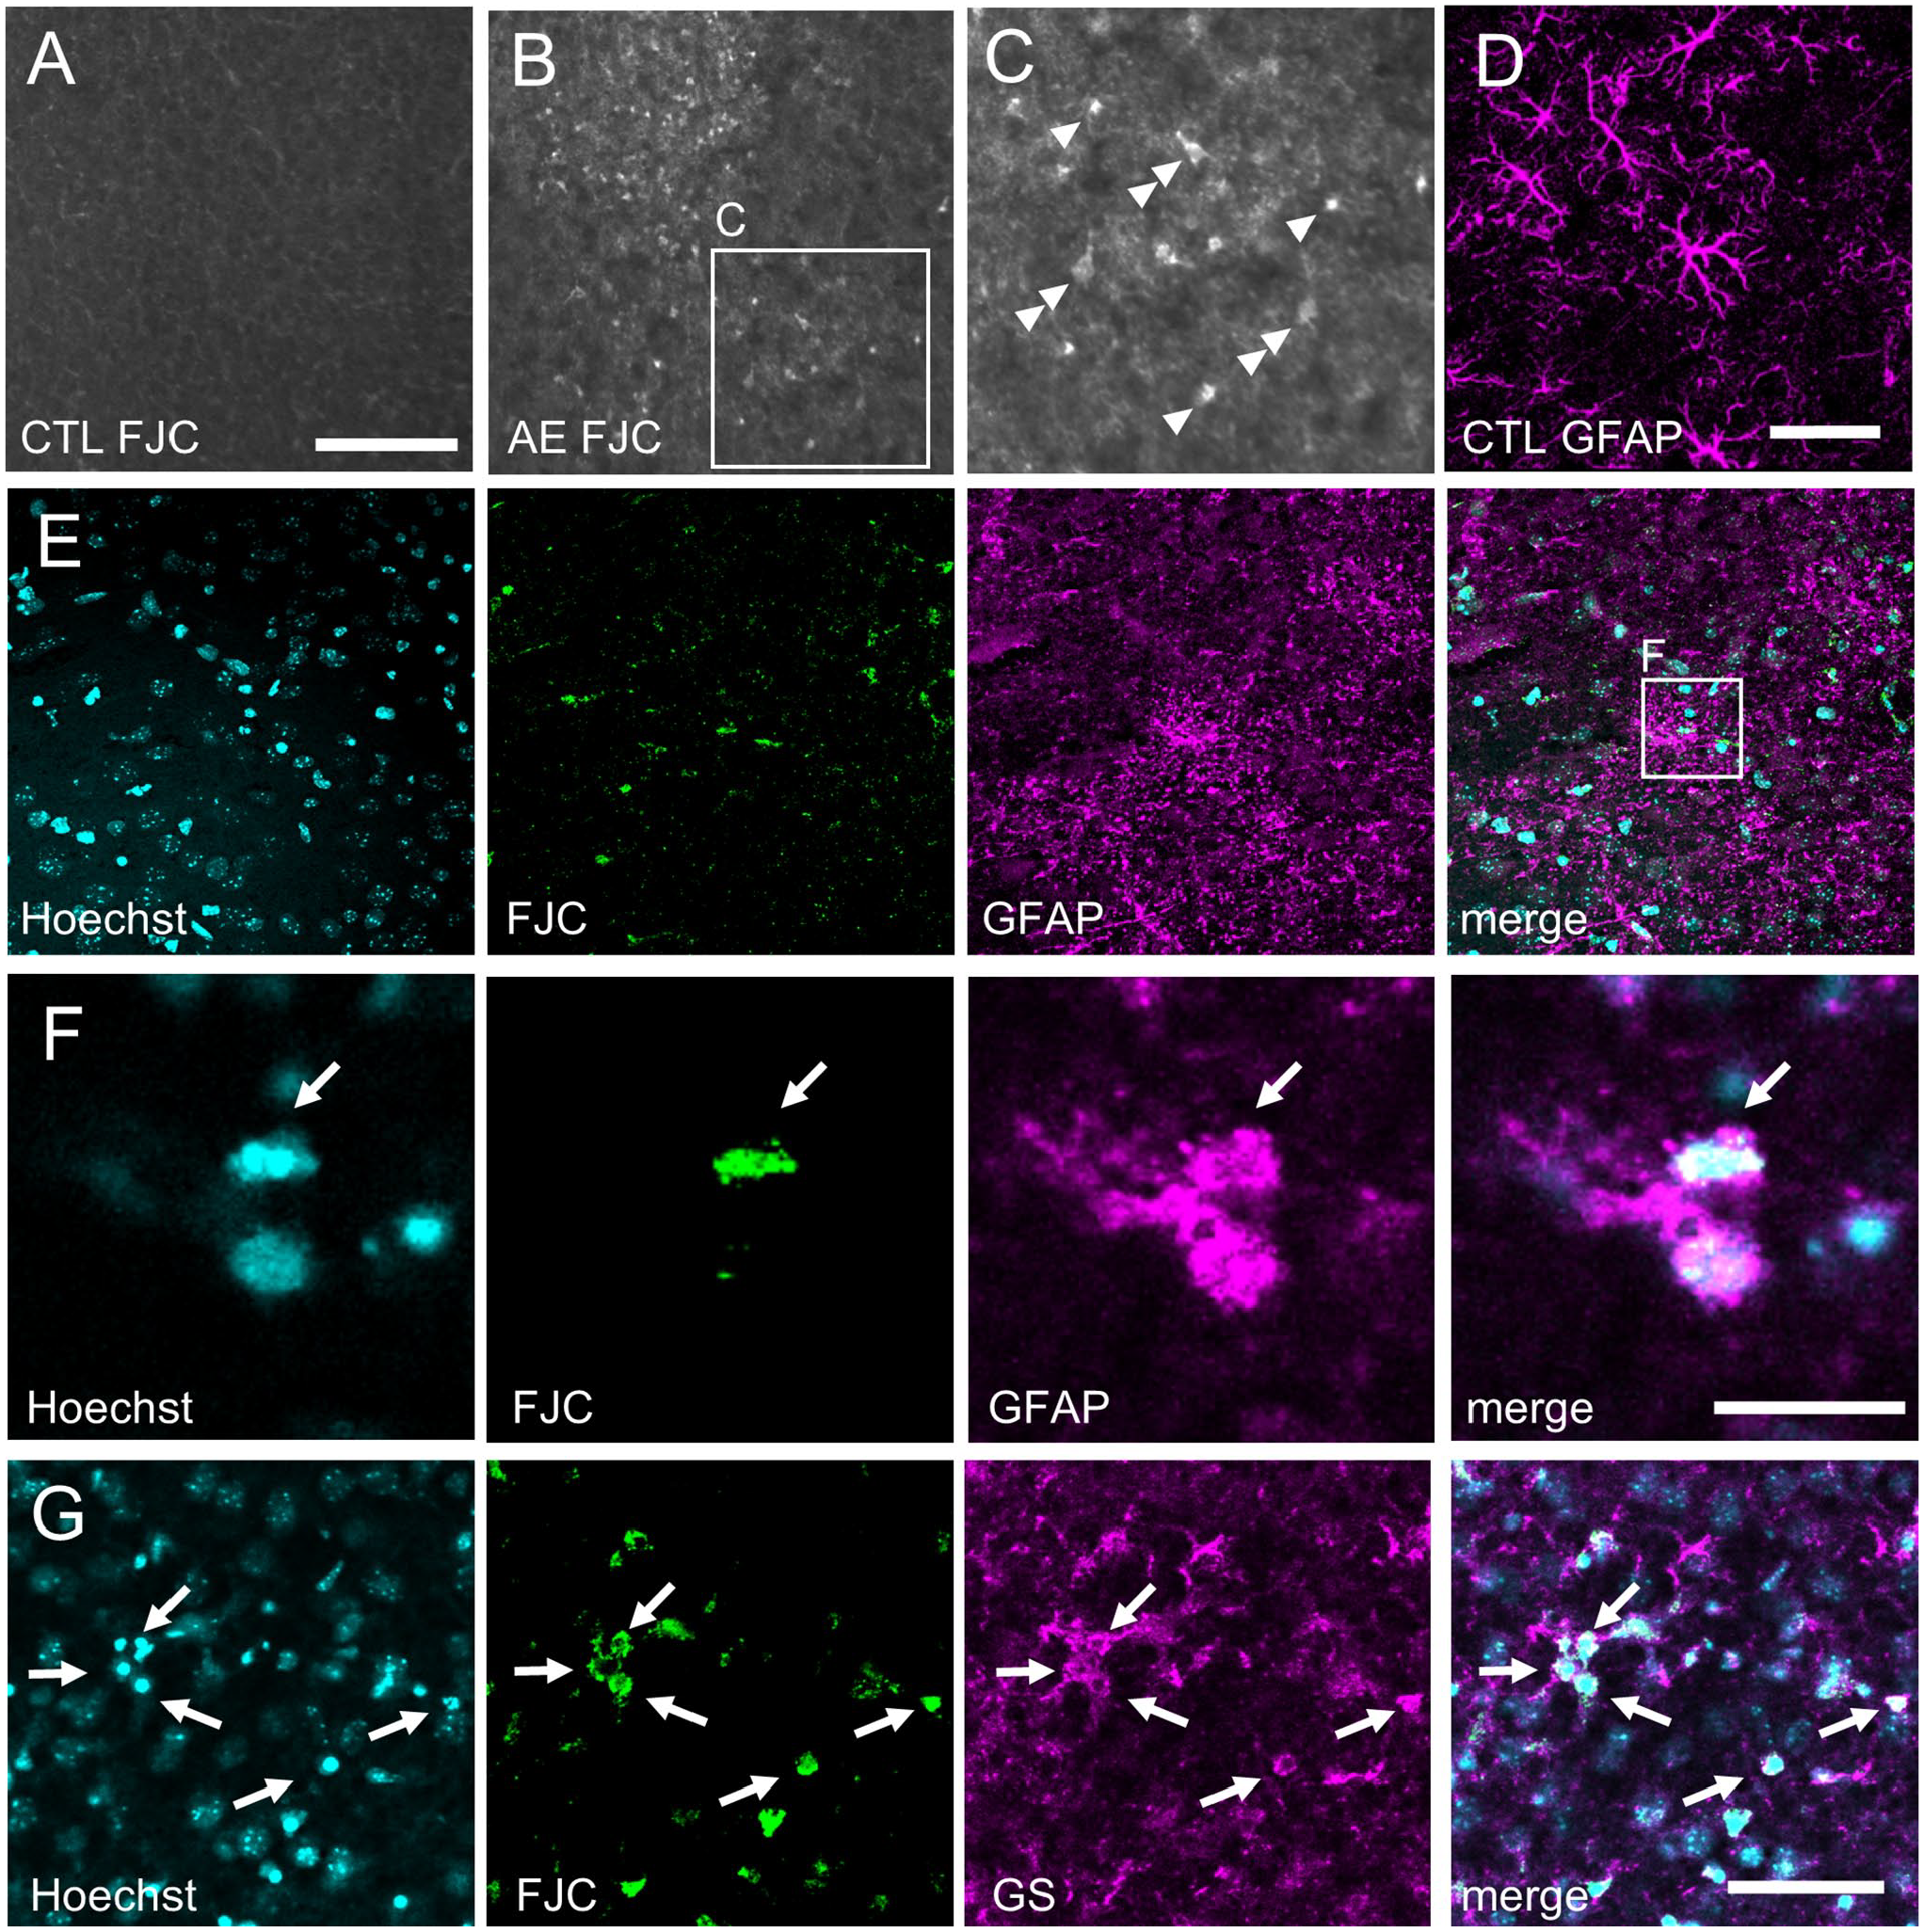
Damaged astrocytes in the AE model mice were detected with protocol 2. (A) There were no FJC(+) cells in the cerebral cortex of the control mice. (B) In contrast, there were many FJC(+) cells in the cerebral cortex of the AE model mice. (C) A high magnification image of the boxed area in (B). There were two types of FJC(+) cells: large cells with processes (double arrowheads) and small cells without processes (arrowheads). Epi-fluorescence microscopy images are shown (A–C). (D) A stacked confocal microscopy image (constructed from 23 slices, total 8.52 µm thickness) showing normal morphology of GFAP(+) astrocytes in the control cerebral cortex. (E) Stacked confocal microscopy images (constructed from 19 slices, total 9.01 µm thickness) under low magnification showing astrocytes with clasmatodendrosis. Note that GFAP(+) processes were destroyed and scattered. (F) High magnification images in the boxed area in (E). Single optical confocal microscopy images are shown. A damaged GFAP(+) astrocyte with a pyknotic nucleus was FJC(+) (arrows). (G) Glutamine synthetase (GS), another marker of astrocytes, labeled the cell body, and it was easy to detect astrocytes. Abbreviations: FJC, Fluoro-Jade C; GFAP, glial fibrillary acidic protein; AE, acute encephalopathy. Scale bars = 100 and 50 µm in A for A–B and C, respectively; scale bar = 50 µm in D for D and E; scale bar = 20 µm in F; scale bar = 50 µm in G.
Furthermore, to confirm FJC staining on degenerating glial cells, we used another model mouse. Injection with 6-AN induces necrosis of astrocytes and oligodendrocytes in the brain stem of adult mice, 17 followed by apoptosis in neurons caused by oxidation stress (Fig. 6A–H). 24 Again, there were no FJC(+) cells in the control brain (Figs. 6A and 8A–B), As reported previously, 2 days after 6-AN injection into adult mice, massive death of glial cells (Fig. 6B, white arrows) was induced in the vestibular nucleus (Fig. 6B and E–H), and hemorrhage was detected (Fig. 6B, asterisks). Moreover, 2 days after 6-AN injection, most neurons looked normal [Fig. 6B (black arrows), I, and J]. But a few NeuN(+) neurons began to die, and NeuN(+)/FJC(+) mature neurons were also detected by protocol 2 (data not shown). 24 From 3 days after 6-AN injection, FJC(+) cells with processes became noticeable (Fig. 6C, double arrowhead). The number of FJC(+) cells increased with time, and there were more FJC(+) cells in the vestibular nucleus at 5 days than 2 days after 6-AN injection (Fig. 6B–D). Five days after 6-AN injection, the vestibular nucleus became spongiform (Fig. 6D) and contained less glial cells (Fig. 7A–D).
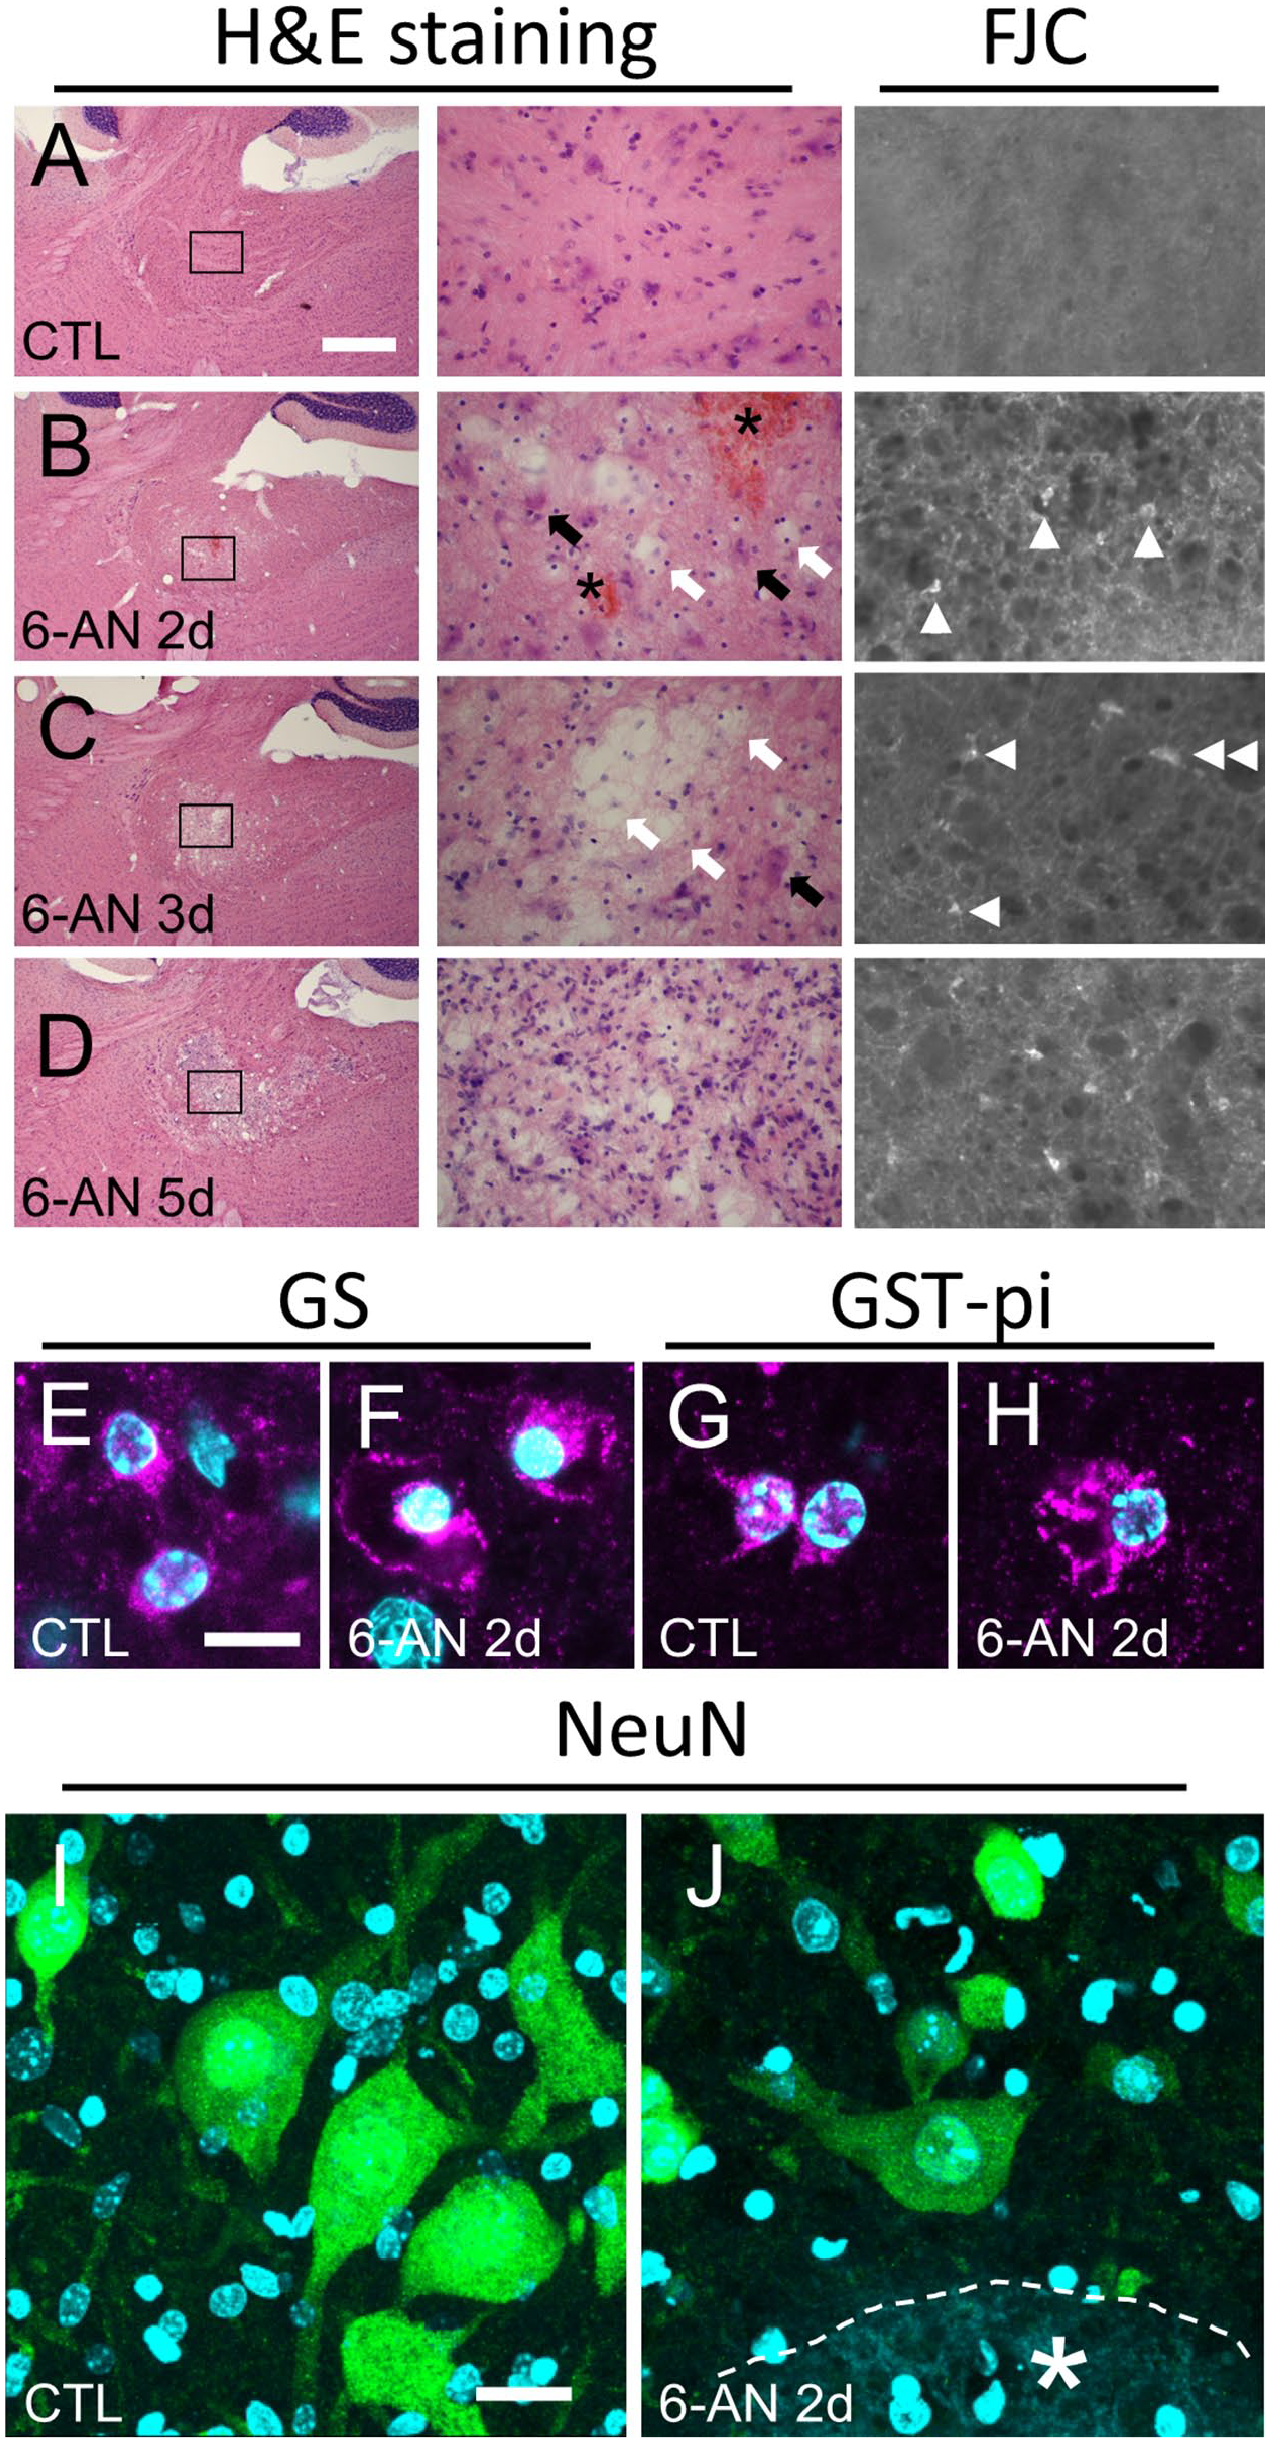
Glial degeneration in the vestibular nucleus of the 6-AN-injected mice was evident. (A) In the control brain, there were no FJC(+) cells. (B) Two days after 6-AN injection, some cells exhibited cellular edema (white arrows), but neurons with large nuclei (black arrows) looked normal. There were FJC(+) small cells without processes (arrowheads). Hemorrhage was also detected (asterisks). (C) Three days after 6-AN injection, more cells exhibited cellular edema (white arrows), but some neurons still remained (black arrow). There were two types of FJC(+) cells: small cells without processes (arrowheads) and large cells with processes (double arrowhead). (D) Five days after 6-AN injection, the vestibular nucleus became spongiform. Hematoxylin and eosin (H&E) staining and epi-fluorescent microscopy images of sagittal sections are shown. In the control mice, astrocytes (E) and oligodendrocytes (G) had small cell bodies. Cellular edema and vacuolation in GS(+) astrocytes (F) and GST-pi(+) oligodendrocytes (H) were evident 2 days after 6-AN injection. Single optical confocal microscopy images merged with Hoechst 33258 staining are shown. Stacked confocal microscopy images showing neurons with normal morphology in the control (I, constructed from 75 slices, total 26.87 µm) and 6-AN-injected (J, constructed from 46 slices, total 16.34 µm) mice. Most NeuN(+) neurons looked normal even close to the hemorrhage site (asterisk) 2 days after 6-AN injection. Scale bars = 500, 50, and 100 µm in A for low magnification images of H&E staining, high magnification images of H&E staining, and FJC staining, respectively; scale bar = 10 µm in E for E–H; scale bar = 20 µm in I for I and J. Abbreviations: FJC, Fluoro-Jade C; 6-AN, 6-aminonicotinamide; GST-pi, glutathione S-transferase-pi.
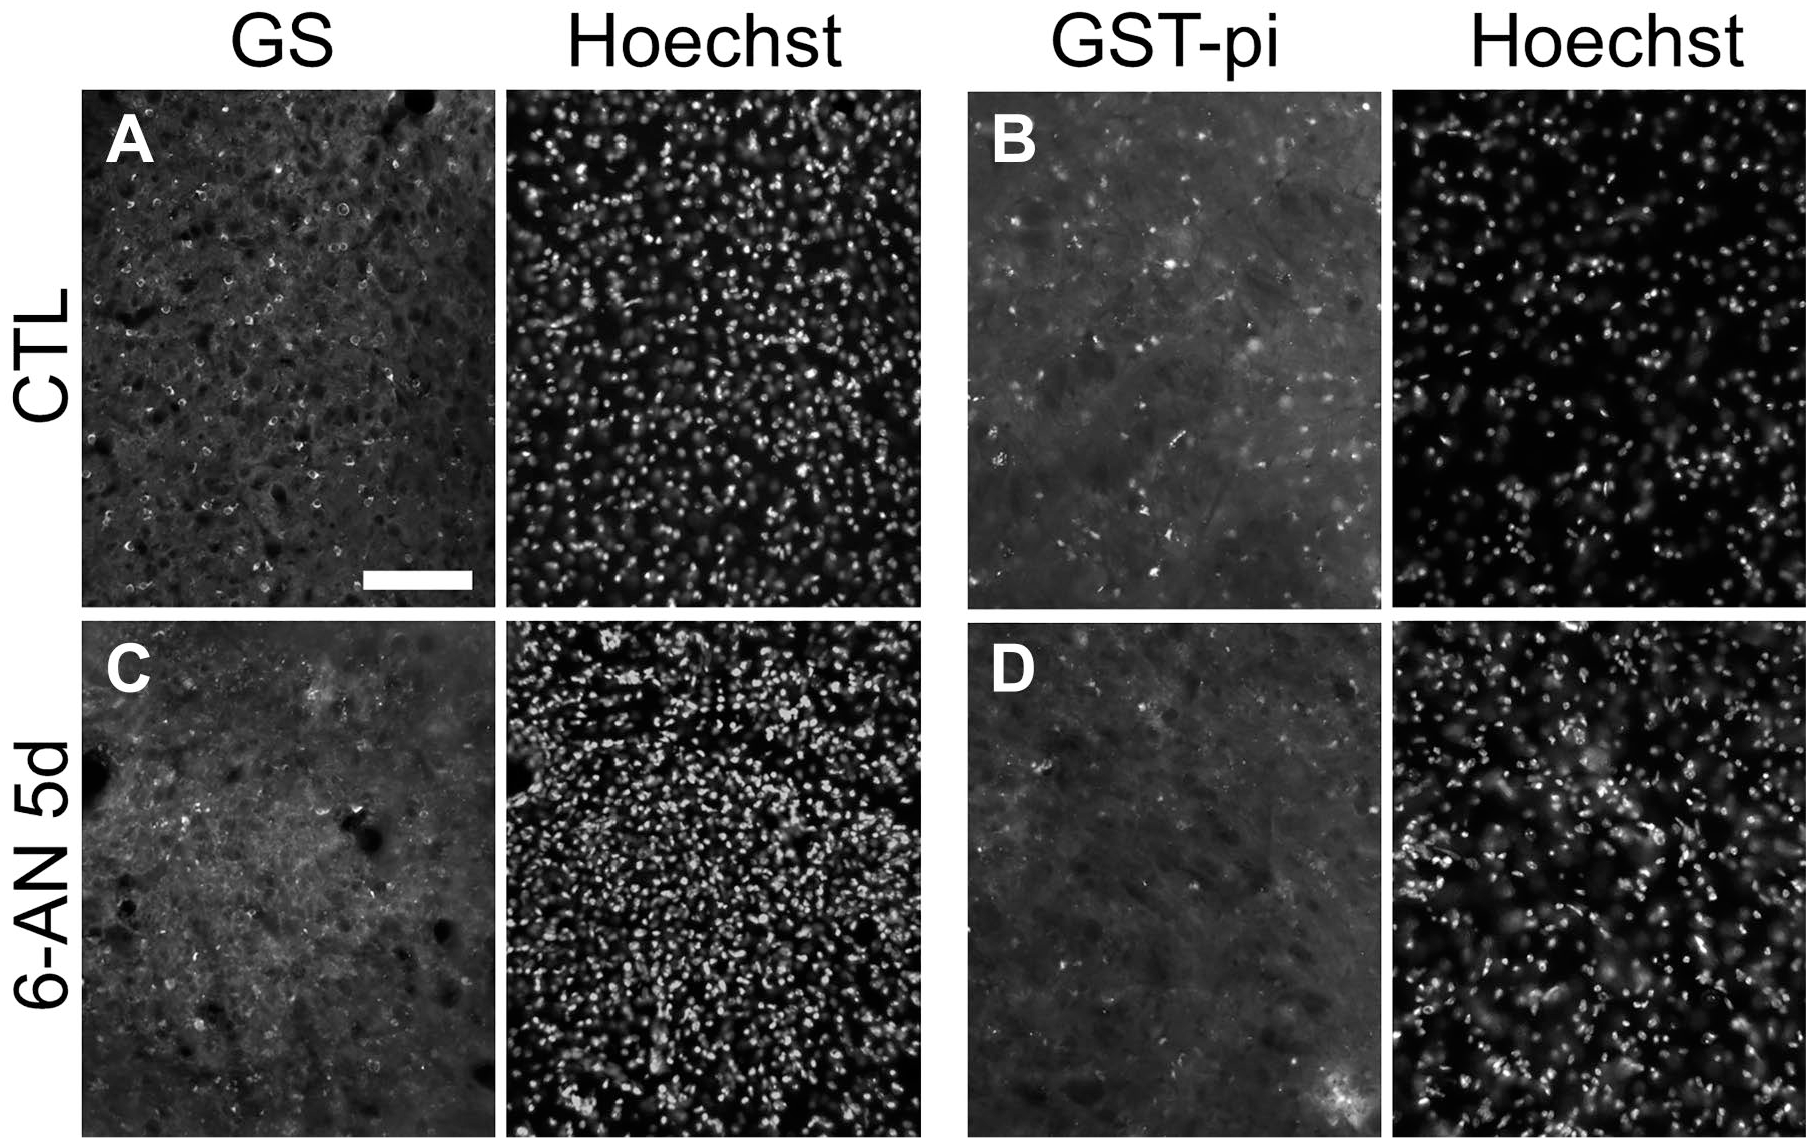
Smaller number of glial cells existed in the vestibular nuclei 5 days after 6-AN injection. Five days after 6-AN injection, there were less GS(+) astrocytes (C) and GST-pi(+) oligodendrocytes (D) in the 6-AN-injected mice than the control mice (A, B). Epi-fluorescent microscopy images of FI and Hoechst 33258 staining in the same regions are shown. Scale bar = 100 µm. Abbreviations: 6-AN, 6-aminonicotinamide; GST-pi, glutathione S-transferase-pi.
Two days after 6-AN injection, there were a few small FJC(+) cells without processes (Fig. 8C and D, arrowheads). Thick processes of normal astrocytes were visualized with the anti-GFAP antibody in the control mice (Fig. 8E, arrow), but some astrocytes exhibited clasmatodendrosis in the 6-AN-injected mice (Fig. 8F, arrow). At this stage, GS(+)/FJC(+) degenerating astrocytes and glutathione S-transferase (GST)-pi(+)/FJC(+) degenerating oligodendrocytes with pyknotic nuclei were detected with protocol 2 (Fig. 8G and H, arrows). Again, processes of degenerating glial cells were not stained by FJC.
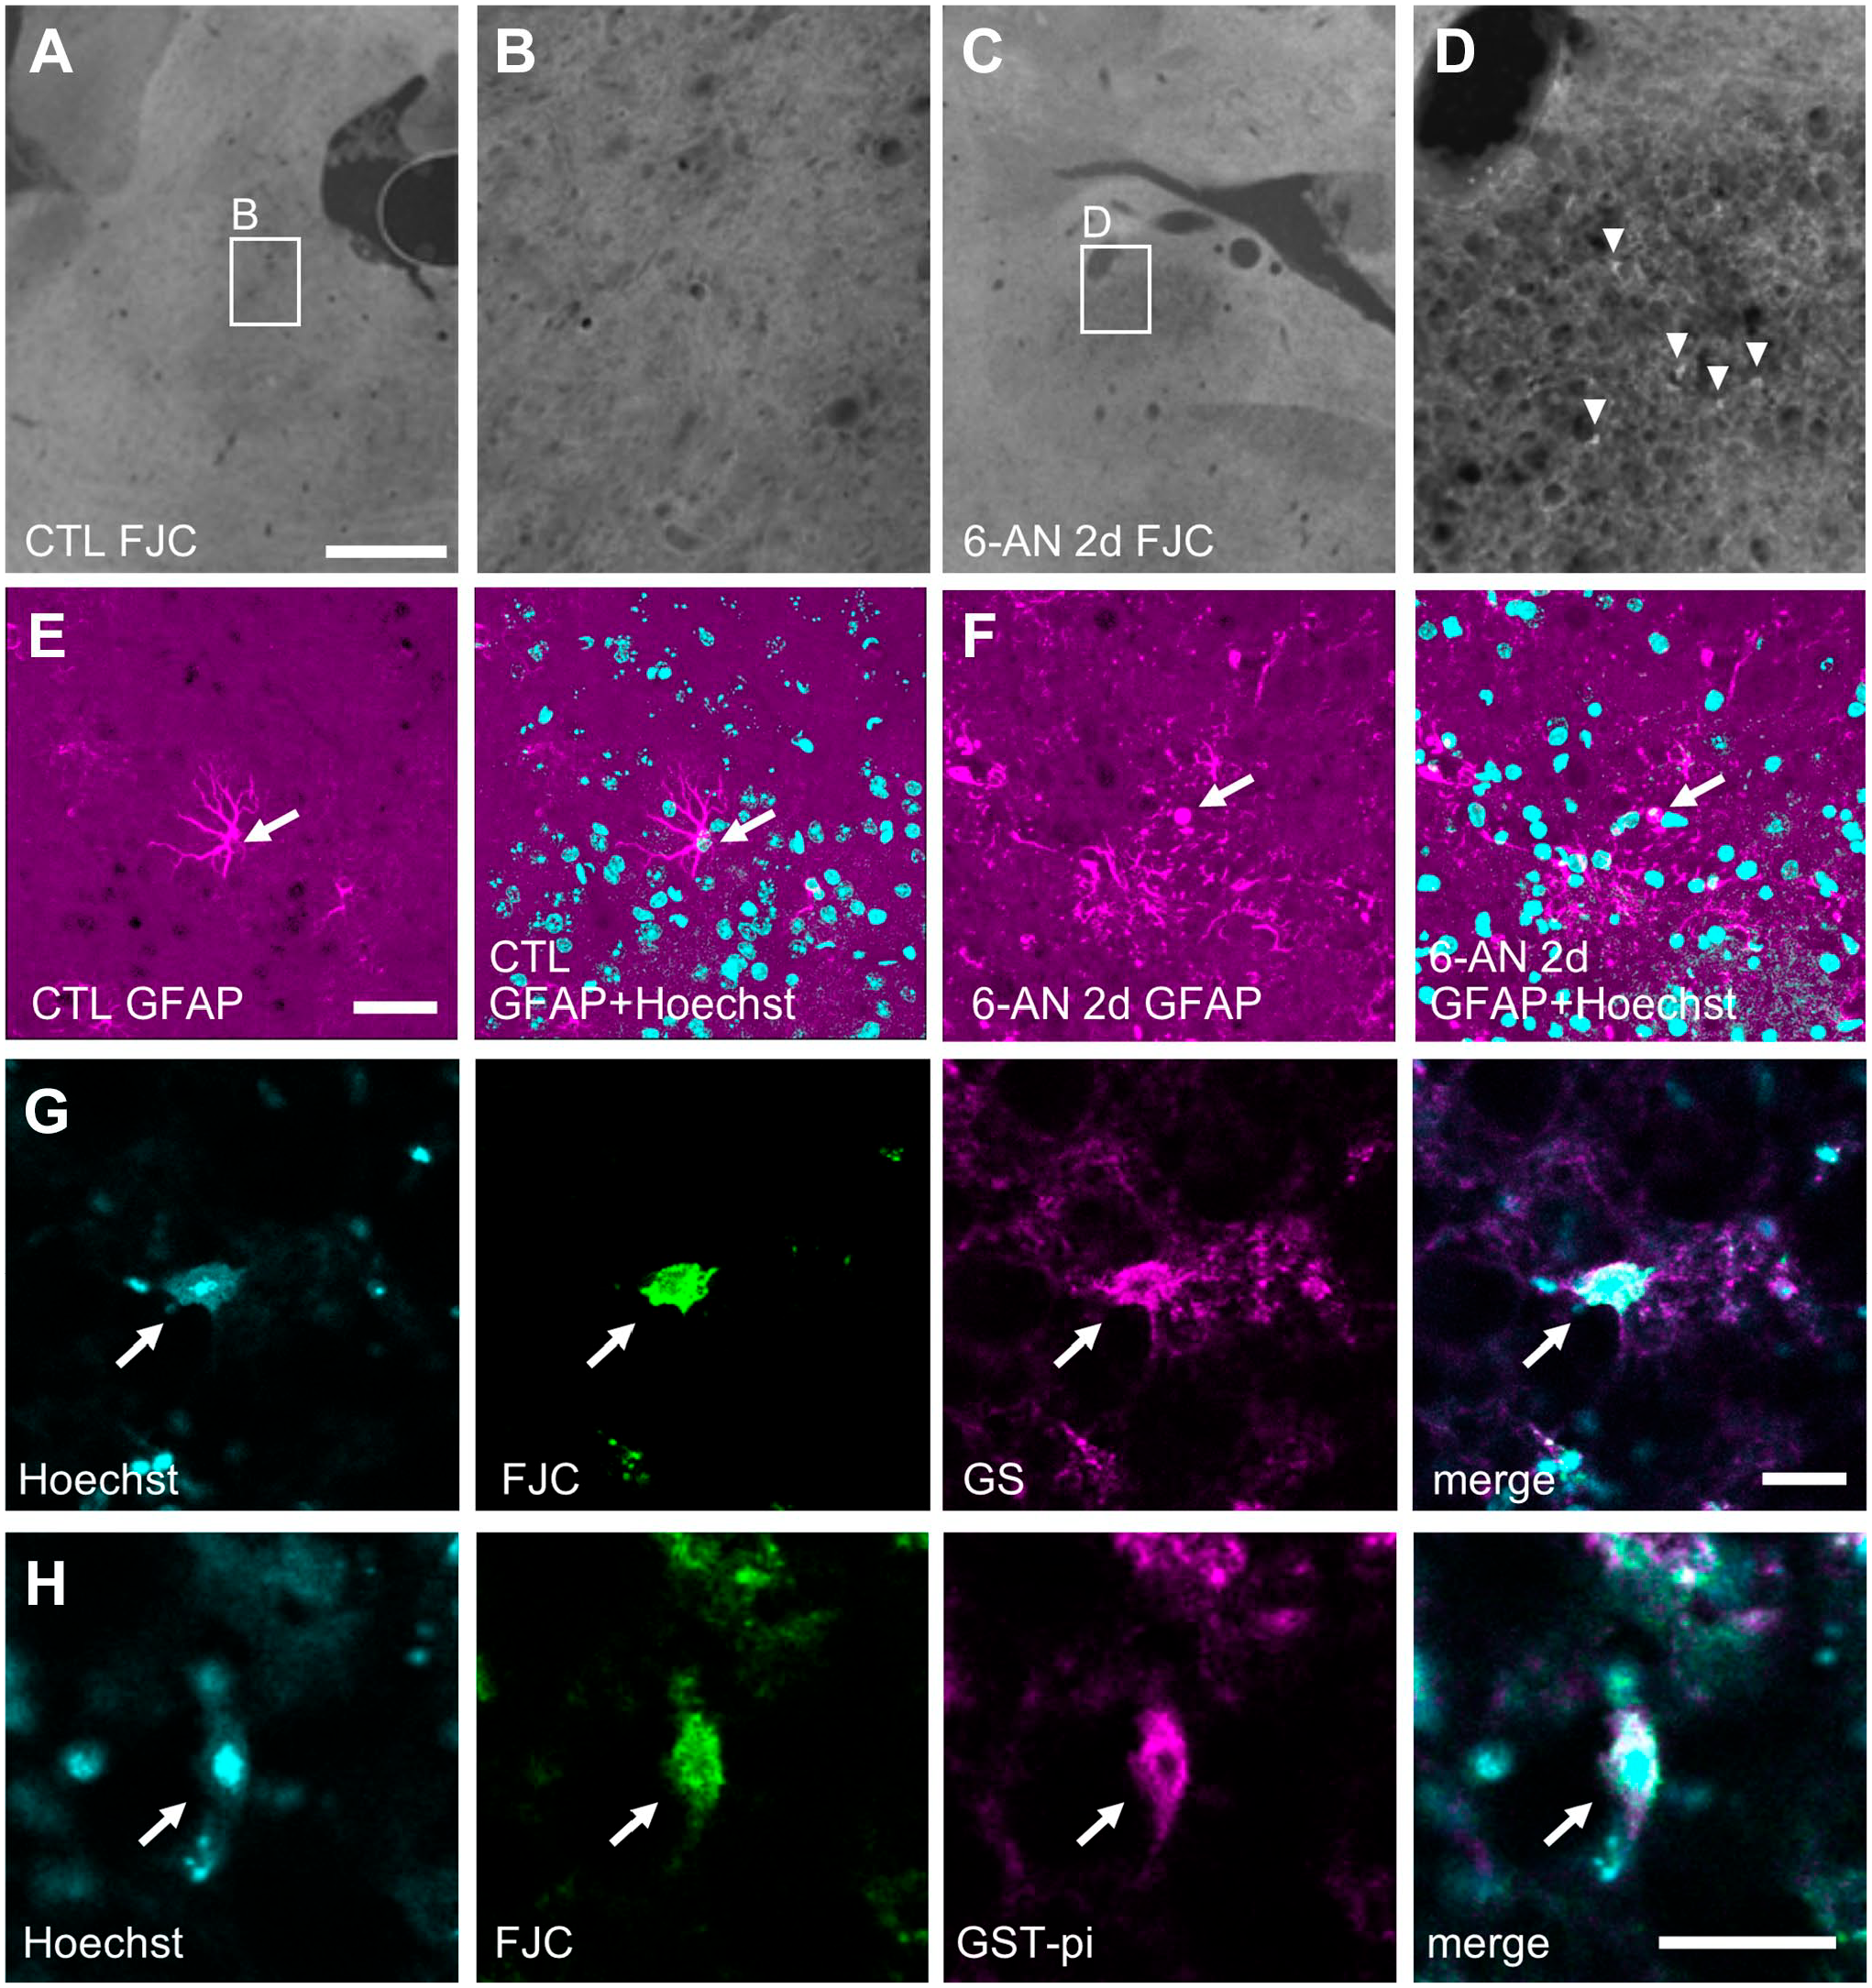
Damaged glial cells in the 6-AN-injected mice were detected with protocol 2. (A) There were no FJC(+) cells in the vestibular nucleus of the control mouse. (B) A high magnification image of the boxed area in (A). (C) There were a few FJC(+) cells in the vestibular nucleus 2 days after 6-AN injection. (D) A high magnification image of the boxed area in (C). Arrowheads indicate FJC(+) small cells without processes. Epi-fluorescence microscopy images of sagittal sections are shown (A–D). Stacked confocal microscopy images showing a normal astrocyte (E, constructed from 28 slices, total 10.46 µm) and an astrocyte with clasmatodendrosis (F, constructed from 23 slices, total 8.52 µm) in the control and 6-AN-injected mouse, respectively (arrows). A GS(+) astrocyte (G) and a GST-pi(+) oligodendrocyte (H) in the medial vestibular nucleus (arrows). Both cells had pyknotic nuclei. Single optical confocal microscopy images are shown. Abbreviations: FJC, Fluoro-Jade C; 6-AN, 6-aminonicotinamide; GFAP, glial fibrillary acidic protein; GST-pi, glutathione S-transferase-pi. Scale bars = 500 µm in A for A and C; scale bar = 100 µm in A for B and D; scale bar = 40 µm in E for E and F; scale bar = 20 µm in G and H.
Discussion
In this study, we improved the double staining protocol with FJC and FI by introducing the LSAB system. And our improved protocol (protocol 2) was applied to examine whether FJC could stain degenerating glial cells.
Improvement in Double Staining With FJC and FI
First, we adjusted the concentration of FJC. In the standard protocol, FJC is used at a concentration of 0.0001%. 5 At this concentration, the FJC signal was too strong, and the FJC signal in green leaked into the red channel when the sections were observed under an epi-fluorescent microscope with a long-pass emission filter (data not shown). Thus, the FJC concentration was reduced to 0.00002%.
Second, to overcome the signal reduction in FI through KMnO4 treatment, we introduced the LSAB system. KMnO4 treatment is necessary to reduce the background of FJC. KMnO4 treatment is not only harsh to fluorophores but can also diminish some antigenic epitopes. The manufacturer suggests that KMnO4 treatment should be shortened to prevent signal reduction in FI. In our results, 5-min incubation time was the shortest to keep a low background of FJC, and shorter than 5-min incubation time gave rise to a higher background (data not shown). Although streptavidin–biotin binding was also greatly diminished by KMnO4 treatment for 5 min, the signal intensity of FI with protocol 2 was significantly higher than in protocol 1. Another advantage of introducing the LSAB system is the signal amplification effect.18,19 In fact, the LSAB system gave rise to a stronger signal fluorescent than the IDFI. At present, there are many signal amplification methods in FI. The tyramide signal amplification (TSA) system is supposed to the highest signal amplification method. 25 Thus, the TSA system should be also effective in improving the double staining with FJC and FI, but the LSAB system is much easier to use and cheaper than the TSA system.
Because FJC does not bind firmly to the sections in an aqueous mounting medium, clearing of sections with xylene was required. But xylene treatment was also harsh to fluorophores. Although an aqueous mounting medium containing 0.1% acetic acid/80% glycerol could be used,12,26 coverslipping with non-aqueous mounting medium was better for FJC staining than a glycerol-based aqueous mounting medium to acquire the images of FJC with higher contrast (data not shown). We did not directly compare the fluorescence intensity between AlexaFluor 555 and DyLight 549. However, we indicated that vulnerability against xylene was comparable between these fluorophores.
These results indicated that our protocol 2 greatly improved the quality of double staining with FJC and FI. After finishing all experiments, it became clear that Cy3 was also vulnerable against KMnO4 treatment, but highly durable against xylene (data not shown). Thus, a still better result could be acquired using streptavidin-Cy3 in protocol 2.
Labeling of Degenerating Glial Cells With FJC
In the central nervous system, neurons are the most vulnerable cell type against any kinds of insults, such as traumatic injury, ischemia, and excitotoxicity. Glial cells have a much stronger resistance to those insults. Neuronal death has been the focus of most studies, and glial cell death has been paid less attention. Thus, FJC staining has been very useful for most studies to detect degenerating neurons. But glial cells are important to maintain brain function. In any case, identifying the cell types using maker antibodies is necessary in FJC staining.
In the AE model mice, GFAP(+) astrocytes are injured and exhibit the symptom of clasmatodendrosis, an irreversible morphological change of dying astrocytes.16,20–23 The GFAP signal of astrocytes located in the cortical gray matter was much weaker than in the cortical white matter, both in the control and in the AE mice. When protocol 1 was used, the GFAP signal in the cortical gray matter was greatly reduced by FJC treatment, and it was difficult to detect GFAP(+)/FJC(+) degenerating astrocytes. However the GS immunostaining signal was much stronger than that of GFAP, but it was difficult to detect clasmatodendrosis with the GS signal because anti-GS antibodies stained mainly the cell body but not the fine processes of astrocytes.
In the 6-AN-treated adult mice, astrocytes and oligodendrocytes specifically in the brain stem were the first to be affected before neuronal death. At 2 days after 6-AN injection, massive necrosis with pyknotic nuclei and cellular edema were detected in glial cells, 17 but neuronal death was very few. 24 At this stage, we detected glial marker(+)/FJC(+) cells with protocol 2, in addition to a few FJC(+) neurons.
This study clearly indicated that FJC staining was not always specific to degenerating neurons, and some damaged glial cells were also labeled by FJC. Moreover, FJC can label degenerating non-neural cells. In fact, we previously reported that dying mesenchymal cells were FJC(+). 14 Thus, we should remind that not all FJC(+) cells are degenerating neurons in some experimental conditions, although the ratio of FJC(+) cells among degenerating glial cells is low. This study should provide useful information to elucidate the staining mechanism of FJC.
It is important that processes of degenerating glial cells were not stained by FJC. And we previously reported that processes of degenerating neural stem/precursor cells and mesenchymal cells were not stained by FJC. 14 Because processes of degenerating neurons can be stained by FJC, 5 FJC(+) cells without processes appear likely to be degenerating cells excluding degenerating mature neurons. In fact, there were FJC(+) cells with and without processes in the AE model mice. In the AE model mice, not only astrocytes but also neurons are also dying at 6 hr after hyperthermia treatment. 16 Thus, FJC(+) cells with and without processes might be degenerating neurons and degenerating other cell types including astrocytes, respectively. Moreover, FJC(+) cells increased with time after 6-AN injection, and some of them had processes. Those FJC(+) cells with processes might be dying neurons because neurons begin to die after glial cells degenerate. 24
In this study, we improved the double staining with FJC and FI by introducing the LSAB system. Because FJC staining is a simple procedure that does not depend on the manner of cell death, it is useful for detecting dying cells. Identification of dying cell types by double staining with FJC and FI gives us important information, and our improved protocol should be valuable in the study of cell death.
Footnotes
Acknowledgements
This research was partly performed at the Tottori Bio Frontier, managed by the Tottori prefecture.
Competing Interests
The author(s) declared no potential conflicts of interest with respect to the research, authorship, and/or publication of this article.
Author Contributions
TI conducted most of the experiments and analyzed the data. TK prepared the AE model mice. RO performed the image analysis. MM and RY performed the histological analysis, and TM designed and supervised the study.
Funding
The author(s) disclosed receipt of the following financial support for the research, authorship, and/or publication of this article: This work was supported by JSPS KAKENHI, Grant Number JP18K06830.