
Abstract
With the advent of checkpoint inhibitors, there is increasing need to study the dynamics of CD8+ T-cells in the tumor microenviroment. In this article, we describe a semi-automated method to quantify and interrogate spatial relationships between T-cells and collagenous stroma in human and mouse tissue samples. The assay combines CD8 immunohistochemistry with modified Masson’s trichrome. Slides are scanned and digital images are analyzed using an adjustable MATLAB algorithm, allowing for high-throughput quantification of cytotoxic T-cells and collagen. This method provides a flexible tool for unbiased quantification of T-cells and their interactions with tumor cells and tumor microenvironment in tissue samples.
Introduction
The principal goal of cancer immunotherapy is to augment a patient’s natural antitumor immune response, resulting in tumor regression and, ideally, remission. Cancer immunotherapy has shown dramatic efficacy in multiple solid tumor types, including melanoma, non–small cell lung cancer, renal cancer, bladder cancer, head and neck cancers, and colon cancer. 1 Yet, the majority of patients do not benefit from immunotherapy, and mechanisms of resistance need to be better understood. The tumor microenvironment is essential to tumor growth, metastasis, and therapeutic resistance and is increasingly recognized as a rich therapeutic target that can potentially augment existing immunotherapies. However, our understanding of the heterogeneity of the tumor stroma at different stages of tumorigenesis or after treatment is limited. Some tumors evade the immune system by forming a collagenous barrier around the tumor, inhibiting the penetration of CD8+ T-cells and tumor-infiltrating lymphocytes (TILs), thus limiting their interactions with the tumor cells. 2 Increases in tumor stroma have been shown to promote hypoxia and tumor cell survival and to impair immune cell infiltration and drug delivery to the neoplastic cells.3,4
Mice engrafted with human-derived tumors represent a promising strategy to characterize the dynamics of the tumor microenvironment and therapeutic efficacy, and labeling immune cell subsets and stromal elements on formalin-fixed tissues can augment our understanding of tumor stroma–immune cell interactions and mechanisms of resistance. 5 Characterizing spatial relationships between tumor stroma and TILs requires labeling both components, and doing so on a single slide eliminates the need for serial tissue sections and removes the constraints of digital image registration, allowing for the direct assessment of immunolabeling in the context of the identified collagenous stroma. Using a single slide for this purpose eliminates slide-to-slide variation and preserves the samples.
Compared with collagen type–specific immunohistochemistry (IHC), the modified Masson’s trichrome (MMT) staining method labels a broader family of collagen types of variable crosslinking states, allowing visualization of both mature and immature collagen fibers. In addition, MMT has been successfully combined with Ki-67 and cytokeratin 7 IHC, demonstrating the feasibility of this approach.6,7
The described dual assay combines MMT with CD8 IHC to demonstrate CD8+ T-cells and collagen in human and mouse tissues. Combined with image analysis, it provides high-throughput unbiased quantification of the spatial relationships between TILs and tumor stroma.
Methods
Tissue Sections
Four-micrometer-thick formalin-fixed, paraffin-embedded tissue sections were adhered to Superfrost Plus positively charged microscope slides (Thermo Scientific; Warrington, UK). Tissue sections were air-dried overnight at room temperature and baked for 20 min at 70C. In all, 830 mouse xenograft samples representing breast, pancreatic, and colon tumors and 95 human samples of urinary bladder tumors were included in this study.
CD8 IHC
Human CD8 IHC was completed on the Discovery XT platform (Ventana Medical Systems, Inc.; Tucson, AZ). Sections were treated with Cell Conditioning 1 (Ventana Medical Systems, Inc.) and incubated in a primary antibody against CD8 (Clone SP16; Abcam, Cambridge, MA) diluted to 1:100 manually and diluted 1:4 by instrument for an on-slide concentration of 1:400, followed by 60-min incubation at ambient temperature. Specifically bound primary antibody was detected using the Discovery OmniMap anti-rabbit HRP detection reagent (Ventana Medical Systems, Inc.), followed by the Discovery ChromoMap DAB kit (Ventana Medical Systems, Inc.).
Mouse CD8a IHC was completed on the LabVision Autostainer platform (Thermo Fisher Scientific Inc.; Waltham, MA). Sections were treated with Target Retrieval Solution (pH6.1) (Agilent; Santa Clara, CA) and incubated in a primary antibody against CD8a (Clone 1.21E3.1.3; Genentech, South San Francisco, CA) diluted to 5 µg/mL, followed by 60-min incubation at ambient temperature. Specifically bound primary antibody was detected using a biotinylated goat anti-hamster IgG antibody (H+L; Vector Laboratories, Inc.; Burlingame, CA), followed by the standard Vectastain Elite ABC-HRP kit (Vector Laboratories, Inc) and then with the Pierce DAB Substrate kit (Thermo Fisher Scientific Inc.).
Masson’s Trichrome Stain
After completion of IHC, slides were rinsed with dH2O and fixed in Bouin’s fixative (FXBOUGAL; American MasterTech, Lodi, CA) at 60C for 60 min. Fixed slides were rinsed with tap water and stained with Weigert’s hematoxylin solution with dH2O and 95% ethanol (CAS 517-28-2; A-Sigma, St. Louis, MO and 5029-04; B-Avantor Performance Materials, Center Valley, PA) (1:1:1:1 vol/vol/vol/vol; part A diluted 1:1 in 95% ethanol and part B diluted 1:1 in dH2O) for 5 min, washed with tap water for 5 min, rinsed with dH2O for 5 min, and then stained with Biebrich scarlet-acid fuchsin stock solution made from 2.0 g of Ponceau Xylidine (L1555-1; A-Sigma), 2.0 g of Orange G (Spectrum Chem, Vernon Hills, IL; CAS 1936-15-8), 1.0 g of acid fuschin (CAS 3244-88-0; Spectrum Chem, Vernon Hills, IL), and 300 ml of 0.2% acetic acid (AHORG25; American MasterTech) and water diluted (1:100 vol/vol) in 0.2% acetic acid (BDH3092; VWR, Radnor, PA) at 60C for 30 sec. Slides were differentiated through a series of 0.2% acetic acid (BDH3092; VWR) in dH2O for 10 min, 5.0% phosphotungstic acid (AHPPTA125; American MasterTech) in dH2O for 20 min, and 0.2% acetic acid (BDH3092; VWR) in dH2O for 2 min before selective collagen staining in 3.0% aniline blue (AHABL25; American MasterTech) in dH2O (3:1 vol/vol) for 1 min. Sections were decolorized using 0.2% acetic acid (BDH3092; VWR) in dH2O for 3 min, followed by two 30-sec rinses in 95% ethanol and two 1-min rinses in 100% ethanol. Sections were immersed in xylene before coverslipping with Tissue-Tek Glas Mounting Medium (Sakura Finetek USA Inc.; Torrance, CA).
Imaging and Statistical Analysis
CD8-trichrome dual stained slides were scanned on a NanoZoomer 2.0 HT whole slide imager (Hamamatsu; Bridgewater, NJ) at 200× magnification. Slide images were evaluated to quantify the CD8+ T-cells and collagen within the tumor. Each tumor boundary was manually defined by a pathologist. CD8+ T-cells were measured within the tumor region based on the area stained with DAB. Collagen was measured within the tumor region based on the area stained with aniline blue. Segmentation of the cell and collagen areas was performed using a customized algorithm run on MATLAB 2019a (Mathworks; Natick, MA). The binary collagen segmentation mask was converted to a grayscale image via the bwdist function. The value of each pixel in the grayscale image represents the Euclidean distance to the nearest collagen pixel. The distance of each T-cell to the nearest collagen strand was calculated by averaging the subset of grayscale pixel values belonging to that specific T-cell. A distribution of T-cell to collagen distances was generated for each phenotype slide and was evaluated at the 25th, 50th, and 75th percentile of each distribution.
Results
The CD8-trichrome staining method labels CD8+ cells and collagen bundles in both human tissue samples and mouse xenograft tissues. Samples of human urinary bladder tumors and xenografts from pancreatic, colonic, and breast adenocarcinomas demonstrated variable numbers of CD8+ cells within the tumor stroma, on tumor periphery, and in the surrounding tissue (Fig. 1). Annotated regions of interest were drawn manually on the digital images, and CD8+ cell density and average distances from collagen fibers were evaluated by automated image analysis. Distinct patterns of CD8+ cell distribution within tumor nests and stroma in pancreatic carcinoma xenografts were evident on examination of percentile distributions of CD8+ cells from their nearest trichrome-positive neighbor(s), implying distinguishable “immune phenotypes.” Samples without CD8+ cell infiltrates were designated “deserts.” Samples with few CD8+ cells frequently demonstrated significant fibrosis, and the few CD8+ cells present were often in close proximity to collagen fibers. These tumors were designated as immune “excluded.” Samples showing CD8+ cells infiltrating tumor stroma were designated as “inflamed.” 8
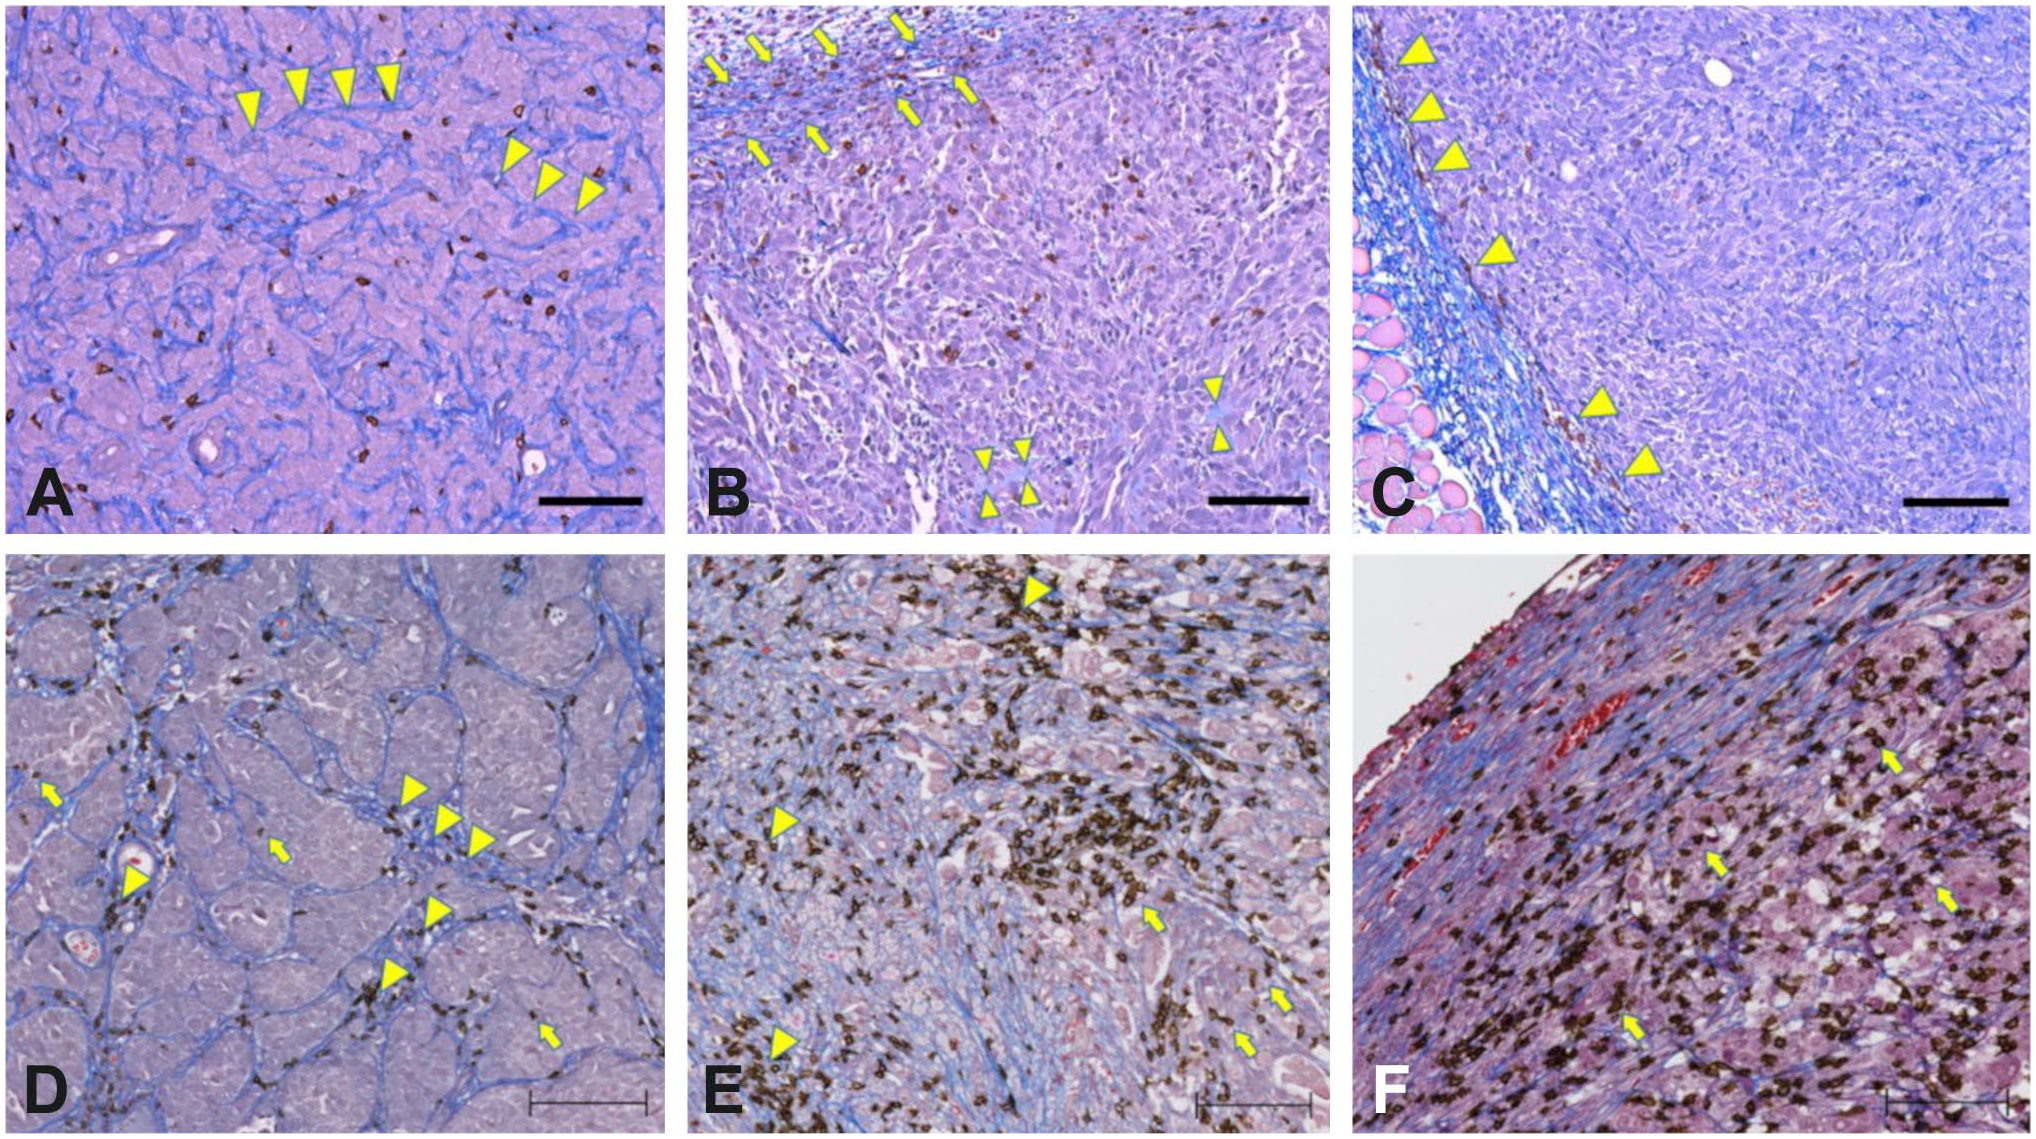
CD8-trichrome staining of mouse xenograft models and human urinary bladder cancer. CD8-trichrome-stained slides showing interactions between CD8+ and collagen fibers in mouse xenografts (A–C). Pancreatic adenocarcinoma showing intratumoral collagen (arrowheads) with T-cells distributed between tumor cells and throughout the collagenous stroma (A). Colorectal carcinoma showing prevalence of immature collagen within the tumor center (arrowheads) and a thin peritumoral capsule of mature collagen (arrows). CD8+ cells are present primarily within tumor cell nests (B). Breast carcinoma showing ample mature collagen both peripherally and scattered throughout the tumor with CD8+ cells located at tumor periphery (C). Representative examples of immune phenotype categories in human urinary bladder cancer. Excluded category shows extensive colocalization of CD8+ cells with collagen fibers (arrowheads) and rare CD8+ cells in contact with tumor cells (arrows) (D). Inflamed type 2 tumor shows the majority of CD8+ cells within stromal bands (arrowheads) but with “spillover” into tumor cell nests (arrows) (E). Inflamed type 1 tumor shows a diffuse infiltrate of CD8-positive cells that involves tumor cell nests (arrows) (F). Scale bar, 100 µm.
Discussion
This assay co-labels collagen and T-cells and can be applied to a wide range of tumor types from human biopsies to mouse xenografts. Performing the assay on a single slide eliminates the need for serial sections and thus increases the accuracy of interpretation that would otherwise rely on the correlation between serially sectioned slides. It also preserves tissue blocks that may be required for additional assays.
The reagents and IHC procedures vary between human and mouse tissues. Human tissues were labeled by an anti-CD8 rabbit monoclonal antibody and detected with an anti-rabbit HRP antibody on the Ventana platform. The mouse tissues were labeled by an anti-CD8 hamster monoclonal antibody and detected with biotinylated goat anti-hamster antibody on the Dako platform. Both IHC protocols include an antigen retrieval step requiring high temperature and low pH, conditions that interfere with MMT staining and therefore dictate the order of staining procedures. In addition, the Ventana platform uses a prediluted coverslip system (Ultra Liquid Coverslip) as a barrier between aqueous reagents and air, requiring additional washes before MMT staining. Compared with traditional Masson’s trichrome protocols, the modified Masson’s trichrome has reduced concentrations, incubations, and developing times of aniline blue, fuchsin-Ponceau-Orange G, and Weigert’s hematoxylin and increased decolorizing incubations. These modifications increase the contrast between lightly stained blue collagen fibers and the brown chromogen, improving differentiation between the two stains. This two-stepped procedure can be easily modified to accommodate different immune cell markers or combine MMT with a panel of labeling antibodies.
The image analysis algorithm on the MATLAB platform is customizable. Positive and negative staining controls are run with every staining batch and are used to inform threshold adjustments between staining cohorts. Once signal thresholds are determined, the image analysis is performed automatically and provides unbiased quantification of the spatial relationships between tumor stroma and the lymphoid component, affording valuable information on tumor extracellular matrix remodeling and any resultant changes in immune cell infiltration in response to immune-modulating therapy.8,9
Footnotes
Acknowledgements
The authors thank Margaret Solon and the Immunohistochemistry lab for optimizing mCD8 antibody clone assay design and Rajesh Vij for antibody engineering of mouse CD8 antibody.
Competing Interests
The author(s) declared no potential conflicts of interest with respect to the research, authorship, and/or publication of this article.
Author Contributions
CAH performed the mouse CD8 IHC staining, the MMT of human and mouse CD8 IHC MMT staining, analyzed data, and wrote the manuscript; SL supported the human CD8 IHC and analysis and wrote the manuscript; JH quantified scanned images, analyzed data, and wrote the manuscript; JE advised and supported scanning and analysis; CE advised and supported histology; LKR advised and supported IHC; HK designed the human CD8 IHC MMT experiments, analyzed data, and wrote the manuscript; JZ designed the mouse CD8 IHC MMT experiments, analyzed data, and wrote the manuscript; and OF analyzed data and wrote the manuscript.
Funding
The author(s) disclosed receipt of the following financial support for the research, authorship, and/or publication of this article: The authors are employees of Genentech, Inc. and Roche stockholders.