
Abstract
When first formed, the ovary only has an established epithelium at its base or hilum. Later, an epithelium is established around the rest of the ovary. To examine this further, we conducted scanning electron microscopy of the surface of bovine fetal ovaries and immunohistochemistry of ovarian cross-sections. From the earliest time point, the cells on the surface of the base or hilum of the ovary were cuboidal. On the remainder of the ovary, the surface was more irregular. By mid-development, the surface was covered completely with either a stratified or simple epithelium of cuboidal cells. Clefts were observed in the surface and appeared to form due to the expansion of stroma surrounding each open ovigerous cord, elevating the areas surrounding each cord, while leaving the opening of the cord to form the base of each cleft. The continued expansion of the surrounding stroma below the surface appeared not only to close the ovigerous cords from the surface but to compress the clefts into the shape of a groove. Later, most of the ovarian surface was covered with a simple cuboidal epithelium. The changes to the ovarian surface during fetal development coincide with the remodeling of the stroma and cords below.
Introduction
The mature ovary is covered by a predominantly single layer of flat to cuboidal epithelial cells. This surface epithelium is rich in keratins 7, 8, 18, and 19, and has intercellular desmosomes and incomplete tight junctions.1,2 The sub-epithelial basal lamina is underlain by the stromal fibrous tunica albuginea.2,3 Interestingly, the surface epithelium in the mature ovary is extremely dynamic. Continued expansion and contraction of the surface occurs as follicles and corpora lutea grow and regress beneath it. Additionally, cell death and the repair of the tunica and surface epithelium at the point of rupture of the follicle wall occurs during the event of ovulation.4,5 It is assumed that stem cells in the remaining surface epithelium proliferate and differentiate, to restore the surface damaged at ovulation. Until recently, little was known about the surface epithelial stem cells6–8 with the first study to identify possible stem/progenitor cells in mice. 9 The ovarian surface epithelium is also potentially a major contributor to the incidence of ovarian cancers. Ovarian epithelial carcinomas represent around 90% of the ovarian malignant neoplasms. 10 However, there is good evidence to suggest that at least the high-grade serous ovarian carcinomas are not derived from the ovarian surface epithelium but could arise from the secretory cells of the oviduct.11,12
The ovarian surface epithelium is also dynamic during fetal development. Earlier literature identified that the surface epithelium originates from the mesoderm-derived epithelial layer, which lines the intra-embryonic coelom and the area on the ventral surface of the mesonephros where the gonad is subsequently formed.13,14 The mesonephric surface is covered by a simple epithelium, except where gonadal thickening occurs. 15 This thickening is due to proliferation of the surface cells which we have termed as gonadal ridge epithelial-like (GREL) cells. 3 We observed that when the bovine fetal ovary is first formed, it is not covered by an established surface epithelium underlain by a basal lamina at the interface with stroma except at the base or hilum of the ovary.3,16,17 The base or hilum of the ovary is in fact a protrusion of the mesonephros, and it is covered by an established surface epithelium with a sub-epithelial basal lamina and epithelial-stromal interface. The remaining part of the ovary is composed of primordial germ cells interspersed in a cluster of GREL cells, which arise from the mesonephric surface epithelium through proliferation in a process that is also associated with degradation of the sub-epithelial basal lamina. Subsequently, the stroma from the mesonephros, with its leading edge basal lamina, penetrates into the ovarian primordium toward its surface; branching as it does so. This branching process gives rise to alternating areas of stroma and GREL cells/primordial germ cells, known as ovigerous cords. Eventually, the stroma expands to just below the GREL cells on the surface of the ovary and spreads laterally, closing off the ovigerous cords from the surface and trapping GREL cells on the surface. 3 These GREL cells on the surface eventually develop an epithelial phenotype rich in cell junctions, as identified by immunostaining for plakophilin-2 and desmoglein-2, and with a sub-epithelial basal lamina. 3 The cells of the surface epithelium of the adult mouse ovary are also not uniform in their phenotype and gene expression.6,8 Thus, the different developmental pathways for ovarian surface epithelial cells could be important in causing the heterogeneity of ovarian surface epithelial cells.
Since the surface epithelium of the ovary has heterogeneous cellular origins, undergoes continual death and renewal in adult life, and could be important in ovarian cancer, it is critical that we know more about this epithelium. We therefore initially examined the surface of the developing ovary using scanning electron microscopy (SEM). To interpret the features that we observed with SEM, we identified cytokeratin 19 (CK19) in epithelial cells and laminin 111 in basal laminas using immunohistochemistry on ovarian cross sections. We also performed a morphometric analysis of the proportions of cells on the surface that had different shapes.
Materials and Methods
Bovine Ovaries
Pairs of bovine fetal ovaries from different developmental stages were collected from pregnant Bos taurus cows processed at an abattoir (Midfield Meat International, Warrnambool, Victoria, Australia). To estimate the gestational age, the crown-rump length (CRL) was measured. 18 One ovary from each pair was fixed with 2.5% glutaraldehyde (ProSciTech, Thuringowa, Queensland, Australia) in 0.1 M phosphate buffer solution (PBS; Merck Pty Ltd, Bayswater, Victoria, Australia) for subsequent SEM (n=11 were used for SEM), whereas the corresponding ovary was embedded in O.C.T. compound (ProSciTech) and stored in dry ice for subsequent histology and immunohistochemistry. All samples were then transported to the laboratory. DNA was extracted from tail samples from fetuses with CRL < 10 cm to determine the fetal sex using PCR of the SRY gene, as previously described. 3 The samples were grouped into three developmental stages; early stage (SEM n=3, immunohistochemistry n=2, <100 days of gestation), mid stage (SEM, n=5; immunohistochemistry, n=8, 100–170 days of gestation), and late stage (SEM, n=3, immunohistochemistry, n=4, >170 days of gestation) which correspond almost to the three trimesters of bovine gestation. Furthermore, the age of each fetus was estimated from the CRL (y = −0.0103x2 + 3.4332x + 36.08 19 ; where y is the age in days and x is the CRL in cm, determined using Russe’s method [1983]).
Histology
O.C.T. embedded blocks were cut using a Leica CM3050S Cryostat (Leica Biosystems, Victoria, Australia) into serial sections of 8 µm thickness. The sections were then mounted on Superfrost glass slides (HD Scientific Supplies, Wetherill Park, NSW, Australia), transported in dry ice, then stored at −20C until used for hematoxylin-eosin staining and immunohistochemistry.
Immunohistochemistry
An indirect immunofluorescence method was used for dual localization of CK19 and laminin 111. 3 Sections were fixed in phosphate-buffered formal saline. The primary antibodies used were mouse anti-human CK19 (0.25 µg/ml; Boehringer Ingelheim GmbH, Ingelheim am Rhein, Germany) to identify epithelial cells in combination with rabbit anti-mouse laminin 111 (L9393, from the basement membrane of an EHS mouse tumor, 5 µg/ml; Sigma Chemical Co, St Louis, MO, USA) to localize the basal lamina. The secondary antibodies were Biotin-(SP)-conjugated AffiniPure donkey anti-mouse IgG (1:100; #711 066 152) and donkey anti-rabbit IgG conjugated to Cy3 (1:100; #715 166 151) followed by dichlorotriazinylamino fluorescein (DTAF)-conjugated streptavidin (1:100; #016 010 084). All the secondary antibodies and conjugated streptavidin were from Jackson ImmunoResearch Laboratories Inc (West Grove, PA, USA). The cell nuclei were counterstained with a 4,’6’-diamidino-2-phenylindole dihydrochloride (DAPI) solution (Molecular Probes, Fisher Scientific, Hampton, NH, USA). The bovine adult ovary was used as a positive control. Nonimmune mouse and rabbit sera (Sigma-Aldrich, St. Louis, MO, USA) were used as negative controls. All sections were photographed with an Olympus BX51 microscope with an epifluorescence attachment and a Spot RT digital camera (Diagnostic Instruments, Meyer Instrument, Houston, TX, USA).
Morphometric Analyses
Morphometric analyses were conducted on the largest cross-section from each ovary, determined by hematoxylin-eosin staining for every 10th section. To analyze the ovarian surface, mid- and late-stage samples were used, and the surface was identified based on the positive CK19 and laminin 111 staining. Using ImageJ software, 20 the ovarian epithelial perimeter was determined from the combined images taken from the ovarian surface as a CK19 positive area at 20x magnification. The proportions of the perimeter of the surface covered by multi- or single-layered cuboidal cells, or squamous cells, or that which was denuded were measured. No columnar-shaped cells were observed.
SEM
The fixed bovine fetal ovaries were washed 3 times with 0.1 M PBS pH 7.25 (Merck Pty Ltd). The samples were then transported to Adelaide Microscopy and postfixed with 2% osmium tetroxide in PBS for 1 hr. After washing twice for 5 min with PBS containing 4% sucrose, the samples were then dehydrated in a graded series of ethanol (2 x 10 min each in 70%, 90%, and 100%). The samples were incubated in 1:1 100% ethanol: hexamethyldisilazane (HMDS) for 10 min, then 2 x 10 min in 100% HMDS, air dried, and mounted on aluminum stubs with sticky tabs. A thin layer of dabs of paint was applied around the samples and dried. The stubs were then placed under vacuum in a 208 High Resolution Sputter Coater (Cressington Scientific Instruments, Watford, UK). After choosing the correct positions, the stubs were metallized with platinum using high vacuum systems and then stored in SEM storage boxes until examination. The processed samples were examined with a Philips XL30 SEM (North Billerica, MA, USA) operated at 10 kV.
Statistical Analyses
All statistical analyses were carried out using Microsoft Office Excel 2010 and GraphPad Prism Version 7.00 for Windows (GraphPad Software Inc., La Jolla, CA, USA). The morphometric data were statistically analyzed using Pearson correlation analyses and one-way ANOVA with a post hoc Tukey’s test. For proportions, the data were arcsine transformed before analyses.
Results
Immunohistochemical Changes
The early ovarian primordium developed on the ventral side of the mesonephros. As observed previously, 3 the mesonephros was covered by a simple single-layered surface epithelium which stained strongly for CK19 (Fig. 1). The same surface epithelium was observed at the base or hilum of the developing ovarian primordium (Fig. 1A and B). These simple surface epithelial cells of the mesonephros and the hilum of the ovary were underlain by a basal lamina, identified by localizing laminin 111 (Fig. 1B). Immunostaining for laminin 111, without the co-localization of CK19, is shown in Supplementary Fig. 1. The rest of the ovarian surface, not at the base or hilum of the ovary, was not covered by a surface epithelium underlain by a basal lamina. Instead, GREL cells, which also expressed lower levels of CK19 and formed the main body of the ovarian primordium, formed the outmost layer of cells on this part of the ovary (Fig. 1C). They appeared to be relatively tightly connected to each other (Fig. 1C). Laminin 111 fibers of basal lamina fragments were observed inside the developing ovary, where the mesonephric stroma had penetrated. At the end of the first trimester, the stroma had expanded toward the ovarian surface (Fig. 1D). This resulted in the formation of ovigerous cords, which contained both germ and GREL cells as shown previously. 3 The ovigerous cords were separated from the stromal compartments by a basal lamina. The GREL cells on the surface of the ovary were tightly abutted to each other with strong staining of CK19 at their cell margins, whereas in the GREL cells, found deeper in the ovary, the CK19 staining was weaker, punctuate, and sparse (Fig. 1D).
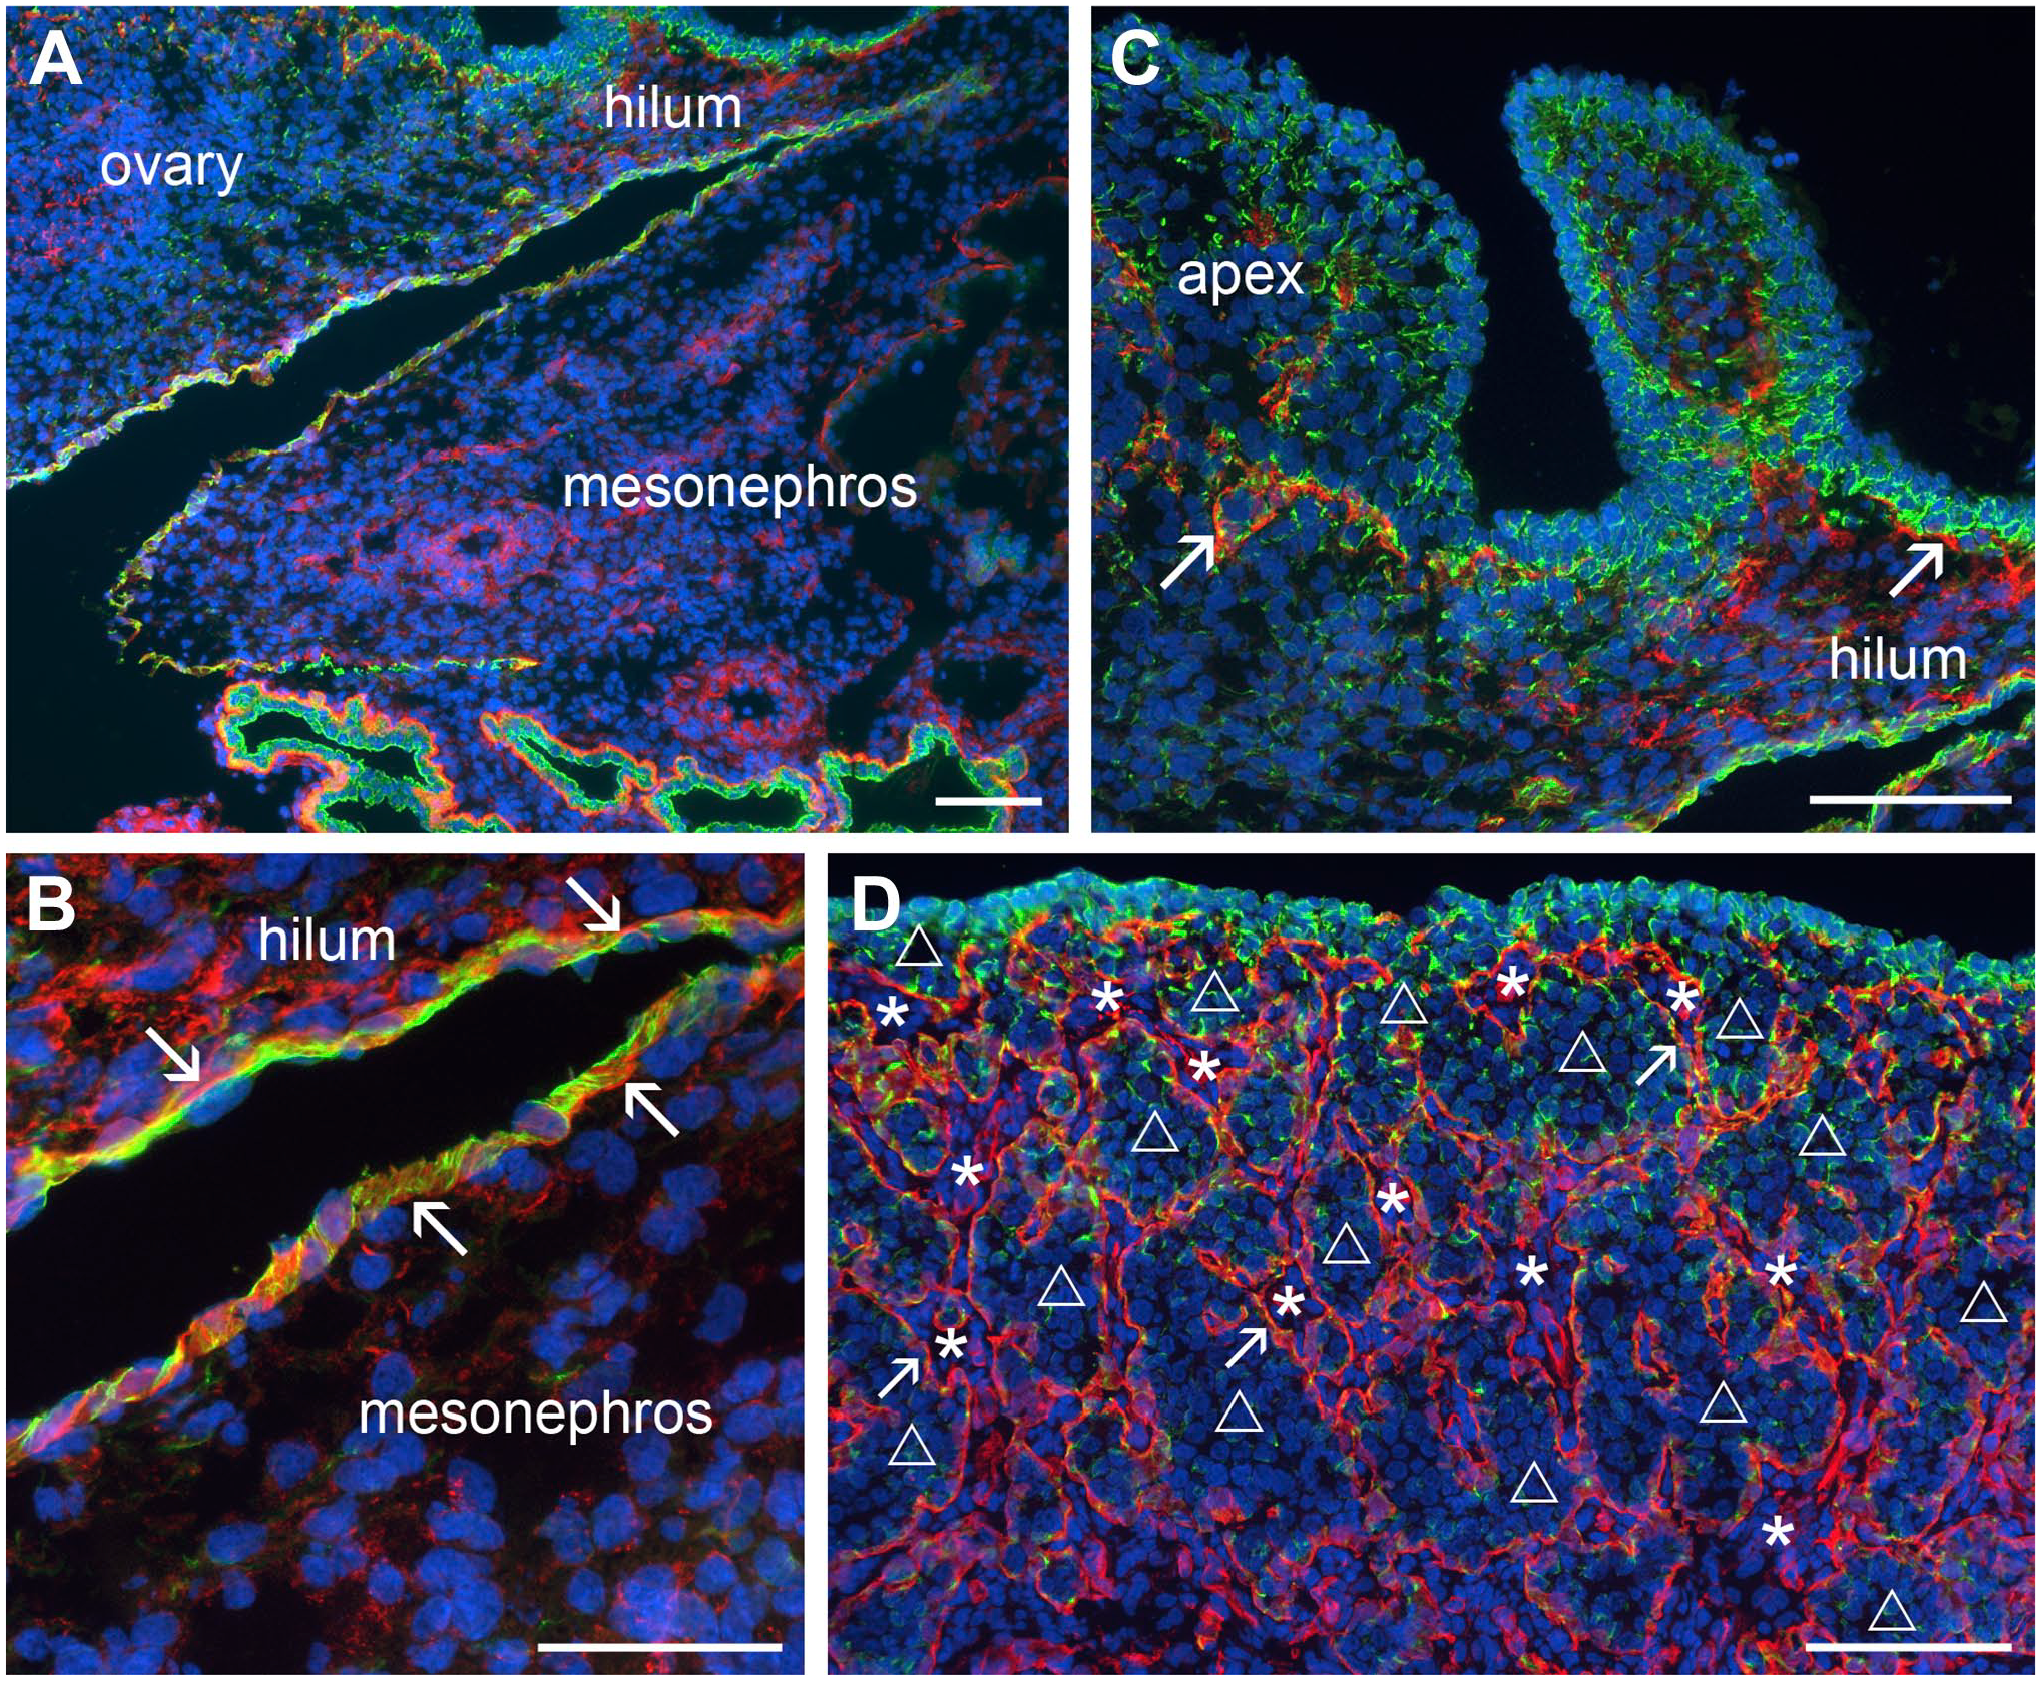
Fluorescence micrographs of the ovary and mesonephros during early stages of development (cytokeratin 19 [CK19] in green; laminin 111 in red). (A) The fetal ovary (top left) developed on the ventral surface of the mesonephros (bottom right). (B) The hilum area of the developing ovary and the mesonephros were covered by single-layered surface epithelium, strongly positive for CK19 and underlain by a basal lamina (laminin 111 positive, arrows). (C) The remaining ovary/apex surface at this stage of development was not covered by a surface epithelial layer underlain by a basal lamina, but rather it was covered by somatic GREL cells, which also expressed CK19. Fragments of basal lamina were observed throughout the ovary (arrows). (D) Penetration of mesonephric stroma into the developing ovary resulted in the formation of ovigerous cords (unfilled triangle), known to contain germ and GREL cells, 3 separated from the stroma (asterisk) by a basal lamina (arrows). The GREL cells at this later stage and closer to the surface strongly expressed CK19. Nuclei were counterstained with DAPI (blue). (A)—(C) 53 days and (D) 76 days of gestation. Scale bars: (A), (C) and (D) 100 µm, (B) 50 µm. Abbreviation: GREL, gonadal ridge epithelial-like.
In the second trimester, the stroma had penetrated further toward the ovarian surface and had commenced expanding laterally below the surface (Fig. 2A). A basal lamina formed below some layers of GREL cells on the surface (Fig. 2B, Supplementary Fig. 1) and continued to separate the stroma from the ovigerous cords. GREL cells on the surface began to stain more strongly for CK19. It is at this stage that the GREL cells of the surface of the ovary began to exhibit an epithelial phenotype as they had high levels of CK19 and were underlain by a basal lamina at an epithelial-stromal interface.3,17 The CK19 staining across the surface was uneven (Fig. 2A). The surface appeared to be physically uneven and was sporadically punctuated with deep clefts containing strongly stained CK19-positive GREL cells on the surface of the clefts (Fig. 2C). At this stage, some of the ovigerous cords were still open toward the surface (Fig. 2A, D and E) and, in some instances, the openings were below the level of the surrounding surface, suggesting that the clefts might be formed at the openings of the ovigerous cords by the expansion of the stroma below the surface surrounding each cleft. Numerous GREL cells at the opening of the ovigerous cords stained more strongly for CK19 (Fig. 2E and D).
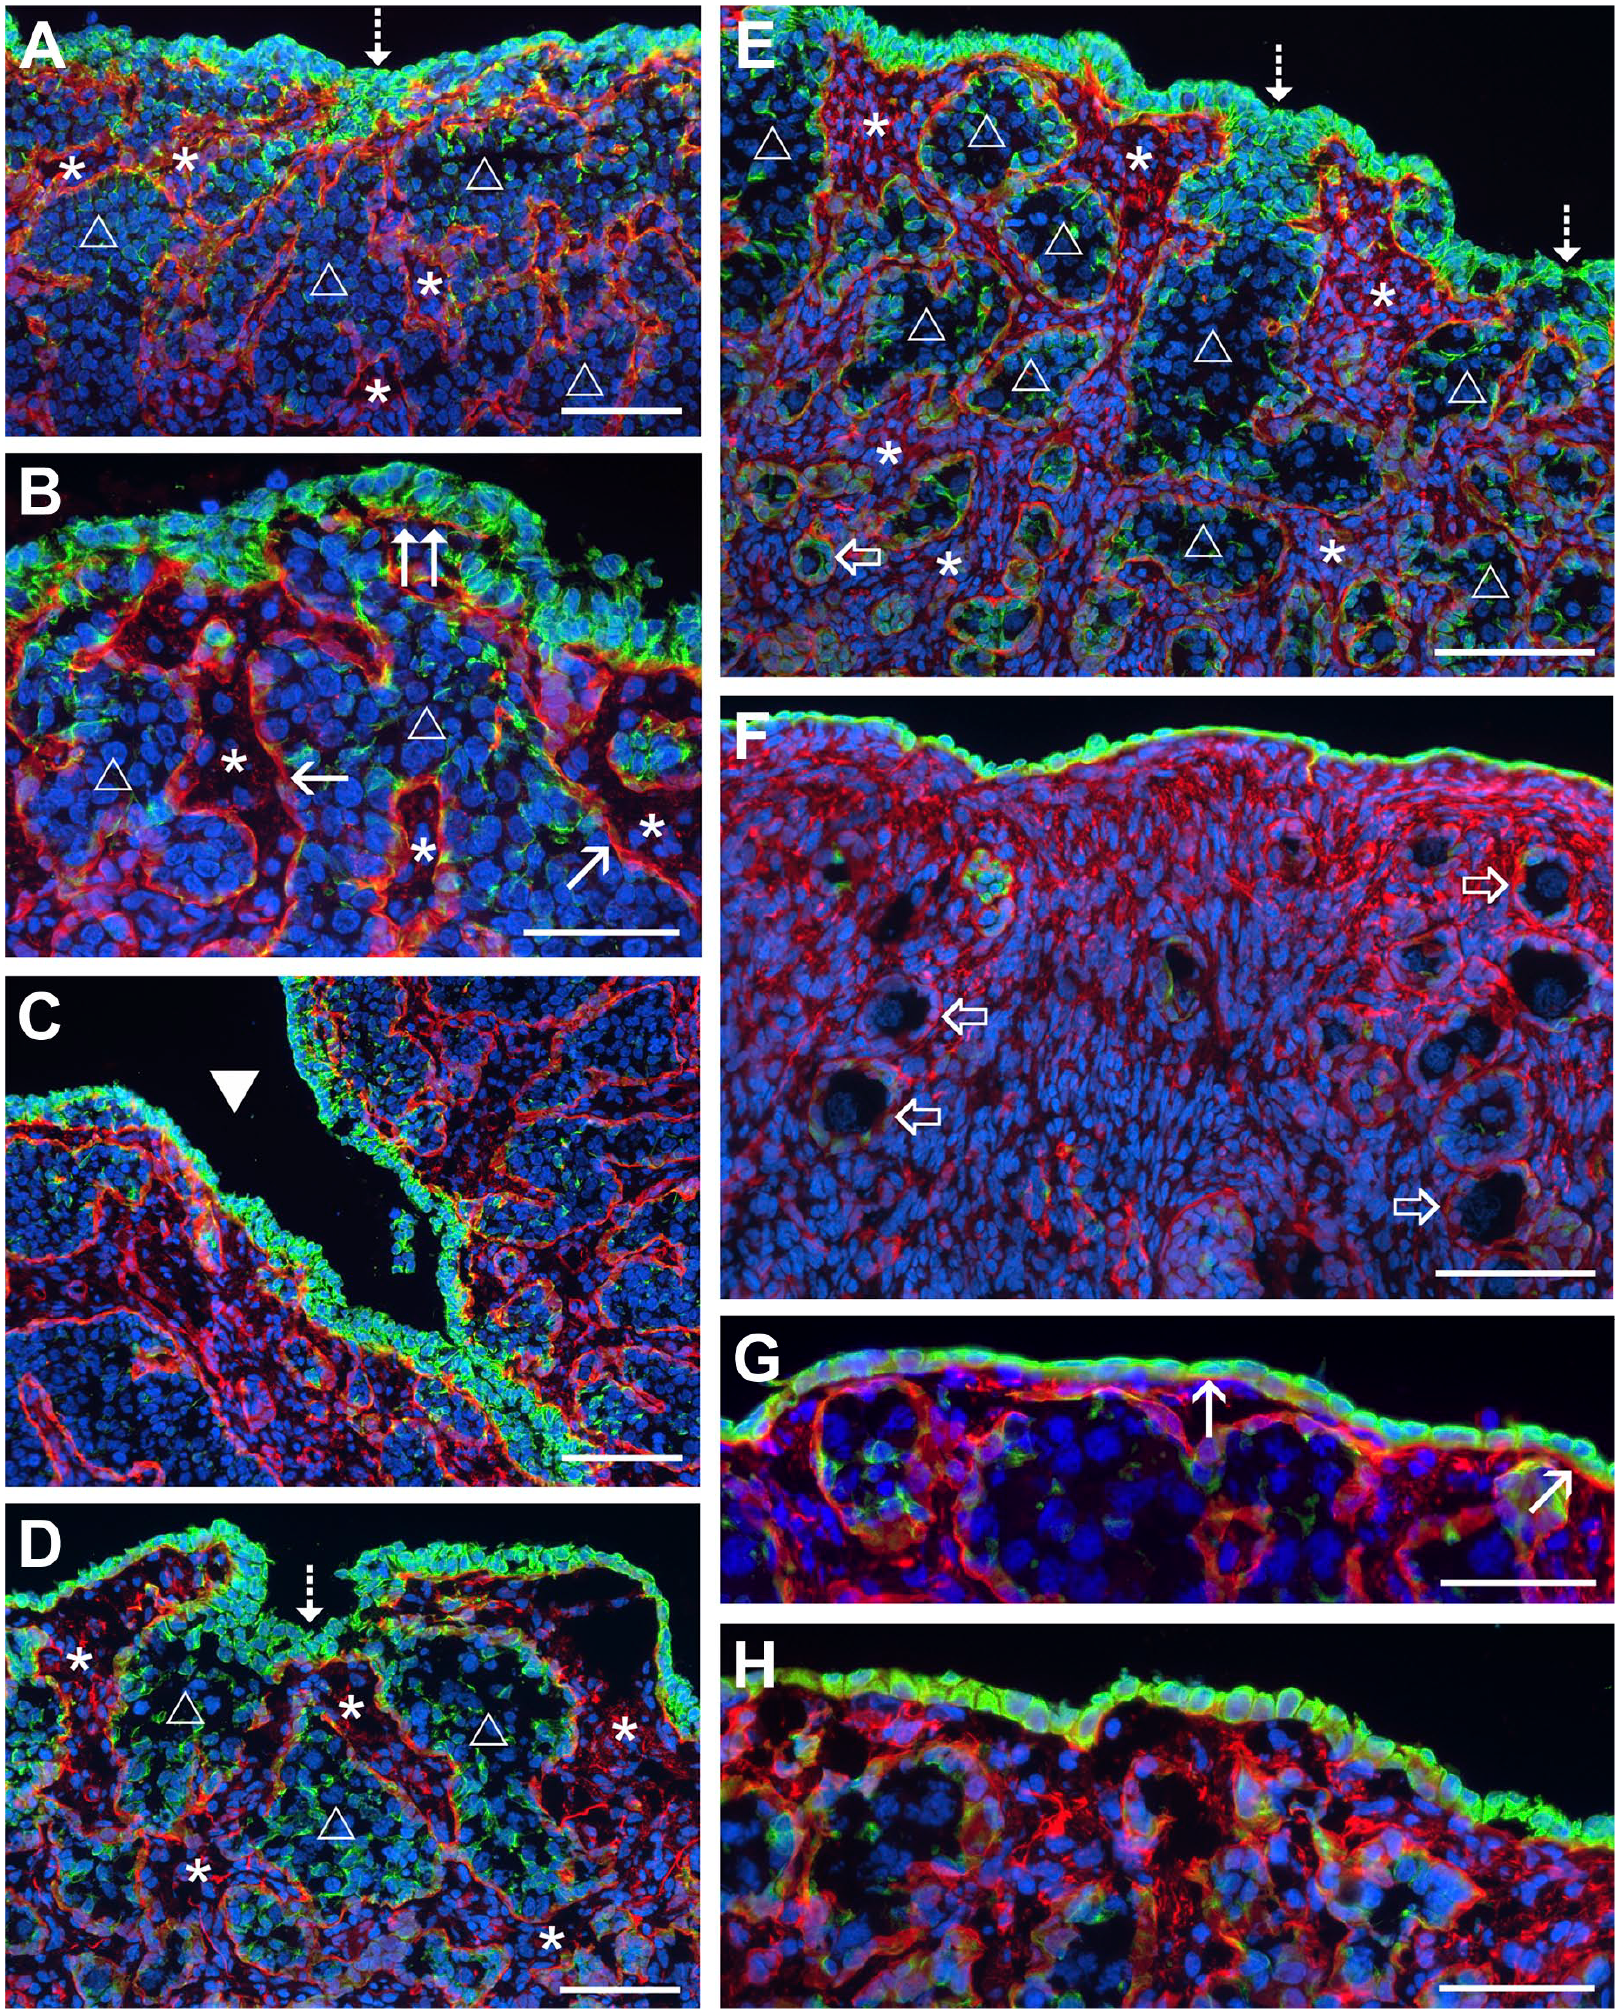
Fluorescence micrographs of the ovary during mid stages of development (CK19 is green; laminin 111 is red). (A) Stroma has penetrated further toward the surface and then spread laterally below layers of GREL cells on the surface. The staining of CK19 showed a gradient—strongest in GREL cells on the surface and in GREL cells clustering at the opening to the ovarian surface of the ovigerous cords. The weakest staining was in GREL cells deeper in the cords in the ovary. Basal lamina (laminin 111 positive) separated the ovigerous cords (unfilled triangle) and stromal compartments (asterisk). The ovigerous cords were still open at the surface (dotted-line arrow) in some areas and strongly positive GREL cells were observed clustered at the openings. (B) A basal lamina formed below the surface cells (double arrow) and started to close the ovigerous cords (unfilled triangle) from the outside of the ovary. The surface of the developing ovary was very uneven; (C) deep clefts (filled triangle) and (D) shallow clefts in areas of ovigerous cords being open to the surface (dotted-line arrow) were visible and again strongly CK19 positive, clustered at the opening. (E) The stroma expanded and laminin 111 fibers (red) were visible in the stromal compartments (asterisk). The expansion caused the breakdown of ovigerous cords (unfilled triangle) into smaller cords and finally into the smaller primordial follicles (block arrow) closer to the medulla. GREL cells differentiated into pre-granulosa cells of primordial follicles and weakly stained for CK19. Additionally, fewer ovigerous cords were still open to the surface (dotted-line arrow). (F) Later in development, all ovigerous cords were broken down into follicles (block arrow) and a proper surface epithelium was separated from the stroma below by a basal lamina. The surface epithelium changed from multi-layered to single-layered, with areas of (G) squamous cells or (H) cuboidal cells. Nuclei were counterstained in DAPI (blue). (A) 124 days, (B) and (C) 107 days, (D) 146 days, (E) 144 days, (F) 180 days, (G) and (H) 135 days of gestation. Scale bars: (A), (C), (D)—(F) 100 µm, (B), (G) and (H) 50 µm. Abbreviation: GREL, gonadal ridge epithelial-like.
At the medullary end of the ovigerous cords, the expansion of the stroma resulted in the breakdown of the ovigerous cords, first into smaller cords and then into primordial follicles (Fig. 2E and F). Some of these follicles were activated and had begun to differentiate into primary follicles. At the beginning of the mid-stage, the cells on the surface formed multiple layers (Fig. 2A, B, D and E). However, at the mid to the end of the second trimester, more areas of the surface had become single-layered (Fig. 2F–H). The surface cells in the single layers had either squamous (Fig. 2G) or cuboidal shapes (Fig. 2H).
At the late stage of ovarian development, the surface of the ovary was still very irregular with clefts and grooves (Fig. 3A). The surface cells were tightly packed, but some denuded areas were observed (Fig. 3B). Areas of multi-layered surface epithelium were also found, especially in the clefts (Fig. 3C), but the majority of the surface at this stage appeared to be single-layered (Fig. 3D).
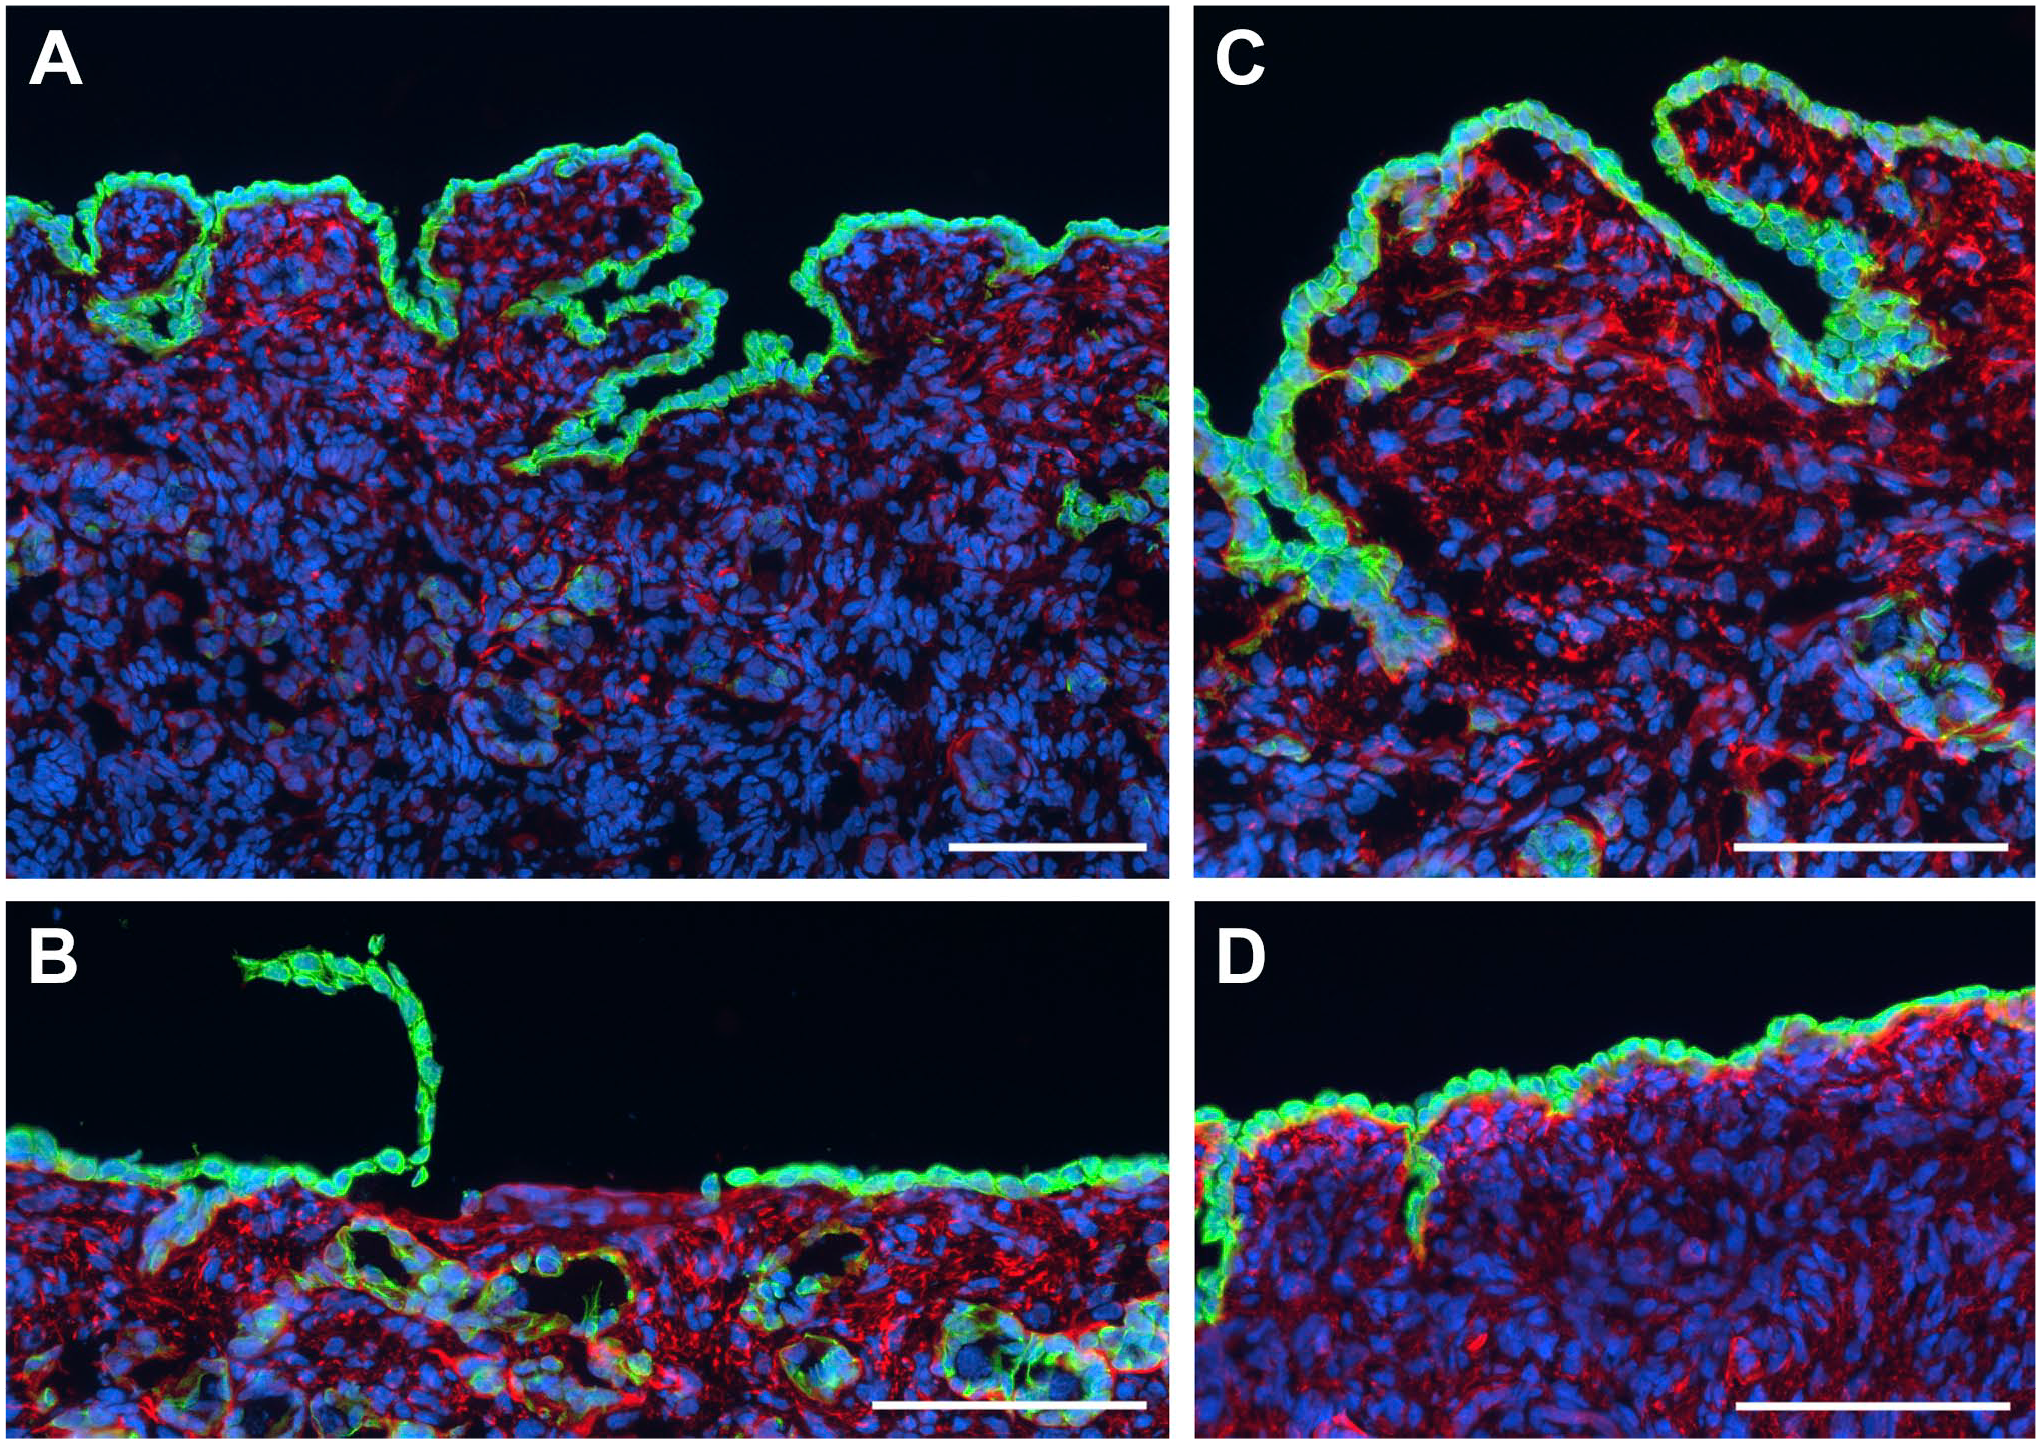
Fluorescence micrographs of the ovarian surface during late stages of development. (A) The surface of the late stage ovary remained uneven, showing folds and deep clefts. The surface epithelial cells stained strongly for CK19 (green). The stroma immediately below the surface epithelium formed the tunica albuginea and was rich in aggregates of laminin 111 (red). (B) The surface epithelial cells were tightly connected with each other and easily shed as a layer. (C) Even the fully developed ovary had areas with multi-layered surface epithelium, but most of the surface cover was (D) single layered. Nuclei were counterstained in blue. (A) 214 days, (B) and (C) 205 days and (D) 243 days of gestation. Scale bars: (A)—(D) 100 µm.
Morphometric Changes
We analyzed the proportions of single- or multi-layered cuboidal and squamous cells on the ovarian surface throughout mid and late development [Fig. 4 and Supplementary Table 1]. We rarely observed areas of the ovary which were not covered by an epithelium (very small areas in two of the 14 ovaries examined by immunohistochemistry in this study). We assumed these denuded areas were probably artifacts (Fig. 3B) resulting from the sample processing, and we excluded them from these morphometric analyses. With increasing gestational age the perimeter of the surface area of a histological cross section of the ovary increased as too did the proportion of single-layered cuboidal cells while the proportion of multi-layered cuboidal cells declined, but only the single-layered cuboidal cells reached statistical significance (Pearson Correlation Coefficient using arcsine transformed percentages; Fig. 4B). Single layers of cuboidal cells covered statistically more of the ovary (ANOVA, Tukey’s post hoc test, Fig. 4E) at 80.7 ± 1.3% (standard error of the mean; n=8) of the ovarian surface. Multilayered cuboidal cells covered 12.1 ± 1.7% of the surface and squamous cells covered 7.2 ± 1.8% of the surface.
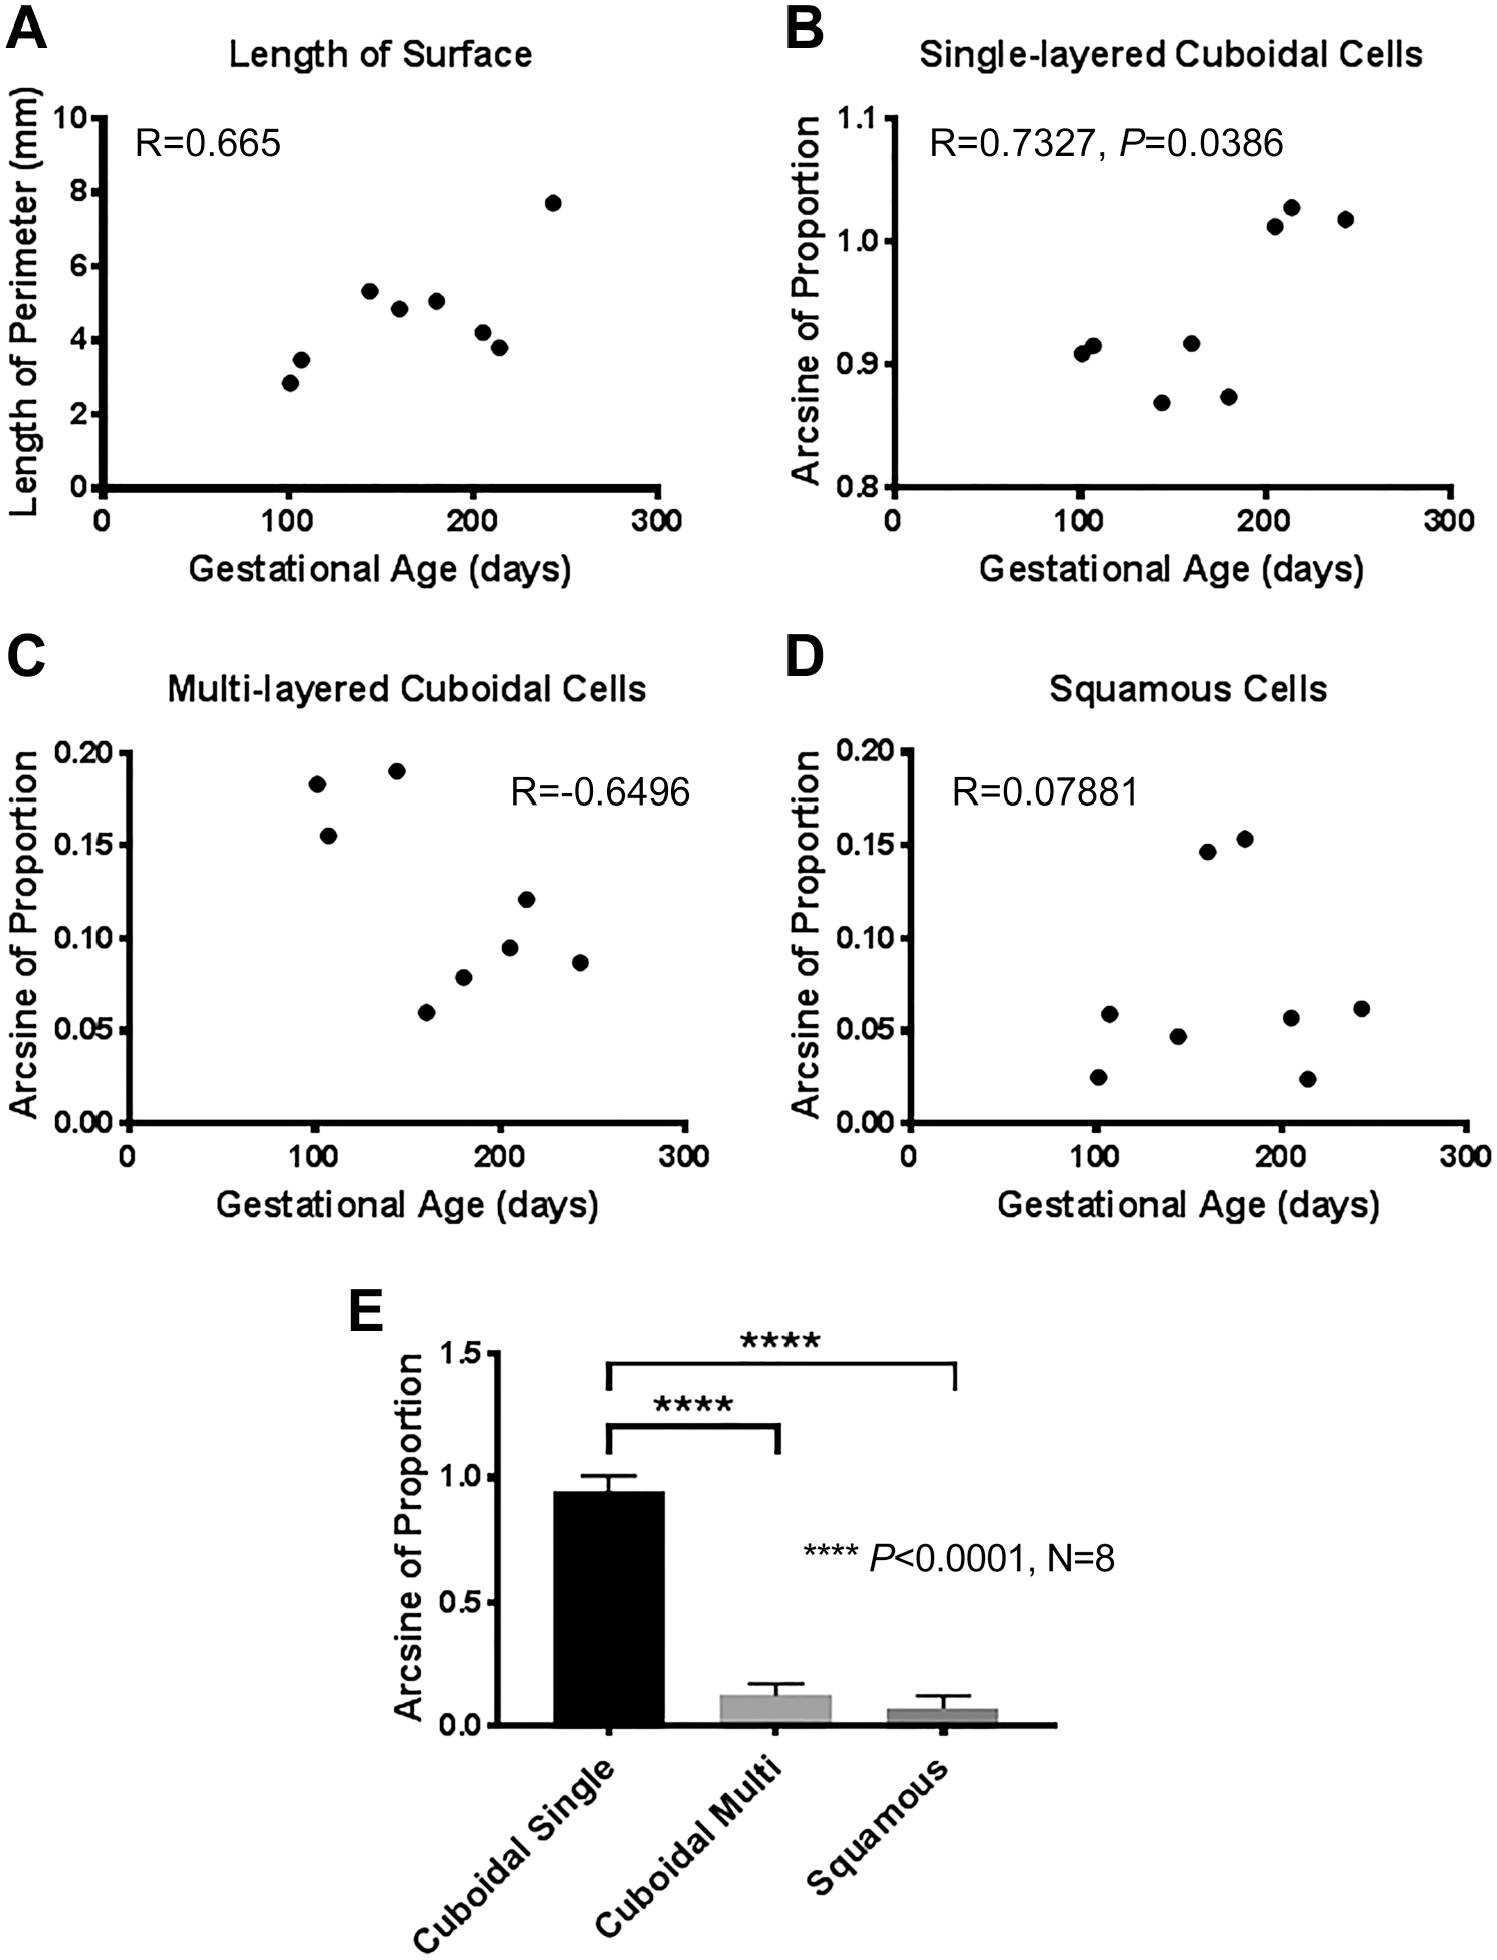
Morphometric analyses of the ovarian surface epithelium during fetal development. (A) Scatter plot showing the length of the perimeter of the surface (mm) of histological sections of bovine ovaries versus gestational age (days) (R is the Pearson correlation coefficient). (B-D) Scatter plots showing the arcsine transformed proportion of cell each type of surface epithelium versus gestational age (days). The Pearson correlation coefficients (R) were conducted using arcsine transformed proportions. (E) Mean ± standard error of the mean of the arcsine transformed proportions of each cell type of the surface epithelium. ****p<0.0001, ANOVA and post hoc Tukey’s test.
Ultrastructural Changes
SEM of the ovarian primordium revealed an uneven surface with clefts and grooves (Fig. 5A, 76 days of gestation). The cells on the surface were either squamous with an extracellular matrix between the cells (Fig. 5B, 53 days), or they were round in shape (Fig. 5C, D, 76 days and 53 days, respectively). Microvilli (Fig. 5E, 66 days) and isolated cilia (Fig. 5F, 66 days) were visible on the surface of the cells. Infrequently, germ cells, which were larger than the surface cells and had a round shape with smooth appearance, were observed on the surface (Fig. 5G, 76 days).
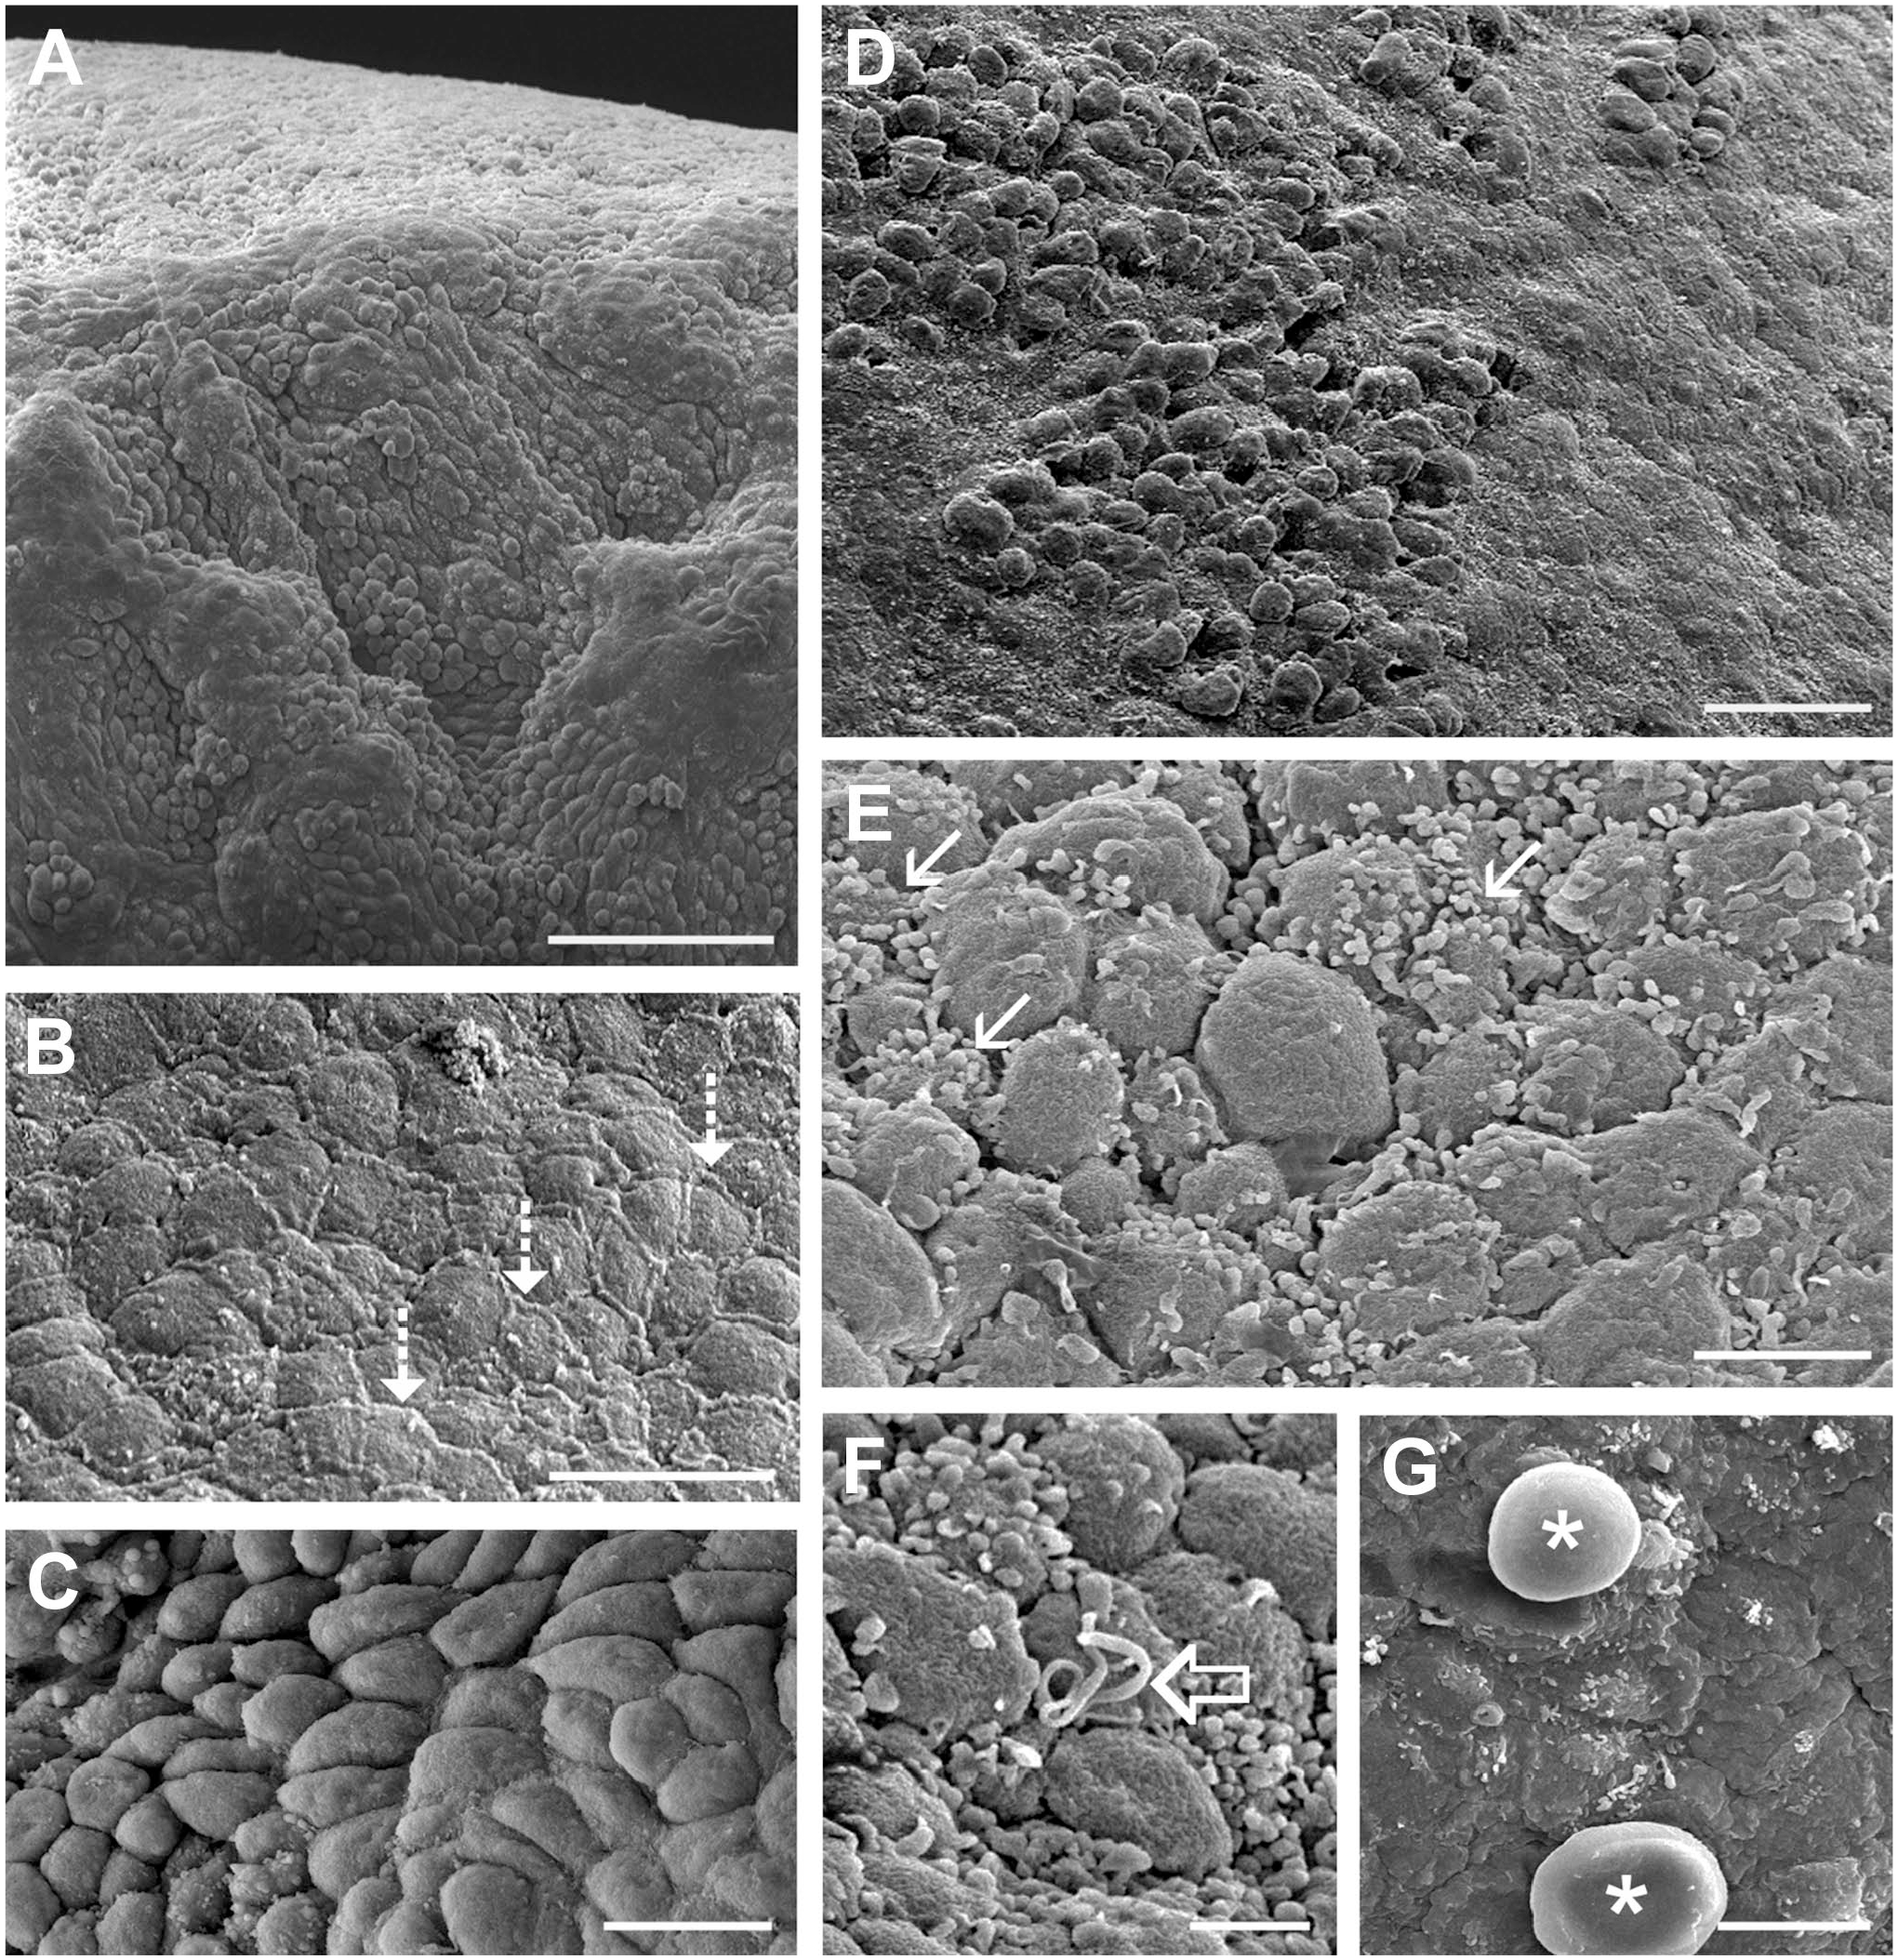
Scanning electron micrographs of the ovarian surface during early stages of development. (A) The surface of the developing ovary appeared uneven. It was covered by areas of squamous cells (B), whose intercellular gaps were filled with extracellular matrix material (dotted arrow), and rounded cells (C) close to each other (D). The surface cells had microvilli (E, arrow) and single cilia (F, unfilled arrow). Sporadically, germ cells were visible on the surface (G, asterisk). (A), (C) and (G) 76 days, (B) and (D) 53 days, (E) and (F) 66 days of gestation. Scale bars: (A) 50 µm, (B) and (C) 10 µm, (D) 20 µm, (E) and (G) 5 µm, and (F) 2.5 µm.
The surface of the ovary appeared even more irregular at mid-stage than at earlier stages with deeper clefts and grooves (Fig. 6A, 144 days of gestation). The surface cells appear more rounded in shape in areas that were less uneven (Fig. 6B, 107 days). The stroma was visible in areas where the surface had been denuded during processing (Fig. 6B, 107 days). In areas further away from the hilum, flat deep clefts covered the surface (Fig. 6C, 124 days). The cells between the clefts appeared flat and the cell borders were indistinct (Fig. 6C, 124 days) and gaps between the surface cells were filled with an extracellular matrix (Fig. 6D, 101 days).
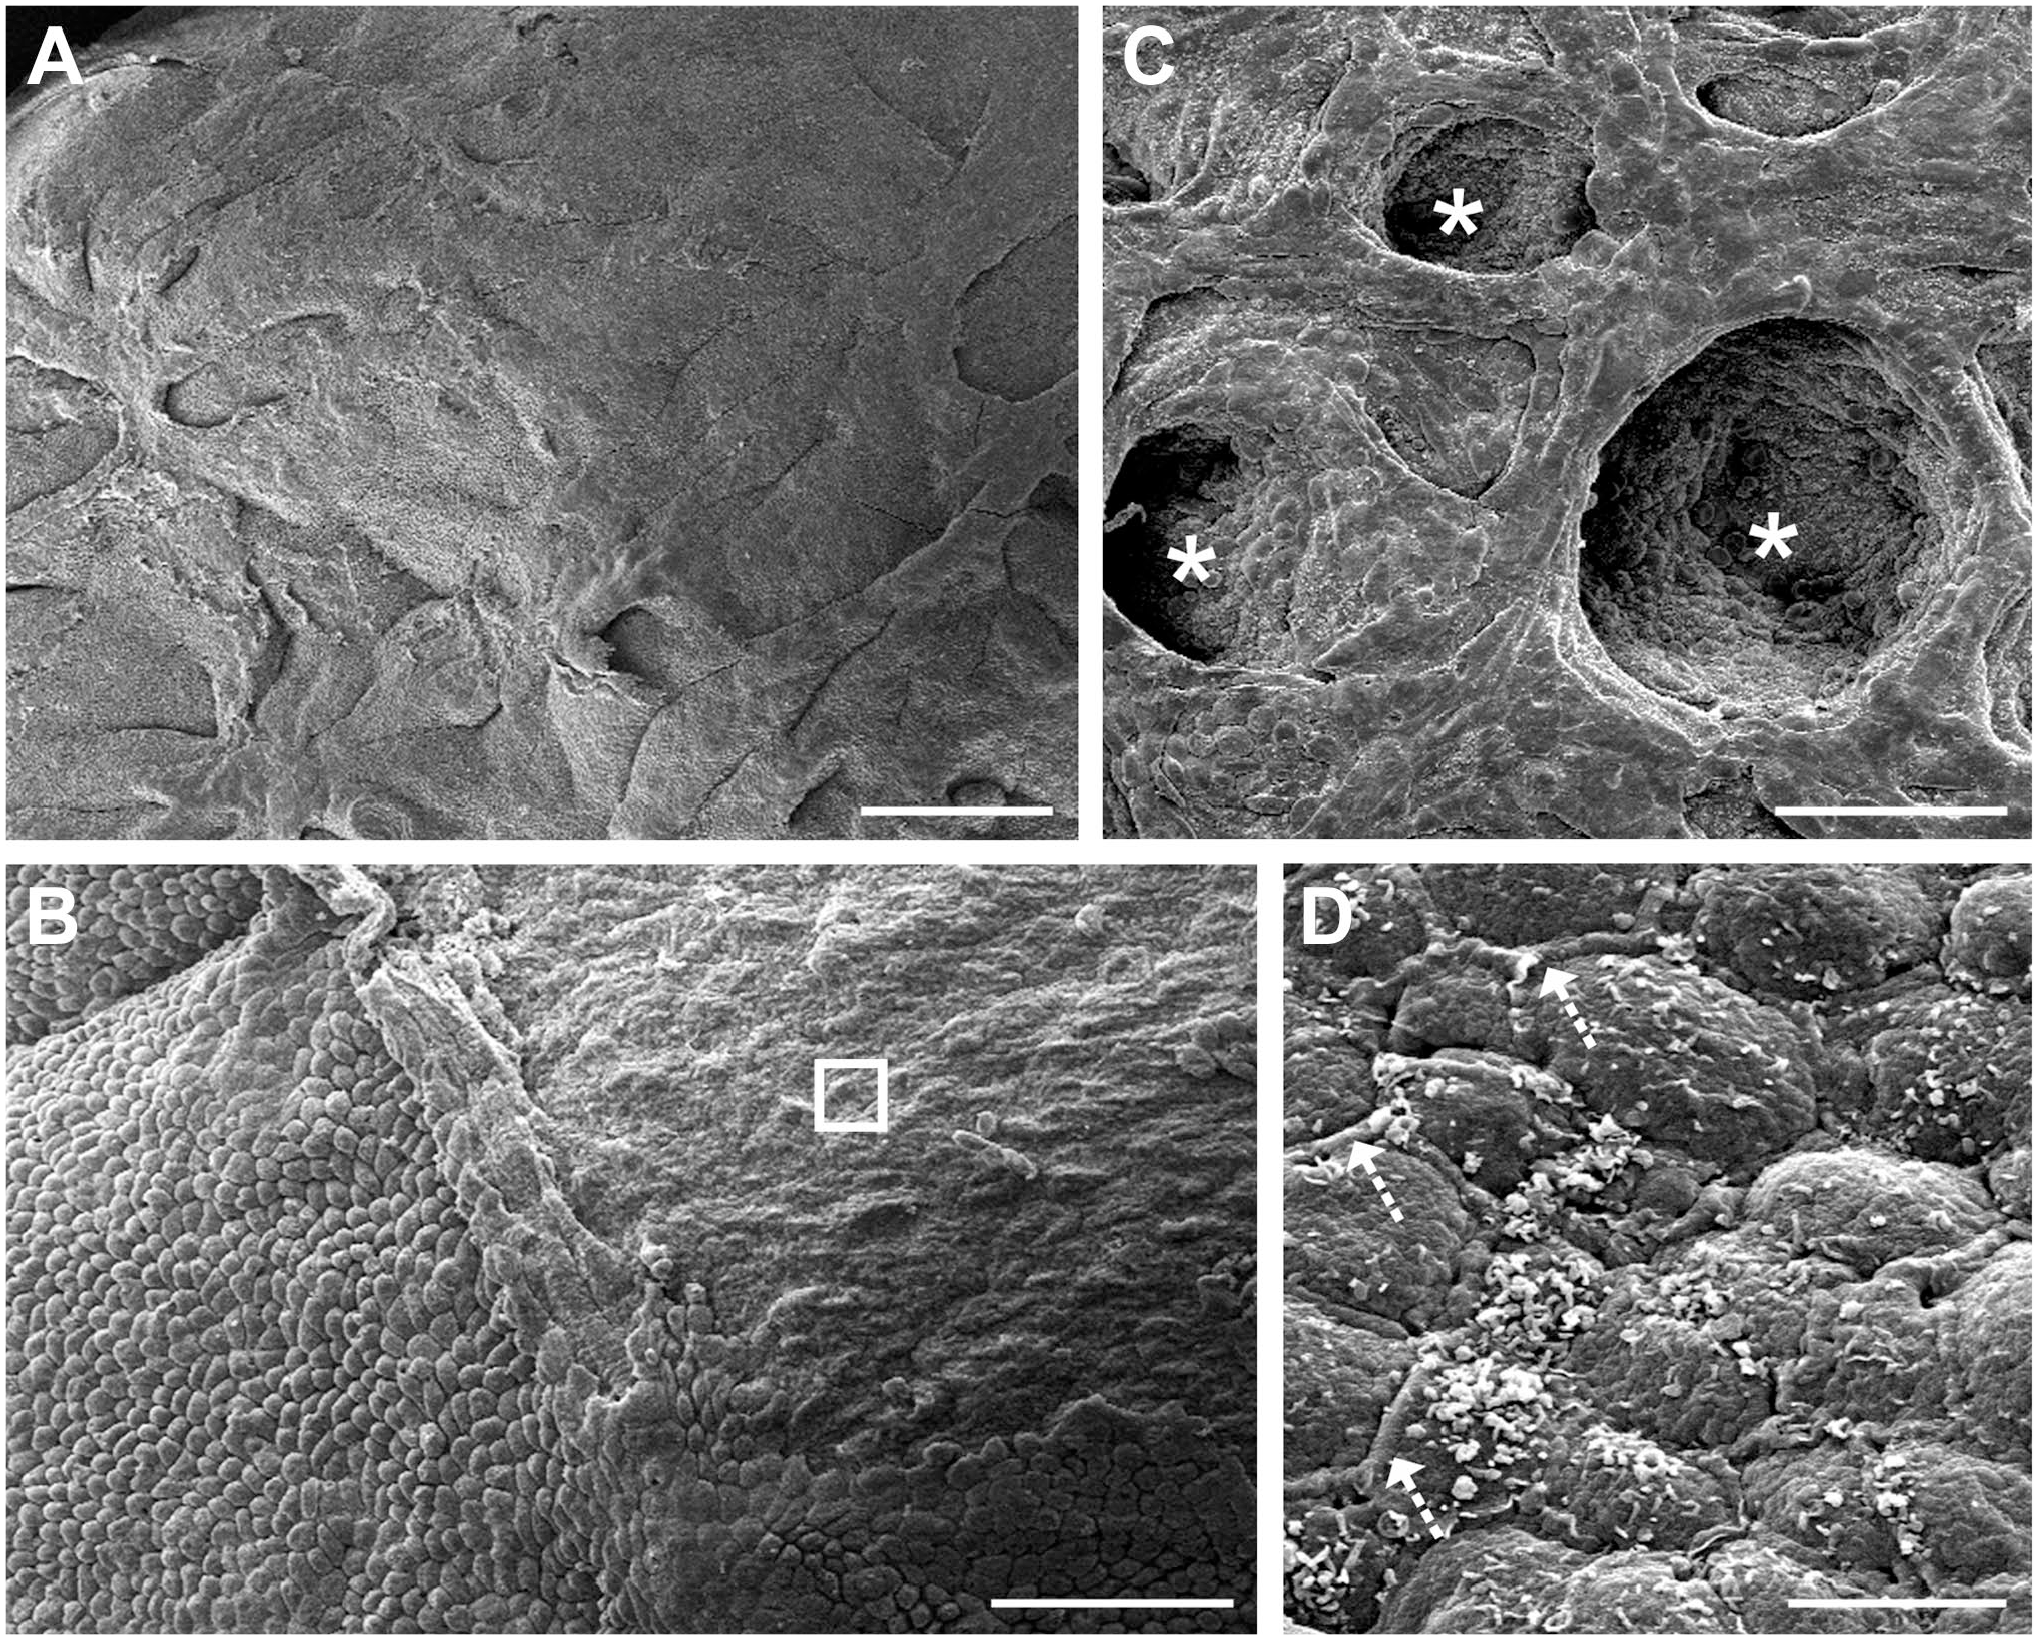
Scanning electron micrographs of the ovarian surface during mid stages of development. (A) The surface of the mid-stage ovary appeared more uneven than in the early stages, with tissue strands and clefts/grooves. (B) Most of the ovary was covered by rounded cells and, sporadically, denuded areas were visible (unfilled square). (C) Flat and deep clefts (asterisk) populated the surface. (D) Extracellular matrix material filled the gaps between cells (dotted line). (A) 144 days, (B) 107 days, (C) 124 days and (D) 101 days of gestation. Scale bars: (A) 200 µm, (B) and (C) 50 µm and (D) 5 µm.
At the late stages, the ovary still had an uneven surface (Fig. 7A, 214 days of gestation). There appeared to be two types of cell shape: rounded cells (Fig. 7B and C, 243 days) and more spindle-shaped cells (Fig. 7B and C, 243 days). Some shallow clefts were observed on the surface (Fig. 7D, 243 days). The surface cells had microvilli (Fig. 7E, 243 days), but there were also areas where the surface of the cells was covered by blebs (Fig. 7F, 214 days).
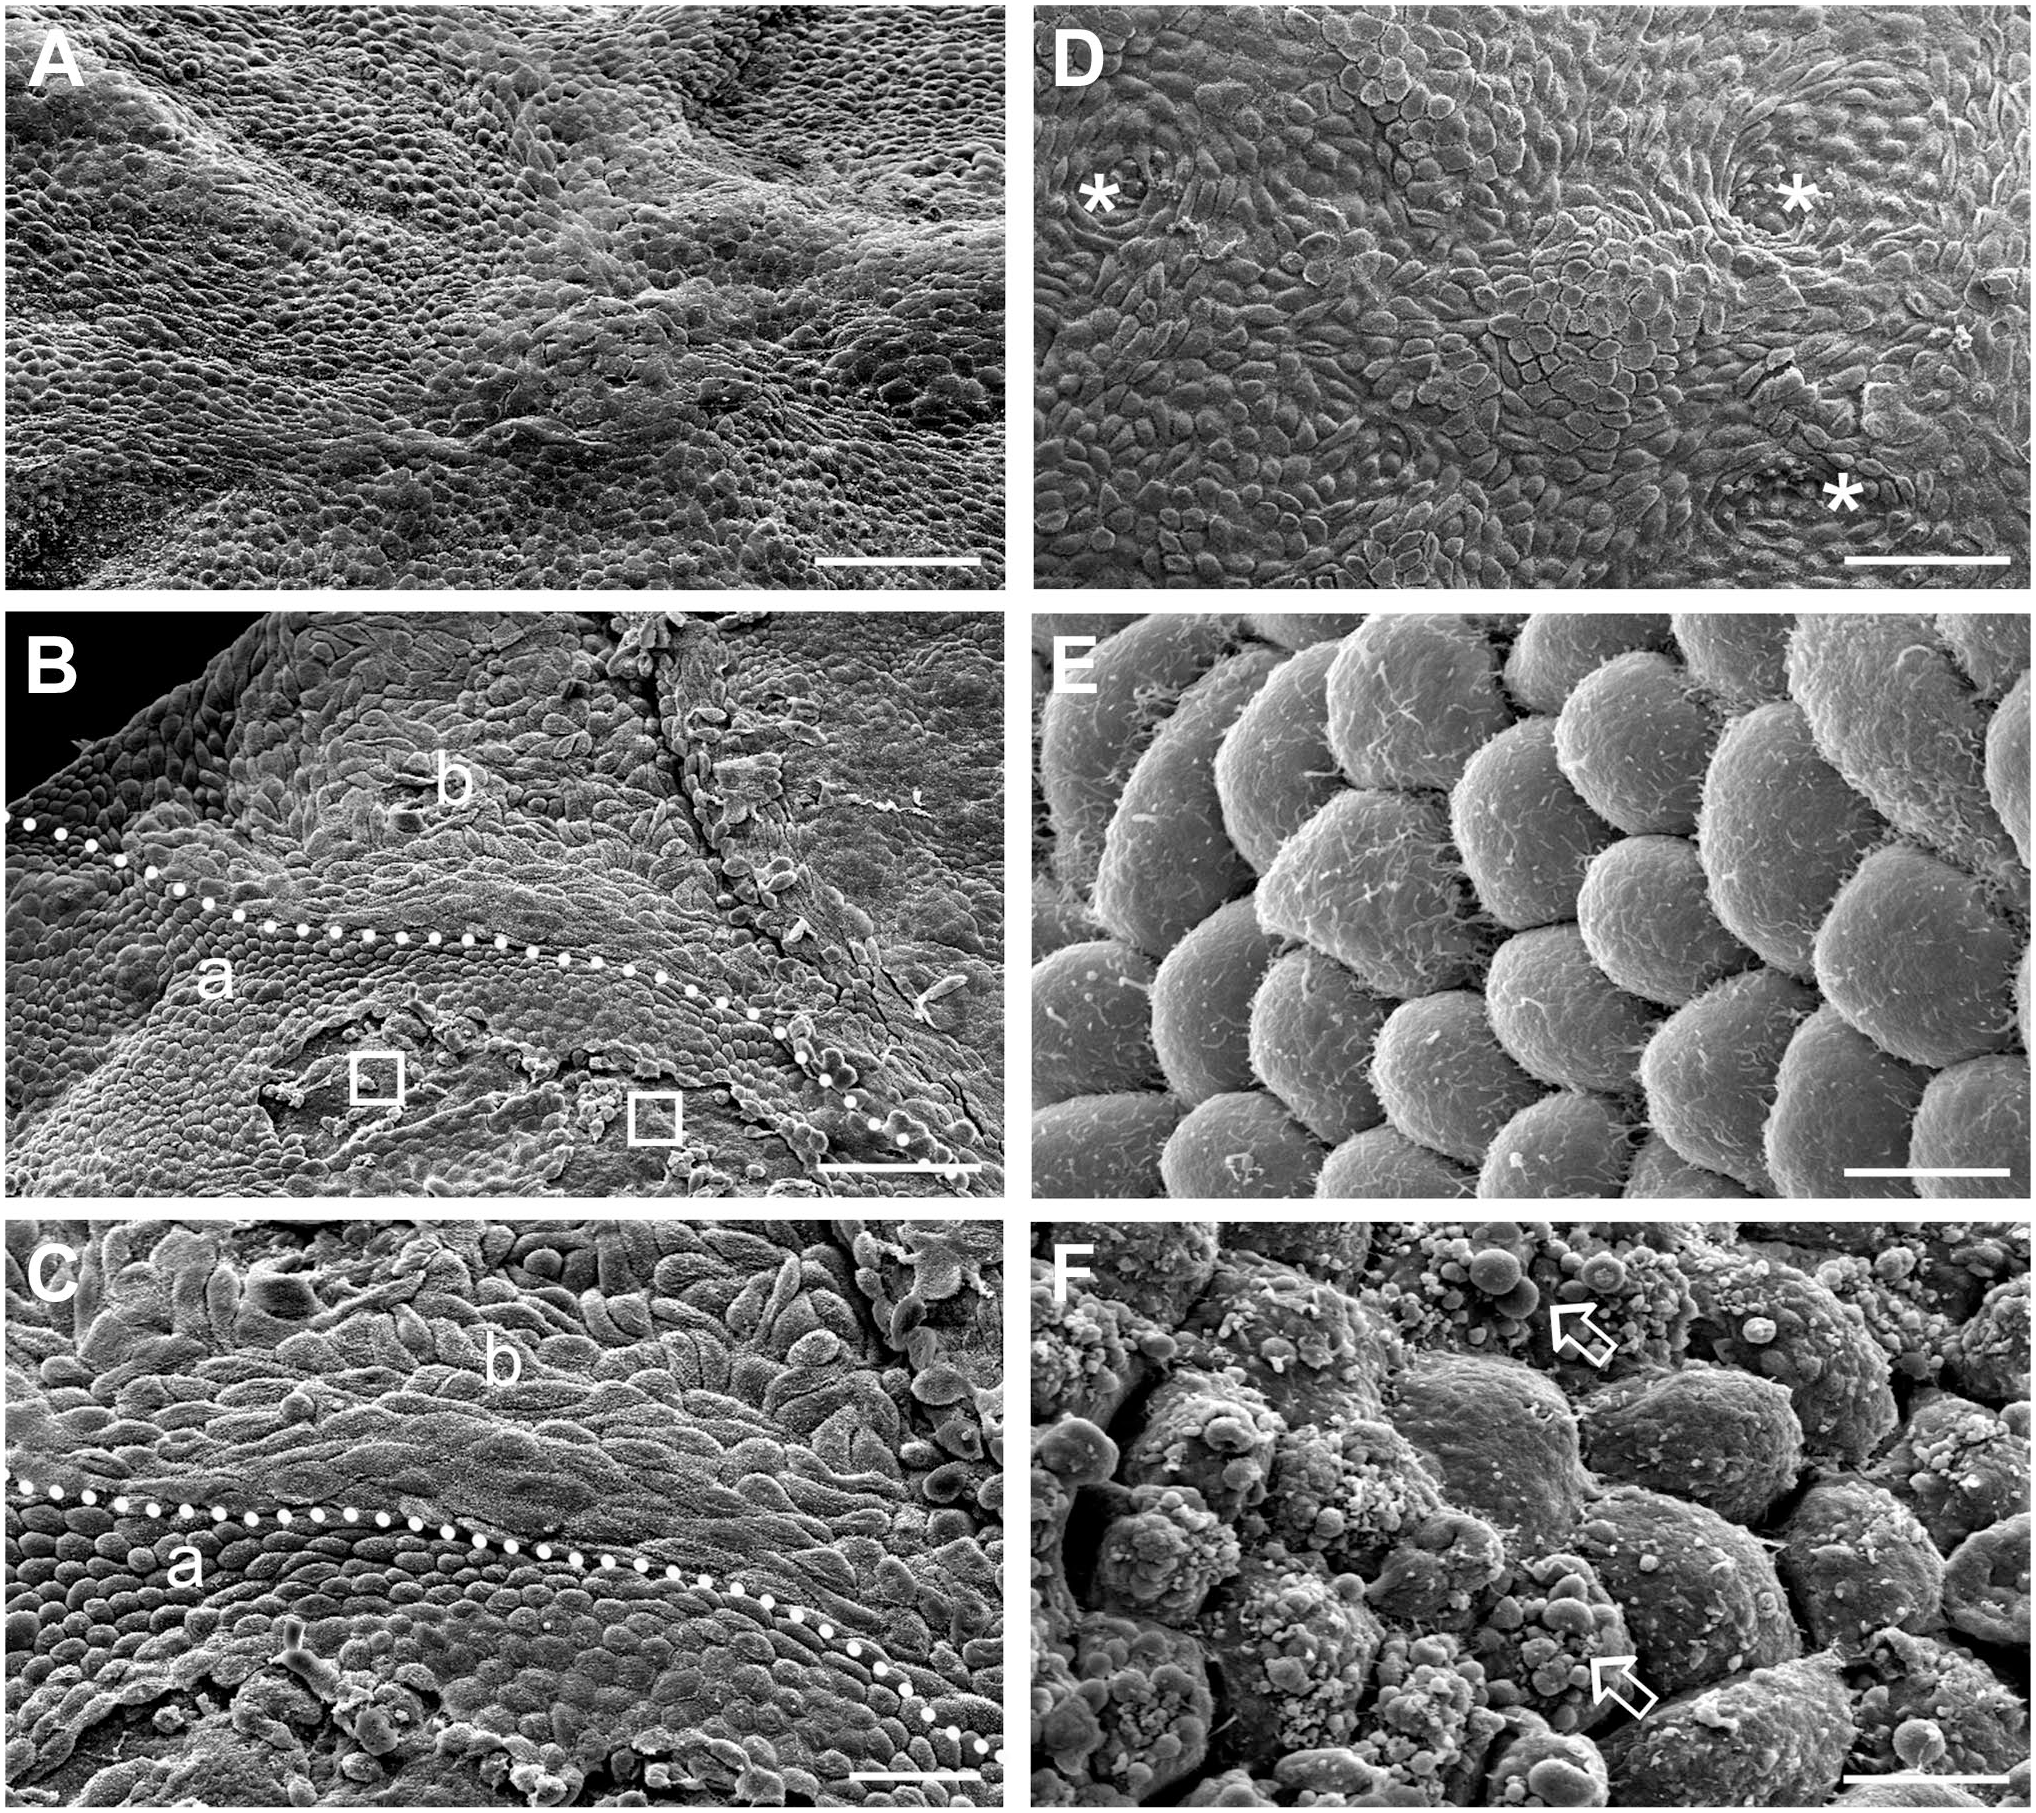
Scanning electron micrographs of the ovarian surface during late stages of development. (A) There were fewer clefts/grooves covering the surface at the late stages. (B, C) The cells on the surface appeared to have different shapes, with areas of rounded cells (a) or more spindle-shaped cells (b). Denuded areas were sporadically visible (unfilled square). (C) Different shaped cells at higher magnification. (D) Shallow clefts were found in some areas. (E) Microvilli were visible on the surface of cells. (F) In some areas, the cells on the surface were covered by blebs (block arrow). (A) and (F) 214 days, (B)—(E) 243 days of gestation. Scale bars: (A), (B) and (D) 50 µm, (C) 20 µm, (E), and (F) 5 µm.
Discussion
This study identified detailed changes occurring on the surface of the ovary throughout gestation by using SEM of the ovarian surface and immunohistochemistry of ovarian cross sections. Immunostaining for CK19 identified the epithelialization of GREL cells on the surface of the ovary. CK19 is a member of a large family of epithelial keratins, which form cytoskeletal intermediate filaments 21 and CK19 is generally expressed in simple epithelia, 22 as occurs on the ovarian surface. CK19 has been observed at low levels in GREL cells in the early stages of ovarian development and at high levels in surface epithelial cells later in the development of bovine ovaries, 3 in adult human ovaries23–25 and in neonatal and adult ovine ovaries. 26 Polyclonal antiserum to laminin 111 was used to visualize the basal laminas in the developing ovary. Basal laminas, when newly formed during fetal development, are often rich in laminins, which are less rigid than later in development when they become cross-linked to type IV collagens via nidogens. 27 The reduced rigidity of laminin-rich basal laminas enables early basal lamina to expand easily during growth. Of the laminin chains, α1, β1, and γ1 are also common in fetal basal laminas. 27 In the fetal ovary, basal laminas occur at the interface of ovigerous cords and surrounding stroma. They also develop beneath the surface epithelium at the interface with stroma. Previously, we identified a number of other components of basal lamina in fetal ovaries, including collagen type IV α1, collagen XVIII, perlecan, and nidogens 1 and 2, and observed the sub-epithelial basal lamina by transmission electron microscopy. 3 The immunohistochemistry of ovarian cross sections that we undertook was valuable in identifying and interpreting the SEM changes in surface topography that occurred during the development of the ovary.
As observed here and previously, when the bovine fetal ovary is first formed it is not covered by an established surface epithelium underlain by a basal lamina at an interface with stroma, as observed in adult ovaries, except at the base or hilum of the ovary.3,16,17 The base or hilum of the ovary is a protrusion of the mesonephros. That part of the ovary is covered by an established classic surface epithelium with a sub-epithelial basal lamina and epithelial-stromal interface and is derived directly from the mesonephros. The remaining major apical part of the ovary is composed of a cluster of GREL cells, which arise from the mesonephric surface epithelium through proliferation in a process that is also associated with degradation of the sub-epithelial basal lamina on the surface of the mesonephros. It is this non-hilum apical part of the ovary that undergoes many changes during fetal development as reported here.
In the current study, in the early stages of ovarian development, GREL cells on the non-hilum surface formed the outmost layer of cells. They formed a compact layer. In an earlier study of bovine fetal ovaries, we showed by electron microscopy that the GREL cells of the outermost layer were connected to each other by adherens junctions. 3 At the mid-stage of ovarian development, germ cells had migrated into the ovary and started proliferating. At the same time, the penetrating stroma, also originating from the mesonephros, started to spread laterally below the ovarian surface. At this point, some germ cells were then trapped on the surface. 3 Germ cells were therefore observed by SEM on the ovarian surface, as had also been observed previously in bovine, 3 human, 28 and murine ovaries. 29 The penetrating stroma did not reach and spread out onto the surface of the ovary but rather spread laterally below, and it could also be speculated that this is because the GREL cells on the surface had formed a barrier with a compact layer of cells connected by adherens junctions.
Clefts and grooves were present on the surface of the ovary giving it an irregular appearance, as observed here by SEM and previously in the human developing ovary. 30 The clefts and grooves are probably related structures, but one is more rounded and the other more elongated. We prefer to use the terms “cleft,” defined as a hollow area or indentation, and “groove,” defined as a long, narrow cut or depression, as these descriptors do not readily imply assumptions about how they are formed. Some other terms, such as “invagination,” ‘folds “furrows” or “sulci,” have previously been used but they imply some mechanism as to how these structures are formed that may not be correct. We observed that the clefts and grooves developed at the opening of the ovigerous cords to the surface of the ovary. These were more common in the non-hilum area of the ovary and became more pronounced from the early to the mid stages. We interpret that clefts first develop, not by invagination of the surface, but rather by stroma, which surrounds the open cords, expanding and thus lifting the surface around each open cord and thus forming a cleft as stylized in Fig. 8. The areas surrounding the clefts then appeared as ridges or papillae under SEM, and as also observed in the developing human ovary. 30 This description is supported by the localization of stroma around the cords and the known substantial expansion that the stroma undergoes during early fetal development of the ovary. 19
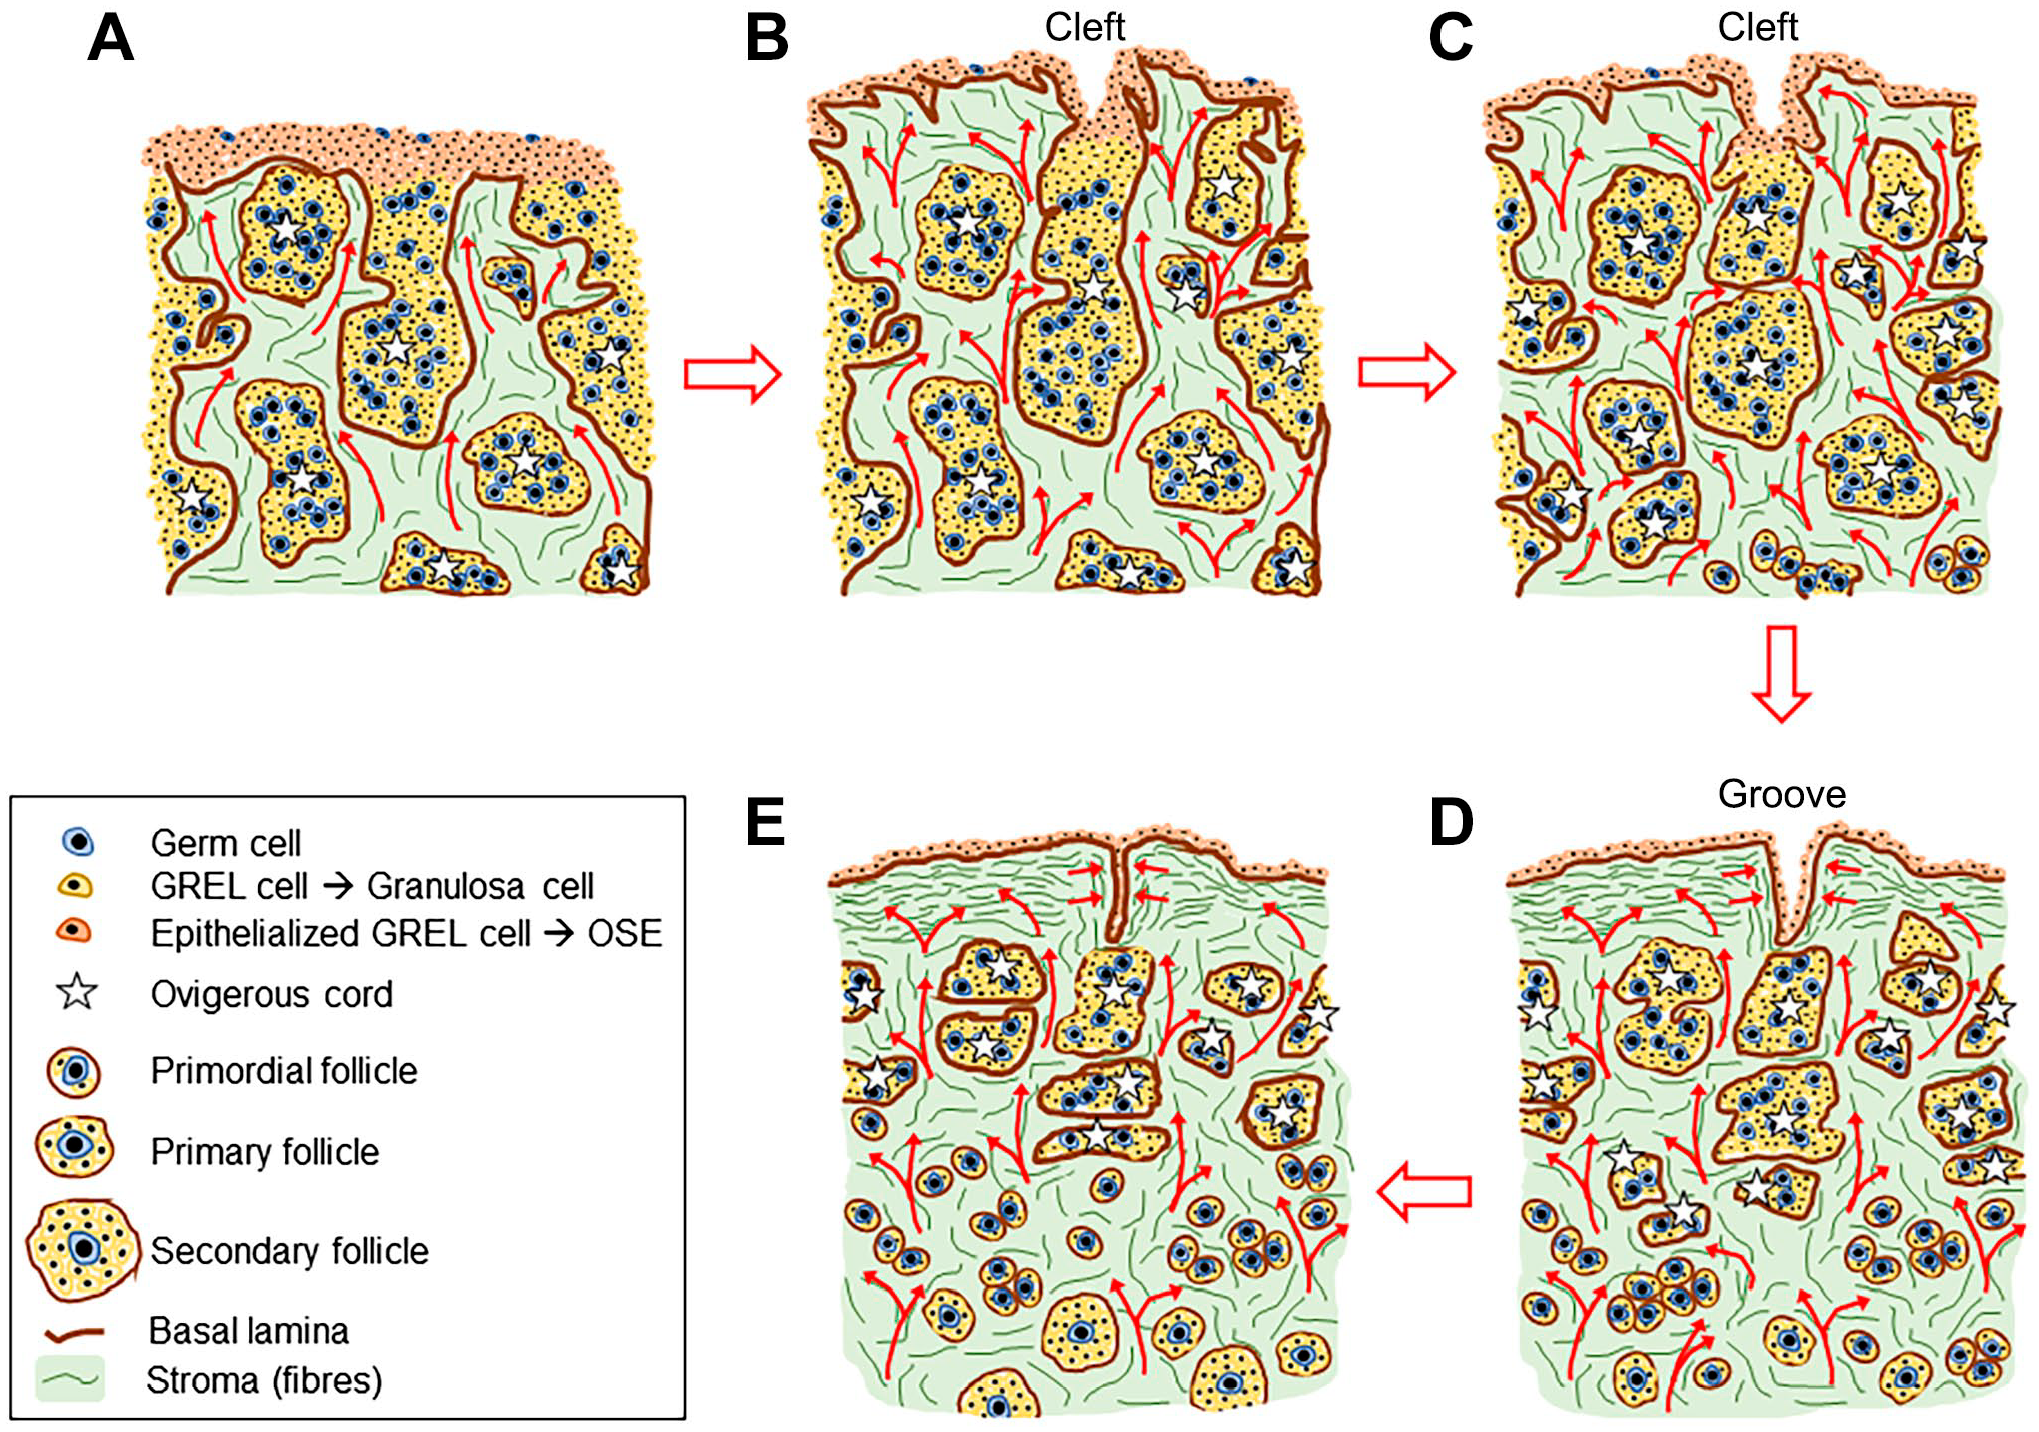
Schematic diagram showing the formation of clefts and grooves on the surface of the ovary. This diagram was assembled from the current data and that published previously.3,17,31,32 (A) GREL cells form the outermost layers of cells on the non-hilum surface of the ovary. Germ cells have migrated into the ovary and started proliferating. Penetrating stroma (arrows) originating from the mesonephros has penetrated the ovary and branched as it did so. This branching process gave rise to alternating areas of stroma and GREL cells/primordial germ cells, with the later known as ovigerous cords (✩). (B) The penetrating stroma did not reach the surface of the ovary, rather, to just below it. It began to spread laterally below the surface, except where the ovigerous cords are open to the surface at this stage. The expansion of stroma surrounding open ovigerous cords (arrows) raised the surface surrounding the openings of ovigerous cords and thus created clefts, each with an opening of a cord at its base. (C) The continued expansion of the stroma leads to a single layer of GREL cells on the surface between the clefts. These cells have epithelized. GREL cells on the sides and bottom of the clefts have epithelized. (D) Continued expansion of the stroma compresses the clefts into the shape of grooves. (E) Eventually the grooves become separated from the surface by the laterally spreading of stroma. This produces a structure similar to an inclusion cyst. What happens to these subsequently is not known but they are rare in adult ovaries. Abbreviation: GREL, gonadal ridge epithelial-like.
During development, the GREL cells on the surface of the ovary began to epithelialize, as seen by the increased intensity of staining for CK19. This occurred once the stroma had penetrated to below the surface, and there was then a sub-epithelial basal lamina and epithelial-stromal interface. At the top of the ovigerous cords open to the surface where clefts formed, the GREL cells inside the clefts and grooves also epithelialized with increased staining for CK19. However, these cells were not in a single layer, as the GREL cells on the wall of the clefts near their opening to the surface also epithelialized. Eventually the clefts appeared to be compressed from their sides as the surrounding stroma expanded, turning them into fissure-shaped grooves, lined with epithelial cells that stained strongly for CK19. Eventually, some of these clusters of epithelial cells appeared to be internalized, as the stroma expanded laterally below the surface leaving a single layer of epithelial cells on the surface underlain by stroma and some islets of epithelial cells surrounded by stroma, situated below the surface. The ultimate fate of these structures is unknown.
The shape of epithelial cells (squamous, cuboidal or columnar) and type of epithelium (simple or stratified) is of interest. Variation of cell shapes has been reported in adult ovarian surfaces of humans33,34 and other mammals. 35 It has been suggested that this variation is due to a result of mechanical deformation of normal cells during ovulation. It is observed that, during ovulation, mouse ovarian surface epithelial cells undergo active proliferation, 36 which is also likely to alter the cell shape. We observed that the GREL cells covering the ovarian surface differentiated into a simple surface epithelium, 3 with most of the surface covered by single layers of cuboidal (81%). These patches or areas covered by multi layers of cuboidal cells (12%) or squamous (7%) cells. We were not able to discern any differences in the stroma beneath any of these areas. Additionally in the current study, only two ovaries out of the 14 examined by immunohistochemistry were missing small proportions (<3%) of surface epithelium and this we regard as an artifact. In some cross-sections, this was confirmed as surface cells were observed to be detaching. It has been reported that denuding of the surface epithelium of the human ovary is due to tissue handling.37,38 Cells on the surface were also observed to have an extracellular matrix (ECM) deposited continuously around each cell and between each other. The cells had microvilli, cilia, and blebs on their antral sides. At this stage, we are not sure if the blebs are real or artifacts, as they were not observed consistently.
In summary, the surface topography of the ovary is largely governed by cellular activities beneath the surface. In adults, the surface is continually altered by expansion and contraction of the follicles and corpora lutea, and cell death and the repair of the tunica and surface epithelium occurs at the point of rupture of the follicle wall during ovulation. In the developing fetal ovary, many of the changes in surface topography also appear to arise by rearrangement of cells below the surface. The penetration of stroma into the ovarian primordium and the lateral expansion of stroma beneath the surface contribute to the formation of an established surface epithelium with a sub-epithelial basal lamina and an epithelial-stromal interface. The early formation of clefts on the ovarian surface appears due to the expansion of stroma surrounding each open ovigerous cord, elevating the areas surrounding each cord, while leaving the opening of the cord to form the base of each cleft. Then the continued expansion of the surrounding stroma below the surface not only closes the ovigerous cords from the surface but appears to compress the clefts into the shape of a groove on the surface. In some cases, this separates the epithelial cells on the walls of the clefts and grooves from the surface entirely to produce a structure similar to an inclusion cyst. Clearly, these studies indicate that the role of stroma may be far more important than hitherto realized.
Supplemental Material
2019-00136R1_Production_Supplemental_Data_online_supp – Supplemental material for Formation of the Bovine Ovarian Surface Epithelium during Fetal Development
Supplemental material, 2019-00136R1_Production_Supplemental_Data_online_supp for Formation of the Bovine Ovarian Surface Epithelium during Fetal Development by Monica D. Hartanti, Katja Hummitzsch, Wendy M. Bonner, Nicole A. Bastian, Helen F. Irving-Rodgers and Raymond J. Rodgers in Journal of Histochemistry & Cytochemistry
Footnotes
Acknowledgements
The authors thank Midfield Meat International for providing the bovine tissues for this research. The authors are also grateful to Dr. Lisa O’Donovan and Ms. Ruth Williams of Adelaide Microscopy for providing training and expertise on the processing of samples for SEM and the use of the Philips XL30 Scanning Electron Microscope.
Competing Interests
The author(s) declared no potential conflicts of interest with respect to the research, authorship, and/or publication of this article.
Author Contributions
M.D.H., K.H., H.F.I.-R. and R.J.R. designed the study on bovine samples. K.H., H.F.I.-R., W.M.B. and N.A.B. collected the bovine samples. M.D.H. carried out the SEM tissue preparation and analyses and M.D.H. K.H., H.F.I.-R., and W.M.B. carried out the immunohistochemistry. M.D.H., K.H., H.F.I.-R. and R.J.R. carried out the data analysis of the bovine samples. M.D.H. drafted the manuscript. K.H., H.F.I.-R. and R.J.R. critically revised and approved the final version of the manuscript.
Funding
The author(s) disclosed receipt of the following financial support for the research, authorship, and/or publication of this article: The research was funded by an Australia Awards Scholarship from the Australian Government, The University of Adelaide, the National Health and Medical Research Council of Australia, the NHMRC Center for Research Excellence in the Evaluation, Management and Health Care Needs of Polycystic Ovary Syndrome.
References
Supplementary Material
Please find the following supplemental material available below.
For Open Access articles published under a Creative Commons License, all supplemental material carries the same license as the article it is associated with.
For non-Open Access articles published, all supplemental material carries a non-exclusive license, and permission requests for re-use of supplemental material or any part of supplemental material shall be sent directly to the copyright owner as specified in the copyright notice associated with the article.