
Abstract
Although the osmium maceration method has been used to observe three-dimensional (3D) structures of membranous cell organelles with scanning electron microscopy (SEM), the use of osmium tetroxide for membrane fixation and the removal of cytosolic soluble proteins largely impairs the antigenicity of molecules in the specimens. In the present study, we developed a novel method to combine cryosectioning with the maceration method for correlative immunocytochemical analysis. We first immunocytochemically stained a semi-thin cryosection cut from a pituitary tissue block with a cryo-ultramicrotome, according to the Tokuyasu method, before preparing an osmium-macerated specimen from the remaining tissue block. Correlative microscopy was performed by observing the same area between the immunostained section and the adjacent face of the tissue block. Using this correlative method, we could accurately identify the gonadotropes of pituitary glands in various experimental conditions with SEM. At 4 weeks after castration, dilated cisternae of rough endoplasmic reticulum (RER) were distributed throughout the cytoplasm. On the other hand, an extremely dilated cisterna of the RER occupied the large region of the cytoplasm at 12 weeks after castration. This novel method has the potential to analyze the relationship between the distribution of functional molecules and the 3D ultrastructure in different composite tissues.
Keywords
Introduction
Scanning electron microscopy (SEM) has been widely used in biomedical fields for analyzing the three-dimensional (3D) surface structure of cells and tissues because of its long focal depth. The osmium maceration method developed by Tanaka and colleagues [i.e., the osmium–dimethyl sulfoxide (DMSO)–osmium method (Tanaka and Naguro 1981) and aldehyde–osmium–DMSO–osmium method (Tanaka and Mitsushima 1984)] further enabled us to observe intracellular membranous cell organelles, such as mitochondria, endoplasmic reticulum (ER) and Golgi apparatus, directly by SEM. By removing cytoplasmic soluble proteins from the freeze-cracked surface of cells with a diluted osmium tetroxide (OsO4) solution, the 3D ultrastructure of the remaining fixed membranes of these cell organelles could be observed in detail (Hanaki et al. 1985; Tanaka et al. 1986; Lea and Hollenberg 1989; Tanaka and Fukudome 1991; Isola et al. 2010). We recently visualized the 3D structure of the Golgi apparatus in different cell types by observing osmium-macerated tissues with ultra-high-resolution SEM (Koga and Ushiki 2006). The osmium maceration technique can also be applied to observe the intracellular architecture of cultured and free cells by embedding the cells in low-melting-point agarose (Koga et al. 2012).
To date, we have paid particular attention to pituitary gonadotropes. We have demonstrated that the shape of the Golgi apparatus is spherical using immunocytochemistry, both at the light and electron microscopic levels, and through visualization of osmium-macerated pituitary tissues by SEM (Koga and Ushiki 2006; Watanabe et al. 2012). In these studies, we frequently encountered difficulties in the identification of gonadotropes on the osmium-macerated specimens of pituitary tissues using SEM. The anterior pituitary gland (adenohypophysis) is composed of five distinct types of hormone-producing cells: somatotropes, mammotropes, gonadotropes, corticotropes and thyrotropes. In spite of the advantages of the osmium maceration methods for observing the membranous cell organelles by SEM, there remain difficulties in identifying the target gonadotropes in composite pituitary tissues because appropriate methods for immunocytochemical labeling of the specimens for SEM have scarcely been established so far.
To overcome this problem, we attempted in the present study to develop a novel method that can correlate findings by immunocytochemistry at the light microscopic level with those observed with high-resolution SEM. We combined the cryosectioning technique developed by Tokuyasu (1973) with the osmium maceration method described above. Tokuyasu (1973, 1986, 1989) applied a high-molar sucrose solution or a mixture of polyvinylpyrrolidone (PVP) and high molar sucrose solution to prevent ice-crystal formation within specimens, and saw good preservation of both the ultrastructure and antigenicity on the ultrathin cryosections of the specimens. Many studies have since reported using ultrathin cryosections prepared by the Tokuyasu method (van Donselaar et al. 2007; Koike et al. 2013; Bos et al. 2014), but this method has not been applied to SEM.
In the present study, we first immunocytochemically stained a semi-thin cryosection cut from a cryoprotected frozen pituitary tissue block with a cryo-ultramicrotome, according to the Tokuyasu method, and then prepared an osmium-macerated specimen from the remaining tissue block. We identified the location of target gonadotropes in an observational field of a pituitary tissue section by immunocytochemical labeling. The remaining block of the pituitary tissue was then macerated with a diluted OsO4 solution and the 3D ultrastructure of the target gonadotropes observed by SEM. Based on the results, we discuss the possible application of this correlative observation method using immunocytochemistry and SEM.
Materials & Methods
Antibodies
A mouse monoclonal anti-Binding immunoglobulin protein (BiP) antibody was purchased from BD Biosciences (San Jose, CA). A sheep polyclonal anti-rat TGN38 antibody (abD Serotec, Oxford, UK) was also used for immunofluorescence microscopy. Gonadotropes were identified with a rabbit polyclonal anti-rat luteinizing hormone (LH) antibody (kindly provided by Dr. Matozaki, Gunma University). Secondary antibodies conjugated with fluorescent dyes (Alexa Fluor 488-labeled donkey polyclonal anti-rabbit IgG; Alexa Fluor 594-labeled donkey polyclonal anti-sheep IgG; Alexa Fluor 647-labeled donkey polyclonal anti-mouse IgG) were purchased from Invitrogen (Carlsbad, CA).
Animals
Hypertrophic changes to pituitary gonadotropes after castration have been thoroughly described in previous studies (Addison 1917; Ellison and Wolfe 1934; Farquhar and Rinehart 1954; Costoff 1973). Typical cell changes include dilated rough endoplasmic reticulum (RER) several weeks after castration, and a signet-ring appearance, observed several months after castration. Based on the background of these previous studies, we divided rats in the present study into three experimental groups—control, 4 weeks after castration, and 12 weeks after castration—to examine the dynamic morphological changes to gonadotropes by the conventional and newly developed methods. Eighteen adult male Wistar rats, purchased at 6 weeks of age, were divided into the three experimental groups and housed for 2 weeks in a well-ventilated room with access to food and water ad libitum. At 8 weeks of age, rats from two groups (n=6 each) were bilaterally gonadectomized through a scrotal incision (castration) under anesthesia with pentobarbital sodium, and further maintained for 4 or 12 weeks before experimental use, as described below. Rats from the other group (n=6) were used directly for experiments as controls at 8 weeks of age. These animal experiments were reviewed by the Committee of the Ethics on Animal Experiments in Niigata University and carried out under the control of the Guideline for Animal Experiment in Niigata University (No. 209-3).
Conventional Preparation Procedures of the Osmium Maceration Method
As described previously (Koga and Ushiki 2006), the animals (3 per experimental group), anesthetized with pentobarbital sodium, were perfused through the ascending aorta with physiological saline followed by a mixture of 0.5% glutaraldehyde and 0.5% paraformaldehyde in 0.1 M phosphate buffer (PB, pH 7.4). The pituitaries were excised from the animals and further fixed with 1% OsO4 in 0.1 M PB for 1 hr. After rinsing with buffer solution (10 min, 6 times), the specimens were immersed in 25% and 50% DMSO in distilled water for 30 min each. The specimens were then frozen on a flat aluminum block that had been precooled with liquid nitrogen in a vacuum bottle and broken into two pieces with a screw driver and hammer. The split pieces were immediately placed in 50% DMSO solution for thawing at room temperature and rinsed in the buffer solution until the DMSO had been completely removed. For removal of the cytoplasmic matrix, the specimens were immersed in 0.1% OsO4 in 0.1 M PB for 96 hr at 20°C. The macerated specimens were further fixed in 1% OsO4 (0.1 M PB) for 1 hr, washed in 0.1 M PB for 1 hr, conductive stained with 1% tannic acid (Nacalai Tesque, Kyoto, Japan) for 1 hr, rinsed in buffer solution for 1 hr, and placed in 1% OsO4 in 0.1M PB for 1 hr. The specimens were dehydrated through a graded ethanol series, substituted with isoamyl acetate and dried in a critical point dryer (HCP-2; Hitachi, Tokyo, Japan). The dried specimens were mounted onto a metal plate with silver paste and coated lightly (2–3 nm) with platinum–palladium in an ion-sputter coater (E1010; Hitachi). Finally, they were observed in an in-lens-type field emission scanning electron microscope (S5000; Hitachi) at an accelerating voltage of 5 kV.
Immunofluorescence Microscopy of Semi-Ultrathin Cryosections
Before removing cytosol from the tissue block with a diluted OsO4 solution, we immersed fixed pituitary tissues in concentrated sucrose solutions and then froze them for cryosectioning, according to the Tokuyasu method. To minimize damage to the membranous organelles, the method originally described by Tokuyasu (1973) was partially modified as follows.
The animals (3 per experimental group), anesthetized with pentobarbital sodium, were perfused through the ascending aorta with physiological saline followed by a mixture of 0.5% glutaraldehyde and 0.5% paraformaldehyde in 0.1 M PB, pH 7.4. The pituitaries were then excised, cut into small pieces and further fixed in the same fixative for 1 hr at 4°C. After the pituitary tissue blocks were rinsed in 0.1 M PB for 10 min at 4°C, they were immersed sequentially in 0.4, 0.9, 1.5 and 2.3 M sucrose, and finally in a mixture of 20% PVP and 1.84 M sucrose solution for cryoprotection (3 hr each, 20°C). For cryosectioning, one of the specimens was placed on a mounting block, quickly frozen in liquid nitrogen and thereafter placed into a cryochamber (EM FC7; Leica Microsystems, Nussloch, Germany) attached to an ultramicrotome (Ultracut EM UC7; Leica Microsystems). From the frozen pituitary tissue block, a 1-μm-thick semi-thin cryosection was cut with a glass knife at -65 to -75°C in the low-temperature sectioning system. The tissue section was picked up with a 2.3-M sucrose droplet on a 2-mm diameter wire loop and mounted on a glass microscope slide. The tissue section was then rinsed with phosphate-buffered saline (PBS) for 10 min at 20°C and incubated with 2% normal donkey serum for 30 min at 20°C. The section was incubated with a mixture of primary antibodies of different species (mouse, sheep or rabbit origin) for 12 hr at 20°C, rinsed with PBS (3 min, 3 times) and subsequently incubated with a mixture of appropriate sets of Alexa Fluor 488-, 594- and 647-labeled secondary antibodies (1 hr, 20°C). After the section was rinsed with PBS (3 min, 3 times), a coverslip was mounted on the tissue section in 90% glycerol (v/v in PBS) containing 0.1% p-phenylenediamine dihydrochloride (Sigma-Aldrich; St. Louis, MO) and 4′,6-diamidino-2-phenylindole (DAPI; Sigma-Aldrich). The immunostained section was observed with a confocal laser scanning microscope (LSM 710; Carl Zeiss Microscopy GmbH, Jena, Germany).
SEM of the Osmium-Macerated Tissue Adjacent to a Cryosection
After cutting a semi-thin cryosection for immunofluorescence microscopy, as described above, the remaining tissue block with a mirror face adjacent to the immunostained section was removed from the cryochamber of the low-temperature sectioning system and was immersed again in 2.3 M sucrose for thawing. The thawed tissue block was thoroughly rinsed in 0.1 M PB for 24 hr until the cryoprotectant had been completely removed. The tissue block was then fixed with 1% OsO4 in 0.1 M PB. For cell maceration, the block was further immersed in 0.1% OsO4 for 96 hr at 20°C. The tissue block was subsequently fixed with 1% OsO4 for 1 hr at 4°C, rinsed in 0.1 M PB for 1 hr, treated with 0.5% tannic acid solution for 1 hr at 20°C, washed in 0.1 M PB for 1 hr and immersed again in 1% OsO4 in 0.1 M PB for 1 hr at 4°C. The specimens were dehydrated through a graded ethanol series, transferred to isoamyl acetate and dried in a critical point dryer with liquid CO2. After the face of the specimen adjacent to the immunostained tissue section was checked under a dissecting microscope, dried specimens were mounted on aluminum stubs with silver paste and coated lightly (<3 nm) with platinum and palladium in an ion-sputter coater. They were observed in a Hitachi S5000 in-lens-type field emission scanning electron microscope at an accelerating voltage of 5 kV. The correlative microscopy was performed by observing the same area between the immunostained section and the adjacent face of the tissue block. The procedures are schematically summarized in Fig. 1A. Macroscopic images of the immunostained section and the adjacent face of the tissue block were taken by confocal laser scanning microscopy (CLSM) and SEM, respectively (Fig. 1B and 1C). The location of the target cell was subsequently mapped on the SEM image of the tissue block by referring to the immunostained section image. Low and high magnification images of the target cell mapped on the tissue block were photographed by SEM. Light microscopy images of the same area of the immunostained section adjacent to the tissue block were also taken by CLSM.
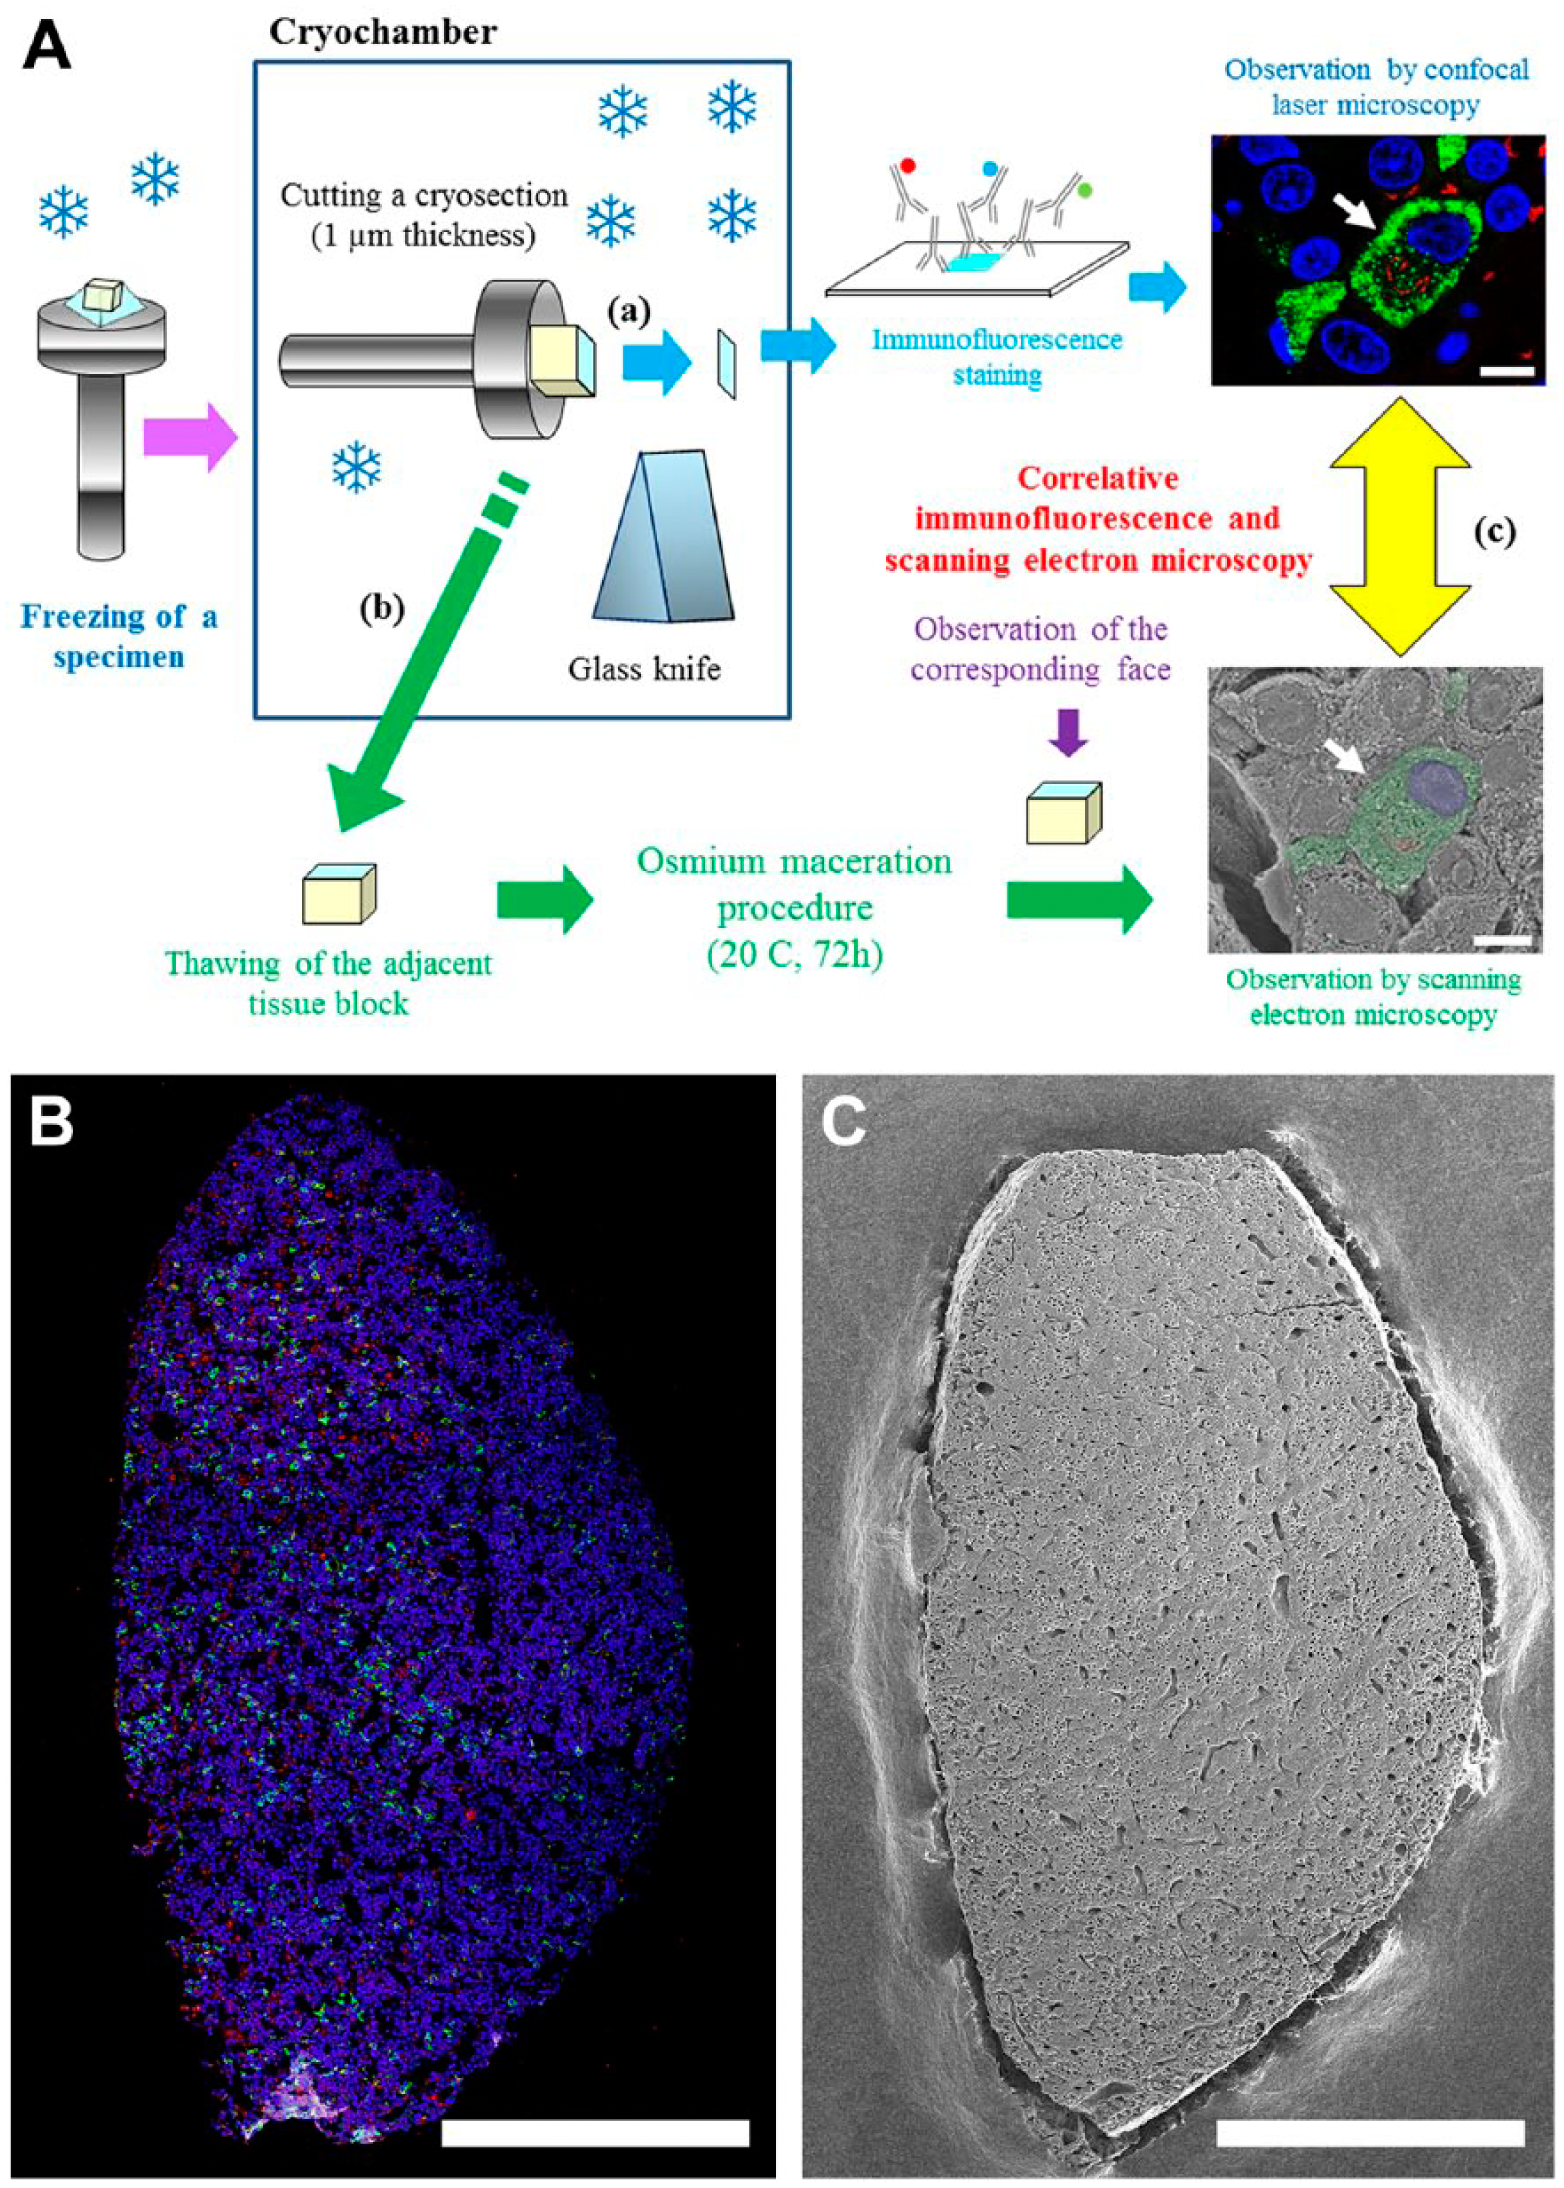
Workflow of the correlation between immunofluorescence and SEM. (A) A semi-thin cryosection of 1-μm thickness was cut with a glass knife at -65 to -75°C in the low-temperature sectioning system. The tissue section mounted on a microscopic glass slide was immunostained with a mixture of primary antibodies of different species and appropriate secondary antibodies conjugated with fluorescent dyes (a). After cutting a semi-thin cryosection for immunofluorescence microscopy, the remaining tissue block with a mirror face adjacent to the immunostained section was removed from the cryochamber and immersed in 2.3 M sucrose for thawing (b). The thawed tissue block was then processed for osmium maceration. Correlative immunofluorescence and SEM were performed by taking micrographs of an identified region on the same specimen (c). (B, C) Two correlative images of an identical specimen. (B) Semi-thin section of the anterior pituitary gland immunostained simultaneously with sheep polyclonal anti-TGN 38 (red pseudocolor) and rabbit polyclonal ant-LH (green) antibodies. Nuclei are stained with DAPI (blue). (C) SEM image of the osmium-macerated tissue block adjacent to the immunostained tissue section. Scale (A, part c) 5 μm; (B, C) 500 μm.
Results
Correlation between Immunocytochemically Stained Tissue Sections and Osmium-Macerated Tissue Specimens for SEM (Gonadotropes in the Control Rat)
Gonadotropes on the semi-thin sections of the pituitary tissue, prepared according to the Tokuyasu method, were easily identified by immunocytochemical staining with an anti-LH antibody (Fig. 2A). Simultaneous nuclear staining with DAPI clearly indicated the arrangement of the surrounding cells in the field of observation and enabled us to find the corresponding area on the adjacent face of the osmium-macerated specimen for observation by SEM.
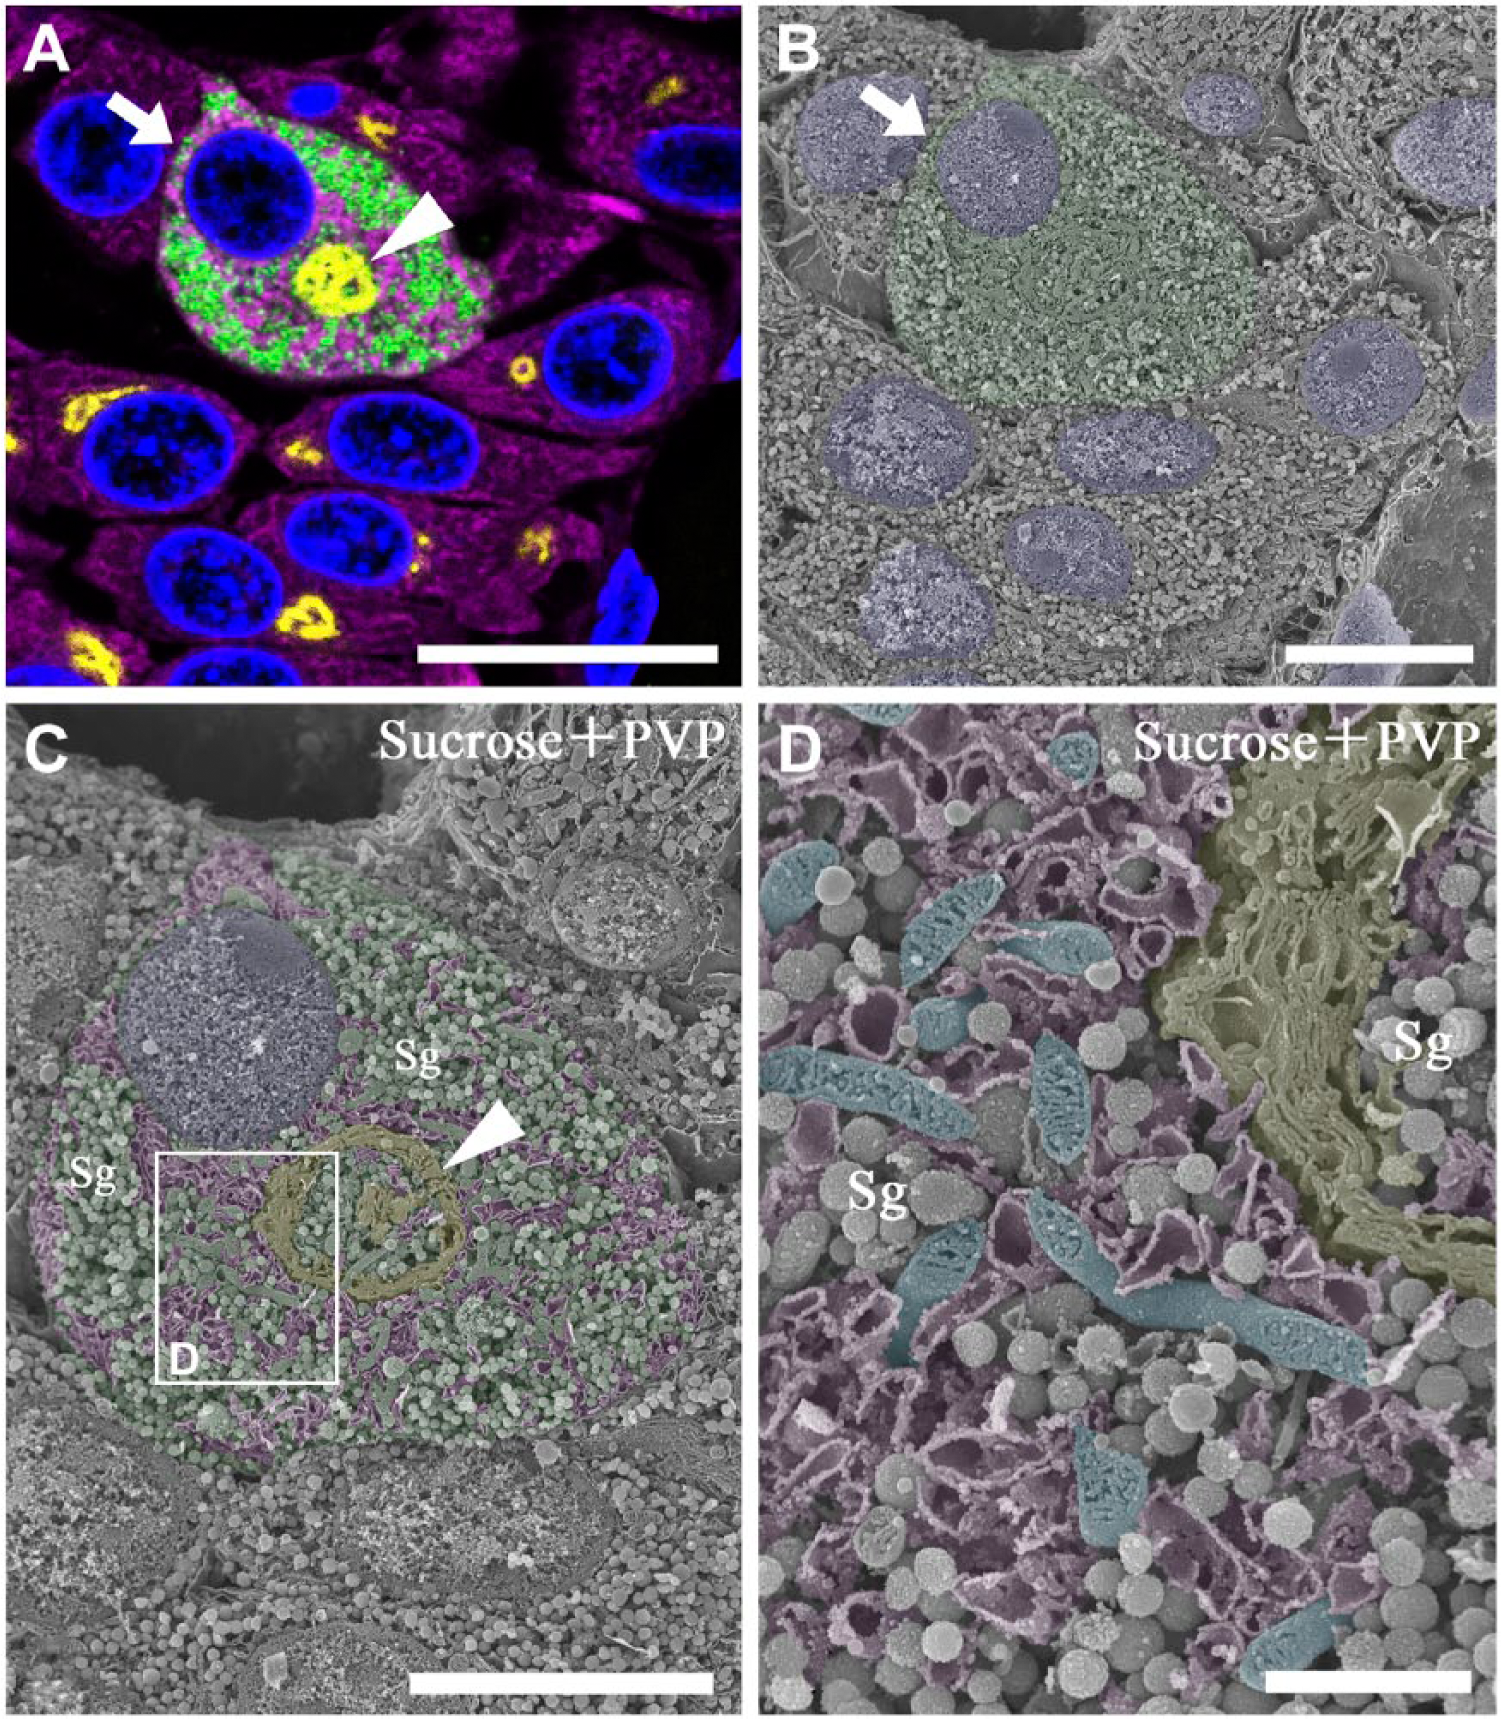
Correlative immunofluorescence and SEM of a gonadotrope in the anterior pituitary gland of a control male rat. (A) Semi-thin section (1-µm thick) of the anterior pituitary gland immunostained simultaneously with sheep polyclonal anti-TGN38 (yellow pseudocolor), rabbit polyclonal anti-LH (green) and mouse monoclonal anti-BiP (magenta) antibodies. Nuclei were stained with DAPI (blue). A circular profile of the Golgi apparatus (arrowhead) is observed in the gonadotrope. (B) Scanning electron micrograph of the identical area on the osmium-macerated block adjacent to the immunostained tissue section demonstrated in (A). The gonadotrope identified immunocytochemically on the adjacent tissue section is colored green, and two of the corresponding profiles of the identical gonadotropes are indicated with arrows (A, B). (C) The gonadotrope indicated with the arrows in (A) and (B) is observed by SEM at a higher magnification. The Golgi apparatus, rough endoplasmic reticulum (RER), cytoplasm, and nucleus are separately colored with yellow, magenta, green and blue pseudocolors, respectively. The cytoplasm is filled with a large number of secretory granules (Sg). The boxed area indicated with the white line is enlarged and shown in (D). (D) Closer view of the gonadotrope identified in (A). Note that slightly dilated cisternae of the RER are anastomosed and form a complicated tubular network (colored purple) in the gonadotrope. Rod-shaped mitochondria with plate-like cristae (colored cyan) and a part of the Golgi apparatus (colored yellow) are also observed in this area. Scale (A) 10 μm; (B, C) 5 μm; (D) 1 μm.
The semi-thin sections were also immunocytochemically stained with antibodies for the Golgi-associated protein, TGN38, and the representative endoplasmic reticulum (ER) chaperone, BiP (Fig. 2A). The intracellular distributions of these organelle markers on the immunostained tissue section corresponded to the locations of the Golgi apparatus and RER in the identical cells observed on the adjacent face of the osmium-macerated tissue block (Fig. 2B).
By visualizing the osmium-macerated pituitary tissue at a higher magnification, the circular profile of the spherical Golgi apparatus could be observed at the center of the identified gonadotrope (Fig. 2C). The Golgi apparatus had several cisternae, which were piled up in layers (Fig. 2D; indicated by yellow pseudocolor). The cisternae of the RER were dilated and formed a complicated tubular network to connect each other (Fig. 2C, 2D; indicated by purple pseudocolor). A large number of secretory granules filled the cytoplasmic space that was coincident with the area of the adjacent pituitary tissue section immunostained intensely with anti-LH antibody. Rod-shaped mitochondria with numerous plate-like cristae in the matrix space were observed in the cytoplasm (Fig. 2D; indicated by blue pseudocolor). Thus, the ultrastructure of the gonadotrope identified by immunocytochemical labeling on a pituitary tissue section was observed by SEM three-dimensionally and in detail on the osmium-macerated specimen.
SEM of Conventional Osmium-Macerated Tissues (Gonadotropes at 4 Weeks and 12 Weeks after Castration)
Some pituitary gonadotropes stimulated after castration are easily identified by EM without immunocytochemical staining because of the ultrastructural changes extensively described in previous studies (Farquhar and Rinehart 1954; Costoff 1973). By SEM observation of the conventional osmium-macerated specimens, stimulated gonadotropes could be identified typically at 4 weeks (Fig. 3A) and 12 weeks (Fig. 3B) after castration, based on the numerous profiles of the dilated RER throughout the cytoplasm (Fig. 3A; painted in purple pseudocolor) and the characteristic signet-ring appearance due to the extremely dilated cavity of the RER (Fig. 3B; star). These ultrastructural features of stimulated gonadotropes identified by SEM were consistent with those seen previously using transmission EM (TEM) (Farquhar and Rinehart 1954; Costoff 1973).
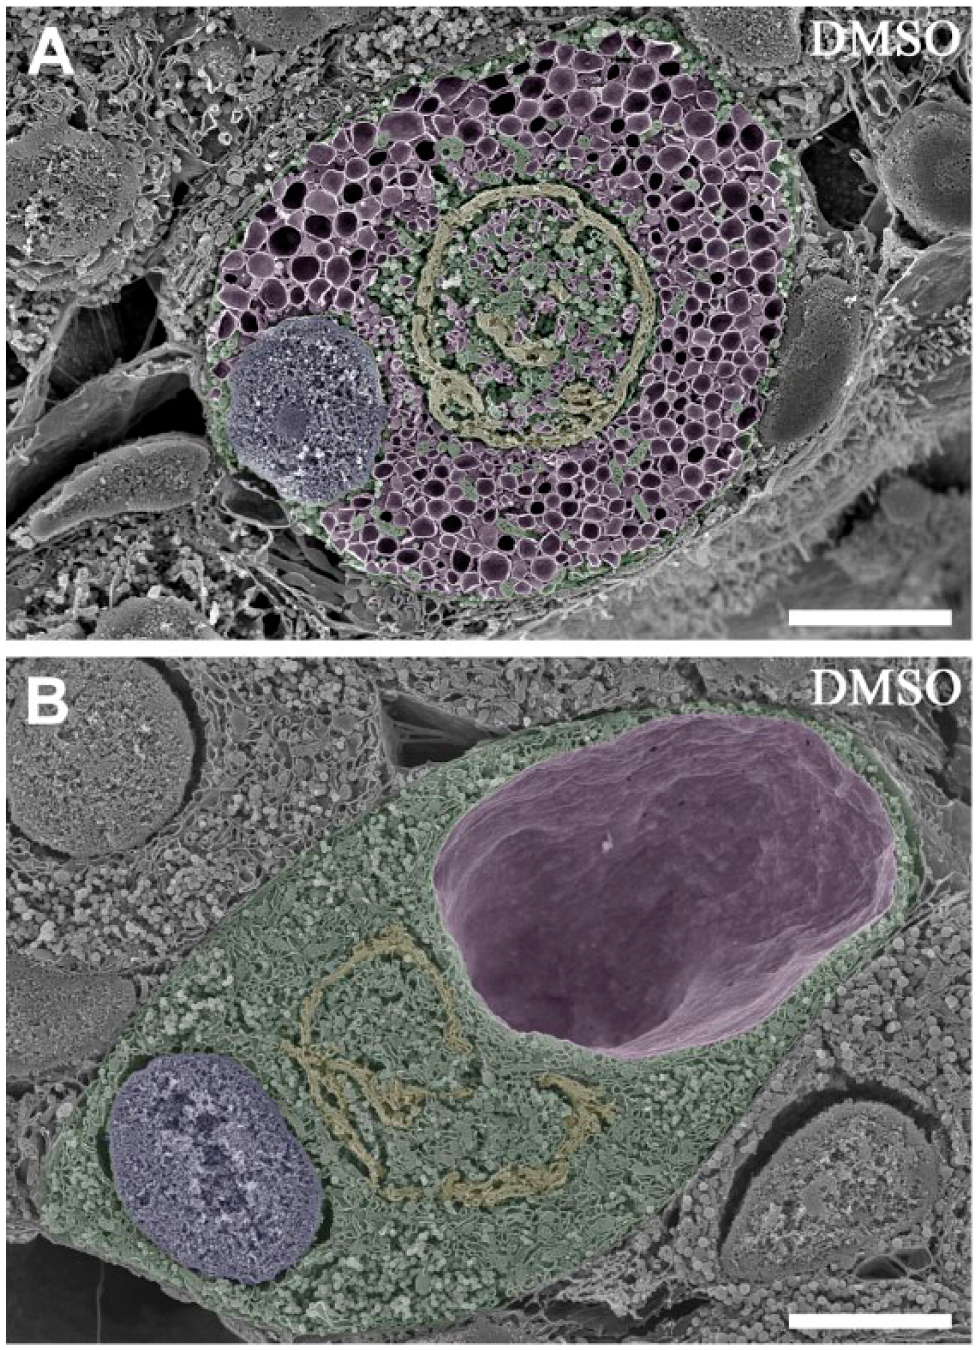
Scanning electron micrographs of the rat pituitary gonadotropes stimulated after castration observed in the conventional osmium-macerated tissue specimens. (A) A typical gonadotrope stimulated for 4 weeks after castration (colored green). The well-developed spherical Golgi apparatus (colored yellow) is present in the center of the cell, and numerous profiles of dilated cisternae of the rough endoplasmic reticulum (RER; purple) occupy the cytoplasm. The nucleus (colored blue) is located in the periphery of the cytoplasm. (B) A typical gonadotrope stimulated for 12 weeks after castration (colored green). The shape of the Golgi apparatus (colored yellow) is slightly deformed owing to the presence of an extraordinarily expanded cisterna of the RER (colored purple). The nucleus (colored blue) is located in the periphery of the cytoplasm. Scale, 5 μm.
Correlation between Immunocytochemically Stained Tissue Sections and Osmium-Macerated Tissue Specimens for SEM (Gonadotropes at 4 Weeks and 12 Weeks after Castration)
On the semi-thin sections of the anterior pituitary 4 weeks after castration, gonadotropes were accurately identified by immunostaining with the anti-LH antibody. The gonadotropes identified on the immunostained section were easily found on the adjacent face of the osmium-macerated tissue block by SEM (Fig. 4B). At a higher magnification, the circular profile of the spherical Golgi apparatus and dilated cisternae of the RER were discerned in the stimulated gonadotropes identified (Fig. 4C). The intracellular locations of the Golgi and RER apparently corresponded to the intense immunoreactivity for TGN38 and BiP on the adjacent section (Fig. 4A).
Correlative immunofluorescence and SEM of gonadotropes in the rat pituitary gland at 4 weeks after castration. (A) A semi-thin section (1-µm thick) of the anterior pituitary gland of the rat 4 weeks after castration immunostained simultaneously with sheep polyclonal anti-TGN38 (yellow pseudocolor), rabbit polyclonal anti-LH (green), and mouse monoclonal anti-BiP (magenta) antibodies. Nuclei are stained with DAPI (blue). The immunoreactivity for BiP (magenta) is densely distributed throughout the cytoplasm of gonadotropes (cells in green). Ring-shaped profiles of the Golgi apparatus (arrowheads) are observed in the gonadotropes. (B) Scanning electron micrograph of the identical area on the osmium-macerated block adjacent to the immunostained tissue section demonstrated in (A). The gonadotrope identified immunocytochemically on the adjacent tissue section is colored green, and two of the corresponding profiles of the identical gonadotropes are indicated with arrows (A, B). (C) The gonadotrope indicated with the arrows in (A) and (B) is observed by SEM at a higher magnification. The Golgi apparatus, rough endoplasmic reticulum (RER), cytoplasm and nucleus are separately colored with yellow, magenta, green and blue pseudocolors, respectively. Note that the spherical Golgi apparatus is located in the center of the cell, and dilated cisternae of the RER are distributed throughout the cytoplasm. The boxed area indicated with a white line is enlarged and shown in Figure 6A. Sg: secretory granules. Scale, 5 μm.
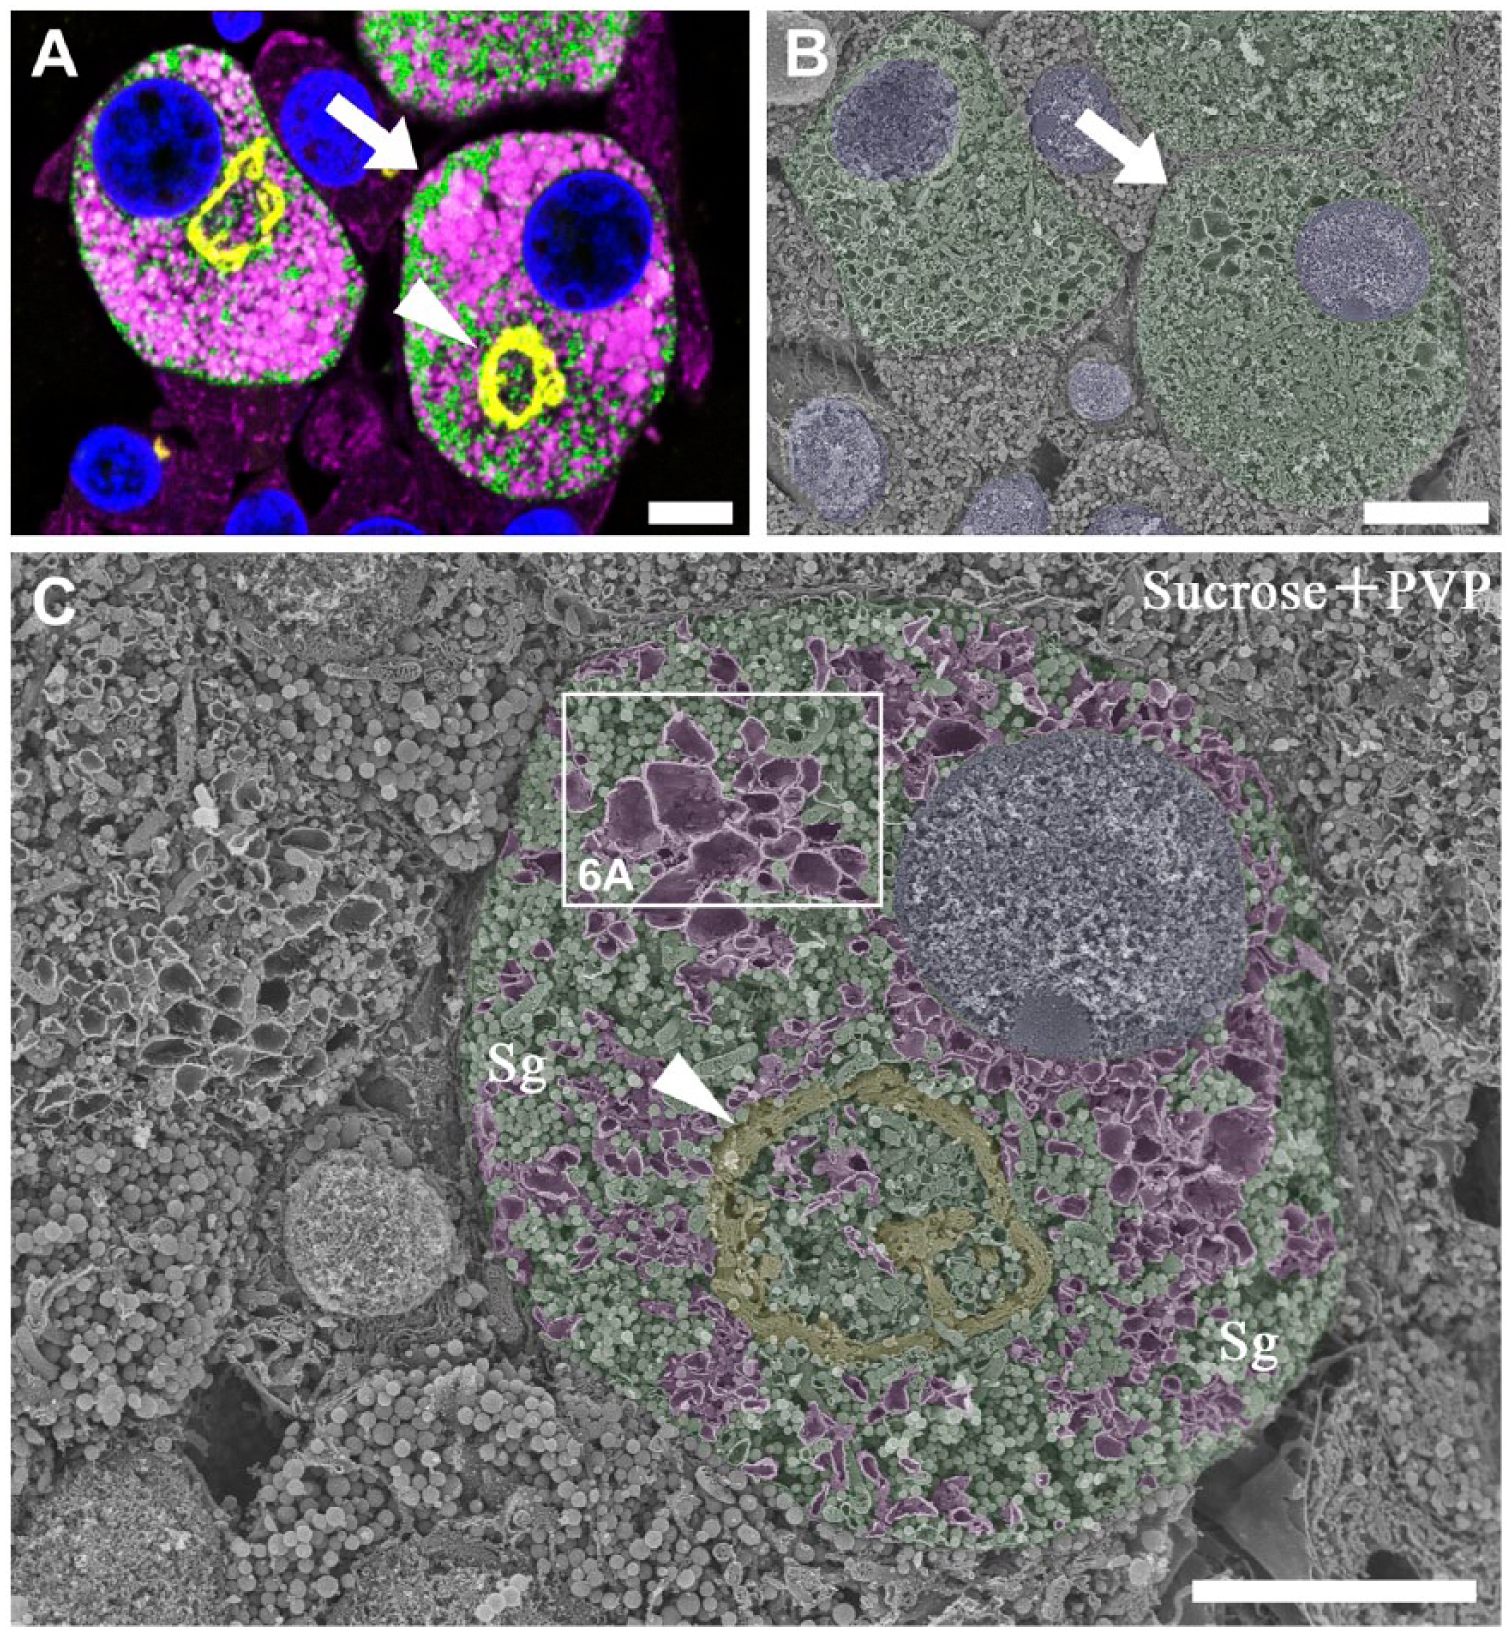
Gonadotropes on the semi-thin sections of the anterior pituitary 12 weeks after castration were also properly immunostained with the antibodies for LH, TGN38 and BiP (Fig. 5A). Some of these gonadotropes contained a high level of immunoreactivity for BiP in the cytoplasm (Fig. 5A; star), exhibiting a typical signet-ring appearance. These stimulated gonadotropes were found on the adjacent face of the osmium-macerated tissue block by SEM, and the intense accumulation of BiP in the signet ring cell on the immunostained section was coincident with the large cavity of the dilated cisterna of the ER observed by SEM (Fig. 5B). At a higher magnification, the luminal surface of the ER cavity could be observed by SEM because soluble proteins in the ER cisternae had been removed by the osmium maceration procedure (Fig. 5C). Besides the hyperstimulated gonadotrope with a typical signet-ring appearance (arrows), other moderately to weakly stimulated gonadotropes in the identical field of observation (asterisks) could also be identified by immunocytochemical staining of the adjacent semi-thin section (Fig. 5A and 5B).
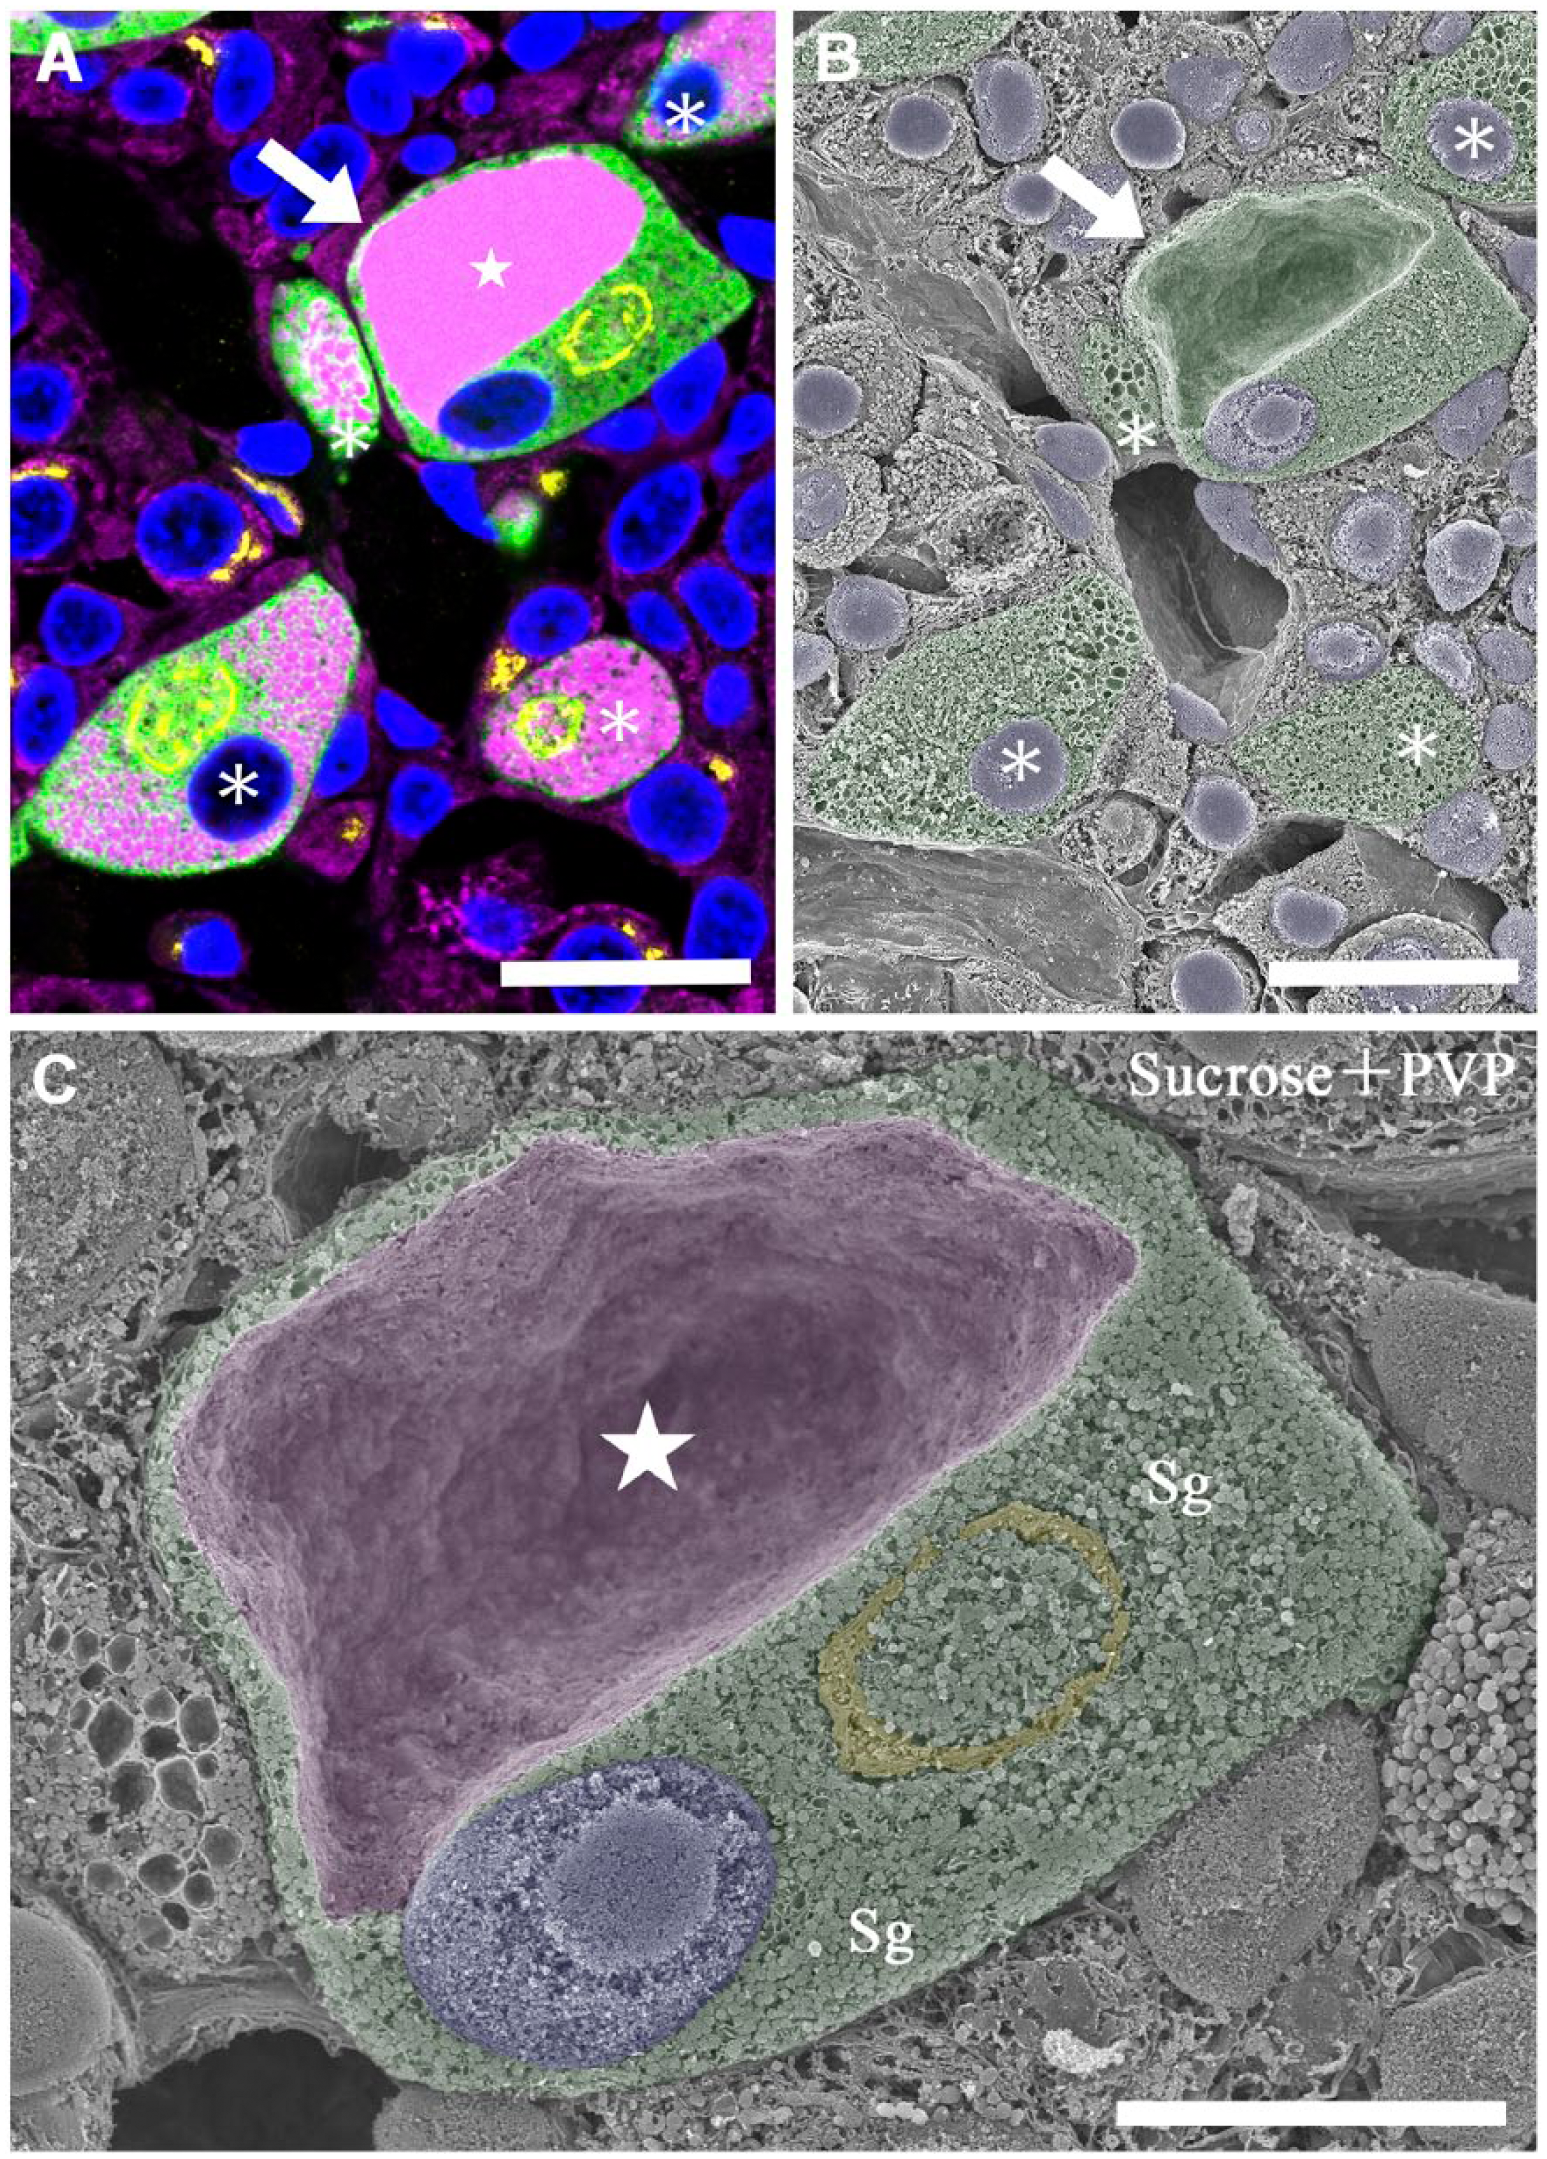
Correlative immunofluorescence and SEM of gonadotropes in the rat pituitary gland at 12 weeks after castration. (A) A semi-thin section (1-µm thick) of the anterior pituitary gland of the rat 12 weeks after castration immunostained simultaneously with sheep polyclonal anti-TGN38 (yellow pseudocolor), rabbit polyclonal anti-LH (green) and mouse monoclonal anti-BiP (magenta) antibodies. Nuclei are stained with DAPI (blue). Note the large accumulation of BiP in a gonadotrope (white star). (B) Scanning electron micrograph of the identical area on the osmium-macerated block adjacent to the immunostained tissue section demonstrated in (A). The gonadotrope identified immunocytochemically on the adjacent tissue section is colored green, and a pair of the corresponding profiles of the identical gonadotropes is indicated with arrows (A, B). (C) The gonadotrope indicated with the arrows in (A) and (B) is observed by SEM at a higher magnification. An extremely dilated cisterna of the rough endoplasmic reticulum (colored purple; white star) occupies the large region of the cytoplasm in the gonadotrope, and the Golgi apparatus (colored yellow) and nucleus (colored blue) are pressed toward the periphery of the cell, resulting in the signet-ring appearance. The rest of the cytoplasmic space is filled with numerous secretory granules (Sg). Scale (A, B) 10 μm; (C) 5 μm.
Evaluation of Specimen Quality
To evaluate the quality of the osmium-macerated tissue specimens, we compared the specimens, prepared as described above with those prepared according to the conventional method of osmium maceration using SEM at a higher magnification (Fig. 6). Both the current (Fig. 6A) and conventional (Fig. 6B) methods of osmium maceration clearly showed the characteristic changes in the intracellular structures of stimulated gonadotropes 4 weeks after castration. Numerous profiles of dilated ER cisternae (painted in purple pseudocolor) and secretory granules filled the spaces between the ER cisternae in the cytoplasm. The appearance of secretory granules and mitochondria using the current method was comparable to that achieved by the conventional method, whereas the smoothness of the ER membranes appeared to be slightly impaired in the specimens prepared using the current method, probably from the freezing/thawing processes. Nevertheless, the overall ultrastructure of the membranous cell organelles within pituitary gonadotropes was sufficiently preserved and consistent with the findings we previously reported using the conventional osmium maceration technique (Koga and Ushiki 2006; Watanabe et al. 2012). Thus, the target gonadotropes immunocytochemically identified on the semi-thin section could be successfully correlated with identical cells in the osmium-macerated pituitary tissue specimens, which enabled us to further analyze their 3D ultrastructure in detail with SEM.
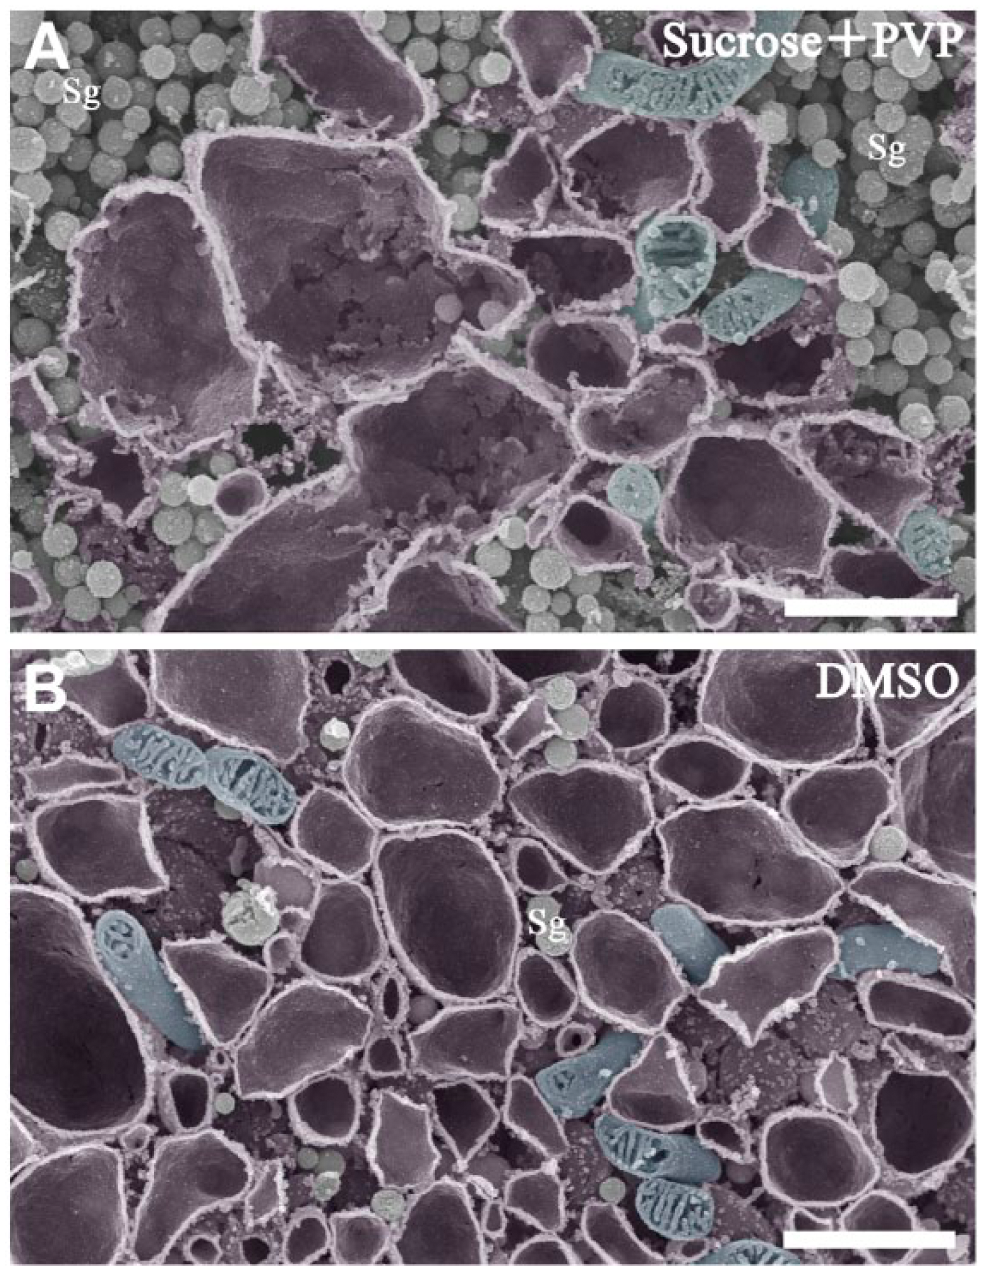
Comparison of SEM images of gonadotropes in the rat pituitary gland at 4 weeks after castration prepared by the current (A) and conventional (B) osmium maceration methods. (A) Higher magnification of the boxed area within the gonadotrope is shown in Figure 4C. Rod-shaped mitochondria (colored blue) are observed around the dilated cisternae of the rough endoplasmic reticulum (RER; colored purple). Sg: secretory granules. (B) Higher magnification of a similar gonadotrope in the rat pituitary gland at 4 weeks after castration by the conventional osmium maceration method. Note that the membranes of the ER (colored purple) are smoother than those observed in (A). Mitochondria and secretory granules are separately colored with blue and green, respectively. Scale, 1 μm.
Discussion
A variety of methods for correlative observation combining light microscopy and EM (CLEM) is available (Shu et al. 2011; Smith 2012; Zhang 2013). Generally, the distribution and dynamics of a target protein fused with fluorescent proteins, such as enhanced green fluorescent protein, are first analyzed in living cells at the light microscopic level. The cells are then fixed and processed for immunoelectron microscopy, which enables one to visualize the intracellular localization of the target protein with the ultrastructural background (van Rijnsoever et al. 2008). Alternatively, immunocytochemical labeling of a specimen with immunogold probes conjugated with fluorescent dyes (FluoroNanogold; Nanoprobes, Yaphank, NY) enables correlation of a region labeled with immunofluorescence at the light microscopic level with the corresponding ultrastructure indicated by immunogold particles at the electron microscopic level (Hainfeld 1987; Takizawa and Robinson 2000, 2003). Thus, CLEM can bridge a gap between the light microscopic level and the corresponding high-resolution image taken by TEM of the identical region of the same specimen.
Contrary to the use of TEM in CLEM, CLEM using SEM is still under development and only available for limited applications (Benedetti et al. 2014). Compared with TEM, SEM can clearly visualize the 3D ultrastructure of biological specimens. The osmium maceration methods, originally introduced by Tanaka and colleagues, extended the application of SEM to the detailed observation of membranous organelles, such as the ER, Golgi apparatus, mitochondria, and secretory granules, by simultaneously stabilizing lipids of organellar membranes and removing cytosolic soluble proteins with a diluted OsO4 solution (Tanaka and Naguro 1981; Tanaka and Mitsushima 1984). Although this osmium maceration method was potentially a powerful tool for cell biological investigations, there was a technical limitation to its application in immunocytochemical techniques: the use of OsO4 for fixation of membranes and the removal of cytosolic soluble proteins largely impaired the antigenicity of molecules in the specimens.
To overcome this problem, we developed in the present study a novel protocol to combine sectioning for immunocytochemical analyses with subsequent osmium maceration for SEM observation. Because the supporting materials for sectioning should be removed before subsequent osmium maceration, we applied the cryosectioning techniques developed by Tokuyasu (1973, 1986, 1989) to the current correlative method. In the Tokuyasu method, fixed tissues are vitrified by rapid freezing after infiltration of a cryoprotectant solution, a 2.3 M sucrose solution (Geuze et al. 1981; Tokuyasu 1986) or mixtures of 2.07–1.61 M sucrose solution and 10–30% PVP (Tokuyasu 1989), into the tissues. The supporting/cryoprotectant materials in the Tokuyasu method minimize the formation of ice crystals that potentially spoil the ultrastructure of the cells/tissues and are easily removed by thawing and rinsing the tissue specimens in appropriate buffer solutions. In particular, a 1.84 M sucrose solution containing 20% PVP resulted in the best infiltration for obtaining a sharp cutting surface of tissue specimens in our preliminary trials as compared with the high-molar sucrose solution alone. Our preliminary trials also indicated that sufficient infiltration of the cryoprotectant solution into tissues was crucial for both cutting a high-quality cryosection and obtaining the adjacent block with a smooth cutting surface after sectioning. Thus, the tissue specimens were carefully immersed in a series of graded concentrations of sucrose (0.4, 0.9, 1.5 and 2.3 M). These modifications of the Tokuyasu method were indispensable for the preservation of ultrastructure in the osmium-macerated SEM specimens.
In addition to the modification in the infiltrating processes of the cryoprotectant solutions, the condition of the fixation should be optimized for both immunocytochemical analyses and osmium maceration. To minimize the reduction in antigenicity in the tissue sections, the tissues were fixed with aldehydes alone before cryosectioning for immunocytochemistry and then firmly fixed again with OsO4 after cryosectioning. In general, paraformaldehyde alone is better for preserving antigenicity, but the addition of glutaraldehyde to the fixative seems to be essential for retaining the ultrastructure of the specimens for SEM observation. Our preliminary trials indicated that the mixture of 0.5% glutaraldehyde and 0.5% paraformaldehyde that was introduced as a pre-fixative for the osmium maceration method (Tanaka and Mitsushima 1984) was a workable compromise because the tissue sections fixed with the solution mentioned above were satisfactorily immunostained for marker molecules of the cell organelles and hormones. Higher concentrations of glutaraldehyde are possibly harmful to the osmium maceration process because the excessively cross-bridged proteins in the cytosol are hard to remove from the cutting surface of the tissue block during the procedure.
Among the various endocrine cells in the anterior pituitary gland, gonadotropes seemed to be appropriate for the evaluation of the quality of the specimens prepared by the new method. The functional state of pituitary gonadotropes is regulated by the hypothalamic–pituitary–gonadal axis, and the gonadotropes are highly stimulated after castration owing to the loss of negative feedback by gonadal sex steroids. The changes in gonadotrope ultrastructure after castration are well documented (Farquhar and Rinehart 1954; Costoff 1973), and stimulated gonadotropes after castration typically can be identified without immunocytochemical staining (Addison 1917; Ellison and Wolfe 1934). Thus, the stimulated gonadotropes could be used as a reference to evaluate the quality of the specimens prepared by the newly developed correlative method.
With the new method described in the present study, immunocytochemical localization of preferred molecules on a tissue section was successfully correlated to the site on the corresponding osmium-macerated tissue specimen for SEM observation. This way, the target cells for SEM observation could be accurately identified in the composite tissue, such as the anterior pituitary gland, and the intracellular localization of the intended molecules further examined at higher resolution with the surrounding 3D ultrastructure by SEM. Besides correlating the immunocytochemical localization of the chosen molecules with the 3D ultrastructure, cryosectioning in the current correlative method also enabled us to examine the 3D ultrastructure of the target cells/tissues from the predetermined cross section/plane of the specimen. However, the frozen tissues immersed in DMSO using the conventional osmium maceration method could only be cracked by chance, and the fractured surfaces of the tissues for SEM observation could not be predicted. In the current osmium-macerated specimens, ultrastructural details of the organelles, such as secretory granules, mitochondria and the Golgi apparatus, were well preserved in comparison to those prepared by the conventional methods with DMSO. Only the smoothness of the ER membranes of the current osmium-macerated specimens appeared to be slightly inferior to that prepared according to the conventional method, probably because the freezing and thawing processes before osmium fixation could not completely prevent the formation of micro-sized ice crystals impairing the ER membranes.
The present study introduced a novel method of CLEM and enabled us to examine the 3D ultrastructure of the target cells identified by prior immunocytochemistry. Accurate identification of the location of target cells prevents minor population/changes of the target cells from being overlooked. The method described in the present study can be applied to the analysis of putative relationships between the distribution of functional molecules and 3D ultrastructure in other composite tissues, such as endocrine pancreas, diffuse endocrine cells in the gastroenteric epithelium and hemopoietic and lymphatic tissues.
Footnotes
Author Contributions
DK, TW and TU designed the study and drafted the manuscript; DK and SK carried out the sample preparation for SEM; DK and HB performed the immunocytochemistry. All authors have read and approved the final manuscript.
Competing Interests
The authors declared no potential conflicts of interest with respect to the research, authorship, and/or publication of this article.
Funding
The authors disclosed receipt of the following financial support for the research, authorship, and/or publication of this article: This work was supported in part by a Grant-in-Aid for Young Scientists (B) from the Japan Society for the Promotion of Science (JSPS) (#26860128) and Tsukada Grant for Niigata University Medical Research.