
Abstract
Constitutively expressed endothelial nitric oxide synthase (eNOS) is supposed to play a role in noise-induced nitric oxide (NO)-production. It is commonly known that intense noise exposure results in inducible NOS (iNOS) expression and increased NO-production, but knowledge about a contribution of the eNOS isoform is still lacking. Effects of noise exposure on eNOS immunolabeling were determined in male guinea pigs (n=24). For light microscopic analysis, 11 animals were exposed to 90 dB for 1 hr and 6 animals were used as controls. After exposure, eNOS immunostaining was performed on paraffin sections, and the staining intensities were quantified for 4 cochlear regions. For electron microscopic analysis, 2 animals were exposed for 2 hr to 90 dB and 5 animals were used as controls. The intensity of eNOS immunolabeling was found to be already comprehensively increased 1 hr after noise exposure to 90 dB. At the ultrastructural level, a clear increase in eNOS immunolabeling was found in microtubules-rich areas of cochlear cuticular structures. Hence, our findings indicate that the reticular lamina forming the endolymph–perilymph barrier at the apical side of the organ of Corti is involved in a fast intrinsic otoprotective mechanism of the cochlea.
Introduction
Noise-induced hearing loss (NIHL) is a widespread handicap in developed countries. 1 Intense noise exposure may result in mechanical trauma and metabolic damage of the cochlea.1–3 It is today commonly accepted that a noise-induced excessive synthesis of nitric oxide (NO) and reactive oxygen species (ROS) are responsible for inner ear pathology. Generally, NO can be formed by three different nitric oxide synthases (NOS). Two of these, the endothelial NOS (eNOS) and the neural NOS (nNOS), are constitutively expressed and regulated by calcium/calmodulin. Both NOS enzymes were found to be widely distributed in the inner ear.4,5 The enzymatic activity of the third isoform, the inducible NOS (iNOS), is independent of calcium/calmodulin. Under physiological conditions iNOS has not been found in the inner ear so far. Its expression, however, can be induced by various pathological factors including noise.6–9
Focussing primarily on NO-production, it was shown that acute noise exposure (3 x 110 dB SPL for 3 hr per day) resulted in the NO-increase in the perilymph. 8 Even a noise exposure for 10 min at 105 dB led to a 3-fold rise of NO in the lateral wall and an immediate threshold shift of 16.2 dB. 10 Furthermore, noise exposure at 90 dB for 1 hr resulted in an increased NO-production preferentially in the lateral wall. 10
Analyzing the contribution of the various NOS isoforms in noise-dependent NO-production, an induction of iNOS expression is widely assumed in cases of intense noise exposure.7,8,11,12 In addition, elevated levels of eNOS immunolabeling were observed at the electron microscopic level in the organ of Corti 60 hr after acute noise trauma. 13 Based on these findings, it must be assumed that the constitutively expressed eNOS isoform might also be up-regulated immediately after noise exposure in the cochlea beside the induction of the iNOS isoform.
In order to obtain information about a possible relationship between noise exposure (90 dB, 1 hr) and eNOS expression, we determined alterations in eNOS immunostaining intensities in 4 regions of the cochlea using paraffin sections. In addition, we analyzed the eNOS immunostaining pattern at the electron microscopic level in the reticular lamina by gold-labeled anti-eNOS antibodies 2 hr after exposure to 90 dB (see Fig. 1). This cochlear region is strongly exposed to processes of cochlear oscillation in the context of sound perception and signal transduction.14,15
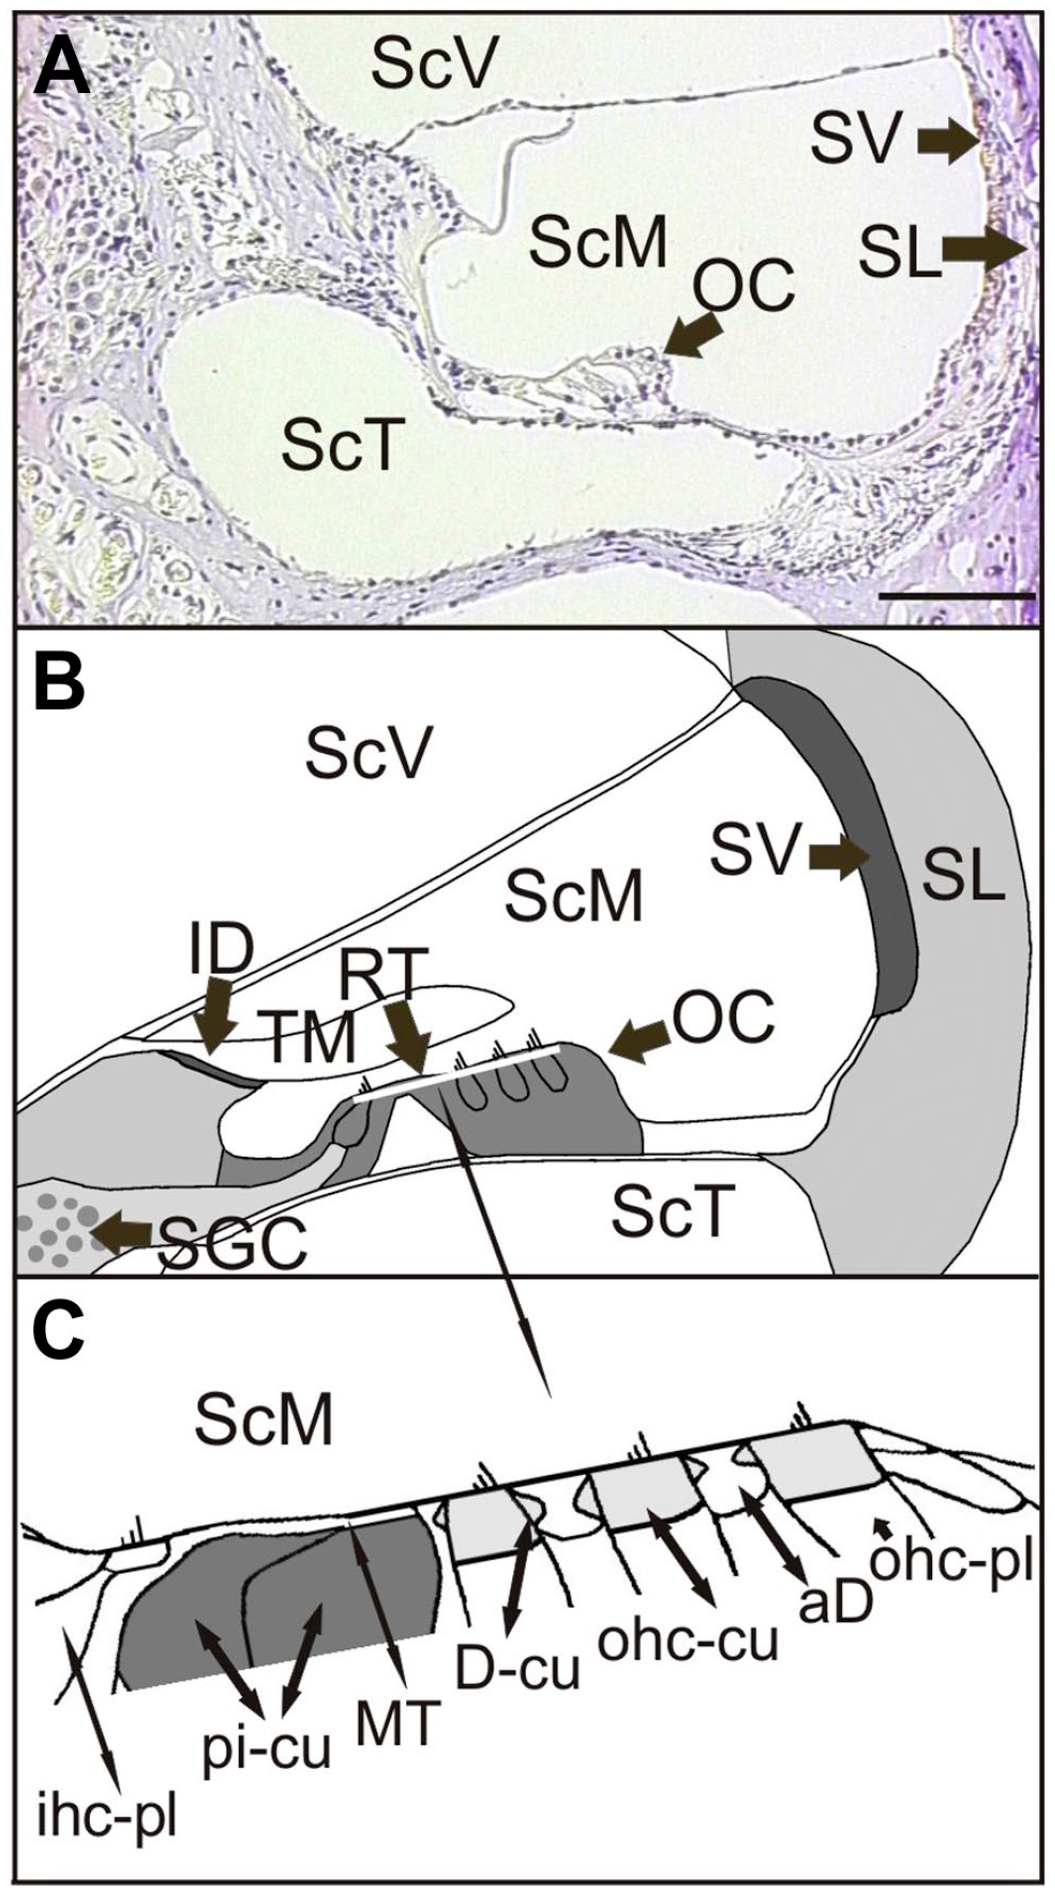
Anatomy of the guinea pig cochlea (A) Light-microscopic image of the second turn of the cochlea with the various fluid compartments and the regulatory cochlear regions. (B) Anatomic scheme demonstrating the cochlear cell types and analyzed areas in this study; the localization of the reticular lamina is marked as a white bar. (C) Detailed drawing of the reticular lamina with the various cell types and cell areas. Compartments of the cochlear duct: ScV = scala vestibuli; ScM = scala media, ScT = scala tympani; Cell types and subcellular structures: aD = cytoplasm of apical Deiters’ cell; D-cu = cuticular structure of the Deiters’ cell; ID = interdental cells; ihc-pl = cytoplasm of the inner hair cell; OC = organ of Corti; ohc-cu = cuticular plate of the outer hair cell; ohc-pl = plasma of outer hair cell; MT = microtubules bundle; pi-cu = cuticular plates of the pillar cells; RT = reticular lamina; SGC = spiral ganglion cells; SL = spiral ligament; SV = stria vascularis; TM = tectorial membrane; scale bar = 100 µm.
Materials and Methods
Subjects
Twenty-four healthy pigmented male guinea pigs (Tricolor; Charles River, Sulzfeld, Germany) weighing 175–260 g with good Preyer’s reflexes and no evidence of middle ear disease were used in this study. All experiments were conducted in accordance with the German Prevention of Cruelty to Animals Act and were approved by the supervising authorities (Government of Rhineland-Palatia, “Landesuntersuchungsamt”; protocol no. 23 177-07/G07-1-010). Animals were kept on a 12 hr:12 hr light: dark cycle in the university’s animal facility.
Noise Exposure
Eleven animals were exposed to 90 dB (SPL) for 1 hr and 2 animals for 2 hr. Each animal was exposed separately to repeated click stimuli (duration 100 µs duration, intensity: 20 clicks/s) by the Spirit evoked potential system (Nicolet, Biomedical, Madison, WI). Eleven animals were used as controls.
Cochlea Preparation and Immunohistochemistry
All animals were killed by pentobarbital–sodium (Narcoren, Hallbergmoos, Germany; 448 mg/kg body weight) at the end of the experiments. For the light microscopic analysis, the left cochleae of the 11 animals which were exposed to 90 dB for 1 hr and of 6 un-exposed controls were completely removed from the bullae and transferred into a solution that consisted of 0.2% picric acid, 4% paraformaldehyde, and 0.1% glutardialdehyde. The right cochleae were used for organ culture experiments which were described in detail elsewhere. 10 In the present study, eNOS distribution was verified by the primary mouse monoclonal anti-eNOS antibody (Biosciences, Heidelberg, Germany, diluted 1:50). Sections from different experimental ears were collected on different slides. All specimens for analysis were processed in the same assay. Furthermore, this comprehensive assay comprising all samples was repeated in order to check staining intensity variations between different assays and reproducibility.
For the electron microscopic analysis, 2 ears were exposed to 90 dB for 2 hr, and 5 ears were used as controls. At the end of these experiments, the cochleae were removed from the bullae, transferred into a solution that consisted of 0.2% picric acid, 4% paraformaldehyde, and 0.1% glutardialdehyde and embedded in LR White. Post-embedding immunolabeling was performed using ultrathin tissue sections of the cochleae as described in detail elsewhere. 16 In this study, the sections were incubated overnight at 4C with the primary monoclonal mouse IgG1 eNOS-antibody (Transduction Laboratories, Lexington, KY).
The antigenicity of the tissue was tested by labeling ultrathin sections with an anti-tubulin (monoclonal anti-β-tubulin AB, Sigma Aldrich, St. Louis, diluted 1:500) and an anti-actin antibody (C-terminal actin fragment produced in rabbit, Sigma Aldrich, diluted 1:100), as these cytoskeletal molecules naturally belong to every cell. Prominent amounts of gold-labeled anti-tubulin antibodies were located in the microtubules-bundles of inner pillar cells, and the pillar and hair cell cuticular plates were significantly labeled by anti-actin antibodies (not shown).
In addition, control experiments were performed by incubating the ultrathin sections with an isotype IgG antibody (Cymbus Biotechnology, Chandlers Ford, UK) and by labeling ultrathin sections of the neocortex of the prenatal mouse (positive control) and vitellogenic follicles of the fruit fly Drosophila (negative controls) with the primary antibody (data not shown). The immunoelectron microscopic analysis revealed that the eNOS labeling of the ooplasma in vitellogenic follicles (0.125 gold particles/µm2) was in the range of cochlea background labeling. It is widely excepted that the background labeling in immunoelectron microscopic analysis must by below 1 gold particle/µm2. In the cells of the neocortex, a density of 2.31 gold-labeled anti-eNOS antibodies/µm2 was quantified that corresponded to unstimulated outer hair cell eNOS immunoreactivity. For all staining protocols, negative controls were included (i.e. omitting primary antibody).
Quantification of Immunostaining by Light Microscopy
Images were taken from semi-thin sections using a high density 1/3’’ type, three-chip Exwave HAD CCD red-green-blue (RGB) color video camera (Sony 3-CCD DXC-390P) connected to a ZEISS microscope (Axiovert 200) equipped with a halogen light source using a 40x objective. Images were captured in Photoshop (version 7; Adobe Systems, San Jose, CA) and stored in a single file. The technique of selecting similar features on a digitized immunohistochemical image has been described in detail previously. 17
Quantification of Gold Particles
The density of gold particles was determined on various ultrathin sections in a frame of 1 µm2. In this study, the number of gold particles/µm2 was counted in eight different cell areas or cell types: cuticular plates of pillar cells, microtubules-bundles of inner pillar cells, cuticular plates of hair cells, cuticular structures of apical Deiters’ cells, remaining cytoplasm of inner and outer hair cells, remaining cytoplasm of apical Deiters’ cells, and cytoplasm of basal Deiters’ cells. The distribution of the gold-labeled anti-eNOS antibodies was determined on ultrathin sections of 2 noise-exposed and 5 control animals, by counting 43.614 gold particles in 19.410 arbitrarily selected areas. The technique and its application were published in detail elsewhere. 16
Statistical Analysis
To analyze the immunostaining intensities in the different cochlea regions, we used a linear mixed model with noise exposure and cochlea turn as fixed effects and animals as random effect, and analysis was stratified by cell type. Noise exposure had 2 levels (present or absent), cochlea turn had 3 levels. Each animal contributed 3 observations, 1 for each turn. Therefore, we used a model with animal as a random effect. The endpoint was the eNOS immunostaining intensity. The mean values and the standard deviations were computed per group and presented in the corresponding graphs and in the text; the p values derived from a posteriori tests were included in the text. They were not adjusted for multiple comparisons and should be regarded as descriptive. One, 2, or 3 asterisks were used to represent p<0.05, p<0.01, and p<0.001, respectively. Statistical analysis was performed using SPSS 23 (IBM® 1989, 2016).
Results
Localization of eNOS Immunoreaction
To clarify the various cochlear regions analyzed in this study, a light microscopic image and a scheme of the second cochlea turn is helpful (Fig. 1A and B). The different cell types and subcellular structures of the reticular lamina (see white bar in Fig. 1B) are visualized separately in Fig. 1C.
In the lateral wall, basal eNOS immunostaining intensities were seen in the stria vascularis and in the spiral ligament (Fig. 2A). After 90 dB noise exposure for 1 hr, the staining intensities were increased in both regions (Fig. 2B). A distinctive quantitative analysis regarding various types of fibrocytes was not performed as the staining pattern appeared homogenous among these cells. In the organ of Corti, a basal eNOS immunostaining was identified in nearly every cell type (Fig. 2C), which clearly increased after noise exposure (Fig. 2D). The interdental cells, which are located beneath the insertion of the tectorial membrane revealed also a weak eNOS staining intensity in controls (Fig. 2E) which was enhanced after noise exposure (Fig. 2F).
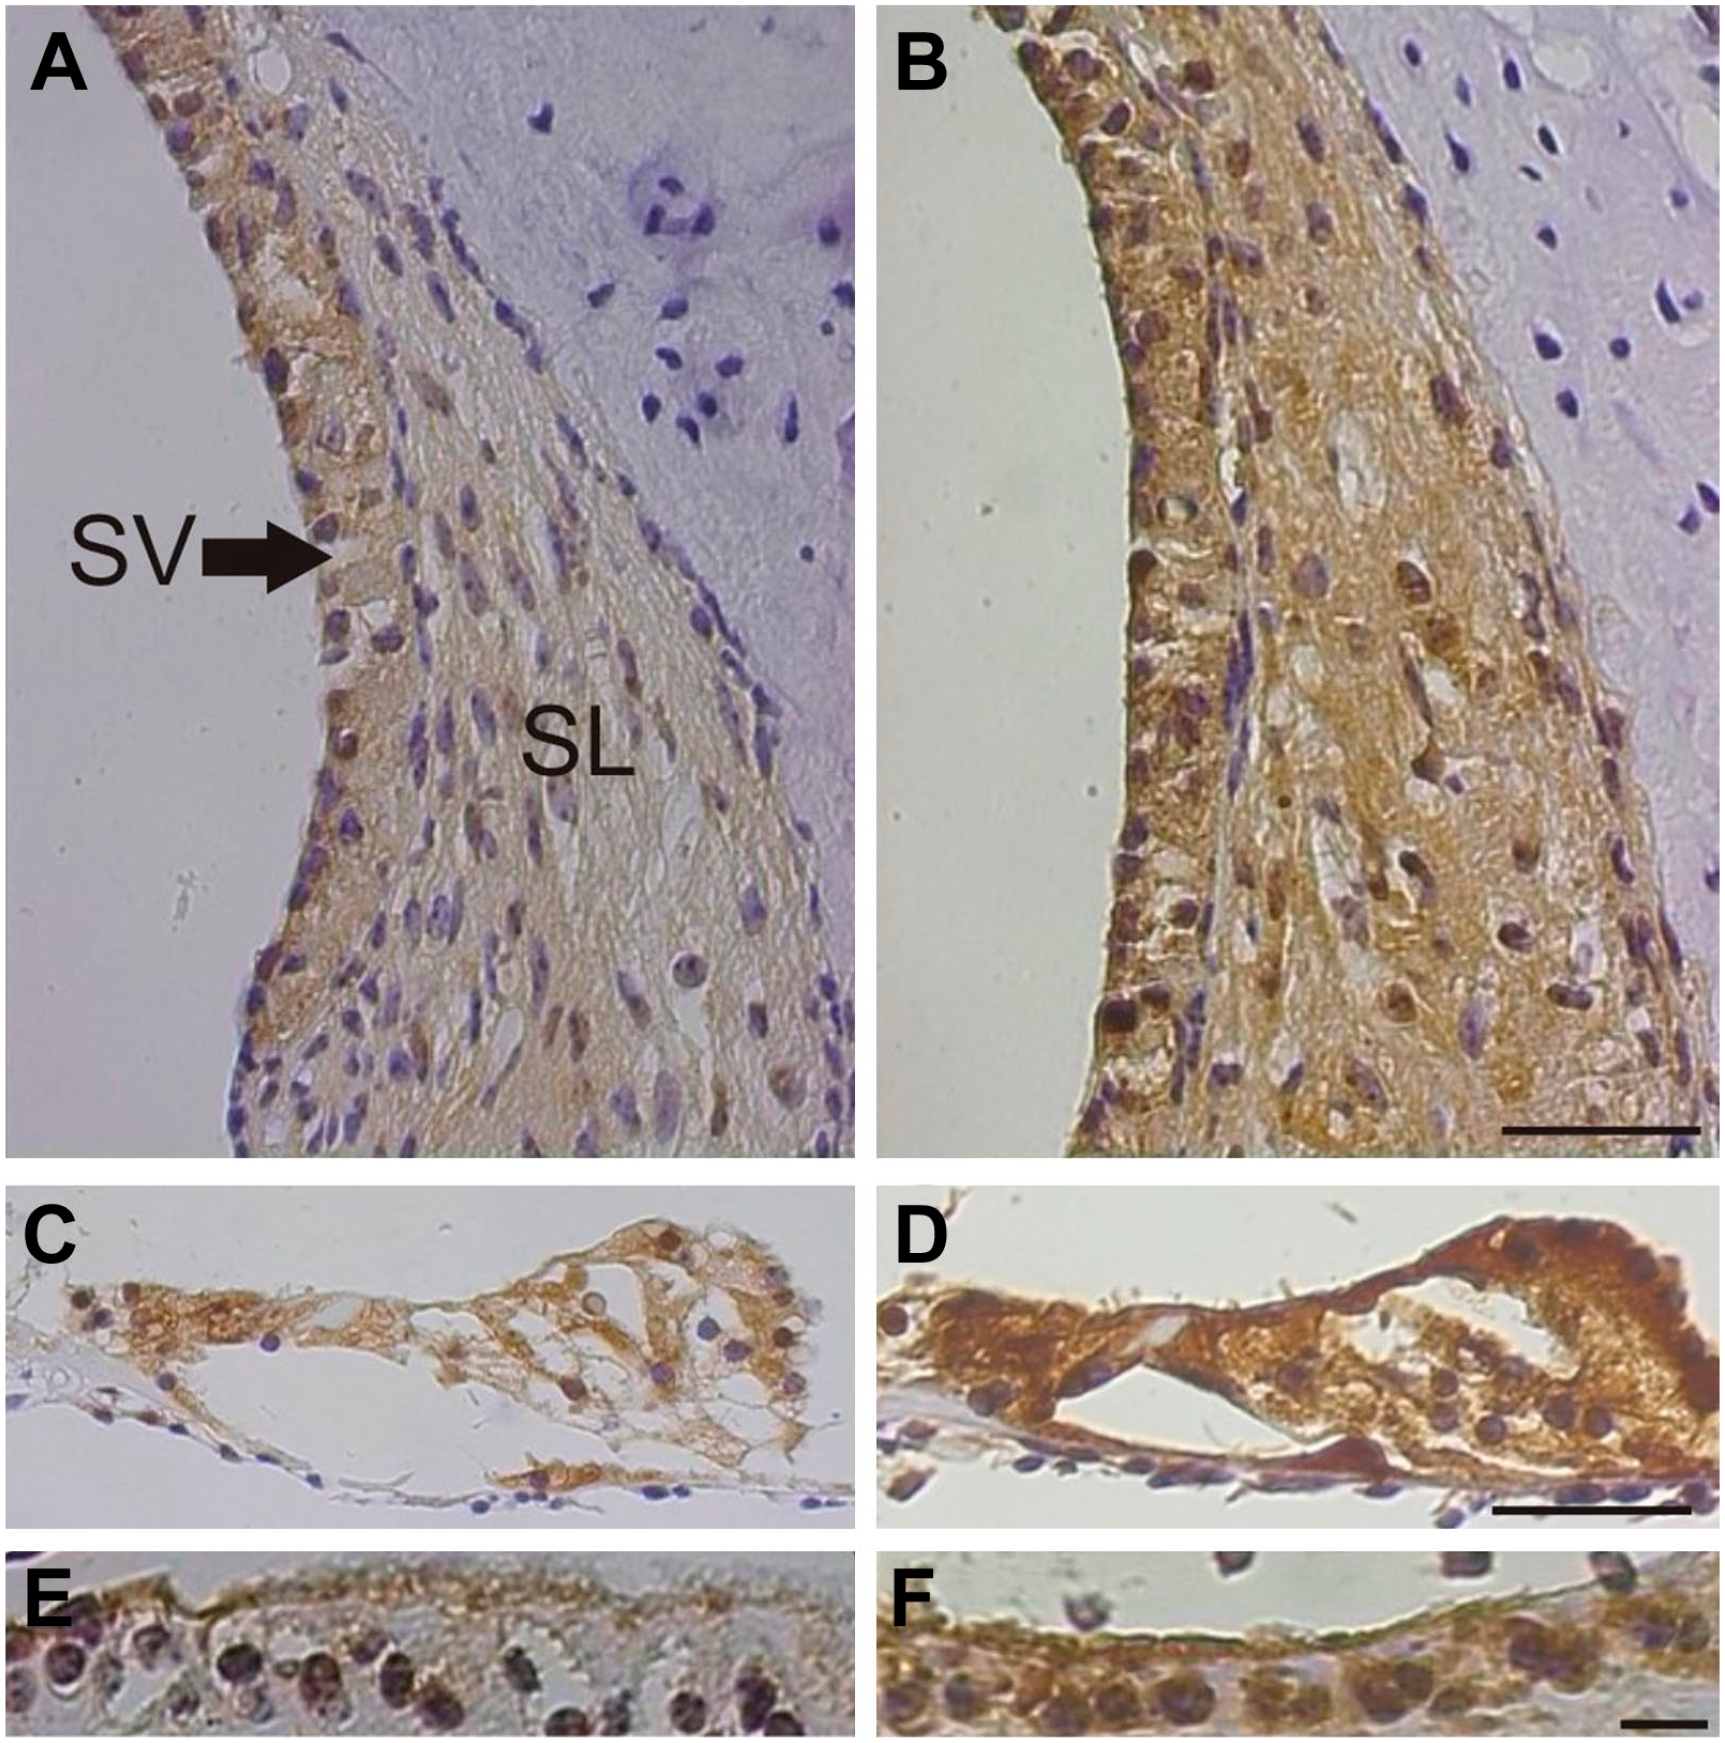
eNOS immunoreaction in the second cochlea turn of the guinea pig. (A) In the lateral wall, a clear immunoreaction was found in the stria vascular and in the spiral ligament. (B) After noise exposure for 1 hr the intensity was increased in both areas. (C) An eNOS immunoreaction was seen in nearly every cell type in the organ of Corti of control ears which was enhanced after noise exposure (D). (E) In the interdental cells, a faint immunoreaction was detected in unexposed ears, which became intensified after noise exposure (F). Abbreviations: SL, spiral ligament; SV, stria vascularis; A-D scale bar = 50 µm; E,F scale bar = 25 µm.
Finally, an increased eNOS immunoreaction was also identified in spiral ganglion cells (not shown).
Quantification of eNOS Immunostaining Intensity by Light Microscopy
The mean staining intensities of eNOS immunoreactions were determined for each ear and in detail for the four cochlear regions (organ of Corti, interdental cells, stria vascularis, and spiral ligament). Regarding individual cases, clear differences in eNOS staining intensity were found within the control group and the noise-exposed group (Fig. 3). In noise-exposed specimen, there was a large variability in immunostaining intensities, whereas in the control group the differences were smaller. Based on these observations, “responding” and “non-responding” cases must be distinguished in the 90 dB-treated group. Intriguingly, in the noise-exposed group 4 out of 11 staining intensities were comparable to findings in the control group, whereas in 7 cases staining intensities revealed significantly higher staining intensities (Fig. 3). However, compared with the control group, the average staining intensity of the 90 dB-exposed ears turned out to be 1.7-fold higher (Fig. 3).
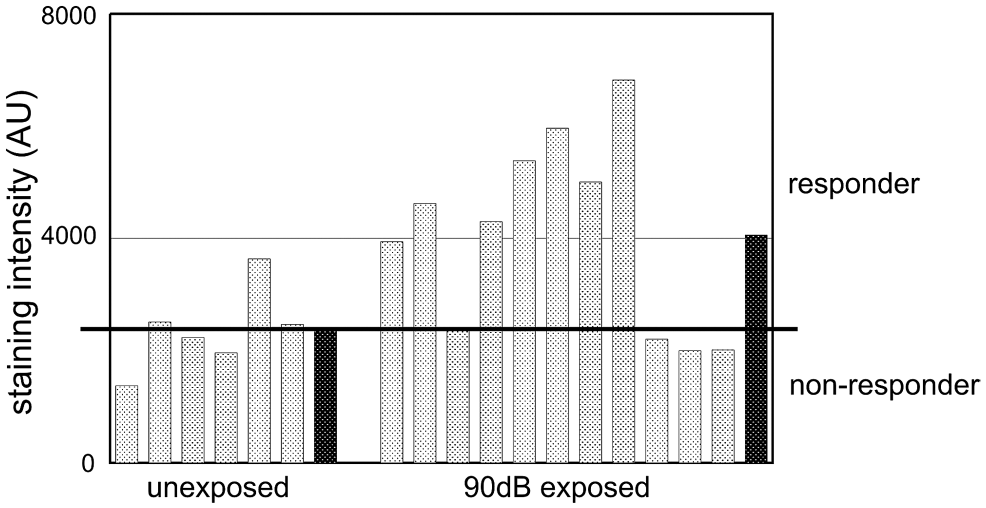
Immunostaining intensities of eNOS at the level of the individual ear (averaged regarding cell types and turns for each ear = light columns; average of the group dark column). In 6 animals of the control group, the eNOS staining intensity varied to a small extent whereas a great variability was found in the noise-exposed group. Here, 4 animals were similar in staining intensity compared with controls, whereas the eNOS immunostaining intensity was clearly higher in 7 animals. The averaged staining intensity in the noise-exposed group was increased by 1.7-fold compared with controls (black columns).
Analyzing the 4 different cochlear regions more in detail, greater staining intensities were observed in all cochlear turns compared with controls (Fig. 4). Despite wide standard variations, statistically significant differences were only seen when comparing noise-exposed ears and controls but not between the 3 cochlear turns of control ears nor noise-exposed ears, respectively. In the organ of Corti and stria vascularis, clear differences were determined for the first and second cochlea turn. In the interdental cells, eNOS immunostaining intensity was clearly up-regulated in the first turn and in the spiral ligament in all 3 cochlea turns. Accordingly, an obvious widespread increase in eNOS staining intensities was found 1 hr after 90 dB exposure.
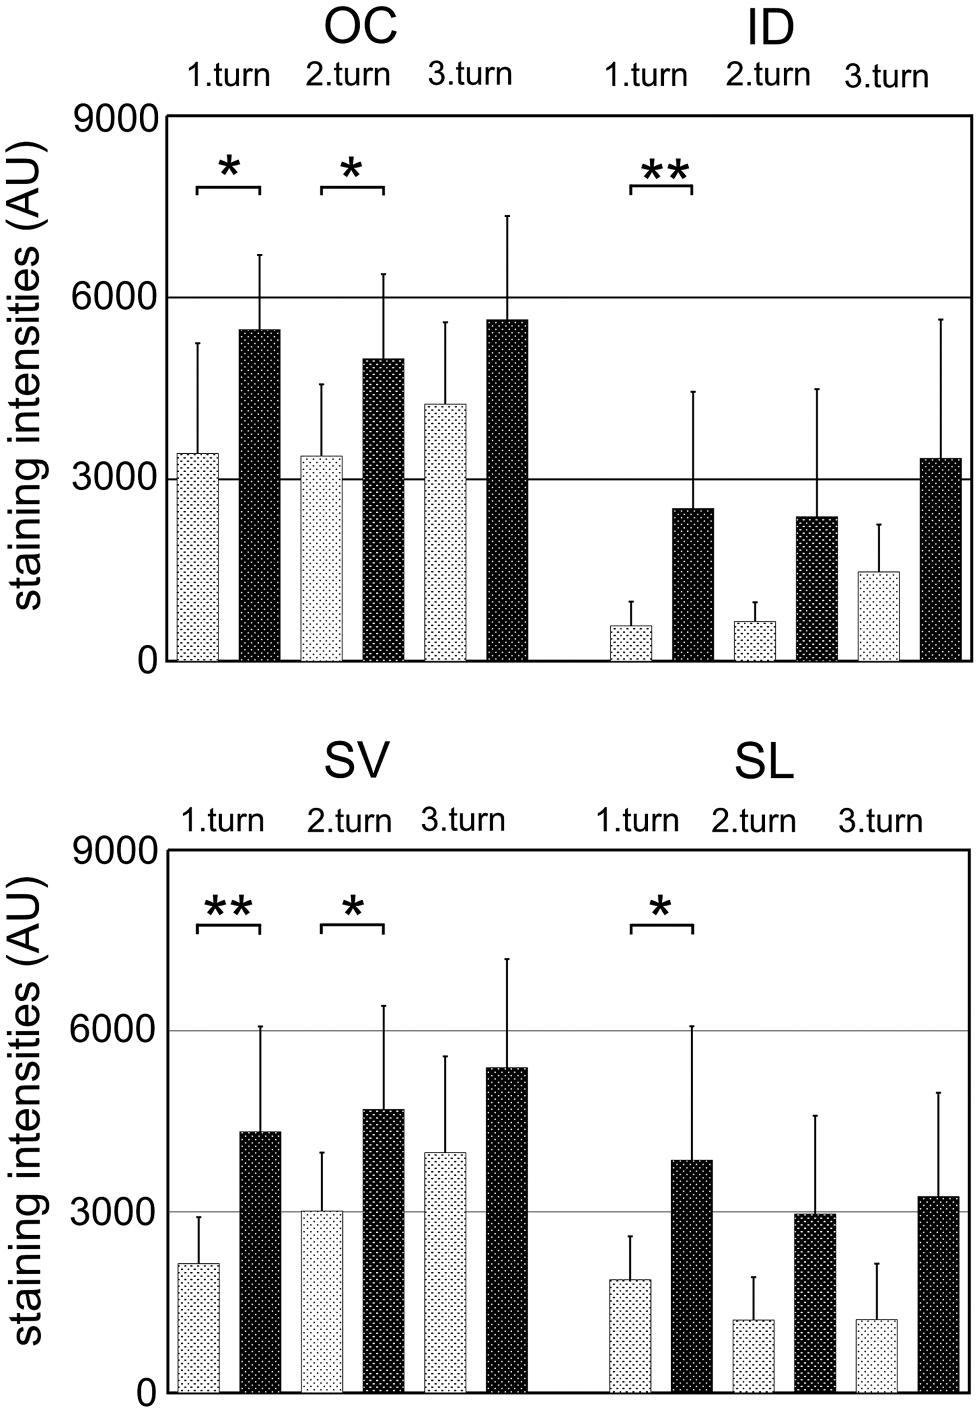
Antibody-specific staining intensities, given in arbitrary units (AU; mean values ± standard deviation [SD]), in the three cochlea turns (t1—t3) of four analyzed regions: organ of Corti (OC), interdental cells of the Limbus (ID), stria vascularis (SV) and spiral ligament (SL). Staining intensities were compared between control ears (grey columns) and 90 dB-noise exposed ears (black columns). After noise exposure, a clear increase was observed in the majority of cochlear turns in all four areas (OC: p=0.011/0.035/0.088, ID: p=0.039/0.069/0.098, SV: p=0.019/0.018/0.061, SL: p=0.025/0.045/0.038). Statistical significance was marked by asterisks (*p<0.05. **p<0.01.); columns: mean + SD.
Cellular Associations of eNOS Immunostaining Intensities
The statistical analysis revealed multiple associations with respect to the eNOS immunostaining intensities by comparing the various cochlear regions without and shortly after noise exposure, respectively. In controls, there was a clear association between the organ of Corti and interdental cells (r = 0.782, p<0.001) and moderate associations between organ of Corti and stria vascularis (r = 0.536, p=0.022) or spiral ligament (r = 0.581, p=0.012). After noise exposure, clear associations were identified between all 4 analyzed areas regarding scatterplots with corresponding correlation coefficients and p-values (Fig. 5).
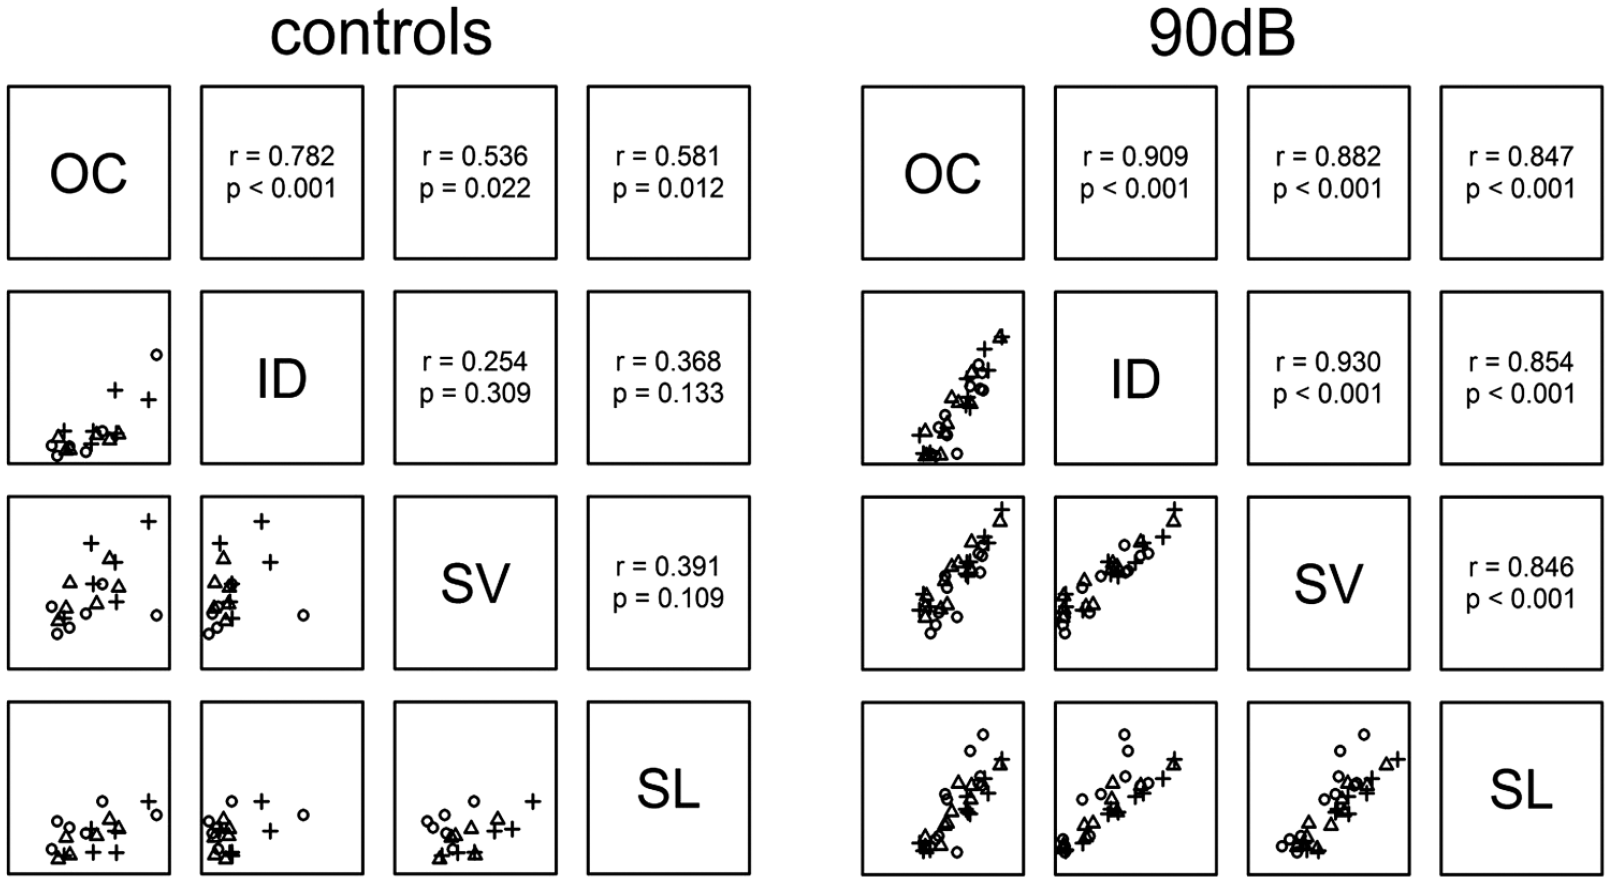
Associations of eNOS immunostaining intensities with and without noise exposure comparing 4 regions of the cochlea. In controls, a strong association was identified between the organ of Corti and the interdental cell. After noise exposure, six strong associations were detected by statistical analysis between all analyzed areas.
Quantification of eNOS Immunostaining Intensities at the Electron Microscopic Level
Using electron immunohistochemistry, noise-dependent alterations in eNOS staining intensity were analyzed in the various cell types forming the reticular lamina (Fig. 6). This area contains cuticular structures and cytoplasmic, cuticular-free parts. Together they form a barrier against an infiltration of the endolymphatic fluid into the perilymph-containing parts of the organ of Corti. In addition, it is now widely accepted that this region is mechanically stressed by heavy fluid movements in course of signal transduction. A clear increase in gold-labeled anti-eNOS antibodies were found in the cuticular plates of outer hair cells and in the cuticular structures of apical Deiters’ cells, as well as in the microtubules-containing parts of the inner pillar cells (Fig. 6). A slight increase in gold particles was seen in the plasm of apical Deiters’ cells and in the cytoplasm of inner hair cells, whereas the number of gold-labeled anti-eNOS antibodies remained unchanged in the plasm of outer hair cells and in cuticular structures of pillar cells (Fig. 6).
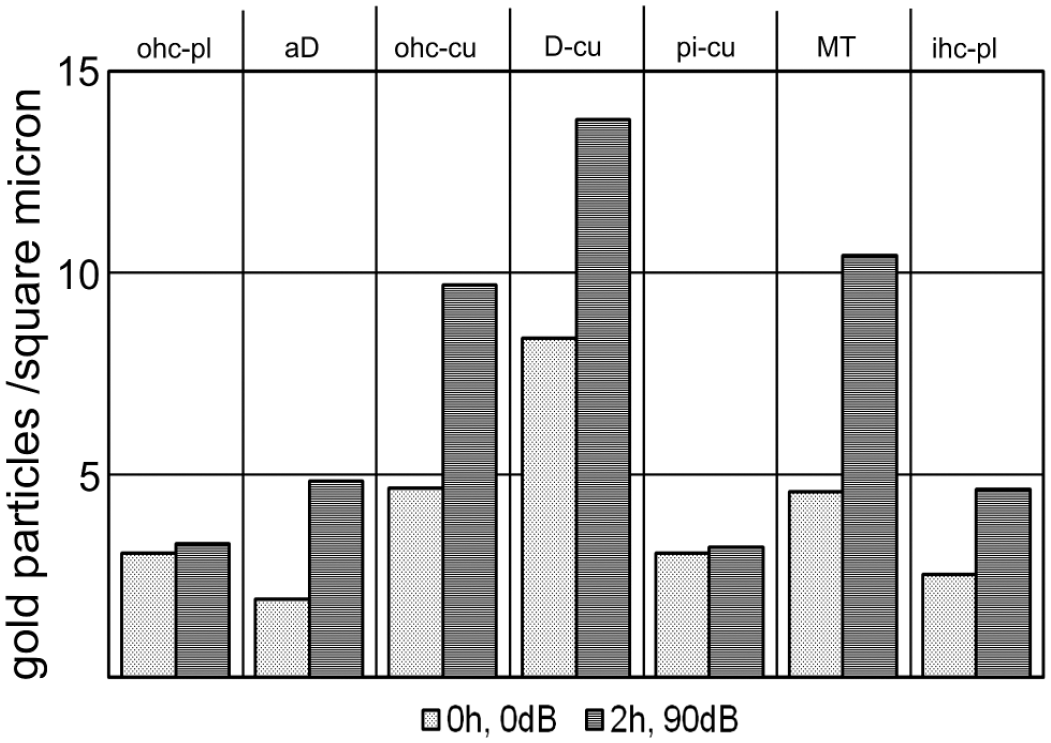
Quantitative immunoelectron microscopic analysis of various cell types and cell structures of the reticular lamina. Comparing the density of the gold-coupled anti-eNOS antibodies in 7 regions of the reticular lamina, a clear 90 dB-dependent increase was observed in the cuticular plates of outer hair cells, in the cuticular structures of apical Deiters’ cells and in the microtubules-rich area. Abbreviations: aD, cuticular-free areas of apical Deiters’ cells; D-cu, cuticular structures of apical Deiters’ cells; ihc-pl, cuticular-free areas of inner hair cells; MT, microtubules bundles; ohc-pl, cuticular-free plasm of outer hair cells; ohc-cu, cuticular plates of outer hair cells; pi-cu, cuticular plates of pillar cells.
Ultrastructural Immunoelectron Microscopy of eNOS
Analyzing the reticular lamina at the electron microscopic level, gold-labeled anti-eNOS antibodies were found in numerous cytoplasmic areas. Using electron microscopy at the 3 areas with prominent increase in gold-labeled anti-eNOS antibodies, the following distinct patterns were revealed (Fig. 7): in the cuticular structures of unexposed Deiters’ cells, only few gold particles were seen (Fig. 7A), whereas their number was clearly higher after noise exposure (Fig. 7B). In the microtubules-bundles above the cuticular plates of pillar cells only scattered gold particles were found in controls (Fig. 7C). After noise exposure, more particles were detected (Fig. 7D). In addition, an obvious increase of gold particles was also identified in the cuticular plates of the outer hair cells (Fig. 7E and F).
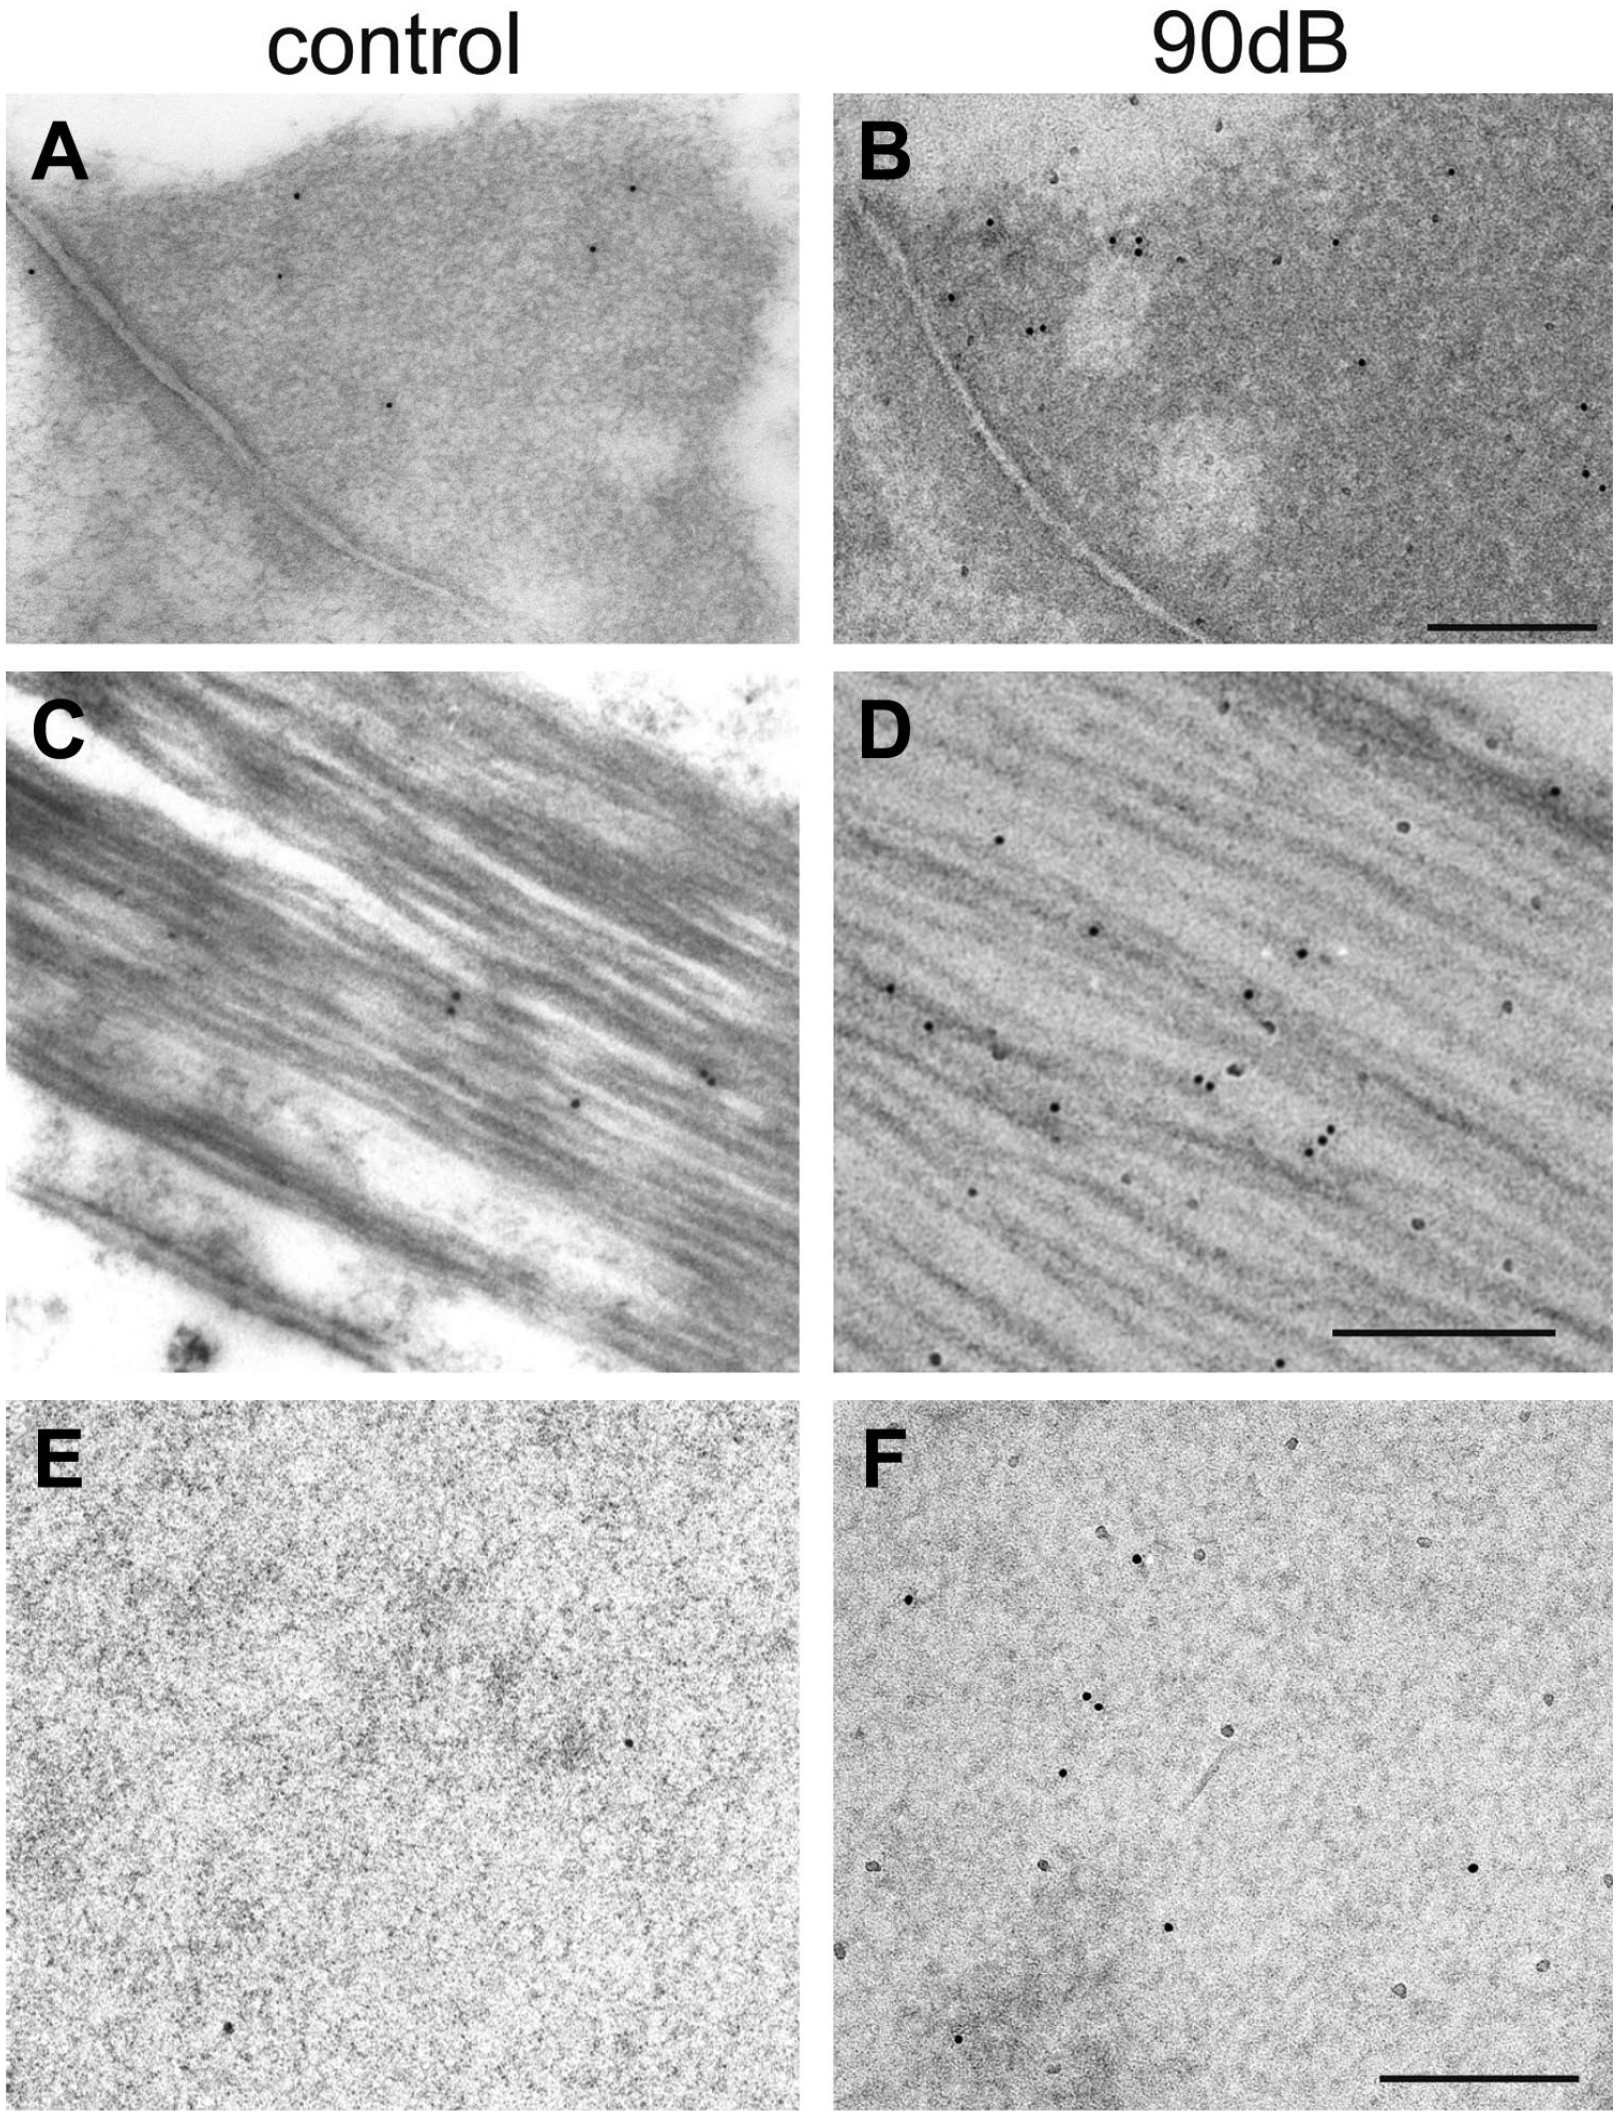
Immunoelectron microscopic analysis of the three cell structures with a clear noise-dependent increase of gold-labeled anti-eNOS antibodies. (A) In the cuticular structures of Deiters’ cells single gold particles were seen. (B) But their number was increased after noise exposure. (C) A few gold particles were detectable in microtubules of unexposed ears. (D) Which increased clearly after noise exposure. (E) In the homogenously looking cuticular plate of outer hair cells, single gold particles were found in controls. (F) But their number increased after exposure to 90 dB.
Discussion
Exposure to 90 dB for 1 hr or 2 hr resulted in a fast increase in eNOS immunostaining intensity in nearly all regions in the cochlea compared with controls. This observation was realized by light microscopic analysis for the cochlea and confirmed by a locally restricted analysis of the reticular lamina at the electron microscopic level. Following inductive analytical concepts, there was evidence that eNOS immunostainings might differ between individual cases. Using electron immunohistochemistry, a clear noise-dependent eNOS up-regulation was found in the cuticular plates of outer hair cells, and in the cuticular structures of apical Deiters’ cells as well as in the microtubules-bundles above the cuticular plates of pillar cells. In experiments by other groups, it was shown that alterations in eNOS can be controlled at the transcriptional, translational, and post-translational level.18–20 Thus, the detected fast eNOS up-regulation in this study must be discussed in detail with respect to possible underlying mechanisms.
Case-Sensitivity of eNOS Regulation
When comparing the values of the noise-exposed ears in every single ear, the variability in eNOS staining intensity might be due to the methodical uncertainties of the immunoreaction itself or to differences in the individual molecular equipment. As staining procedures for analysis at the light and electron microscopic level in this study was reproduced resulting in comparable immunoreaction patterns, methodical deficiencies can be excluded. In other animal experiments, a large variability was found in guinea pigs when recording the auditory brainstem responses. 21 This intra-species depending variability was 5-fold higher in guinea pigs compared with mice.
For humans, the individual susceptibility to NIHL was discussed to be related partly to various intrinsic factors such as eye color, gender, age, and smoking, but could not explain the wide range of hearing loss. 22 It was therefore postulated that differences in acoustic reflex functioning and the role of the efferent system might be involved in the individual differences. 22 Recently, it was discussed that differences in the expression level of the α9 subunit of the nicotinic acetylcholine receptor might contribute to inter-animal variability in acoustic injury. 23 In addition, evidence for more comprehensive differences was obtained when comparing physiological reaction patterns regarding case-sensitive variations. Comparably, analyzing the NO-production in organ cultures of the organ of Corti and lateral wall with and without prior application of doxycycline, such individual variations were documented in subgroups. 24
Mechanical Effectors on Cochlear Function
Generally, sound-induced perilymph movements within the cochlear compartments lead to vibrations of the tissue and thus to mechanical interactions between different cellular structures within the organ of Corti. 14 In an in vitro preparation of the guinea pig temporal bone, step-wise alterations of pressure in the Scala tympani resulted in shear stress between the reticular lamina and the tectorial membrane. 25 The reticular lamina at the apical side of the organ of Corti facing the Scala media was found to provide a certain stiffness. 14 This region is predominantly formed by cuticular structures of various cell types discontinued by few cytoplasmic portions. Recently, it was also shown that the endolymph-filled gap between the reticular lamina and the tectorial membrane varied cyclically during low-frequency-sounds. 26
Analyzing the cytoskeletal elements of the cochlear sensory and supporting cells more in detail, a spatial distribution of the actin isoforms became evident.27–30
Furthermore, it must be mentioned that actin can occur in two different organization forms: filamentous actin (F-actin) and globular actin (G-actin). The regulation of the polymerization and depolymerization of F-actins supposed to be controlled by the concentration of free G-actin. 31 F-actin was found predominantly in the top of the hair cells, the stereocilia, cuticular plate and circumferential ring. 32 Long lasting noise-exposure with high or middle intensities resulted in an increase in F-actin labeling in the adult organ of Corti. 32 By contrast, subjects kept 5 days in quiet after a 10-day preconditioning noise exposure showed a decrease in cuticular plates and stereocilia 32 resulting probably in a decrease of the mechanical rigidity of the organ of Corti. The identified noise-dependent local increase in eNOS immunostaining intensity in this study might be closely connected with the intensity of reticular lamina vibration.
Influence of the Actin Cytoskeleton on eNOS Expression
In the present electron microscopic analysis, the highest levels of eNOS immunostaining intensity in the unstimulated cochlea were found in the actin-containing cuticular plates of outer hair cells and cuticular structures of Deiters’ cells as well as in the microtubules bundles. A clear increase in anti-eNOS immunostaining was detected in these cell structures after 2 hr at 90 dB noise-exposure. In addition to the cuticular structures, a slight increase in gold-labeled anti-eNOS antibodies were also found in the cytoplasm of inner hair cells and apical Deiters’ cells. It can be speculated that eNOS up-regulation might be controlled directly or indirectly via the cytoskeleton, preferentially in cuticular structures and to less extent in the homogenous looking cytoplasm. Thus, the intensity and the duration of the fluid movements might be mechanical, dose-dependent triggers in cytoskeletal-controlled eNOS up-regulation.
A correlation between mechanical forces and eNOS expression was postulated for the cochlear microvascular network system. Here, mechanical forces induced by blood flow were found to contribute to eNOS mRNA elevation.33,34 To confirm this assumption, bovine aortic endothelial cells (BAECs) and EA hv.926 cells, a cell line derived from human umbilical vein endothelial cells, were grown inside elastic tubes and exposed to different mechanical forces for 24 hr. 35 Unidirectional shear stress resulted in an increase in eNOS expression and promotor activity. 35 Otherwise, oscillatory shear forces only slightly upregulated mRNA in BAEcs, whereas it downregulated eNOS mRNA in EA hv-936 cells. Cyclic stretch did not change eNOS mRNA expression, and the activation of eNOS promoter was clearly lower. These findings reveal that various cell types can react differently, and that unidirectional shear stress is the major mechanical factor which increases eNOS mRNA expression via a transcriptional mechanism. 35 The promotor activation can be explained by the presence of several shear stress responsive sites in this region. 35
Furthermore, it was demonstrated in a cell culture system that shear stress-induced activation of the tyrosine kinase c-Src played a central role in modulation of eNOS expression. 36 Two divergent pathways were involved in these processes, a short-term increase in eNOS transcription and a longer-term stabilization of eNOS mRNA. 36 A contribution of Src protein tyrosine kinase (PTK) in NIHL was obtained by application of specific PTK-inhibitors in a chinchilla animal model. 37 In addition, Src-interactions were postulated to be linked to signaling pathways that modify the cytoskeleton and activate protein kinase cascades which regulate cell survival and gene transcription. 38
Based on these findings, we hypothesize that comparable mechanical cytoskeleton-dependent mechanisms are involved in the identified noise-induced eNOS up-regulation in the guinea pig cochlea. However, a contribution of biochemical triggers cannot be excluded. Such physiological and pathophysiological stimuli that modulate eNOS expression via mechanisms altering the steady-state eNOS mRNA levels have been identified in other biological systems. 39 One of these factors is H2O2. In bovine aortic endothelial cells, H2O2 increases both eNOS gene transcription and eNOS mRNA half-life. 40 As it is now well accepted that noise exposure increases the concentration of reactive nitrogen and oxygen species in the cochlea,4,6,41 a contribution of H2O2 in eNOS up-regulation must be taken into consideration.
eNOS Up-regulation: Otoprotective or Destructive?
The otoprotective or destructive nature of the NO-molecule depends primarily on expressed protein amounts. 5 Generally, high amounts of NO are supposed to be oto-destructive whereas low amounts are proposed to be protective. It has been known for some years that eNOS-generated NO-production plays a crucial role in microvascular function and homeostasis, as NO possesses vasodilatory, anti-inflammatory, antithrombotic, and antiproliferative properties.42,43 In addition, it was shown that nitric oxide owns anti-oxidative and anti-apoptotic features which were found to mediate neuroprotection. 44 The underlying mechanism might be based on the up-regulation of the anti-oxidative thioredoxin system and on the anti-apoptotic Bcl-2 proteins through cGMP-dependent mechanisms. Thus, NO prevents caspase-dependent apoptosis 45 and was found to have direct anti-oxidative effects through their reaction with free radicals and iron-oxygen complexes. 44
There is some evidence from recent research that eNOS-produced NO might act in concert with other intrinsic cellular protection mechanisms to assure cochlear homeostasis. A protective role of the apoptosis inhibitor Survivin (also named Birc5 or AP14) was demonstrated after noise exposure or gentamicin application, respectively.46,47 The cloning and functional characterization of guinea pig Survivin displayed a high homology to the human and murine orthologue, especially in domains critical for proteins of the chromosomal passenger complex and nuclear export. 48 In addition, the NO-dependent modulation of Survivin in head and neck squamous cell carcinoma revealed an interplay between these two protection pathways, Survivin and NO. 49
In addition to the protective roles of NO and Survivin, glucocorticoides, and glucocorticoid receptors are other guardians of cochlea homeostasis. The intratympanic application of dexamethasone clearly lowered NIHL. 50 Thus, future research should focus on the molecular interactions of the multicomponent cellular defense mechanisms in the cochlea, which include beside others NO production as well as Survivin and glucocorticoid expression. The very fast up-regulation of eNOS immunostaining intensity in the cochlea after a sound stimulus (90 dB, 1 hr) appears to indicate a novel intrinsic otoprotective mechanism. The induced eNOS up-regulation leading to a higher cellular NO content in certain areas might stimulate specific signaling cascades involved in tissue protection within the organ of Corti comparable to those identified in endothelial cells.
Footnotes
Acknowledgements
The authors thank Mrs. K. Benz for technical assistance.
Author Contributions
URH, RHS, and SStrieth designed the study. URH, BPE, DW, SSiemer, and AG executed the experiments. URH, IS, and RM performed the statistical analysis. URH and SSt finally analyzed the data and wrote the manuscript.
Competing Interests
The author(s) declared no potential conflicts of interest with respect to the research, authorship, and/or publication of this article.
Funding
The author(s) disclosed receipt of the following financial support for the research, authorship, and/or publication of this article: SStrieth was supported by Deutsche Forschungsgemeinschaft (DFG grant STR 1014), the research initiative of the Government of Rhineland-Palatia (“Impulsfonds” 2017/2018) and by the intramural BiomaTiCS-program (“Biomaterials, Tissues and Cells in Science”) of the University Medical Center Mainz, Germany.