
Abstract
Breast cancer (BC) is a heterogeneous disease with evolving genetic alterations and expressions of receptor proteins. Intratumoral heterogeneity (ITH) is considered to be a resistance factor in response to targeted therapies. The current single-slide, single-marker immunohistochemistry techniques cannot accurately assess ITH at the individual cancer cell level. In this study, we develop a novel brightfield multiplex assay to simultaneously assess estrogen receptor (ER) and human epidermal growth factor receptor 2 (HER2) protein markers, together with the HER2 gene and the centromere of chromosome 17 (CEP17) copy numbers, using a single tissue section. The data presented herein demonstrate heterogeneous cancer cell subpopulations in 11 HER2-positive/ER-positive (HER2+/ER+) tumors among 33 BCs analyzed immunohistochemically (HER2 score of 2+ or 3+). The predominant cancer cell subpopulation was HER2+/ER− (50.18%), followed by HER2+/ER+ (39.05%), HER2−/ER+ (4.26%), ER− with HER2 microheterogeneity cancer cells (3.58%), and ER+ with HER2 microheterogeneity cancer cells (2.93%). The three other tumor subtypes, namely, HER2−/ER+, HER2+/ER−, and HER2−/ER−, were more homogeneous, representing 82.59%, 99.22%, and 100% of cancer cells, respectively. This novel assay revealed that HER2+ cancer cells were more predominant than ER+ cancer cells in HER2+/ER+ tumors and provided new insights toward our understanding of BC carcinogenesis.
Introduction
Breast cancer (BC) has been understood as a disease with heterogeneity that can be spatial and temporal, as well as intra- and intertumoral. 1 BC heterogeneity manifests as tumors with variable histopathological and biological characteristics, evolving genetic alterations and expression of hormone receptors (HRs) (estrogen receptor, ER; progesterone receptor, PgR), and human epidermal growth factor receptor 2 (HER2) that affect clinical outcomes and response to therapies. Up to two thirds of HER2-positive (HER2+) BCs also express HR. 2 The biological characteristics of HER2-positive/ER-positive (HER2+/ER+) tumors differ from those of HER2+/ER− and HER2−/ER+ tumors. 3
Clinical trials for HER2+ BCs in a neoadjuvant setting through the combination of chemotherapy and anti-HER2 agents, that is, the GeparQuinto, 4 NeoALTTO, 5 and NeoSphere 6 trials, showed that the pathological complete response (pCR) rate was higher in HR– tumors than in HR+ tumors. HER2 amplification has been shown to be associated with resistance to endocrine therapy. Studies evaluating aromatase inhibitors (AIs) and tamoxifen, such as the ATAC 7 and BIG1 8 studies and a recent meta-analysis of 12,129 patients, 9 assessed the impact of HER2 status in ER+ tumors. These studies showed that although HER2– BC patients experienced improved outcomes when treated with AIs rather than tamoxifen, those patients with HER2+ cancers had similar or slightly worse outcomes when treated with endocrine therapy. Recent preclinical and clinical data suggest that the direct cross talk between HER2 and ER may be a resistance mechanism to endocrine therapy and HER2-targeted therapy. 2 Combination therapies of anti-HER2 agents and AIs for HER2+/ER+ tumors have been evaluated in clinical trials, that is, TanDEM, 10 eLEcTRA, 11 and EGF30008, 12 and these trials demonstrate a significantly improved response rate and progression-free survival compared with patients receiving either monotherapy. The treatment for dual HR+ and HER2+ BC has thus been debated, and the guidelines of the National Comprehensive Cancer Network for patients with dual HR+ and HER2+ BC recommend four diverse treatment patterns according to the tumor size and nodal status. 13
Given our increasing knowledge of intratumoral heterogeneity (ITH), HER2+/ER+ BCs are not a homogeneous tumor type but instead are composed of cancer cell subpopulations with different phenotypes that may respond differently to treatments, and ITH may play a role in the primary and acquired resistance to therapies with an increased risk of recurrence. Currently, we do not have adequate methodologies for the detection and assessment of heterogeneity in these tumors. Herein, we describe a novel brightfield multiplex assay that enables the simultaneous evaluation of the ER and HER2 proteins and the HER2 and CEN17 genes in a single formalin-fixed paraffin-embedded (FFPE) tissue section. This technique allows for analyses of the spatial distribution and representation of different cancer cell subpopulations to assess HER2 and ER ITH in BC. Understanding the characteristics of these cancer cells may provide valuable insights regarding cancer evolution and may affect the treatment strategies for individual patients with HER2+/ER+ breast tumors.
Materials and Methods
Xenograft Tumor and BC Tissue Samples
FFPE sections of the HER2+ cell line Calu-3 (HER2 average copy number: 30) and the HER2– cell line MCF7 (HER2 average copy number: 2) xenograft tumors were used for the initial development and optimization of the brightfield multiplex assay. 14
The performance of the multiplex assay was evaluated using BC tissue samples from the Nihon University School of Medicine, Tokyo, Japan, that were acquired between 2010 and 2012. Thirty-three BC tissues with HER2 scores of 3+ or 2+, as determined by a board of certified pathologists using routine immunohistochemistry (IHC), were selected. The BC samples were classified into four subtypes using a conventional method based on the status of the HER2 gene and ER protein expression: no HER2 gene amplification and ER-positive (HER2−/ER+; 11 cases), HER2 gene amplification and ER-positive (HER2+/ER+; 11 cases), HER2 gene amplification and ER-negative (HER2+/ER−; 9 cases), and no HER2 gene amplification and ER-negative (HER2−/ER−; 2 cases). FFPE sections from each BC patient were examined for the IHC assay (HER2 and ER), HER2 gene-protein assay (GPA), and brightfield multiplex assay for ER and HER2 proteins, HER2 gene, and CEN17. This study was conducted in accordance with the Declaration of Helsinki. The study protocol was approved by the Institutional Review Board of the Nihon University School of Medicine (RK-121214-7).
HER2 Protein IHC Assay
The HER2 IHC assay with the PATHWAY HER-2/neu rabbit monoclonal antibody (clone 4B5; Ventana Medical Systems Inc. (Ventana), Tucson, AZ) was performed with iView DAB Detection Kit (Ventana) on a BenchMark XT automated staining system (Ventana). Briefly, the tissue sections were deparaffinized with EZ Prep (Ventana) at 75C, heat-pretreated in Cell Conditioning 1 (CC1; Ventana) using “standard cell conditioning” for antigen retrieval at 100C, and then incubated with the anti-HER2 primary antibody for 32 min at 37C after inactivation of the endogenous peroxidase with hydrogen peroxide for 4 min. The tissue sections were then blocked using the Endogenous Biotin Blocking Kit (Ventana), incubated with a biotinylated secondary antibody for 8 min, and incubated with a streptavidin–horseradish peroxidase (HRP) conjugate for 8 min at 37C. The immunolocalized HER2 protein was visualized using a copper-enhanced DAB reaction. The slides were counterstained with Hematoxylin II (Ventana) for 4 min and Bluing Reagent (Ventana) for 4 min, and coverslips were applied by an automated coverslipper (Tissue-Tek Film Automated Coverslipper; Sakura Finetek Japan; Tokyo, Japan).
HER2 GPA
The GPA was performed on the BenchMark XT platform (Ventana) according to the previously described manufacturer’s recommendations with the appropriate positive and negative controls. 15 The HER2 GPA assay combines the PATHWAY anti-HER2/neu (4B5) rabbit monoclonal primary antibody (Ventana) for IHC and the INFORM HER2 Dual ISH DNA probe cocktail (Ventana) for ISH, and both were performed on a single slide. The INFORM HER2 Dual ISH DNA Probe Cocktail contains a HER2 probe (labeled with the hapten dinitrophenyl or DNP) and a chromosome 17 probe (labeled with the hapten digoxigenin or DIG) formulated with human placental blocking DNA in a formamide-based buffer. The HER2 DNA Probe spans approximately 200,000 bp along the genomic region containing the HER2 gene (also known as ERBB2 and NEU), which is located on human chromosome 17 (17q11.2-q2).
As recommended, the HER2 IHC was first performed using the iVIEW DAB IHC Detection Kit (Ventana). Thereafter, hybridization was performed using a cocktail of the 2,4 DNP-labeled HER2 probe and DIG-labeled CEN17 probe. The HER2 gene and CEN17 signals were detected using the ultraView Silver ISH DNP Detection Kit (Ventana) and the ultraView Red ISH DIG Detection Kit (Ventana), respectively. The HER2 gene signals were developed before the generation of the CEN17 signal. The slides were counterstained with Hematoxylin II (Ventana). Signal visualization was performed via conventional light microscopy, where the HER2 gene appears as discrete black signals and CEN17 as red signals, whereas the HER2 protein shows brown staining, principally along the cell membranes.
Brightfield Multiplex Assay for ER and HER2 Protein, the HER2 Gene, and CEN17
The multiplex assay was constructed in the following order: (1) HER2 protein detection, (2) ER protein detection, (3) HER2 gene detection, and (4) CEN17 detection (Fig. 1).
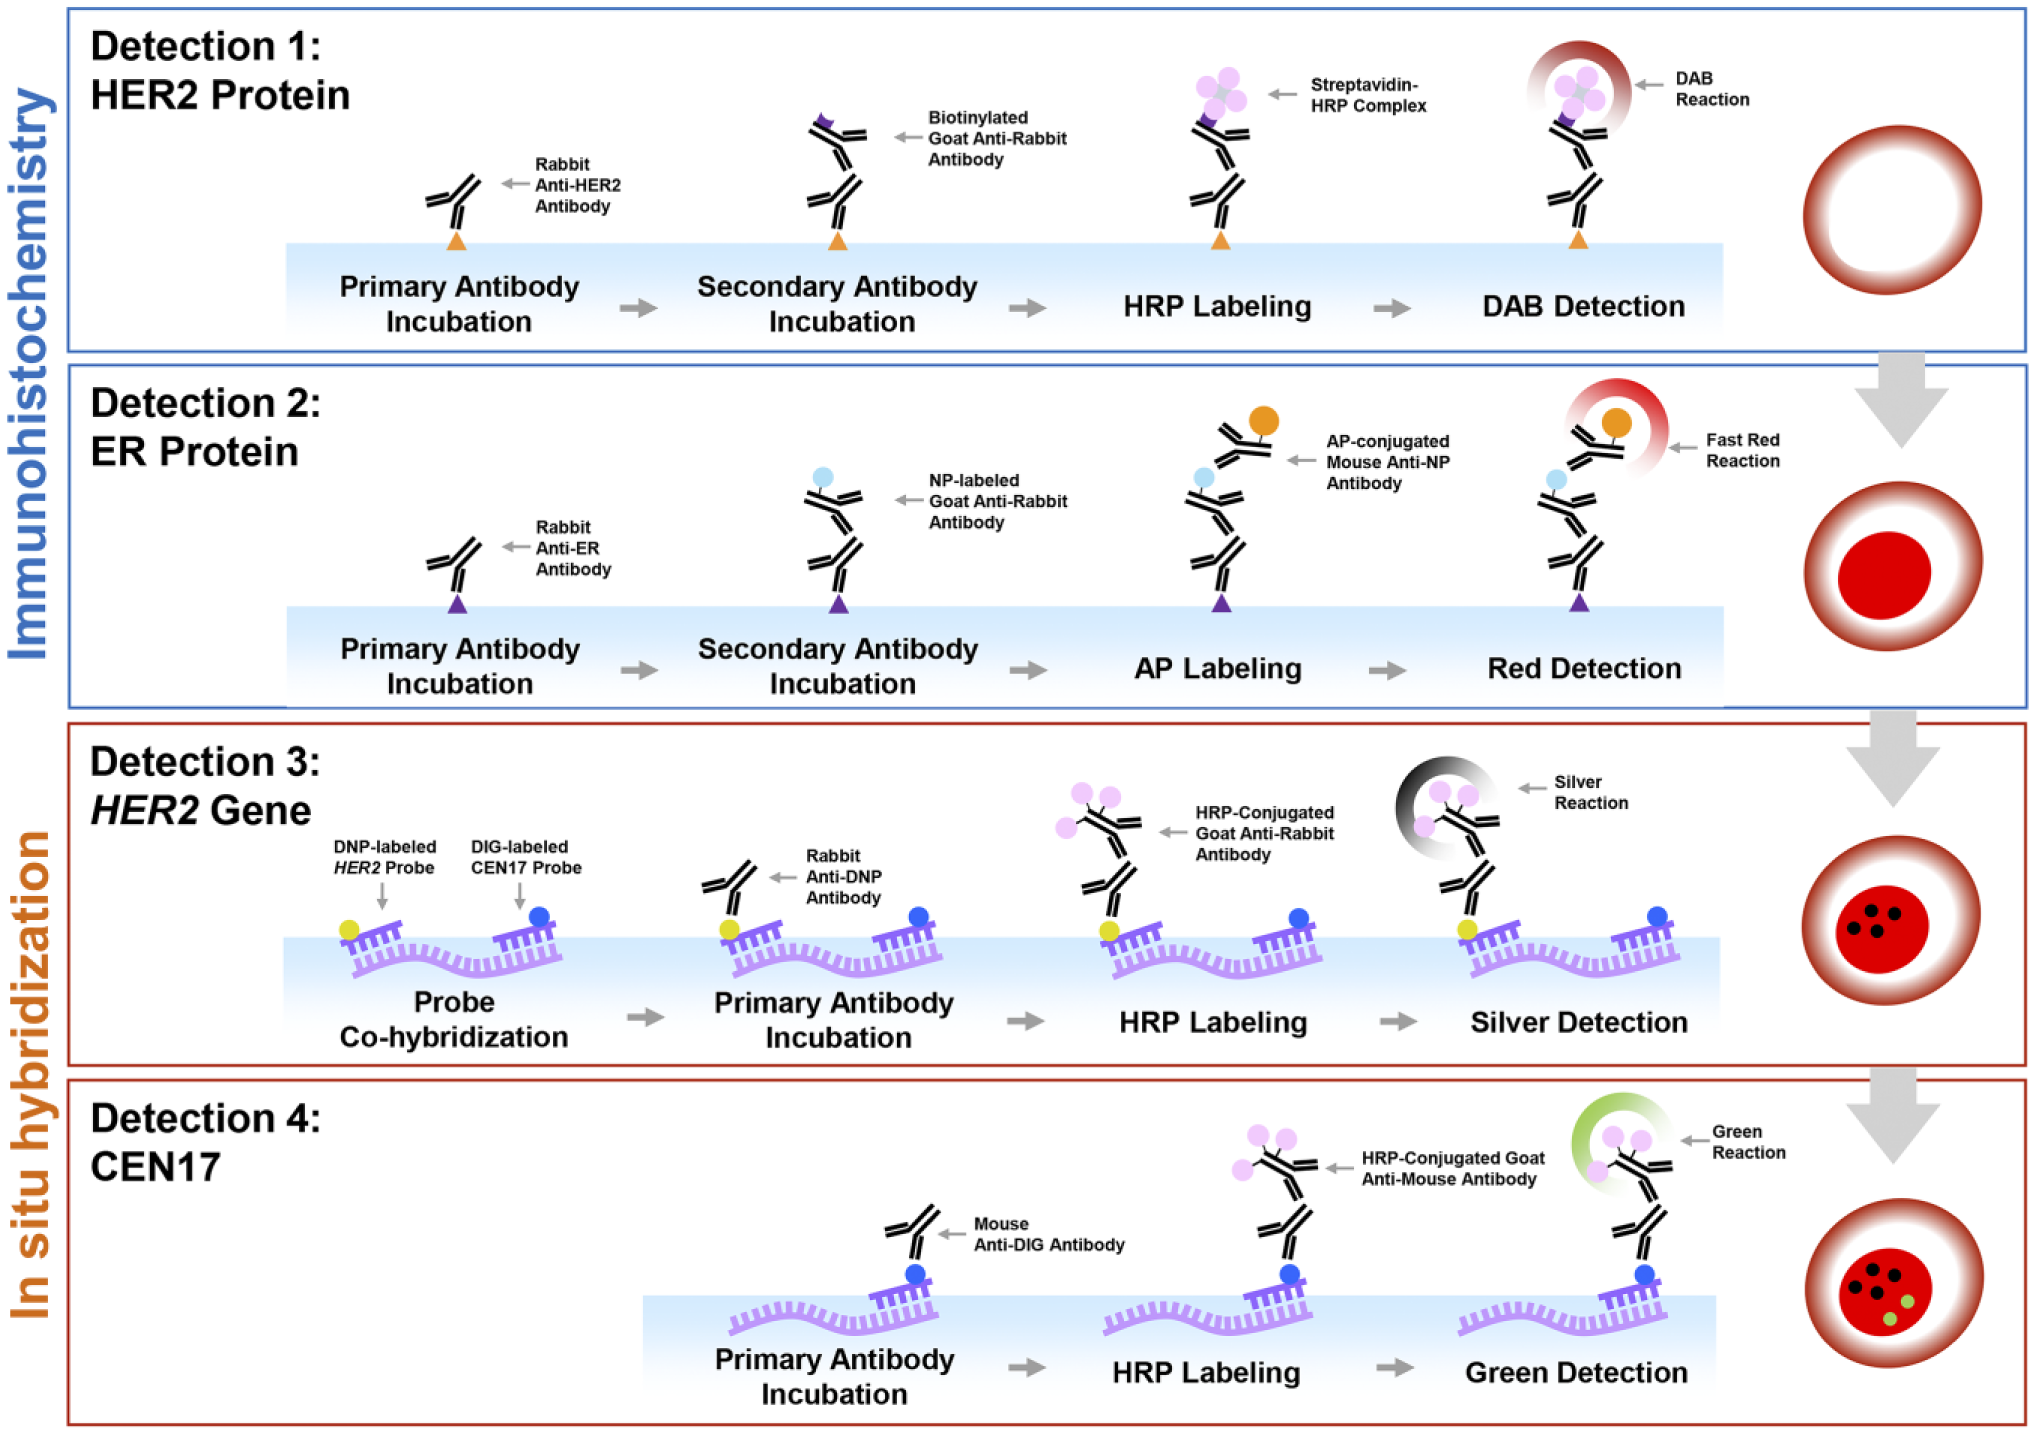
Schematic steps of the brightfield multiplex assay for the ER and HER2 proteins, HER2 gene, and CEN17. Immunohistochemical detection of HER2 and ER proteins was conducted before the ISH detection of the HER2 gene and CEN17. HER2 protein was visualized first with DAB followed by the detection of the ER protein with Fast Red. The ISH signal of the HER2 gene was detected with HRP-silver (black dots), and CEN17 was visualized with HRP-green (green dots). Abbreviations: ER, estrogen receptor; HER2, human epidermal growth factor receptor 2; ISH, in situ hybridization; HRP, horseradish peroxidase.
HER2 proteins were detected as previously described. ER IHC was conducted after HER2 IHC using DAB detection, and there were no additional pretreatment steps before ER IHC. Tissue sections were incubated with rabbit anti-ER antibody (clone SP1, 1 µg/ml, 790-4624; Ventana) for 16 min at 37C. Antibody binding sites were then labeled with anti-rabbit labeled with nitropyrazole (NP) hapten (760-4816; Ventana) for 8 min and then mouse anti-NP antibody labeled with alkaline phosphatase (760-4827; Ventana) for 8 min. ER protein was finally visualized with fast red detection (760-228; Ventana). The protein-stained tissue sections were then processed with additional heat and protease treatments to retrieve the DNA targets, followed by a dual-color ISH detection using a cocktail of HER2 and CEN17 oligo probes (the details of the probes are given below). The HER2 ISH signal was visualized with HRP-silver detection, whereas the CEN17 ISH signal was visualized with HRP-green detection.
HER2 and CEN17 Oligo Probe Cocktail
The single-stranded oligonucleotide HER2 probe (HER2 oligo probe) spans >327,000 nt (35,027,979–35,355,516) of genomic DNA from human chromosome 17, encompassing the HER2 target region, defined by the UCSC Genome Browser on Humans, May 2004 (NCBI35/hg17) Assembly. A bioinformatics search was used to identify the HER2-specific nucleic acid sequences around the HER2 target region. The selected genomic target nucleic acid sequence was separated into consecutive nonoverlapping 80 nt segments. A total of 1196 of ~80 mer oligonucleotides, each carrying five DNP hapten molecules, were synthesized. The oligonucleotides were purified and verified with mass spectrometry and gel electrophoresis. The single-stranded oligonucleotide CEN17 probe (CEN17 oligo probe) is pooled from 14 oligonucleotides with lengths from 58 nt to 87 nt. Each oligonucleotide was labeled with two DIG hapten molecules, which were PAGE purified and verified with mass spectrometry. The HER2 (15 µg/ml) and CEN17 (0.5 µg/ml) oligo probes were bulked in the formamide-containing buffer without human blocking DNA. The specificities of the HER2 and CEN17 probes were confirmed against those of the commercially available Food and Drug Administration (FDA)-approved double-stranded HER2 and CEN17 DNA probes in an FFPE xenograft and in clinical human tissue sections.
Assay Interpretation and Statistics
HER2 gene amplification, CEN17 polysomy, and HER2 gene heterogeneity were evaluated according to the criteria in the American Society of Clinical Oncology (ASCO)/College of American Pathologists (CAP) guidelines.16–18 HER2 microheterogeneity was defined as a HER2 gene amplification that was discordant from the expression of the HER2 protein. 19
The cancer cells that were detected by the brightfield multiplex assay were assessed as follows. Five representative areas from each tumor were selected and captured at a high magnification, and all cancer cells were counted using the count tool in Adobe Photoshop CS6 Extended (Adobe Systems Software Ireland Ltd.; San Jose, California) (Fig. 2). The average number of counted cancer cells was 1265 ± 482 per case. Representative images of HER2−/ER+, HER2+/ER+, HER2+/ER−, and HER2−/ER− cancer cell subpopulations are shown in Fig. 3. HER2 microheterogeneity was further divided into ER+ with HER2 microheterogeneity and ER− with HER2 microheterogeneity (Fig. 4).
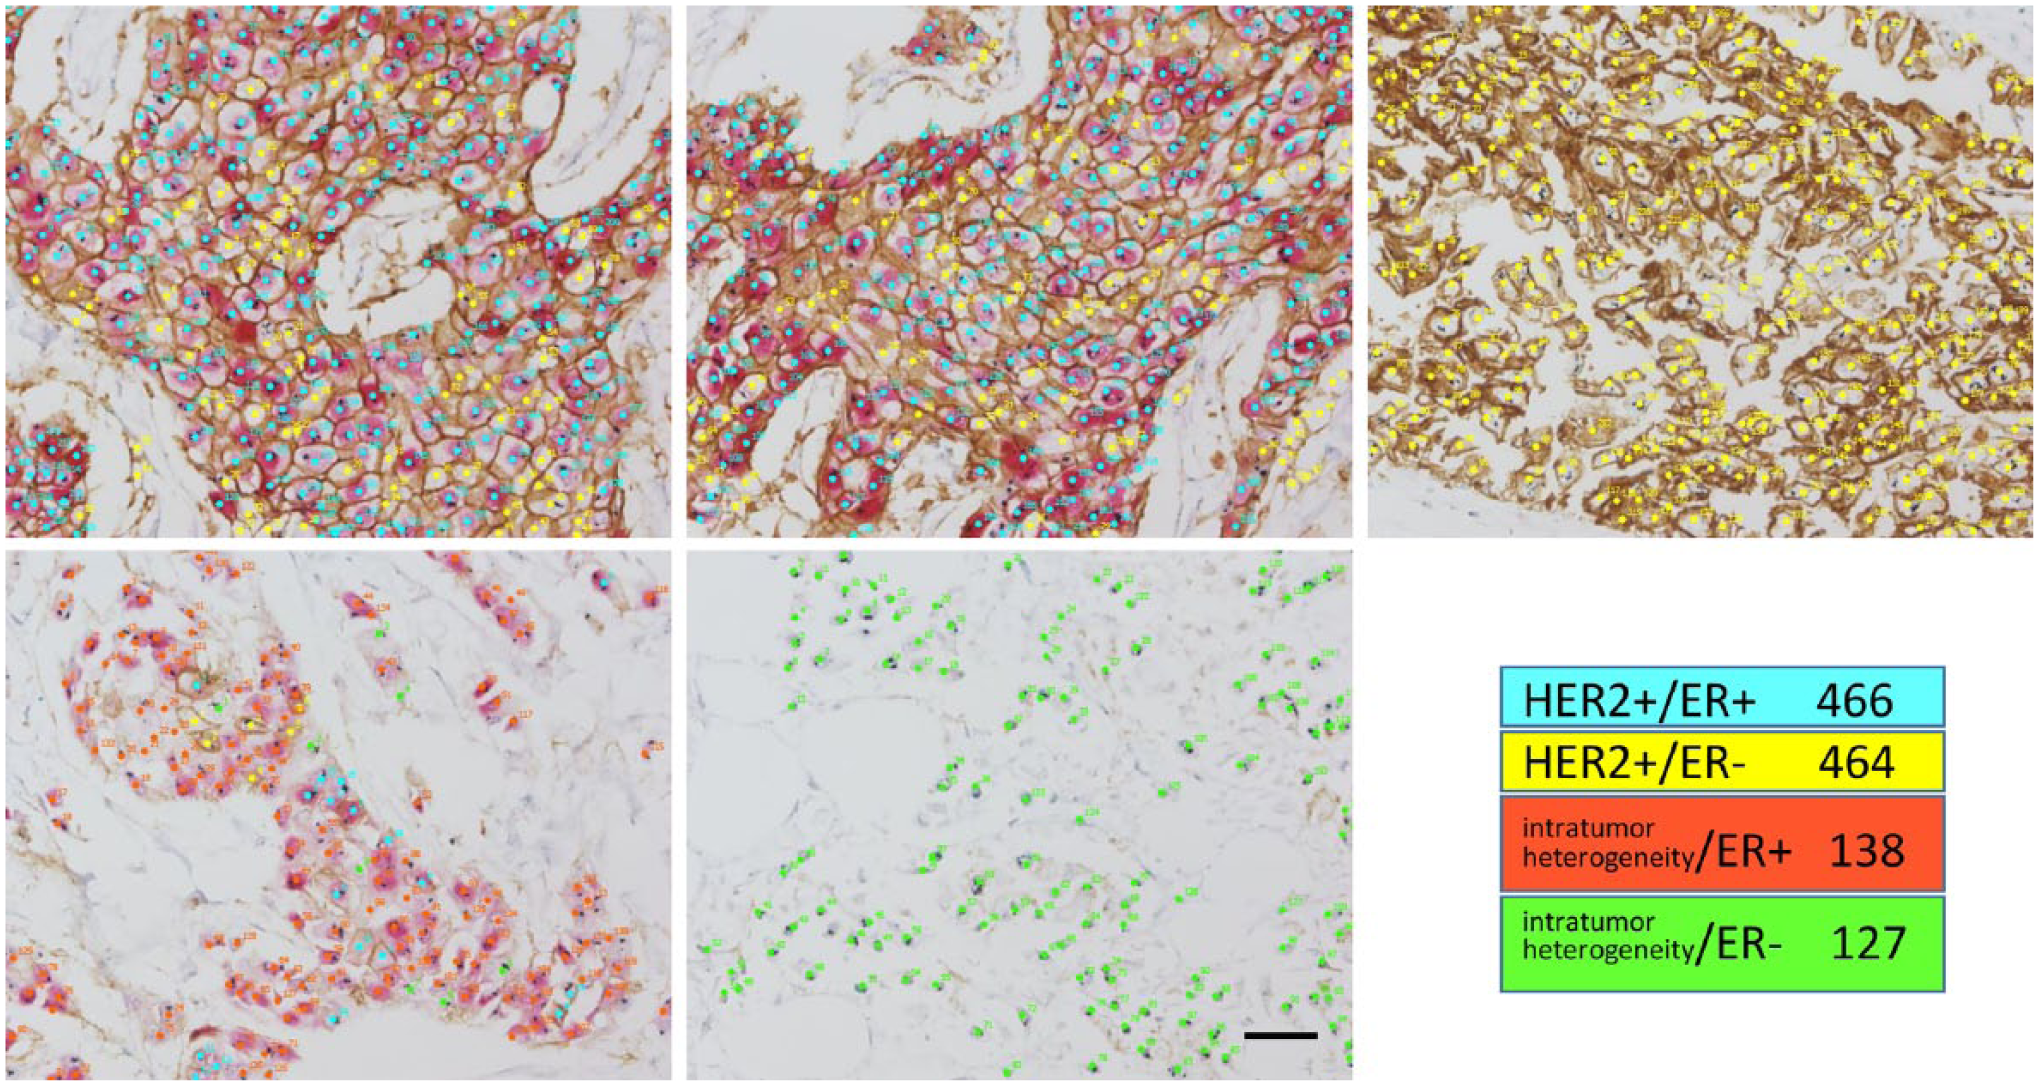
An example of the interpretation of cancer cell subpopulation in each tumor. An example case of HER2+/ER+ cases is shown (case no. 5 in Table 2). Five representative areas from each tumor were selected and captured at a high magnification. All cancer cells were counted and estimated into subpopulations. The allocated color for plotting of each subpopulation differs from the color in Figure 5. Abbreviations: HER2, human epidermal growth factor receptor 2; ER, estrogen receptor.
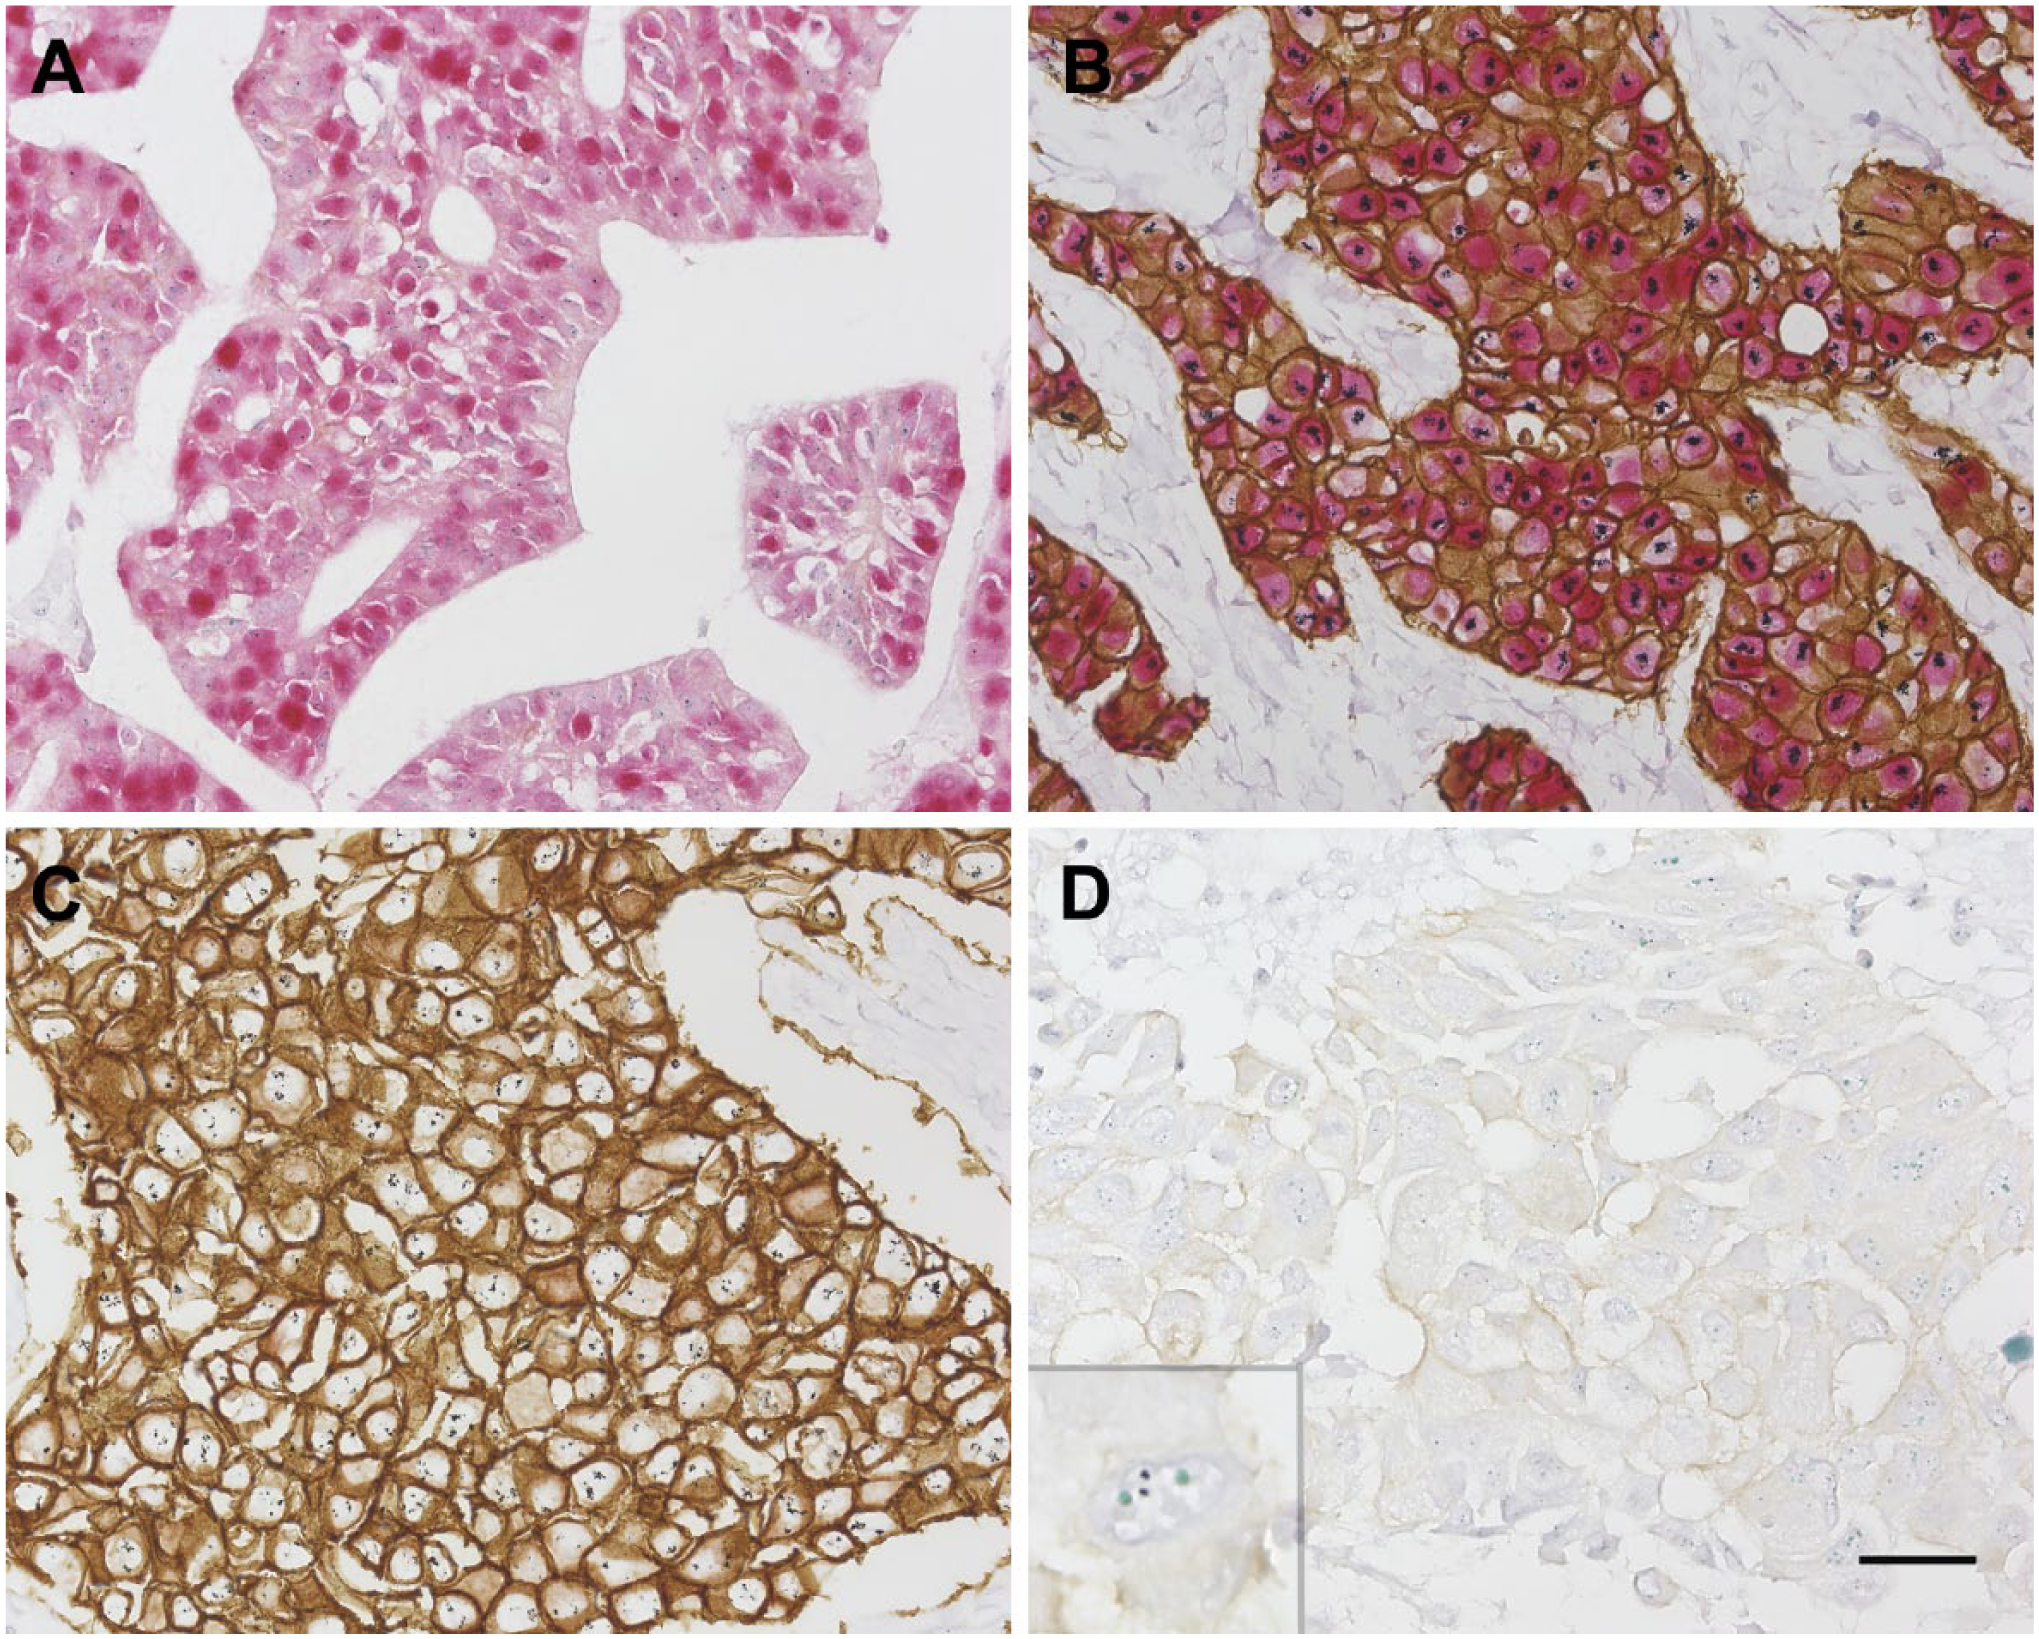
Representative images of cancer cells that were detected by the brightfield multiplex assay for the ER and HER2 proteins, HER2 gene, and CEN17. The HER2−/ER+ cancer cells have ER-positive nuclei (red) without HER2 gene amplification or HER2 protein overexpression (A); the HER2+/ER+ cancer cells have ER-positive nuclei (red) and HER2 gene amplification (black) and overexpress HER2 protein (brown) (B); the HER2+/ER− cancer cells show HER2 gene amplification (black) and overexpress HER2 protein (brown) (C); and the HER2−/ER− cancer cells lack both ER and HER2 overexpression (D). CEN17 is demonstrated as a green signal (inset). Scale bar, 25 µm. Abbreviations: ER, estrogen receptor; HER2, human epidermal growth factor receptor 2.
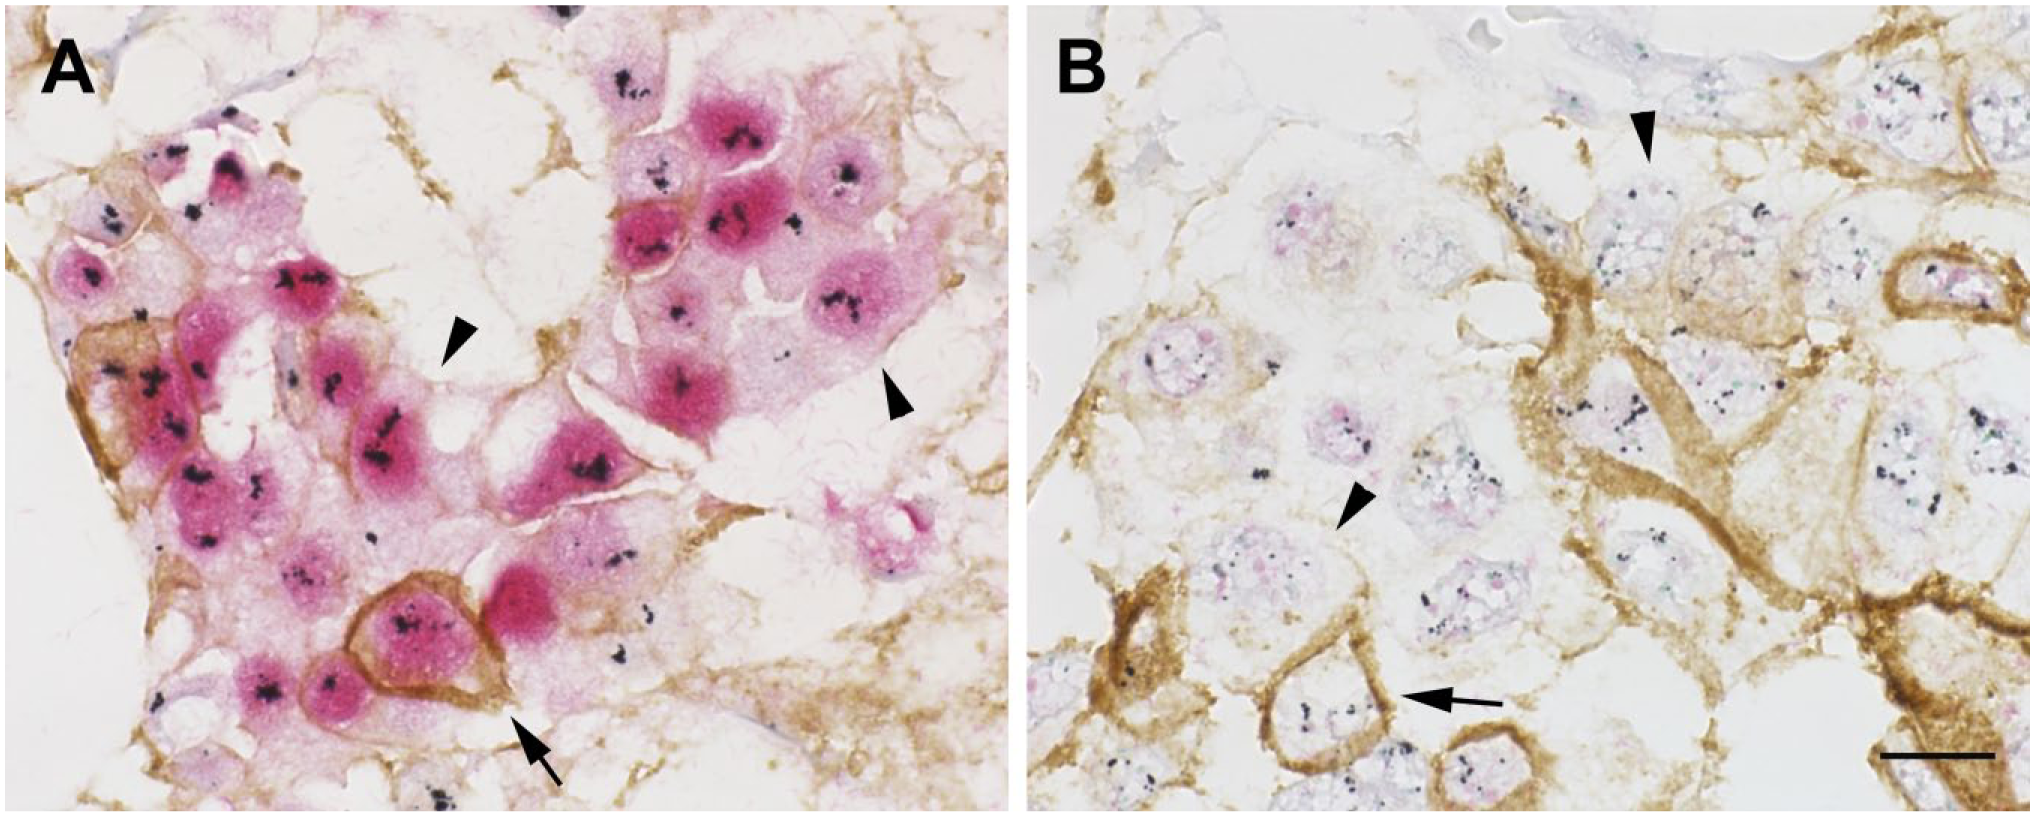
Cancer cells with HER2 microheterogeneity. ER+ cancer cells with HER2 microheterogeneity (A) and ER− cancer cells with HER2 microheterogeneity (B) are shown. Several cancer cells have HER2 protein that is localized to the cell membrane (brown) (arrow; A, B), but many cancer cells lack HER2 protein expression (arrowhead). HER2 gene amplification is detected as a black signal, and the ER protein is shown in red. Scale bar, 10 µm. Abbreviations: HER2, human epidermal growth factor receptor 2; ER, estrogen receptor.
The comparison of CEN 17 polysomy, HER2 gene heterogeneity, and HER2 microheterogeneity between the four tumor subtypes was statistically analyzed using the Kruskal–Wallis method. 20
Results
The HER2 GPA revealed no significant associations between CEN17 polysomy and HER2 genetic heterogeneity between any four tumor subtypes. The brightfield multiplex assay revealed that HER2 microheterogeneity was more frequently found in 8 of 11 HER2+/ER+ tumors compared with 0 of 12 HER2−/ER+ tumors, 3 of 9 HER2+/ER− tumors, and 0 of 2 HER2−/ER− tumors (p=0.0019).
It was further demonstrated that each tumor consisted of variable cancer cell subpopulations. All HER2−/ER+ tumors (11/11) contained HER2−/ER+ cancer cells, and 10 of 11 tumors contained HER2−/ER− cancer cells (Table 1). All HER2+/ER+ tumors (11/11) contained HER2+/ER+ cancer cells, and 7 of 11 tumors contained HER2+/ER− cancer cells. The minor subpopulations of cancer cells in the HER2+/ER+ tumors were detected as follows: HER2−/ER+ cancer cells in 2 of 11 tumors, ER+ with HER2 microheterogeneity cancer cells in 7 of 11 tumors, and ER− with HER2 microheterogeneity cancer cells in 4 of 11 tumors (Table 1). All HER2+/ER− tumors (9/9) contained HER2+/ER− cancer cells, and 3 of 9 tumors also contained ER− with HER2 microheterogeneous cancer cells (Table 1). All HER2−/ER− tumors (2/2) consisted of HER2−/ER− cancer cells without HER2 gene amplification (Table 1).
Detection of Cancer Cell Subpopulations by Brightfield Multiplex Assay in Each Case Categorized Into Tumor Subtype by Conventional Classification.
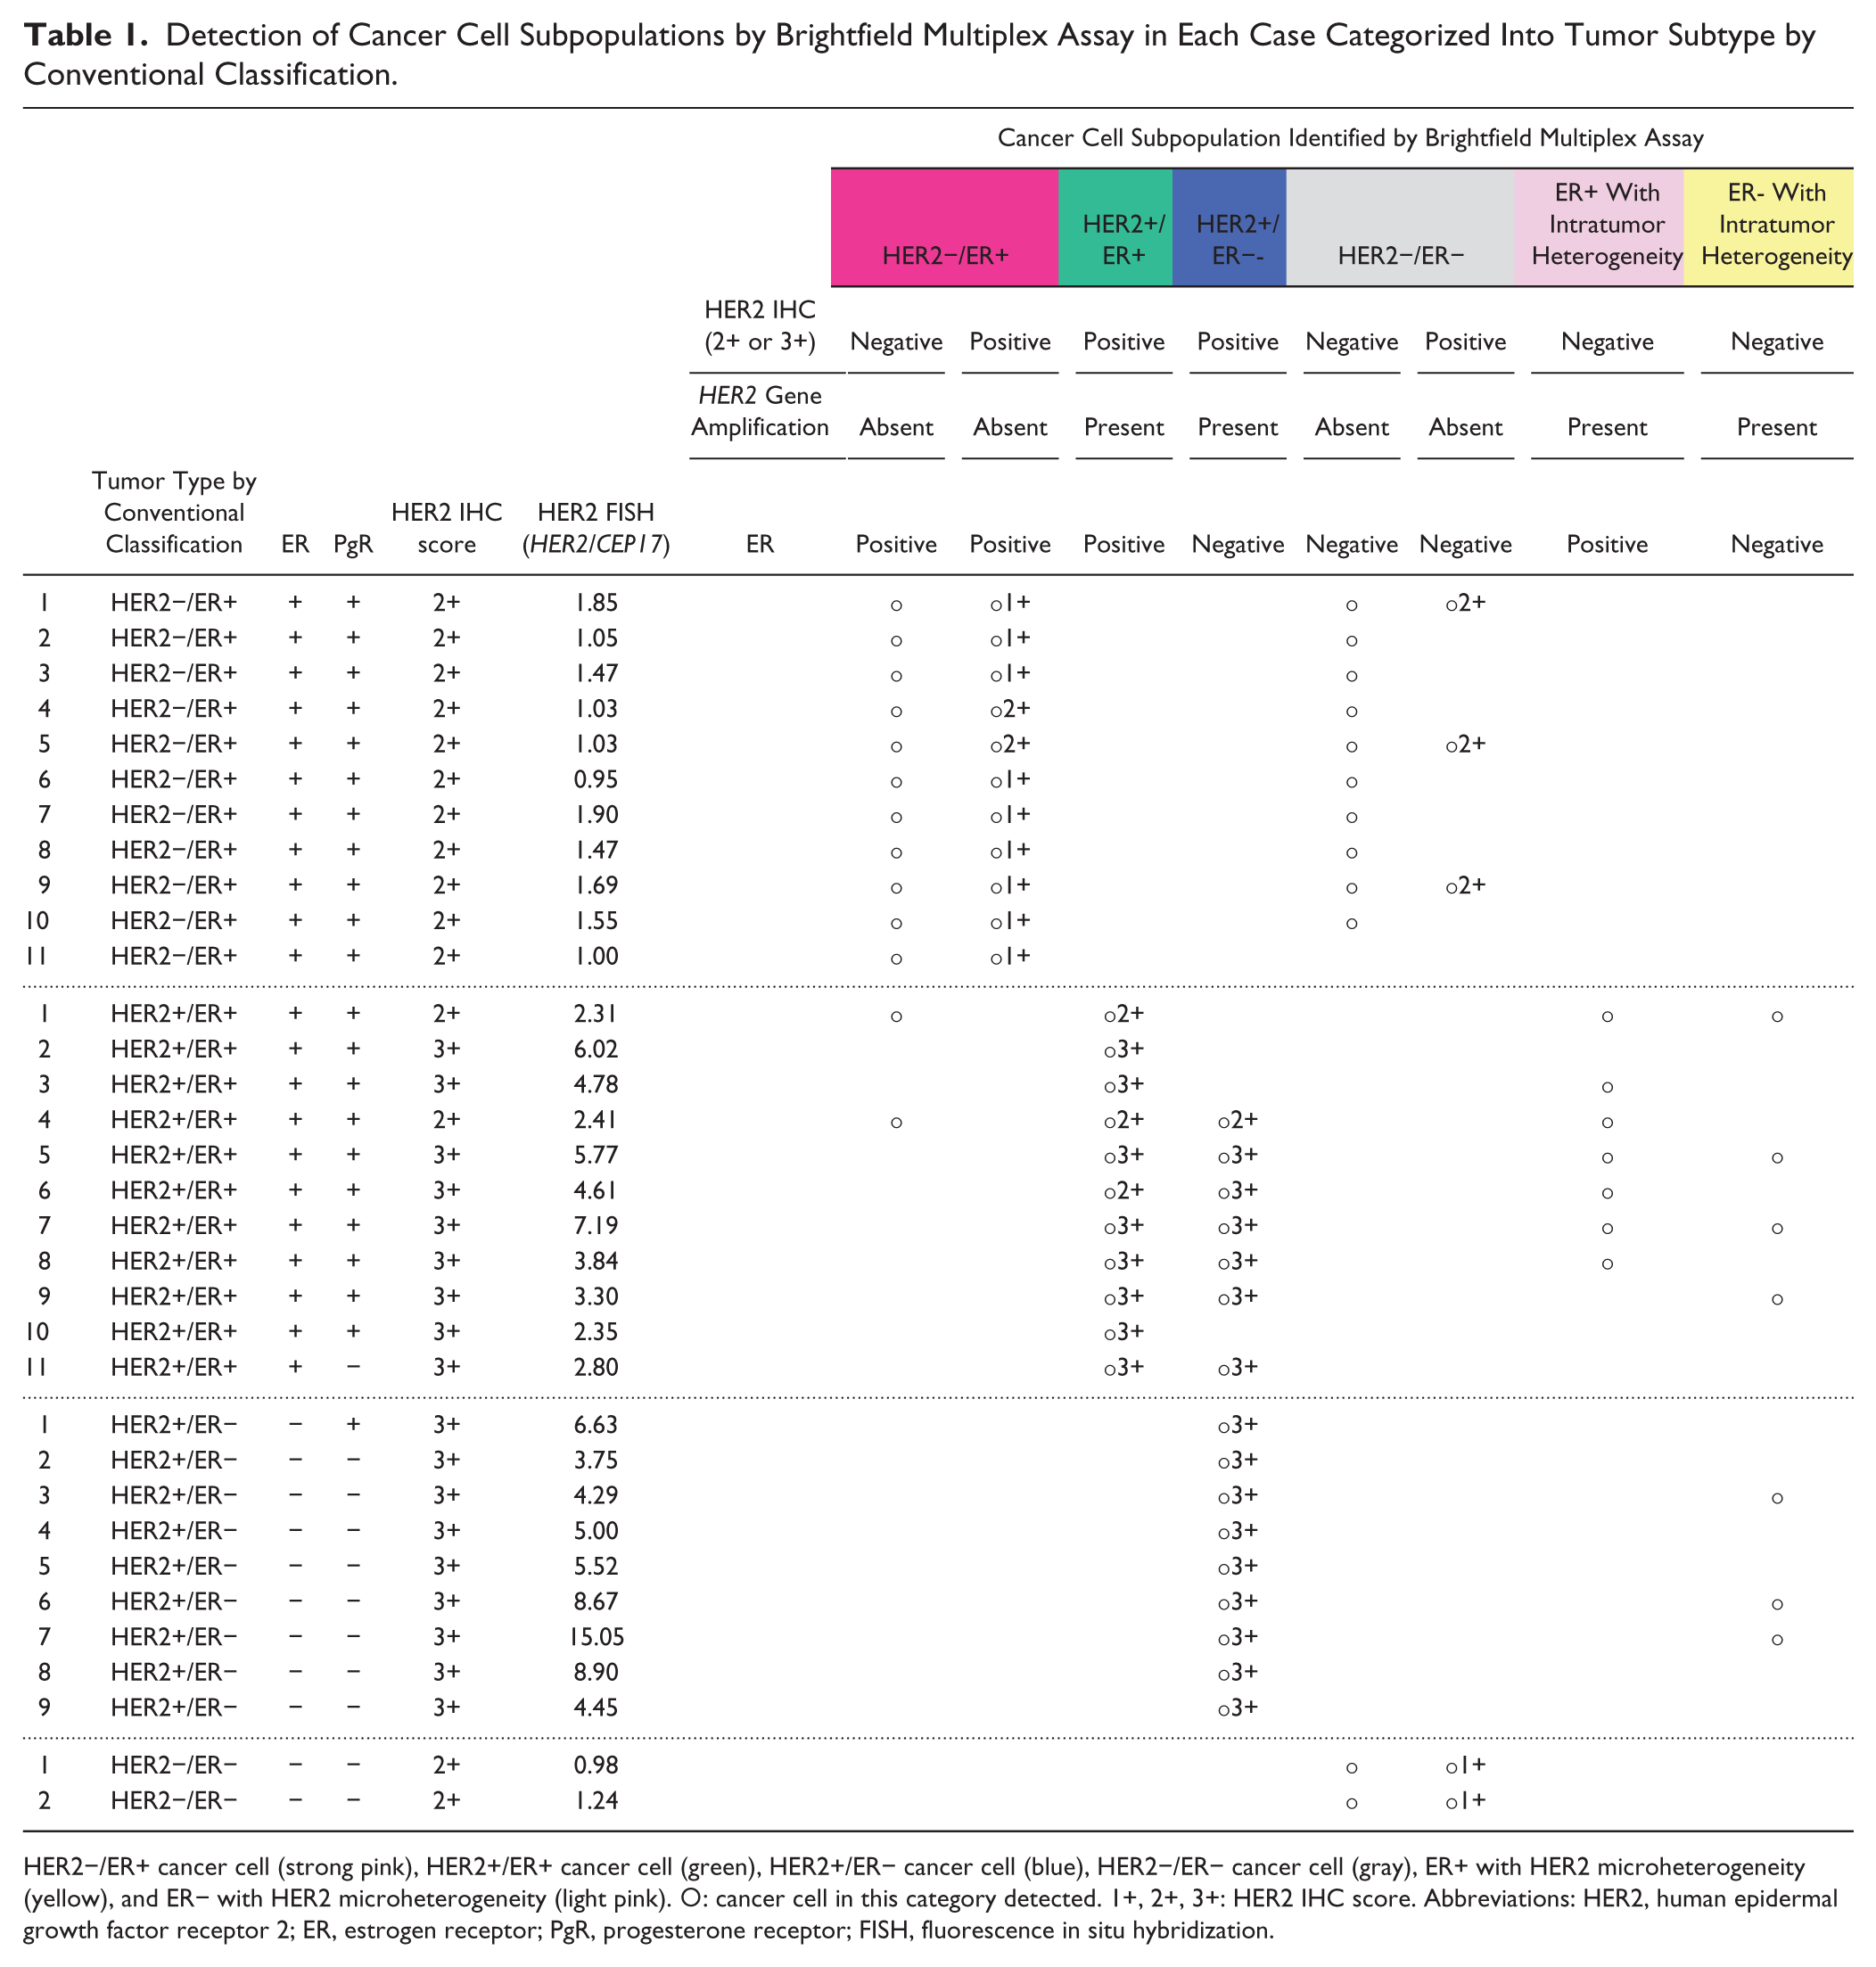
HER2−/ER+ cancer cell (strong pink), HER2+/ER+ cancer cell (green), HER2+/ER− cancer cell (blue), HER2−/ER− cancer cell (gray), ER+ with HER2 microheterogeneity (yellow), and ER− with HER2 microheterogeneity (light pink). ○: cancer cell in this category detected. 1+, 2+, 3+: HER2 IHC score. Abbreviations: HER2, human epidermal growth factor receptor 2; ER, estrogen receptor; PgR, progesterone receptor; FISH, fluorescence in situ hybridization.
The cancer cell subpopulations in the 11 HER2+/ER+ tumors were predominantly HER2+/ER− cancer cells (50.18%) and HER2+/ER+ cancer cells (39.05%) (Table 2, Fig. 5B). The less-represented cancer cell subpopulations were as follows: HER2−/ER+ cancer cells (4.26%), ER− with HER2 microheterogeneity cancer cells (3.58%), and ER+ with HER2 microheterogeneity cancer cells (2.93%). Excluding minor population of HER2 microheterogeneity, HER2+ cancer cells (89.23%) were more predominant than the ER+ cancer cells (43.31%) in the HER2+/ER+ tumors. The three other tumor subtypes, namely, HER2−/ER+, HER2+/ER−, and HER2−/ER− tumors, were more homogeneous with HER2−/ER+ cancer cells, HER2+/ER− cancer cells, and HER2−/ER− cancer cells present in 82.59% (Fig. 5A), 99.22% (Fig. 5C), and 100% (Fig. 5D) of samples, respectively.
Counted Number and Percentage of Cancer Cell Subpopulations in HER2+/ER+ Cases.
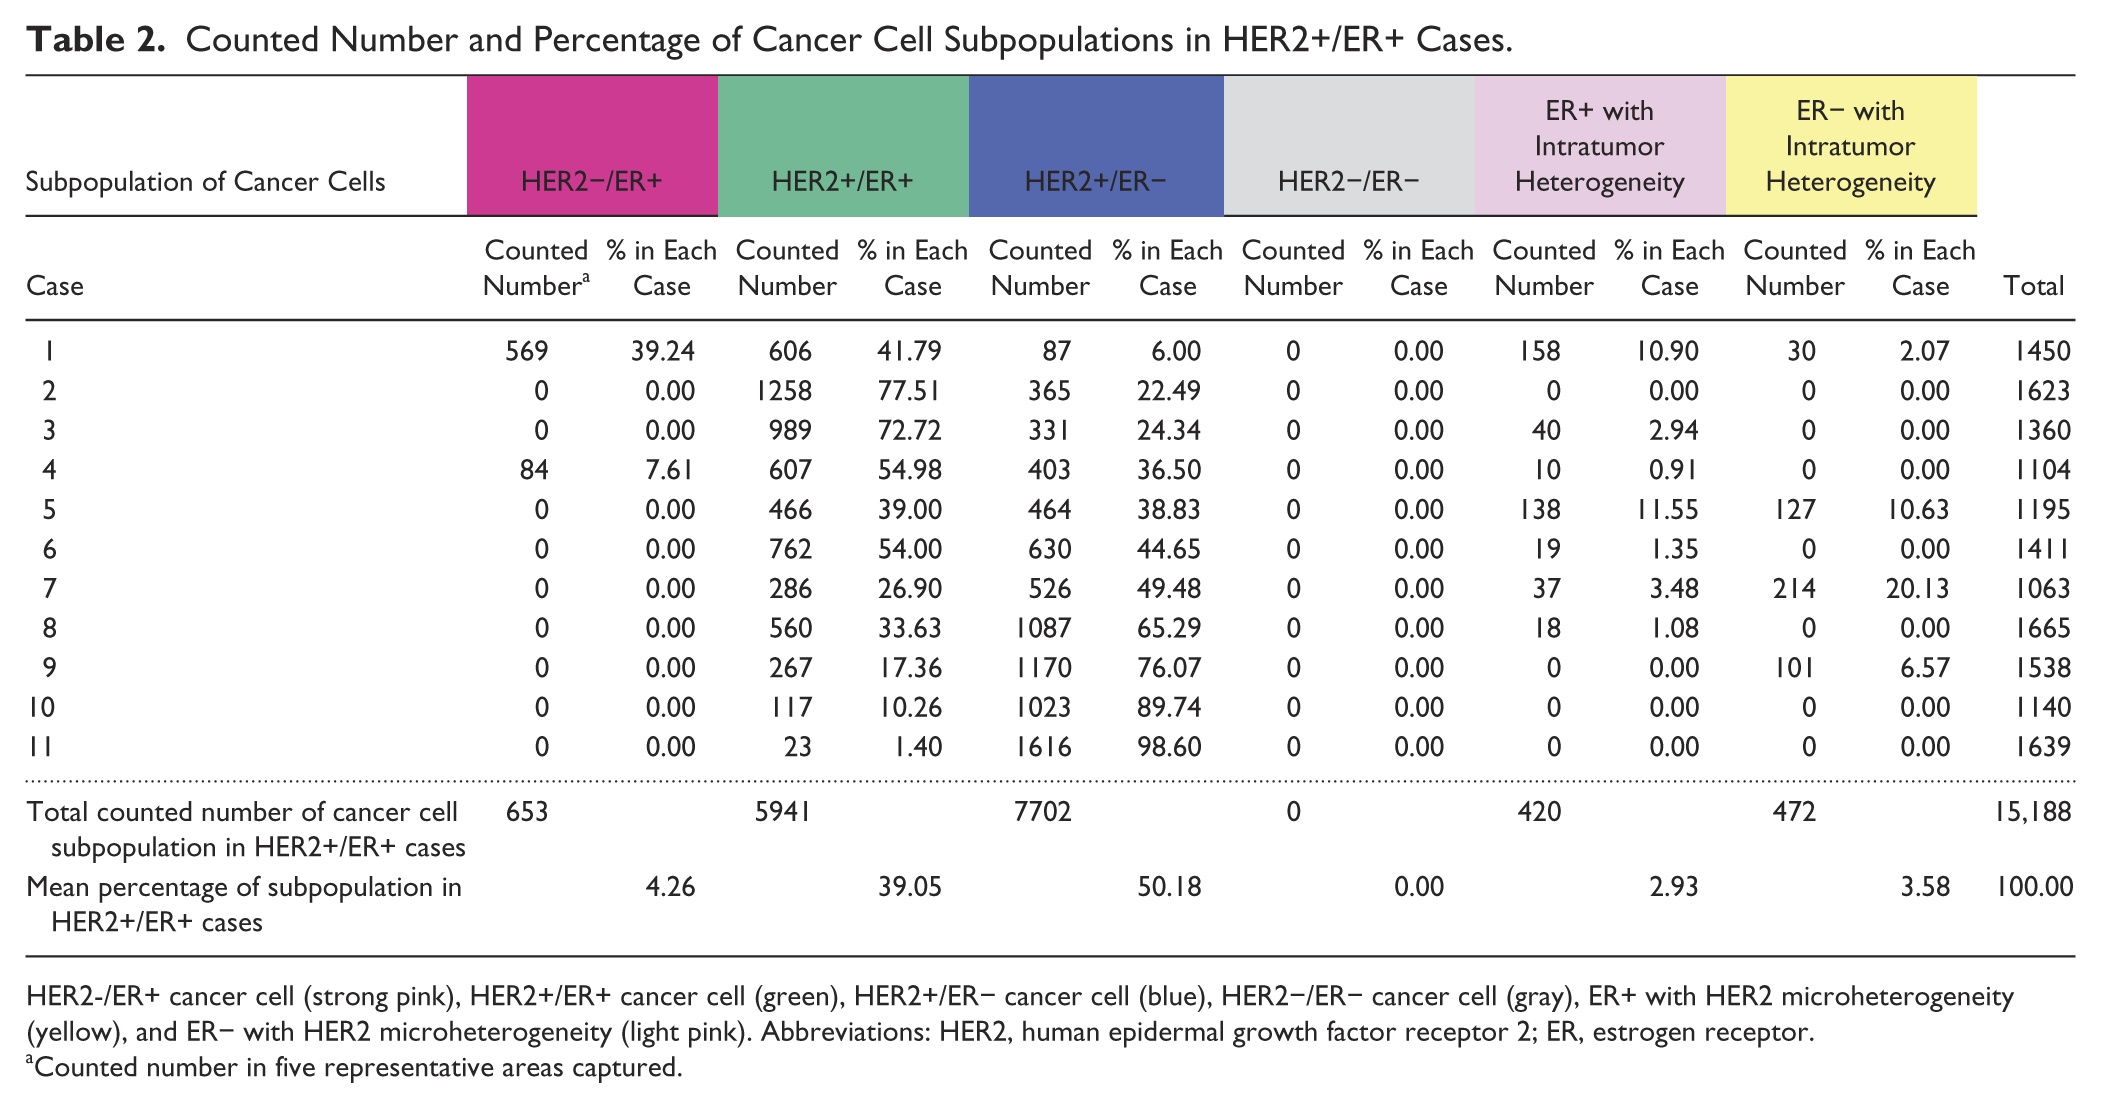
HER2-/ER+ cancer cell (strong pink), HER2+/ER+ cancer cell (green), HER2+/ER− cancer cell (blue), HER2−/ER− cancer cell (gray), ER+ with HER2 microheterogeneity (yellow), and ER− with HER2 microheterogeneity (light pink). Abbreviations: HER2, human epidermal growth factor receptor 2; ER, estrogen receptor.
Counted number in five representative areas captured.
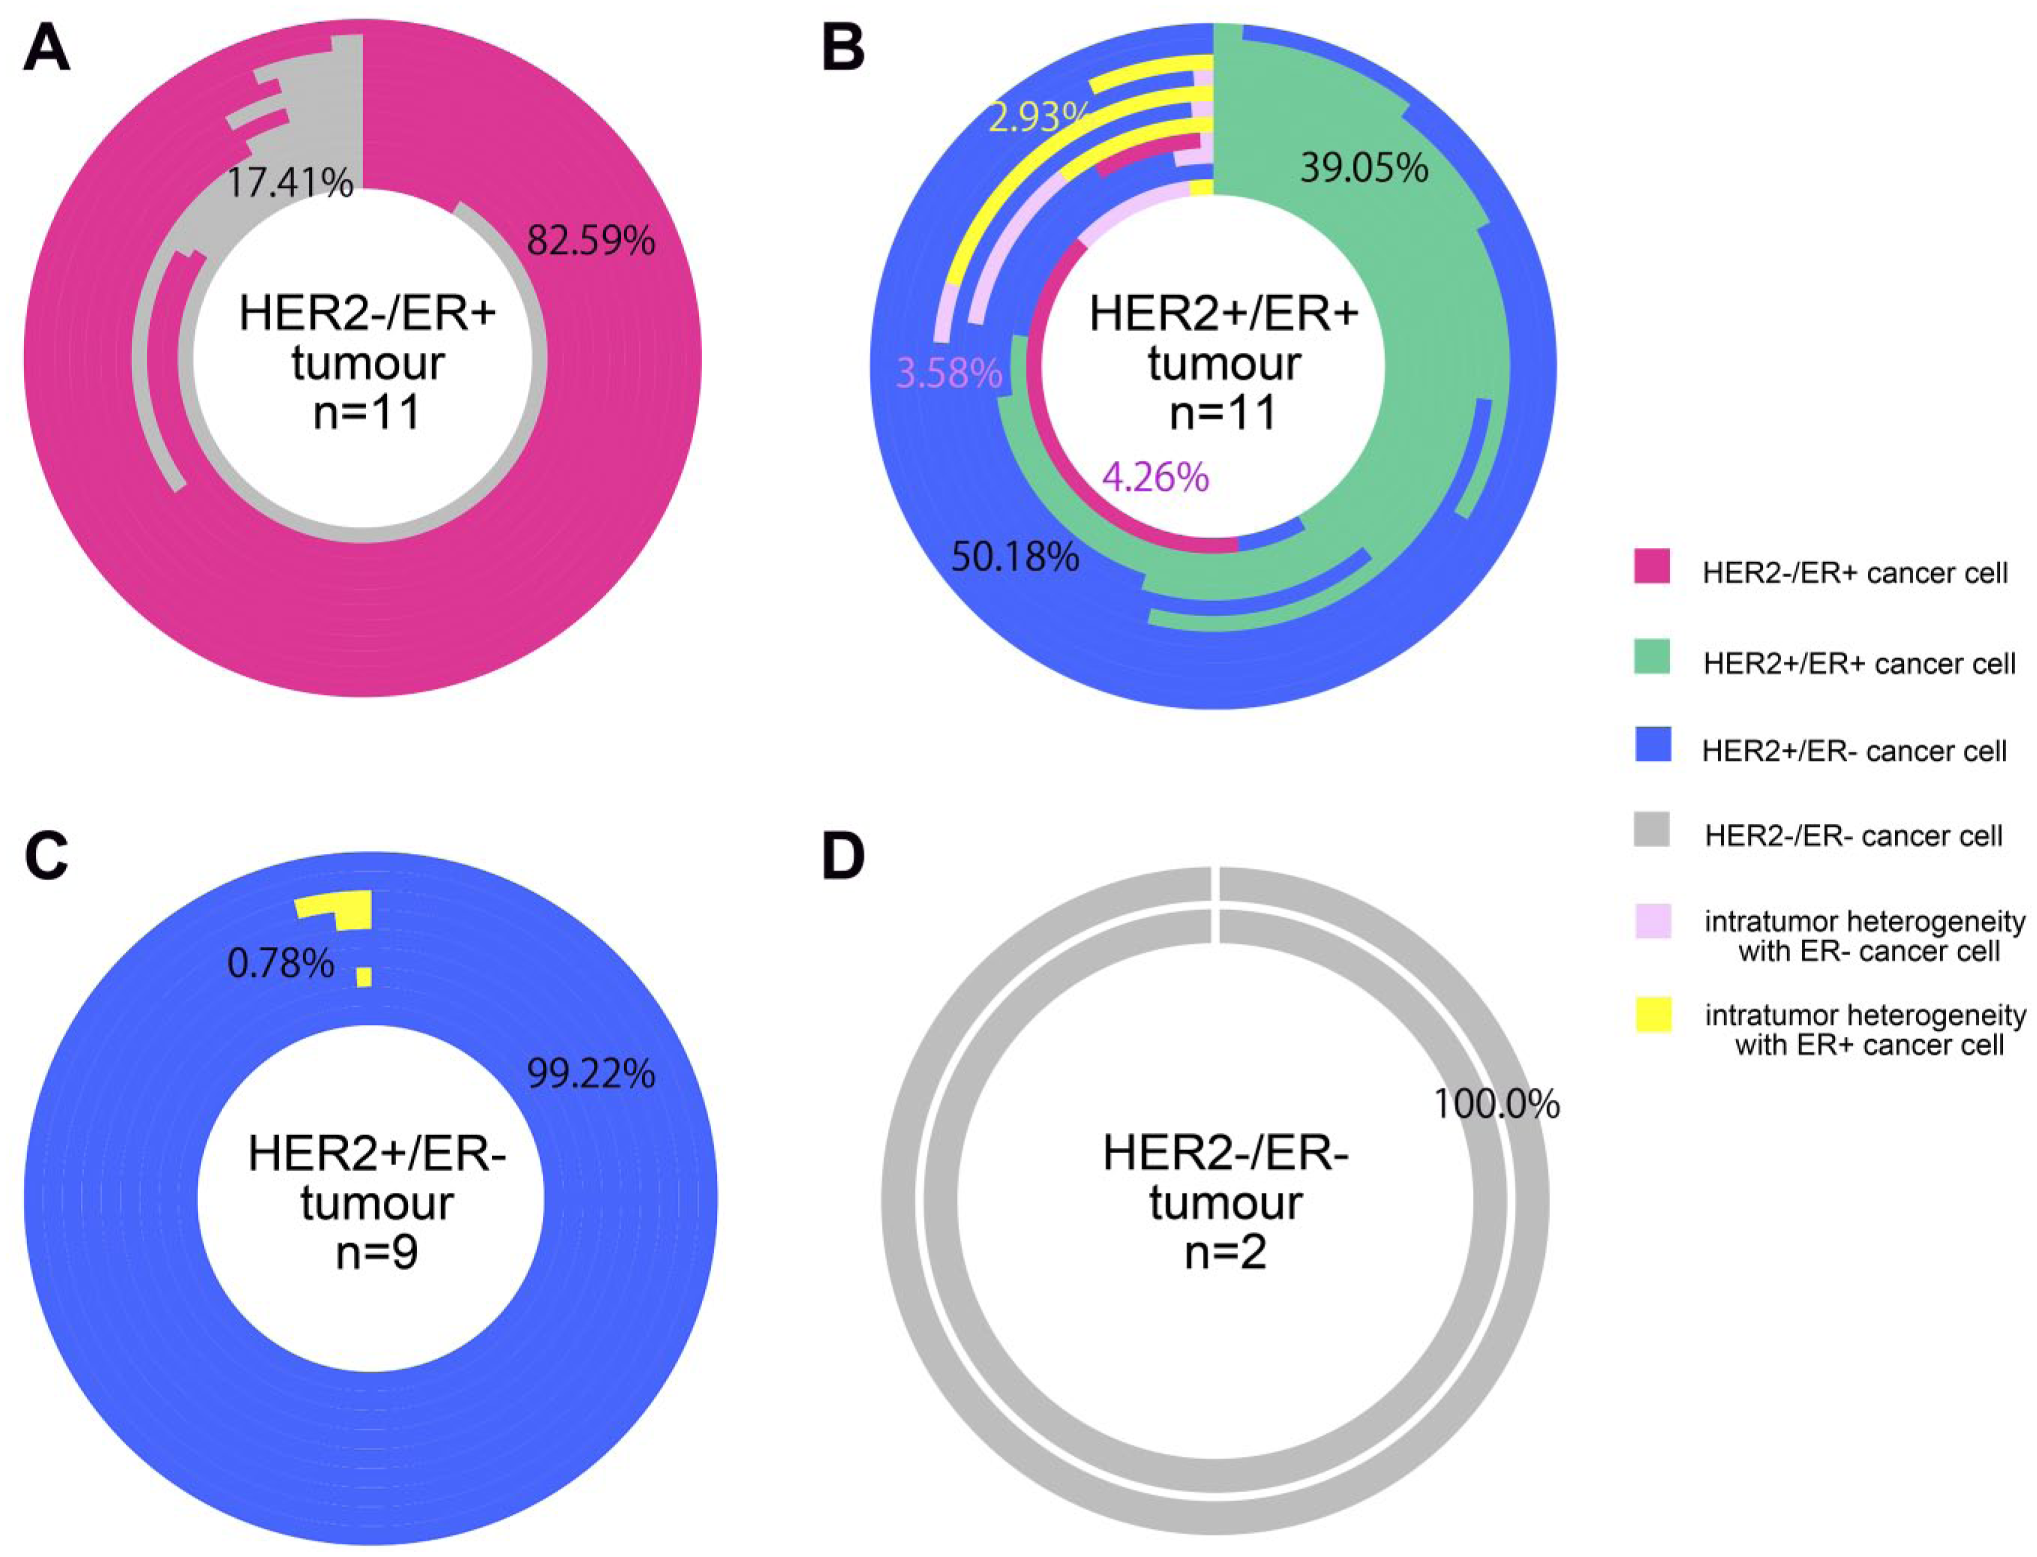
Subpopulation of cancer cells in each tumor subtype, as categorized by conventional classification. The four subtypes of breast tumors, as categorized by conventional classification, are shown in four circles as HER2−/ER+ (A), HER2+/ER+ (B), HER2+/ER− (C), and HER2−/ER− (D). Each column consists of a circle and represents a single tumor sample. The phenotypes of the cancer cells are shown in different colors, that is, HER2−/ER+ cancer cell (strong pink), HER2+/ER+ cancer cell (green), HER2+/ER− cancer cell (blue), HER2−/ER− cancer cell (gray), ER+ with HER2 microheterogeneity (yellow), and ER− with HER2 microheterogeneity (light pink). The length of the curved column shows the proportion of cancer cells within a particular subpopulation in a respective color out of the total number of cancer cells that were counted in each tumor. Abbreviations: HER2, human epidermal growth factor receptor 2; ER, estrogen receptor.
Discussion
A novel detection system to simultaneously evaluate the expression of ER and HER2 proteins, the HER2 gene, and CEN17 on a single FFPE section enables us to precisely estimate the ITH of BC samples at the individual cell level. This multiplex assay showed that HER2+/ER+ breast tumors consisted of heterogeneous and mixed subpopulations of cancer cells compared with the other three subtypes, of which more than 80% consisted of homogeneous cancer cells. The unique characteristics of HER2+/ER+ breast tumors have been shown by systematic gene alteration and expression analyses. The Cancer Genome Atlas reported that HER2-enriched mRNA subtype/HER2+ BCs have increased expression of tyrosine kinase receptors, including FGFR4, EGFR, and HER2, as well as genes within the HER2 amplicon. In contrast, luminal mRNA subtype/HER2+ BCs were found to be enriched in HR+ tumors and showed an increased expression of the luminal cluster of genes, including GATA3, BCL2, and ESR1. 21
It is intriguing that most of the dominant cancer cells in the HER2+/ER+ tumors were not HER2+/ER+ (30.05%) but HER2+/ER− cancer cells (50.18%) and that the HER2 gene amplification was detected in approximately 95.74% of samples, excluding the HER2−/ER+ cancer cells (4.26%). Thus, HER2+/ER+ tumors were generally accompanied by HER2 gene amplification, and the expression phenotype of ER and HER2 varied from case to case and from area to area. Only one very recently published report by Rye et al. 22 is helpful for discussion. Rye et al. described a detection system for the quantification of ER and HER2 proteins, the HER2 gene, and CEN17 on a single FFPE section using the fluorescent labeling probe, in contrast to our chromogenic probe, which can be observed under the brightfield microscope. In this article, several example cases of HER2+/ER+ tumors were shown, and the major components were HER2+/ER+ and HER2+/ER− cancer cells, which is compatible with our results. However, no actual proportion of cancer cells was calculated in this article. Our present results are currently the first to demonstrate the actual proportion of cancer cells consisting of HER2+/ER+ tumors at the individual cell level.
What does the proportion of HER2+/ER+ tumors teach us? At present, it is unclear how an HER2+/ER+ tumor consisting of heterogeneous cancer cells develops. Considering the results of this study that demonstrated HER2 gene amplification in approximately 95.7% of samples, it is possible to conclude that cancer cells harbor HER2 gene amplification. It is speculated that cancer cells have gained or lost the ER+ phenotype depending on their microenvironment. It is well known that, in an in vitro cell culture system, treatment with estrogen results in the downregulation of ER.23–28 The ER phenotype of primary human BCs could be changed in metastatic tumors, which have a higher incidence of 10.2% to 40.0%, compared with the incidence of HER2 overexpression at 0% to 14.7%.29–34 The tendency of tumors to frequently switch their ER phenotype was reported in both retrospective29–33 and prospective 34 studies, and under both adjuvant29–34 and neoadjuvant 33 treatment regimens. There is a possibility that HER2+/ER− cancer cells that are detected to have a considerable population in HER2+/ER+ tumors might be originally from HER2+/ER+ cancer cells that lacked an ER phenotype.
Recent technological developments have enabled us to recognize heterogeneous cancer cells circulating in the blood.35,36 Blood samples can be repeatedly examined with less invasive procedures, so cancer cells or cancer-derived DNA in circulation has benefits for monitoring disease progression. To provide the most effective treatment strategies based on this precise monitoring system, histochemical procedures to demonstrate ITH, such as the multiplex assay introduced in this study, are required to set a gold standard for baseline monitoring. In addition, the combination of these methods with next generation sequencing at the single cell level will clarify the precise mechanisms that are involved in the development of ITH. We believe that this novel brightfield multiplex assay is a useful procedure not only for pathologists but also for basic researchers and physicians.
In conclusion, a new brightfield assay demonstrated that HER2+/ER+ breast tumors consisted of heterogeneous cancer cell subpopulations, and more HER2+/ER− cancer cells than HER2+/ER+ cancer cells were represented in these samples.
Footnotes
Acknowledgements
The authors thank Mrs Ai Itoh and Mrs Yukari Hirotani for their technical support. They also thank Dr Bryce Portier and Dr Greg Harlow for their review.
Competing Interests
The author(s) declared the following potential conflicts of interest with respect to the research, authorship, and/or publication of this article: Dr Masuda received compensation as a consultant for Ventana Medical Systems. Drs Nitta, Kelly, Zhang, Farrell, and Dennis are employees of Ventana Medical Systems (Ventana), Inc., a member of the Roche group. All the authors have filed a joint patent application for the simultaneous analyses of human epidermal growth factor receptor 2 and estrogen receptor status in breast cancer patients.
Author Contributions
SM planned the study, analyzed the data, and wrote the manuscript. HN conducted the assay optimization using xenograft tumors and performed all assays on some of the clinical cases. BDK worked with HN for the assay optimization of the multiplex assay. WZ, MF, and BK worked on the human epidermal growth factor receptor 2 oligo probe design and in situ hybridization assay development. ED provided oversight for this research and contributed significantly to writing the manuscript.
Funding
The author(s) disclosed receipt of the following financial support for the research, authorship, and/or publication of this article: This work was supported by research funds from Ventana Medical Inc.