
Abstract
Although there are thousands of formalin-fixed paraffin-embedded (FFPE) tissue blocks potentially available for scientific research, many are of questionable quality, partly due to unknown preanalytical variables. We analyzed FFPE tissue biospecimens as part of the National Cancer Institute (NCI) Biospecimen Preanalytical Variables program to identify mRNA markers denoting cold ischemic time. The mRNA was extracted from colon, kidney, and ovary cancer FFPE blocks (40 patients, 10–12 hr fixation time) with 1, 2, 3, and 12 hr cold ischemic times, then analyzed using qRT-PCR for 23 genes selected following a literature search. No genes tested could determine short ischemic times (1–3 hr). However, a combination of three unstable genes normalized to a more stable gene could generate a “Cold Ischemia Score” that could distinguish 1 to 3 hr cold ischemia from 12 hr cold ischemia with 62% sensitivity and 84% specificity.
Introduction
Formalin-fixed paraffin-embedded (FFPE) tissue samples are amenable to immunohistochemical, genetic, gene expression, and proteomic analyses. They make up the vast majority of biospecimens stored in tissue banks for potential use in research. For FFPE tissue, preanalytical variables capable of biasing downstream results include warm and cold ischemic times (defined as the period of time that the tissue is deprived of oxygen while at body temperature and below body temperature), the formalin type, the formalin-fixation time, and the duration and conditions of long-term storage.1–3 It is not feasible to control warm ischemia when collecting clinical tissue and therefore the effects it causes can only be considered as part of the overall intraindividual variability. On the contrary, cold ischemic time is under the control of the staff collecting and processing the biospecimens and is therefore controllable, although the staff resources and the costs of ensuring very short cold ischemic times are high.
The literature pertaining to the effect of cold ischemia has recently been reviewed by Grizzle et al., who conclude that mRNA is generally fairly resilient to cold ischemia, with up to 3% of the transcriptome-affected within 3 hr and 10% after 6 hr, with the tissue type likely being an important factor. 4 However, the literature is contradictory in that three microarray-based studies show 8% to 30% of transcripts displaying more than 2-fold change in expression after 10 to 120 min cold ischemia in colorectal and lung tissue.5–7 The relationship between cold ischemia and gene expression is complex, as evidenced in one of the aforementioned microarray studies, where 30% of genes showed altered expression levels in response to 120 min cold ischemia, but only 0.4% of genes had a consistent direction of expression-change across all the evaluated ischemic time points. 5
Proteomic studies have found the percentage of positive cells and the intensity of the staining for clinically relevant breast immunohistochemical biomarkers on FFPE tissue are affected by cold ischemic times of 2 hr.8,9 Also with FFPE breast tissue, up to 3 hr cold ischemia had no impact on signal intensity in different in situ hybridization methods quantifying ERBB2. 10 Two proteomic studies that used mass spectrometry on fresh-frozen tissue of different tissue types describe changes in protein expression beginning within 1 hr of cold ischemia, with the percentage of the proteome involved being less than 2% in one study and more than 30% in the other.11,12 The relative instability of the phosphoproteome to cold ischemia is well known, exemplified in a study using fresh-frozen breast and ovarian tissue in which 24% of the phosphoproteome but none of the global proteome were effected by 1 hr of cold ischemia. 13
Based on the published literature summarized above, acceptable cold ischemic times in FFPE tissue could be defined as less than 30 min for phosphoprotein analysis and 6 hr for protein and mRNA analyses, with shorter cold ischemic times where targets of known instability to cold ischemia are the subject of the analysis. In the context of FFPE tissue samples, cold ischemia is particularly important as it will be prolonged beyond the time the sample is placed in the formalin because the time the fixative takes to penetrate to the center and completely fix the tissue block is extensive. 14
For FFPE tissue biorepositories where the preanalytical conditions have not been recorded, it is important to be able to apply retrospective qualification assays of sufficient sensitivity and specificity to determine the corresponding preanalytical conditions. High specificity is required in those cases where the downstream analysis is expensive and the user requires certainty that an FFPE sample is fit for purpose before deciding to include it in his or her analysis. Assays for qualification and quality stratification of different types of specimens were recently reviewed. 15 However, some gaps remain, such as an easily accessible and applicable tool for the assessment of cold ischemic time. As a collaboration between the Integrated Biobank of Luxembourg (IBBL) and the National Cancer Institute (NCI), our study aim was to identify a simple gene expression signature that could reliably detect FFPE tissue blocks of different tissue types that have been subjected to long cold ischemic times.
Materials and Methods
Biospecimens
Biospecimens were collected and processed at four Biospecimen Source Sites (BSS) using the same standard operating procedure and sent to the centralized Biospecimen Preanalytical Variable Program (BPV) biospecimen repository at Van Andel Research Institute. Tumor samples from 40 patients (18 kidneys, 12 colons, and 10 ovaries) were selected from BPV collection for this study. Each tumor biospecimen (average size 1.6 cm × 1.4 cm × 1.2 cm) was cut into six equally sized tissue blocks, one for FFPE QC, one for a frozen control, and the remaining four placed in a humidified chamber (100 ml container with a damp gauze) and kept at room temperature for four different cold ischemic times: 1 hr, 2 hr, 3 hr, and 12 hr. After the designated ischemic time had elapsed, each tissue block was fixed in 50 ml of 10% neutral buffered formalin for 10 to 12 hr, and then processed at its collection site. To minimize intersite variations in tissue processing, all sites used a Polaris II tissue processor (Leica Biosystems, Richmond, IL) and adhered to the same tissue processing protocol. Additional sections were cut from all 160 FFPE blocks for histological evaluation. These were cut directly before and directly after those used for RNA extractions, stained with hematoxylin eosin saffron as previously described and evaluated by a certified pathologist to determine the percentage tumor and necrosis. 16 All tissue samples contained at least 50% tumor and less than 20% necrosis. Macrodissection was not used to attempt to enrich areas of the tissue. Necrosis was documented in the pathology review both at the collection site and by the project qualifying pathologist. Tissue histology exceeding the cutoff values for necrosis were excluded from use. All patients gave formal consent for the study, and ethical approval was granted by the ethics committees of the University of New Mexico, Emory University, University of Pittsburg, and Boston Medical Center.
RNA Extraction and qRT-PCR
All samples were housed at a central biospecimen core resource where RNA was extracted from the FFPE biospecimens using the QIAsymphony automated robot with QIAsymphony RNA kit (both Qiagen, Valencia, CA). Each RNA extraction was performed from one section of 10 µm and carried out the same day that the section was cut. The tissue blocks were 3 to 18 months old before their use. The optional DNase (deoxyribonuclease) step was included to prevent co-elution of unwanted DNA. 17 RNA aliquots were subsequently concentrated using Zymo-Spin IIC Columns (Zymo Research, Irvine, CA). Purified RNA was quantified by OD260 nm spectrophotometry. One aliquot containing 3.7 µg RNA was sent to IBBL for analysis. Multiple extractions per FFPE block were performed with the resultant RNA aliquots randomly allocated to several different projects. The RNA used in this study was therefore purified from sections cut from different depths within each block and bias induced by ongoing cold ischemia (while formalin penetrated to the center of the block) avoided due to random sampling.
Nineteen genes that were potential markers for ischemia and four potentially stable “housekeeping genes” were selected for analysis (Table 1) based on published literature.5,18,19 The ubiquitous expression for each gene in its tissue type was verified using the GTEx data set. 20 One µg of RNA from each of the 160 FFPE blocks was converted into cDNA in a total volume of 20 µl using random primers and the High Capacity cDNA Reverse Transcription kit (ThermoFisher Scientific, Allst, Belgium) on a C1000 PCR thermal cycler (Bio-Rad, Temse, Belgium). The cDNA was diluted 20 times to a total volume of 400 µl. Each of the 480 qPCR reactions (40 Patients × Four Cold Ischemic Times × 23 Genes) was carried out in triplicate using 5 µl diluted cDNA in a total volume of 20 µl using the TaqMan system, in 96-well plates using the Fast mode on an Applied Biosystems 7500 (all ThermoFisher Scientific), for 43 cycles. Each 96-well plate contained all of the 23 gene-assays for a single ischemic time point for a single patient, with all four of the qPCR plates relating to each patient (one per ischemic time) prepared and run by the same operator on the same day. Batch effect was controlled for by including cDNA from Universal Reference Total RNA (Clontech Laboratories, Mountain View, CA) in every PCR plate. Operators were blinded as to the ischemic times for each patient and the order in which the ischemic time plates were run for each patient was randomized.
Genes Selected for Analysis.
Genes identified in Thompson et al. 18
Genes identified in Aktas et al. 19
Bray et al. 5 as being sensitive to ischemia.
“Housekeeping” genes that are potentially stable to ischemia.
Data Analysis
For each patient, the coefficient of variation (CV) was calculated between the cycle threshold numbers (Cts) of time points (1) 1 to 3 hr cold ischemia and (2) 1 to 3 plus 12 hr cold ischemia for each gene. The most stable genes for each patient were the ones that had the lowest CV. We then collated the data from all 40 patients and assessed the stability by gene. Genes that were the most stable to cold ischemia were those where the mean CV was lowest, the CV was most consistent in all the patients, and the CV increased the least between the 1 to 3 hr and the 1 to 3 plus 12 hr ischemic time points. We then evaluated the difference in cycle thresholds (ΔCt) to 1 hr ischemia for each gene in each patient for the 2, 3, and 12 hr time points (ΔCt = Ct ischemic time point – Ct 1 hr). A negative ΔCt denotes a gene increasing in expression with cold ischemia and vice versa. Finally, we calculated the difference in Ct between each ischemia gene and each “housekeeping gene” (ΔΔCt) for each patient at each ischemic time point, and the CV of the ΔΔCt across all the patients. Other gene-selection criteria were mean Ct < 35 and a higher proportion of patients with a consistent pattern of either positive or negative ∆Ct to 1 hr ischemia at the 2, 3, and 12 hr time points. Receiver Operating Characteristic (ROC) analysis was performed with the Analyse-it software v. 4.65 (Analyse-it Software Ltd, Leeds, UK).
The variables (patient, tissue type, collection site, and ischemic time) were also analyzed by one-way ANOVA with the Tukey multiple comparisons of means test applied using the R statistical package. Sum squared values were used to calculate the percentage of the total variability in the data set that could be assigned to each variable, thereby gaining an insight into how important the ischemic time is in terms of defining differences in gene expression overall.
Results
The gene with the highest expression was B2M (mean Ct number for all reactions was 27.2) and the gene with lowest expression was SLC25A25 (mean Ct was 38.2). Ct numbers were generally high in the study because of the inherent degraded nature of RNA extracted from FFPE biospecimens and the magnitude of the dilution of cDNA that was necessary to accommodate the large number of reactions per sample (23 genes in triplicate). All genes returned data that were amenable to analysis with the exception of SLC25A25 and GUCY2C, where Ct numbers were only generated at all ischemic time points in eight and 11 of the 40 patients, respectively.
The sum-squared analysis revealed that 50.9% of the total variability in gene expression could be assigned to the patient, 18.1% to the ischemic time, 11.4% to the collection site, 0.5% to the tissue type, and 19.1% to the residuals. Given that tissue type accounted for such a small percentage of the total variability in the data set, we grouped all the data from the tissue types together when calculating the Cold Ischemia Score.
The genes that were more stable to cold ischemia (defined as mean CV of the Ct numbers of all the patients <4% across all ischemic time points) were EPOR, BARD1, MERTK, HMBS, POLR2A, MYH10, JUN, and EXOC7 (Fig. 1). Less stable genes to cold ischemia (mean CV of Ct numbers of all patients >5%) were FOS, BTG2, MDM4, PRKACA, B2M, KLF6, EGR1, DUSP1, and GAPDH. Of the four “housekeeping genes” tested, HMBS and POLR2A were most stable to cold ischemia (CV = 3.5% and 3.6%, respectively), SDHA was intermediate in stability (CV = 4.7%), and GAPDH was the most unstable of all the genes tested (CV = 6.5%).
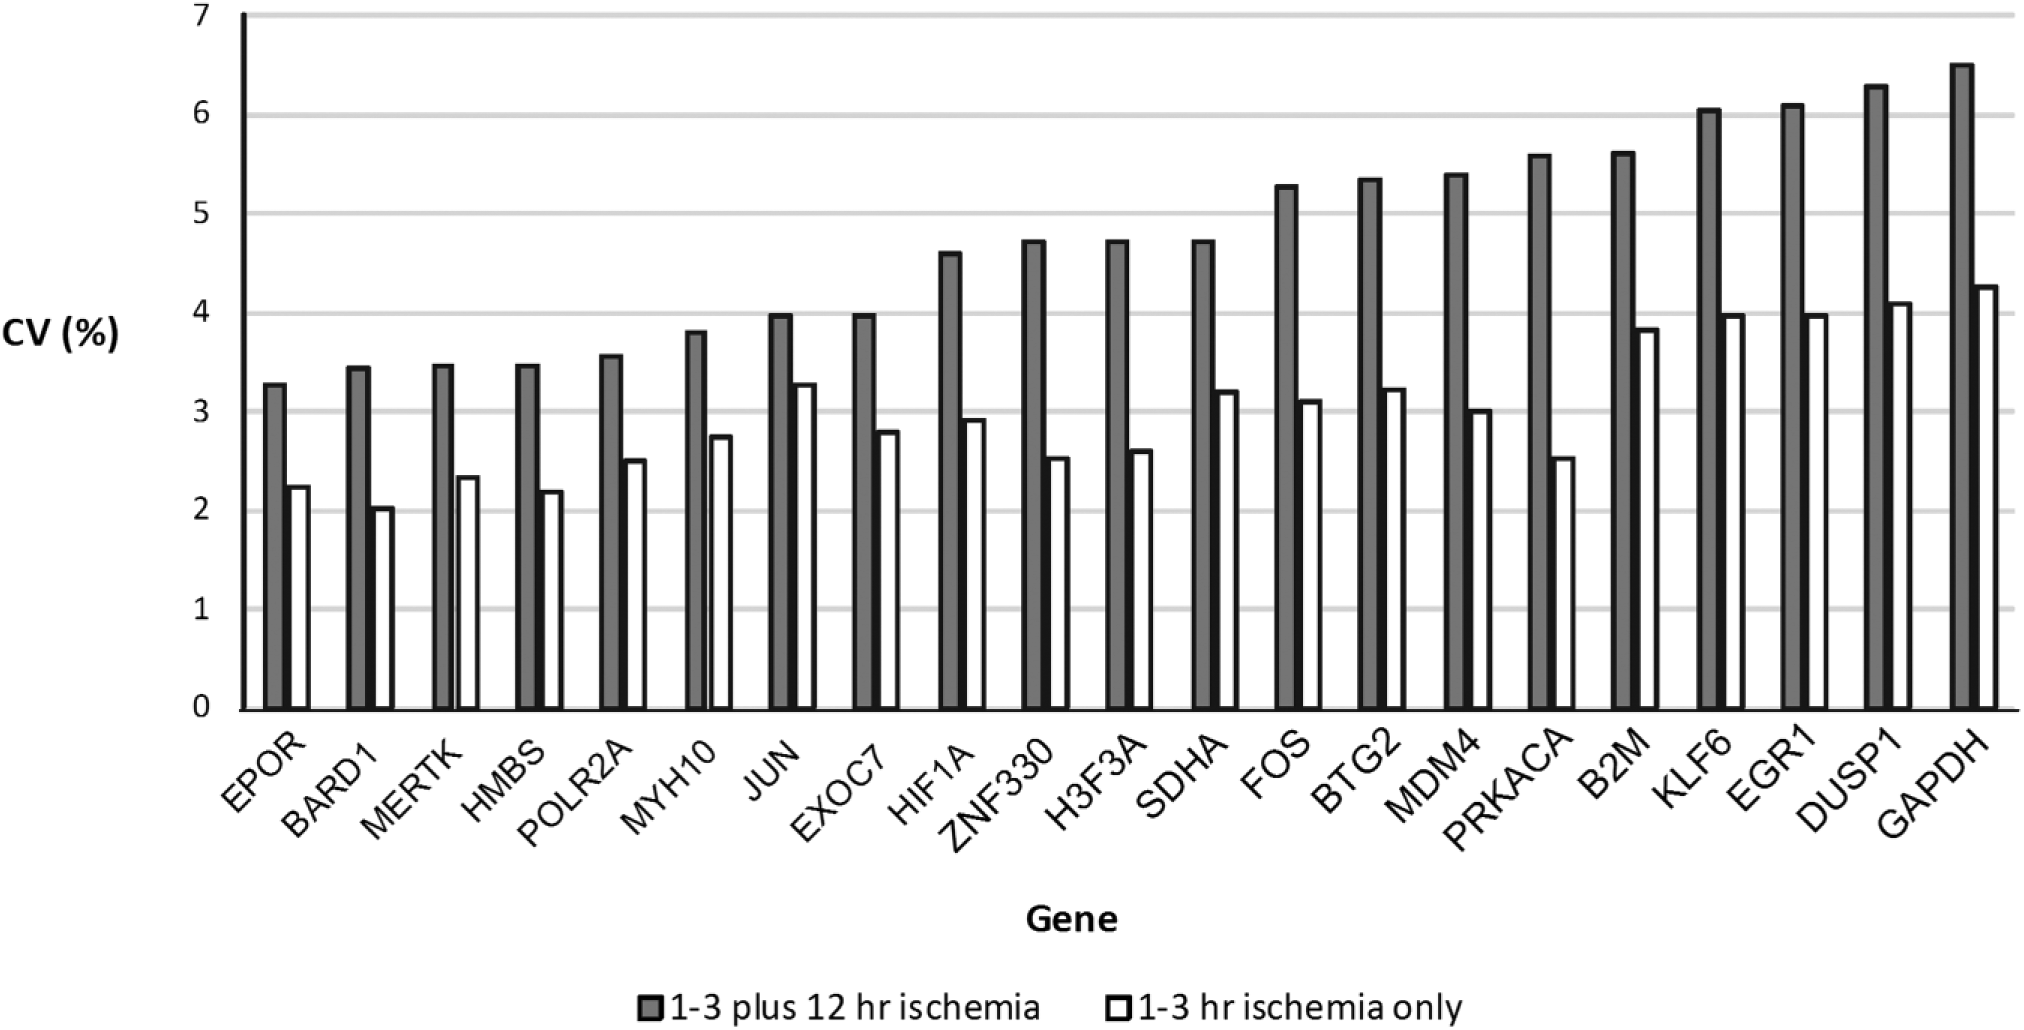
Gene stability to cold ischemia. Mean coefficient of variation (CV) of Ct numbers from all patients across all ischemic time points and 1 to 3 hr ischemia only.
Overall, all genes tested increased in expression as cold ischemia increased, with the 12 hr ischemic time point having a lower Ct than the 1 hr time point. However, this pattern was never seen in every patient. A negative ∆Ct to 1 hr ischemia at the 12 hr ischemia time point (denoting an increase in gene expression as ischemia increased) was seen in 76% to 95% of the patients depending on the gene, with DUSP1, EPOR, and GAPDH having the highest interpatient consistency (>90% of patients), and B2M, BARD1, EXOC7, MERTK, and SLC25A25 having the lowest interpatient consistency (76–85% of patients). The percentage of patients with a negative ∆Ct to 1 hr cold ischemia was considerably lower at the 2 hr and 3 hr cold ischemic time points (57–73% of patients, depending on gene). It was therefore not possible to reliably associate gene expression to cold ischemic time below 3 hr cold ischemia, but 12 hr cold ischemia could be distinguished from the 1 to 3 hr ischemic time cohort. The incidents where gene expression decreased with increasing cold ischemia clustered by patient, with four patients having ≥15 genes decreasing in expression between 1 and 12 hr cold ischemia, two patients having four to six genes decreasing in expression, and the remaining 32 patients all having ≤3 genes decreasing in expression between 1 and 12 hr cold ischemia. The patients with higher percentages of genes decreasing in expression with increasing ischemic time did not have a characteristic percentage tumor or share a particular tissue type or collection site, and nor did they have an inconsistent percent tumor in the blocks for 12 hr and 1 hr ischemic time.
Three genes that were unstable in response to cold ischemia (PRKACA, FOS, and EGR1) and one gene that was stable (POLR2A) were selected for the Cold Ischemia Score. The criteria for determining instability to cold ischemia were a large CV to increasing cold ischemia, a large ∆Ct between 12 hr and 1 hr cold ischemia, a high percentage of patients with a negative ∆Ct to 1 hr cold ischemia at the 12 hr cold ischemia time point, and mean Ct < 36. The Cold Ischemia Score was calculated as follows: Cold Ischemia Score = (Ct PRKACA – Ct POLR2A) + (Ct FOS – Ct POLR2A) + (Ct EGR1 – Ct POLR2A). The Cold Ischemia Score was calculated for each patient at each cold ischemic time point (Fig. 2). Although Cold Ischemia Score could not distinguish 1 hr cold ischemia from 3 hr cold ischemia, samples with ischemia ≤3 hr could be distinguished from samples with ischemia 12 hr. Lower Cold Ischemia Scores equate to shorter fixation times and ROC analysis determined an optimal Cold Ischemia Score cutoff value for our data set of 2.9, which corresponded to 62% sensitivity and 84% specificity (area under the curve 0.80) in the detection of ischemia time 12 hr (Fig. 3).
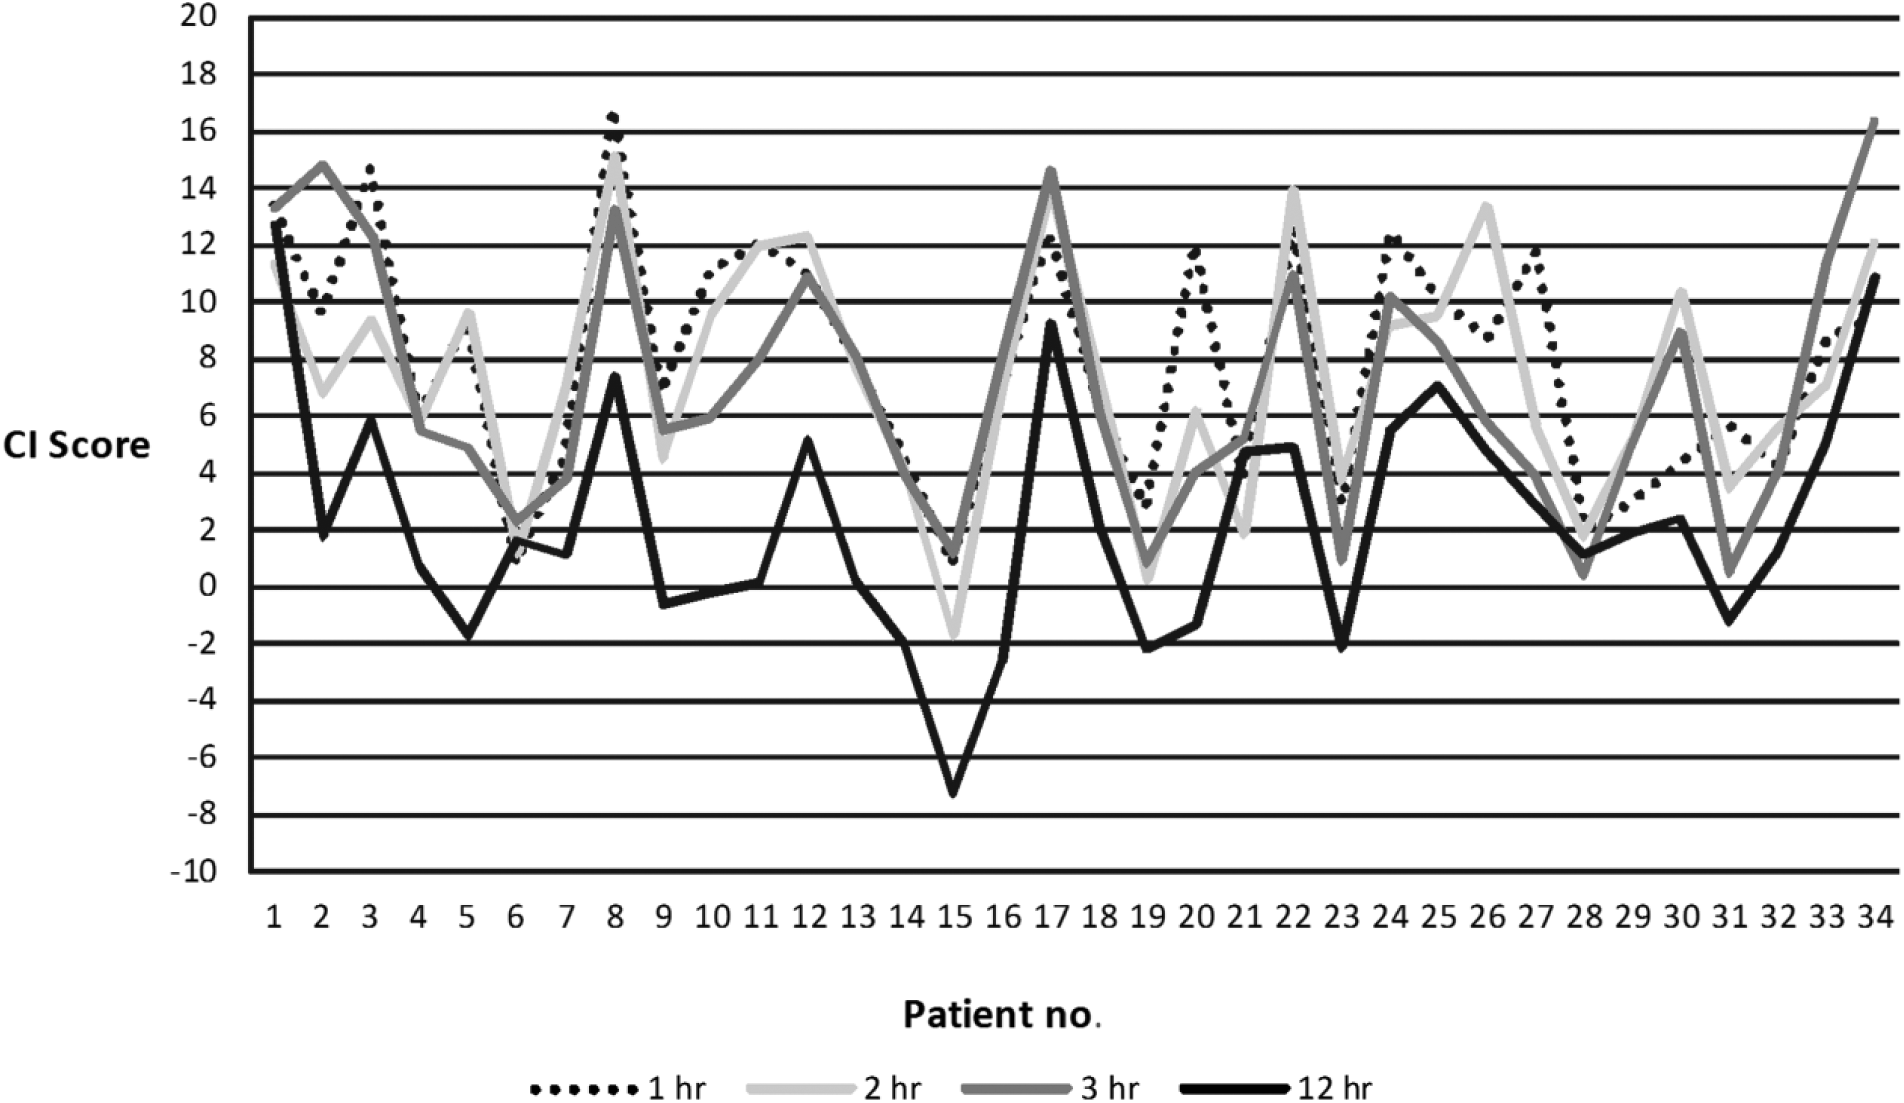
Cold Ischemia (CI) Score for the 34 patients that returned cycle threshold numbers (Cts) for PRKACA, FOS, H3F3A, and POLR2A at all four cold ischemic times in the study. Data are ordered by tissue type: colon (patients 1–11), kidney (patients 12–24), and ovary (patients 25–34). A CI Score of 2.9 corresponded to 62% sensitivity and 84% specificity.
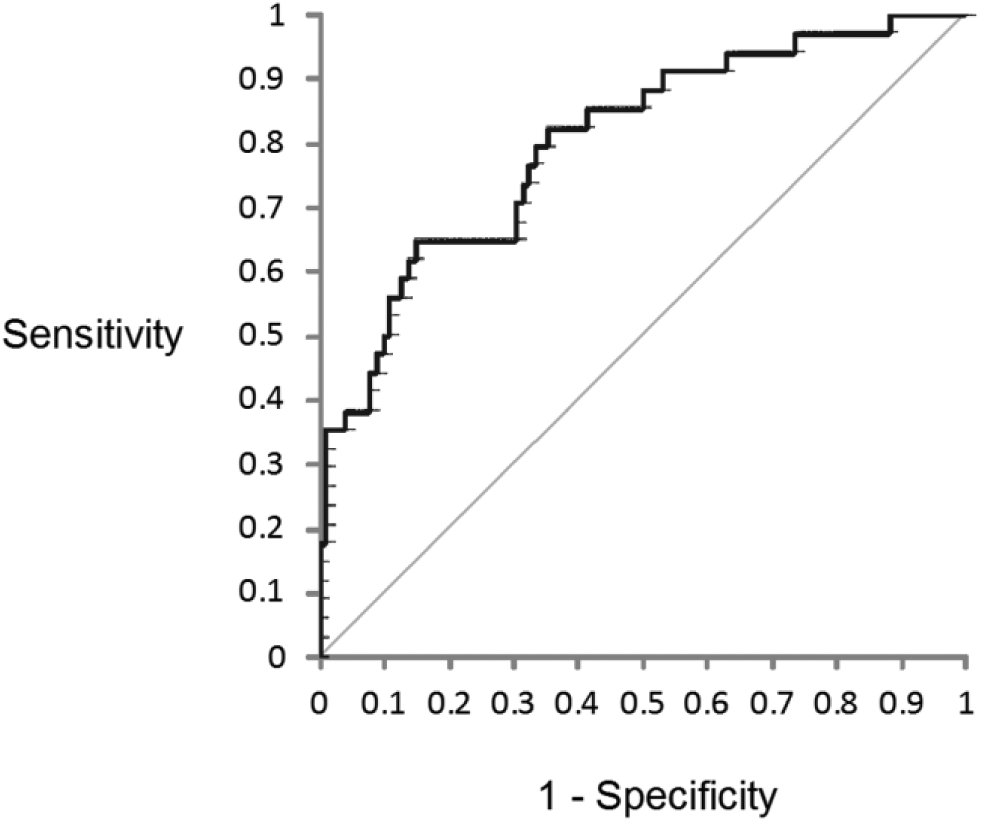
Receiver Operating Characteristic (ROC) curve denoting sensitivity and specificity of Cold Ischemia (CI) Score (with a cutoff at 2.9) to determine 12 hr cold ischemia from ≤ 3 hr cold ischemia.
We also calculated Cold Ischemia Score using ∆∆Ct to 1 hr ischemic time for each patient at 2 hr, 3 hr, and 12 hr and repeated the ROC analysis, upon which the area under the curve improved from 0.80 to 0.83. However, as we do not envisage a scenario where an FFPE tissue block with a known 1 hr cold ischemia would be available, we consider ∆∆Ct data to be of limited practical value in Cold Ischemia Score calculations.
Discussion
There are two mechanisms driving gene expression changes in ischemic tissue: degradation of RNA by RNases and the alteration of gene expression as the still-living tissue responds to ischemic stress brought about by inadequate oxygen levels.5,12,21 In all the genes we tested, mRNA expression increased up to the maximum 12 hr ischemic time point evaluated, so any RNase-induced degradation was less significant than the response to ischemia. It is possible that higher levels of RNases were present in the small cohort of patients that showed a decrease in expression in a high proportion of their genes, given that this cohort were not characterized by tissue type, percentage tumor, or collection site. The relationship between RNase activity and Ct number will be dependent on the location of the amplicon within the transcript (and therefore also the set of splice variants that the primers will bind to) and the relative abundance of exoribonucleases and endoribonucleases in that piece of tissue. However, it is also possible that other preanalytical factors that were not recoded (e.g., anesthesia or warm ischemic time) or clinical factors (e.g., specific tumor subtypes that are differently susceptible to hypoxia) may be responsible.
Other ischemia QC tools have been described in the literature. The impact of cold ischemia of 10 to 45 min on gene expression profiles has been studied in fresh-frozen colorectal tissue using a microarray (with validation using qRT-PCR), with G-protein signaling 1 (RGS1) suggested as a potential biomarker for cold ischemia. 7 However, the increase in RGS1 expression occurred within 10 min in normal tissue and 20 min in tumor tissue before stabilizing, so it is not directly applicable in a routine clinical setting or where formalin has been used as a fixative because in both instances ischemic times will be measured in hours.
Aktas et al. have proposed an “Ischemic Stress Index” based on 41 mRNA transcripts. This signature was measured by Affymetrix microarray analysis of RNAlater stabilized breast tissue that had been subjected to different cold ischemic times of up to 3 hr, and showed 86% accurate “diagnostic” performance. 19 Two of the three unstable genes that we use in Cold Ischemia Score (FOS and PRKACA) are also used in the Ischemic Stress Index, with FOS increasing in expression in both algorithms and PRKACA decreasing in expression in Ischemic Stress Index but increasing in Cold Ischemia score (we found no genes decreasing in expression). The stable gene we used (POLR2A) is not utilized in Ischemic Stress Index, which is not surprising given that the Ischemic Stress Index used genes that changed in expression (rather than were stable in expression) in response to cold ischemia.
A salient finding of Aktas et al. was that the RNAlater and frozen samples showed limited concordance in gene expression (correlation coefficient 0.87). It is likely that FFPE will correlate with frozen more poorly than RNAlater given the longer fixation times (during which ischemia continues), the more aggressive RNA extraction protocol and the degraded nature of RNA extracted from FFPE samples. We are therefore not surprised to see a different pattern of PRKACA “expression” in FFPE biospecimens after 12 hr ischemia than Aktas et al found in RNAlater stabilized tissue after 3 hr ischemia. In our study, there was no overall expression change in PRKACA after 3 hr ischemia because its expression increased in 17 patients and decreased in 18 patients (a pattern not linked to tissue type). We believe that ischemic time biomarkers for use in FFPE tissue blocks need to be developed using FFPE tissue blocks.
A “Tissue Quality Index,” based on quantitative immunofluorescent detection of cytokeratin, pERK1/2 and pHSP27 has also been proposed as an intrinsic quality control tool, developed following analysis of 93 FFPE breast tissue samples with cold ischemic times of up to 7 hr. 22 The Tissue Quality Index was only applied to breast tissue, although we found that tissue type was not a major factor accounting for overall variability in our data set. The Tissue Quality Index is however distinct from our Cold Ischemia Score in that it assesses protein stability using immunohistochemistry so is aimed at pathology labs, rather than RNA stability for the molecular biology labs who are better equipped to carry out the qRT-PCR utilized for Cold Ischemia Score.
Another potential QC marker for cold ischemia is based on Western Blot analysis of the ratio of intact α-II spectrin and its breakdown products. 23 However, it is not easy to standardize a Western Blot assay, particularly in FFPE tissue where extracting intact proteins of large molecular mass is difficult (intact α-II spectrin is 250 kDa).
The Cold Ischemia Score, presented in this article, is easily applicable, accessible to most laboratories, and is easy to standardize. The gene targets of the Cold Ischemia Score encode different types of ubiquitous and universally expressed proteins. PRKACA encodes a protein-kinase cAMP-activated catalytic subunit A. FOS encodes an AP-1 transcription factor subunit. EGR1 encodes an oxygen-sensing transcriptional regulator for genes involved in mitogenesis and cell differentiation, and is known to rapidly increase in expression in response to hypoxia in ischemic stroke and ischemia reperfusion injury.24,25 The normalization target POLR2A encodes the RNA polymerase II subunit A.
Our data corroborates findings that the “housekeeping genes” GAPDH and HMBS both increase in expression with ischemia in lung tissue. 6 Indeed, GAPDH was the most unstable gene we evaluated. However, the same publication found KLF 6 expression decreasing with ischemia and we found an increase in expression. Although stability to preanalytical factors such as cold ischemia (which is inherently variable in clinical biospecimens) should be a requisite in a housekeeping gene, it is perhaps not surprising to see that such instability exists given that housekeeping genes are not typically tested in respect of resilience to preanalytical variables. In separate studies using endpoint RT-PCR of the HMBS housekeeping gene, a 338 bp amplicon could be amplified from liver samples after 48 hr ischemia and amplicons of 942 bp were obtainable in thyroid samples after an extended freeze-thaw event.26,27 The POLR2A gene we have selected for Cold Ischemia Score on account of its stability to cold ischemia was also found to be the most suitable reference gene candidate out of 1297 genes tested by Canales et al., on account of its Ct being in the same range as that from other genes and its expression being the most stable across different samples. 28
Overall, the parameters driving the variability in the data set were most importantly gene, then patient, with cold ischemic time being the third most significant parameter. Thus, the impact of cold ischemia needs to be put into context: it is a less significant driver of variability in the data set than the patient. This observation reflects the heterogeneity of biospecimens in general and has been made by others.4,5 However, we found cold ischemia to be a larger driver of variability than either the sample collection site or the tissue type, and consequently, we think it must be considered a preanalytical variable of significance.
Sensitivity and specificity of Cold Ischemia Score will likely improve on further validation. The presented study was limited in that the large number of genes being evaluated necessitated a dilution of cDNA significantly greater than what would be typical in a qRT-PCR reaction. Validation using just the four Cold Ischemia Score genes will enable considerably more cDNA to be used per qPCR reaction, likely resulting in lower Ct numbers and improved accuracy. Cold Ischemia Score has currently only been tested on cold ischemic times of 12 hr and ≤3 hr. Intermediate cold ischemia time points were not included because it was logistically impossible to do so while maintaining a consistent formalin-fixation time in all samples. Further work is underway to validate Cold Ischemia Score on a larger cohort of samples collected at different laboratories, enabling us to further expand the tissue types and test the resilience of Cold Ischemia Score in respect of different collection and processing protocols.
We are also investigating how the depth within a tissue block from which the section was cut might influence Cold Ischemia Score. Cold ischemia will be longer in the center of a block than on its surface, because of the time it takes formalin to penetrate into, and then fix larger pieces of tissue. It is therefore logical that RNA extracted from sections cut from the surface and center of the same FFPE tissue block might yield different Cold Ischemia Scores. The magnitude of this effect will be determined by the factors influencing the rate and effectiveness of formalin penetration and fixation in tissue (the dimensions of the piece of tissue, the temperature, the pH and buffer of the formalin, the volume-ratio of formalin to tissue, the tissue type and its morphology). For the study we present here however, any influential effect of block-depth was avoided by randomly selecting aliquots of RNA originating from different depths in each block.
We are also including intermediate and extremely long cold ischemic times and applying Cold Ischemia Score to frozen biospecimens. Extremely long ischemic time points are necessary for validation because although Ct numbers decrease as the tissue continues to respond to ischemia, it is logical that at some point Ct numbers will start to increase again as gene expression ceases and mRNA degradation becomes more prevalent. However, we doubt that any increase in Ct caused by mRNA degradation in extremely long ischemic times will have a consequential impact on Cold Ischemia Score, because the POLR2A gene that is stable to cold ischemia will not also be resilient to degradation.
The tissue blocks that we used in this preliminary study were fixed for 10 to 12 hr. This (short) fixation time had to be selected because we needed to maintain a comparable fixation time (and time in hot paraffin at the end of the processing run) in all of the tissue blocks that originated from the same patient, but had different cold ischemic times. Standardizing the fixation time was imperative when developing the Cold Ischemia Score algorithm because it is known that fixation time is a critical factor influencing PCR analyses.26,29,30 However, when applying Cold Ischemia Score to a sample, its fixation time will likely be unknown, so Cold Ischemia Score relies on the hypothesis that the effect of different fixation times will apply to each of its four genes equally and therefore be inconsequential. Studies evaluating the stability of assays that use multigene algorithms and relative quantification from the same FFPE biospecimen (e.g., the commonly used ΔΔCt approach to gene expression analysis) consistently show the assays to have good resilience to preanalytical variables including fixation time, provided the amplicons of each of the genes are comparable in size and within the optimal size-range for FFPE material.31–35
Given that Cold Ischemia Score will likely be applied to legacy samples, it is important to note that the few studies that have evaluated the influence of storage time induced degradation (for up to 29 years) on qRT-PCR in FFPE blocks have also found degradation rates to be consistent across different genes.36,37 The same assumption cannot be made in respect of paraffin-embedded blocks that used nonformalin fixatives however, so it is unlikely that Cold Ischemia Score will be applicable to such blocks. 38
The Cold Ischemia Score measurement, calculating using the conventional qRT-PCR protocol described here can identify FFPE tissue samples with cold ischemic times of more than 12 hr with a sensitivity of 62% and a specificity of 84%, with a Cold Ischemia Score threshold of 2.9. Cold Ischemia Scores lower than 2.9 denote fixation times that are less than 12 hr. We recommend that laboratories validate Cold Ischemia Score before using it, as different protocols will likely return different Ct numbers (critical factors will include the quantities of RNA and cDNA per reaction and the RNA extraction protocol). Nevertheless, Cold Ischemia Score is, in our opinion, easy to validate, practical, and accessible to laboratories, enabling them to perform qualification of legacy collections or quality stratifications of FFPE tissue samples with undocumented preanalytics.
Footnotes
Acknowledgements
We acknowledge the valuable assistance provided by Petr Nazarov in respect of the statistical analyses using R and Monica Marchese for compiling the Receiver Operating Characteristic (ROC) curves.
Competing Interests
The author(s) declared no potential conflicts of interest with respect to the research, authorship, and/or publication of this article.
Author Contributions
WM performed all data analysis for Cold Ischemia (CI) Score and wrote the manuscript. KM and JMT performed the qRT-PCR. CM and PG selected the targets for analysis. DR provided oversight of the creation/distribution of collection kits and the processing the formalin-fixed paraffin-embedded (FFPE) blocks. LJC made significant contributions in the design of the study. DRV was quality management supervisor, managing the QM Program, documentation, communication, audits, and reports. AB was laboratory supervisor and provided the quality analysis of biospecimens, developed the SOPs (standard operating procedures), and performed the extraction and management of biospecimens. SJ provided overview on the structure and operation of the biospecimen processing, storage, and distribution of the biospecimens. HMM and FB conceived the project and oversaw it.
Funding
The author(s) disclosed receipt of the following financial support for the research, authorship, and/or publication of this article: Funds for the collection, processing, and RNA extraction of the biospecimens was provided by the Biospecimen Preanalytical Variables (BPV) Program of the Biorepositories and Biospecimen Research Branch of the National Institutes of Health, USA. The qRT-PCR, data analyses, and publication of the manuscript was funded by the Integrated Biobank of Luxembourg.