
Abstract
We evaluate the consequences of processing alcohol-fixed tissue in a processor previously used for formalin-fixed tissue. Biospecimens fixed in PAXgene Tissue Fixative were cut into three pieces then processed in a flushed tissue processor previously used for formalin-fixed, paraffin-embedded (FFPE) blocks (neutral buffered formalin [NBF]+ve), a formalin-free system (NBF−ve), or left unprocessed. Histomorphology and immunohistochemistry were compared using hematoxylin/eosin staining and antibodies for MLH-1, Ki-67, and CK-7. Nucleic acid was extracted using the PAXgene Tissue RNA/DNA kits and an FFPE RNA extraction kit. RNA integrity was assessed using RNA integrity number (RIN), reverse transcription polymerase chain reaction (RT-PCR) (four amplicons), and quantitative RT-PCR (three genes). For DNA, multiplex PCR, quantitative PCR, DNA integrity number, and gel electrophoresis were used. Compared with NBF−ve, RNA from NBF+ve blocks had 88% lower yield and poorer purity; average RIN reduced from 5.0 to 3.8, amplicon length was 408 base pairs shorter, and Cq numbers were 1.9–2.4 higher. Using the FFPE extraction kit rescued yield and purity, but RIN further declined by 1.1 units. Differences between NBF+ve and NBF−ve in respect of DNA, histomorphology, and immunohistochemistry were either non-existent or small in magnitude. Formalin contamination of a tissue processor and its reagents therefore critically reduce RNA yield and integrity. We discuss the available options users can adopt to ameliorate this problem:
Introduction
The default method of preservation for clinical tissue biospecimens is as formalin-fixed, paraffin-embedded (FFPE) tissue blocks. FFPE sections retain excellent morphological detail. Numerous clinically relevant immunohistochemical protocols have been optimized for them; fixation and processing protocols do not need to be altered depending on tissue type, and as FFPE blocks can be stored at ambient temperature, biobanking them is straightforward and inexpensive.1,2 Although FFPE tissue blocks yield nucleic acid and protein that are amenable to most analytical methods (e.g., sequencing, quantitative polymerase chain reaction [qPCR], microarray analyses, and mass spectrometry), the formalin crosslinking results in nucleic acid and protein extracts from FFPE blocks being considerably more fragmented than those from fresh-frozen (FF) tissue. This means laboratories using FFPE for molecular biology and non-immunohistochemical proteomic analyses can expect a higher proportion of their nucleic acid or protein extracts to fail quality control (QC) checks compared with those using FF tissue blocks, and a more restrictive choice of analytical platforms (those optimized for degraded material).3,4 FF tissue is, however, much more logistically difficult (and therefore expensive) to collect and store compared with FFPE tissue, so the numbers of biobanked biospecimens are much lower than for FFPE. 5 In addition, an FF tissue block is harder to section than its FFPE equivalent, with the resultant sections typically being thicker, retaining less morphological detail and generally being poorer for histochemical and histomorphological analyses.6,7
Non-crosslinking fixatives (sometimes called “alternative fixatives”), unlike formalin, do not cause cross-linking, so have been developed with the aim of preserving nucleic acid and protein integrity comparably to FF but without the logistical difficulties associated with freezing and cryopreserving biospecimens. Of the non-crosslinking fixatives, alcohol-based fixatives have gained by far the broadest attention and acceptance, and work by precipitation and denaturation, not covalent crosslinking. The review by Buesa 8 describes 13 alcohol fixatives, including the better-known Carnoy’s fluid (ethanol, chloroform, and acetic acid), methacarn (Carnoy’s fluid but with methanol instead of ethanol), FineFix, and RCL 2. More recently, after testing more than 1000 compounds, PAXgene was developed, which aimed to preserve nucleic acid and protein integrity comparably to FF but unlike previous alcohol fixatives, also enable immunohistochemistry (IHC) and histomorphology to be performed comparably to FFPE. 9 PAXgene has been thoroughly evaluated; Sanchez et al. 10 reviewed 13 studies and concluded that PAXgene offers DNA preservation comparable to FF and RNA preservation intermediate between FF and FFPE, and morphological detail and IHC are usually as good as FFPE but sometimes poorer, with some antibodies requiring protocol optimization. PAXgene is currently utilized where such a compromise is optimal. 11
To be made amenable to IHC or histomorphological analysis, an alcohol-fixed tissue block, like a formalin-fixed tissue block, needs to be processed, which is usually carried out in an automated tissue processor. Most tissue processors are used for the large-scale production of clinical FFPE tissue blocks, with the same reagents (formalin, alcohol, Xylene, and paraffin) being used multiple times in sequential processing runs. It is inevitable therefore that formalin will contaminate the downstream alcohol, Xylene and paraffin to some extent because reagent carryover will occur via the external surfaces of any parts of the processor and its ancillary components that are immersed during processing and remain damp during a reagent changeover and via the tissues themselves that are permeated by formalin initially and then by sequential reagents in the processing cascade. Given that a typical tissue processing run is many hours in length, a logical consequence of this would be that alcohol-fixed biospecimens could become partially fixed with formalin during their processing, undermining the reason for using an alcoholic fixative in the first place. We are unaware of any studies that have either measured formalin contamination in a tissue processor or its reagents or described whether the consequences of processing alcohol-fixed tissue in a processor also used for FFPE are consequential.
Laboratories who want to process alcohol-fixed tissue biospecimens while ensuring they completely avoid formalin are faced with a dilemma. They could replace all the alcohol, Xylene, and paraffin reagents in the processor with fresh each time they process alcohol-fixed biospecimens, but the volumes involved are prohibitive (tens of liters of each reagent in the reaction chamber type of processor) and the processor’s reaction chamber, tubing, and tissue cassette holder(s) will likely remain contaminated with formalin to some degree. Using a dedicated formalin-free tissue processor and reagents for alcohol-fixed biospecimens would avoid formalin completely, but tissue processors are expensive, require a lot of laboratory space, and use large volumes of reagents. Manual processing of alcohol-fixed biospecimens using dedicated labware and reagents would avoid formalin contamination and obviate the need to purchase and maintain a dedicated tissue processor. However, many would consider it an impractical option, given the tissue processing protocol is many hours in length (the manufacturer’s processing protocol for PAXgene is 6.5- to 11.5-hr long with 11 reagent changes). Flushing a tissue processor used for routine processing of formalin-fixed tissue blocks with fresh reagents before each alcohol-fixed biospecimen run is also an option, and although this would clean the processor’s shared tubing and reaction chamber, it would not remove any formalin contamination in the processing reagents themselves.
We investigated whether formalin contamination in a tissue processor could be a critical factor in the processing of alcohol-fixed tissue blocks. We first quantified the buildup of formalin in the reagent most distant from the formalin in our tissue processing protocol (the final water flush) over 12 FFPE processing runs after a replacement of flush reagents. We then compared the DNA, RNA, histomorphology, and IHC of PAXgene-fixed biospecimens that had been processed in a formalin-contaminated processor with those processed in a manual, formalin-free system. PAXgene-fixed but unprocessed controls were included in the comparison so the extent to which DNA and RNA degrade during tissue processing could also be quantified.
Materials and Methods
Tissue Processor
An Excelsior ES tissue processor (ThermoFisher; Merelbeke, Belgium) routinely used to process FFPE tissue biospecimens was used for this study. It contains 17 reagent vessels (5-liter reagent per vessel), with each vessel being used once in the 17-step processing protocol. The processor had been maintained and annually serviced by the manufacturer since its purchase. Fourteen reagents are used for processing FFPE tissue in the following consecutive order: QPath 10% neutral buffered formalin (NBF), containing <1.5% methanol, pH: 6.8–7.2 (VWR; Leuven, Belgium, n=2), Shandon Reagent Alcohol (ThermoFisher, n=6, 75–100%), Shandon Xylene substitute (ThermoFisher, n=3), and Tissue Tek III paraffin wax (Sakura; Alphen aan den Rijn, The Netherlands, n=3). Following completion of each processing run, a further three vessels are used to flush the processor in the following order: Shandon Xylene substitute, Shandon Reagent Alcohol, and tap water. A rotation of the processing reagents is periodically performed, in which the first (also the oldest and most-used) alcohol, Xylene substitute, and paraffin reagents are disposed of, the remaining reagents moved one place forward in the processing protocol’s order, and the now-empty (and final) alcohol, Xylene substitute, and paraffin reagent vessels are refilled with fresh reagents. The formalin rotation is different: After 15 uses, the two vessels are replaced simultaneously with new vessels containing fresh formalin.
Formalin Contamination Assay
Formalin contamination was quantified in the water flush (i.e., the reagent most distant from the formalin in the FFPE processing protocol) over 12 FFPE processing runs. Immediately before the test, all flush reagents (Xylene, alcohol, and tap water) were replaced. Four FFPE processing runs had occurred since the last rotation of processing reagents. A 1-ml aliquot of tap water was retained (to control for any formalin present in tap water), and then, further 1-ml aliquots of flush water were taken after each processing run over 12 consecutive processing runs. The first of these processing runs was for the PAXgene-fixed biospecimens utilized in this study (where both formalin vessels were disabled) but the subsequent 11 runs were routine FFPE processing runs, in which the formalin vessels were enabled. The aliquots were stored at ambient temperature in the dark. Once all the aliquots had been collected, the formaldehyde concentration in each aliquot was quantified using the Quantichrom Formaldehyde Assay Kit (BioAssay Systems; Hayward, CA) as per the manufacturer’s protocol, using black 96-well plates read in a Synergy Mx spectrofluorometer (BioTek Instruments; Colmar, France).
Each flush aliquot was assayed undiluted and diluted 1:1 and 1:2 with ultrapure water to fall within the standard curve of 0- to 100-µM formaldehyde. (Given that formaldehyde is a gas at atmospheric pressure that becomes 37% formalin when saturated in water, we verified with the manufacturer that the formalin concentrations had indeed been converted back to formaldehyde molarity for the standard curve). Mean values from duplicated wells were used for analyses.
Biospecimens
Eight tissue blocks of 1.0 × 1.0 × 0.4 cm were used in this study: two normal rectums, two colons (one normal and one tumor), two parotid glands (one mucoepidermoid carcinoma and one normal), and two uteri (normal myometrium). The eight blocks originated from four larger pieces of tissue taken from four patients, with the two blocks per larger piece of tissue spatially separated by 2–10 cm. Cold ischemic times were ≤2.5 hr. Patient consent had been obtained, and the study had been approved by the Institutional Review Board of the Integrated Biobank of Luxembourg. Each biospecimen (n=8) was placed in a standard histopathology tissue cassette and then fixed using the PAXgene Tissue fixation system (PreAnalytiX; Hombrechtikon, Switzerland) according to manufacturer’s protocol (24 hr in PAXgene fixative solution followed by 24 hr in PAXgene stabilizing solution, both at room temperature). The fixed biospecimens were then stored in PAXgene stabilizing solution at −20C for <4 weeks. Two 5-mm3 blocks were cut from each biospecimen with a sterile scalpel after thawing: one for processing in the Excelsior ES tissue processor described above with processing reagents contaminated with formalin (NBF+ve) and the other for processing manually in a completely formalin-free system (NBF−ve). The remainder of the tissue was stored at −80C in PAXgene stabilizing solution to be used as a PAXgene-fixed, unprocessed, and unembedded control (PFnPE).
Tissue Processing
Since its last reagent rotation, the tissue processor had performed four FFPE processing runs. A 1-ml aliquot of the water flush was collected, then all the flush reagents were replaced, and the processor’s flush protocol was run 3 times to remove formalin from the processor’s reaction chamber. Additional aliquots of flush water were collected after each flush. The alcohol percentage in each of the tissue processors’ alcohol vessels was assayed using a DMA35 density meter (Anton Parr; Graz, Austria). The NBF+ve biospecimens were then processed together according to a manufacturer-recommended protocol (Table 1), with the reaction chamber’s vacuum option disabled. The initial alcohol step was not extended in time as is commonly done to accommodate overnight PAXgene Tissue fixed, paraffin-embedded tissue (PFPE) processing. The processor’s reaction chamber was filled with 1-liter reagent per step, and the reagents were stirred while in the reaction chamber (setting 5). After the processing run had completed, another 1-ml aliquot of flush water was collected, and then, the formaldehyde concentration in all five of the flush water aliquots pertaining to the NBF+ve processing run was quantified using the Quantichrom Formaldehyde Assay as previously described.
The Tissue Processing Protocol, Reagent Concentrations, and the Number of Previous FFPE Processing Runs Each Reagent Had Been Used for Before Processing the PFPE Biospecimens.
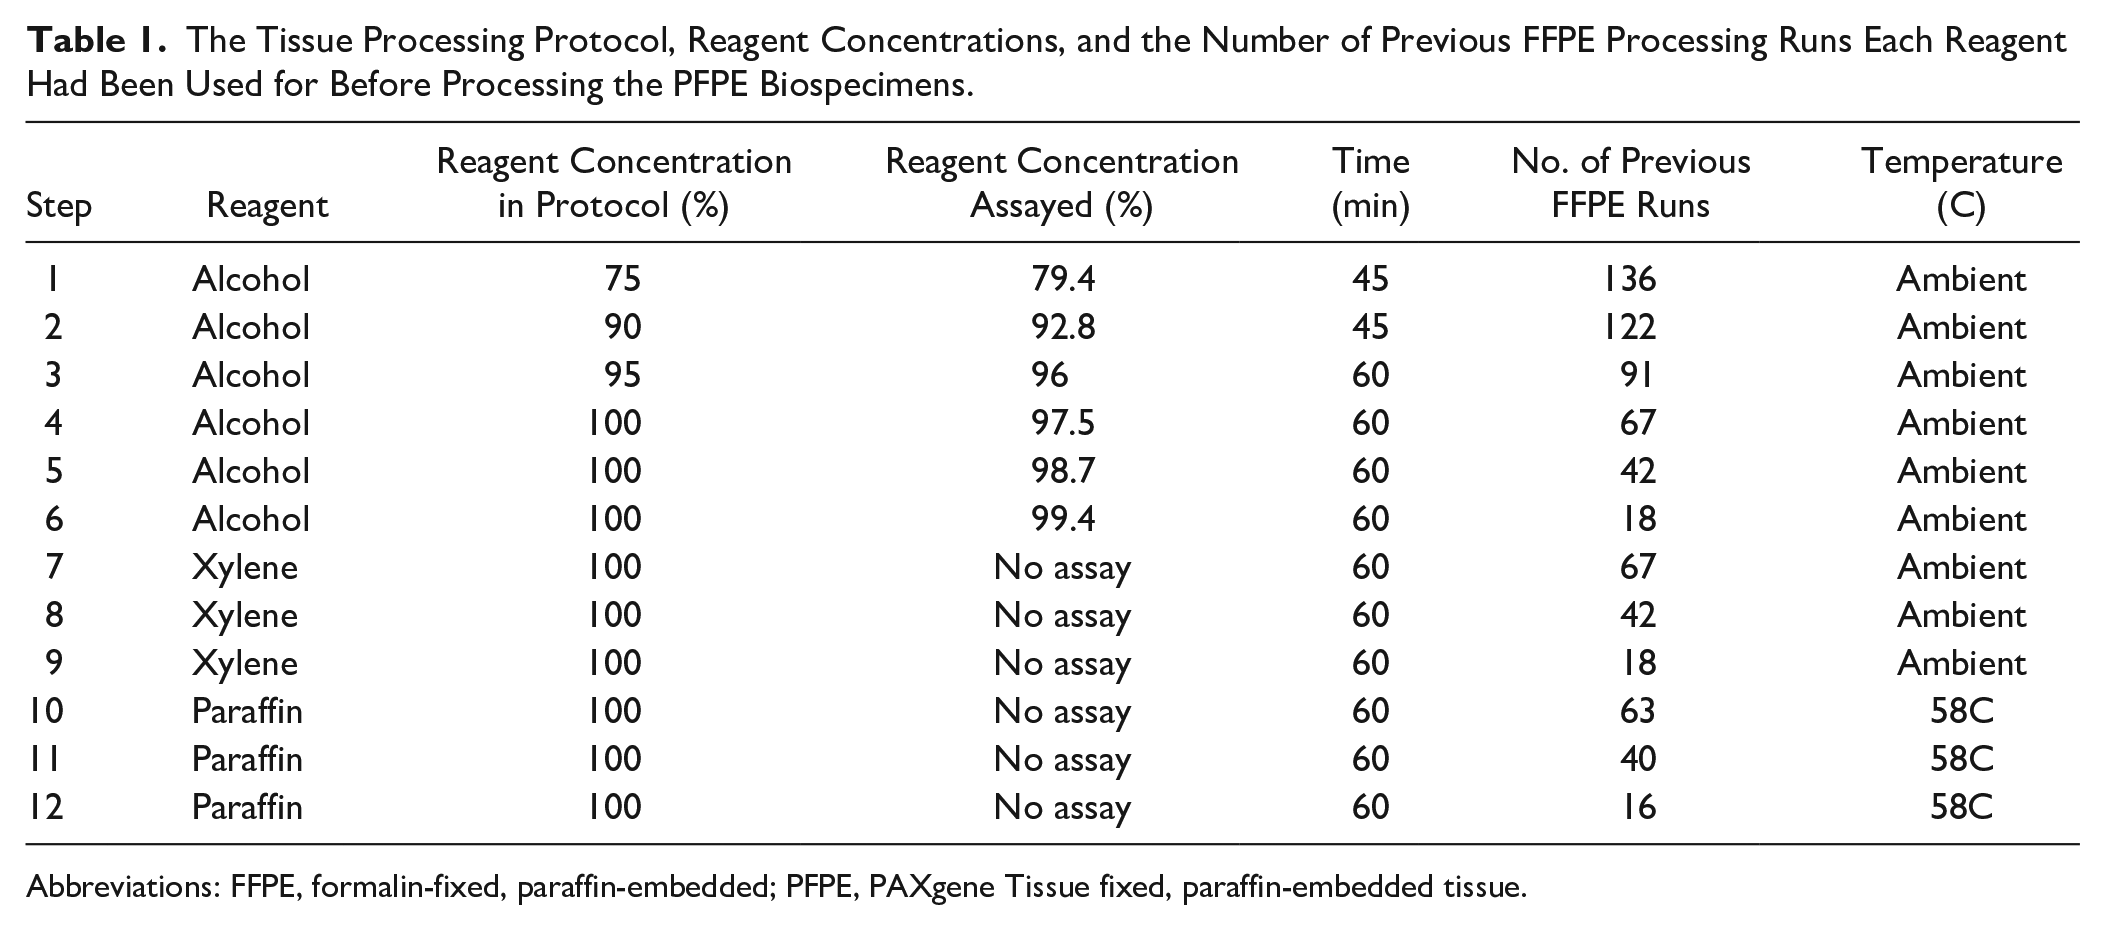
Abbreviations: FFPE, formalin-fixed, paraffin-embedded; PFPE, PAXgene Tissue fixed, paraffin-embedded tissue.
NBF−ve biospecimens were processed manually and to the same protocol as the NBF+ve biospecimens. The tissue cassettes were placed in a wire basket suspended 1 cm from the base of a 3-liter glass beaker that contained 1 liter of each processing reagent. The reagents used in the NBF−ve biospecimens were the same (manufacturer, catalog number, and lot number) as those used in the NBF+ve samples, but taken fresh from their bottles. Alcohol percentages for the NBF−ve processing were diluted with ultrapure water to match those in the NBF+ve tissue processor as assayed by the density meter. A magnetic stirring bar continuously rotating at 150 r/min operated during the alcohol and Xylene substitute steps, which were carried out on the lab bench; the paraffin steps were carried out in an oven at the same temperature as that in the tissue processor (58C) without a stirring bar but with the basket manually agitated every 15 min. The wire basket, beakers, and stirring bar used in the manual processing had never previously been used with any aldehyde-containing compound.
The NBF+ve biospecimens were processed 2 days earlier than the NBF−ve biospecimens. Both were paraffin-embedded in the same Histocentre 3 Embedding Station (ThermoFisher) immediately after their processing runs had competed. The PFPE blocks were stored at room temperature in the dark.
Histomorphology and IHC
Morphological analysis was carried out on all NBF+ve and NBF−ve blocks. Sections of 4-µm thickness were cut using a Shandon Finesse ME+ microtome (Fisher Scientific; Vantaa, Finland), dried onto slides for 30 min at 65C, and then stained on a Shandon Veristain Gemini (ThermoFisher) according to a routine hematoxylin eosin saffron (HES) protocol for FFPE sections. 12
A tissue microarray (TMA) was then prepared with duplicate 1-mm cores taken from each NBF+ve and NBF−ve block using a 3DHistech TMA Master (Sysmex; Hoeilaart, Belgium). Sections of 4 µm were cut from the TMA on the microtome and IHC was performed using an automated Ventana BenchMark XT (Roche Diagnostics; Basel, Switzerland) using antibodies for MLH-1 (Ventana 790-4535 [Roche Diagnostics]), Ki-67 (Ventana 790-4286 [Roche Diagnostics]), and CK-7 (Dako M7018 [Agilent Technologies; Heverlee, Belgium]). Optimized staining protocols for these antibodies are different in PFPE compared with FFPE. 12 Ki-67 and CK-7 were analyzed in respect of both the FFPE and the PFPE protocol, but for MLH-1, only the PFPE protocol was analyzed. Comparisons between NBF+ve and NBF−ve were made using the original slides for the HES. For the IHC, the slides were scanned using a Nanozoomer 2.0 HT digital scanner, and the digital images were evaluated using NDP.scan v. 2.5.89 software (both Hamamatsu Photonics; Mont-Saint-Guibert, Belgium).
Nucleic Acid Extractions and Quantification
RNA and DNA were separately extracted using the PAXgene Tissue RNA Kit and PAXgene Tissue DNA kits (both PreAnalytiX), from five sections of 10 µm thickness. RNA and DNA extractions were also performed from an unprocessed, unembedded tissue fragment (4–13 mg) cut from each PFnPE block that had been homogenized in a TissueLyzer LT (Qiagen; Hilden, Germany) as per manufacturer’s protocol. To assess whether applying an extraction method optimized for FFPE tissue would be beneficial for NBF+ve tissue, RNA was also extracted from all eight NBF+ve blocks and two NBF−ve blocks using the RNeasy FFPE Kit (Qiagen). The optional DNase step for RNA extractions and RNase step for DNA extractions were included in all extractions to prevent the coelution of nucleic acid of the wrong type. 13 RNA and DNA were quantified by OD260-nm spectrophotometry and their purities were assessed using OD 260:280 and 260:230 on the Synergy Mx spectrophotometer used for the formaldehyde assay. Double-stranded DNA (dsDNA) was quantified by spectrofluorometry using the Quant-iT PicoGreen dsDNA Assay Kit (ThermoFisher).
RNA Integrity Assessment
RNA integrity was assessed using RNA integrity numbers (RINs), size reverse transcription (RT)-PCR for different amplicon lengths, and quantitative RT-PCR (qRT-PCR). To generate RINs, RNA 6000 Nano or Pico chips (depending on the concentration of RNA) were run on a 2100 Bioanalyzer (all Agilent Technologies); RINs range from 1 (RNA completely degraded) to 10 (RNA completely intact).
For size RT-PCR, 100 ng of RNA from each sample was converted into complementary DNA (cDNA) in a total volume of 20 µl per reaction using random primers and the High Capacity cDNA Reverse Transcription Kit (ThermoFisher) on a C1000 PCR thermal cycler (Bio-Rad; Temse, Belgium). Thirty-two cycles of PCR were then carried out using 2 µl of cDNA, the FastStart High Fidelity PCR Kit (Roche), and a combination of four forward primers and one reverse primer to obtain amplicons of 66, 266, 535, and 943 base pairs (bp) of the hydroxymethylbilane synthase (HMBS) gene. Results were visualized by electrophoresis on a 1.5% agarose gel, stained with GelRed (Biotium; Hayward, CA) and imaged on an ImageQuant LAS 4000 (GE Healthcare; Hoevelaken, The Netherlands).
Aliquots containing 1.9 µl of cDNA were also applied to qRT-PCR, using TaqMan Gene Expression probes Hs02800695_m1, Hs00159357_m1, and Hs00609296_g1 (ThermoFisher) specific for the genes hypoxanthine-guanine phosphoribosyl transferase (HPRT1), mucin 1 (MUC1), and HMBS, respectively. The reactions were performed in triplicate in MicroAmp 96-well Reaction Plates (20 µl per reaction) using a 7500 real-time PCR System, and the data were interpreted using SDS v 1.4.2 software (all ThermoFisher). The mean of the triplicate wells was used for analyses. Positive controls (RNA of high integrity, extracted from cryopreserved Jurkat cell pellets) and negative controls were included in all PCR analyses.
DNA Integrity Assessment
DNA integrity was assessed using percentage dsDNA (percentage dsDNA = concentration by spectrophotometry/concentration by spectrofluorometry × 100), multiplex PCR, qPCR, DNA integrity numbers (DINs), and agarose gel electrophoresis.
Multiplex PCR was performed by amplifying 100-ng DNA in 35 cycles of PCR with primers generating 100, 200, 300, and 400 bp amplicons of the glyceraldehyde 3-phosphate dehydrogenase (GAPDH) gene as previously described. 14 The results were visualized on a 1.5% agarose gel stained using GelRed and imaged on the ImageQuant as in the size RT-PCR experiment. This assay is used to determine the amenability of FFPE biospecimens to whole-genome sequencing (WGS), with DNA extracts requiring at least 200 bp amplicons to pass QC. 15 In addition, agarose gel electrophoresis was used to visualize the extent of DNA degradation by separating 125-ng dsDNA per extraction on a 0.5% agarose gel, which was then stained and imaged as described above.
The Illumina FFPE QC Assay (Illumina; Eindhoven, The Netherlands) is also used to determine the amenability of DNA extracted from FFPE to WGS. The kit contains primers which generate multiple amplicons of approximately 110 bp and a reference DNA template. 16 Following qPCR, the Cq of each sample is compared with that generated from the reference template, with the resultant ΔCq denoting amenability to sequencing (ΔCq = Cq sample − Cq template). Lower ΔCq values denote less degraded DNA, and a ΔCq threshold of 2.0 is cited, above which a sample is deemed less amenable to WGS.3,17 We performed the assay as per manufacturer’s protocol using 2-ng dsDNA, 1 µl of the primers supplied in the kit, and 8-µl Platinum SYBR Green qPCR SuperMix plus 50-nM ROX (both ThermoFisher) at 10 µl per reaction. Samples were run in triplicate with the appropriate controls in a MicroAmp Optical 96-well reaction plate on the 7500 real-time PCR System with SDS v. 1.4.2 software (all ThermoFisher), and the mean value was taken for analyses.
DINs were generated using Genomic DNA ScreenTapes (200 bp–60 kbp resolution range) in a 4200 TapeStation (both Agilent), using 1-µl dsDNA per extraction. DINs are calculated by TapeStation software and (like RINs for RNA) range from 1 (DNA completely degraded) to 10 (DNA completely intact).
Statistical Analysis
Statistical analyses were carried out using SigmaPlot software v. 12.5 (Systat Software; San Jose, CA). A Shapiro–Wilk normality test was performed on each data set followed by a paired t-test, one-way repeated-measures analysis of variance (ANOVA), Wilcoxon signed-rank test, or one-way repeated-measures ANOVA on ranks, depending on data normality and the number of groups being compared. When ANOVA returned a statistically significant result (p < 0.05), the Holm-Šídák method of pairwise comparisons was used to identify where the statistical significance applied.
The data presented in the Figures and discussed in the text are based on n=8 per group by default, although the tissues came from four patients originally. This is because the extent of variation in the data from the two tissue blocks originating from the same patient was high, presumably due to tissue heterogeneity (e.g., a colon block yielded a tumor block and a normal block). However, for completeness, we also performed the statistical analyses treating the two NBF+ve and NBF−ve, and PFnPE blocks that originated from the same patient as biological replicates, using the mean of the two values and n=4. Usually the results were the same as when n=8 in terms of p > 0.05 or <0.05, and in these instances, we make no comment. However, on the occasions where using n=4 gives a different result than n=8 in terms of statistical significance, we state this in the text.
Results
Accumulation of Formalin in the Tissue Processor’s Water Flush
The concentration of formalin was assayed in the water flush of the tissue processor over 12 FFPE tissue processing runs, starting immediately (run 1) after the flush reagents had been replaced and four processing runs after the last processing reagent rotation. The processor’s reaction chamber was filled with 1 liter each reagent in all processing runs, except for the Xylene, alcohol, and water flush, where 5 liters was used. No formaldehyde was observed until run 5. Trace levels (<3-µM formaldehyde) were found in runs 5–7, after which formaldehyde levels increased in a broadly linear fashion, culminating at 191-µM formaldehyde after run 12 (Fig. 1). NBF is a 13.3-M formaldehyde solution, so the 10% NBF in our tissue processor will be approximately 1.3-M formaldehyde, and consequently, the 191-µM formaldehyde assayed in the water flush after 12 processing runs represents a 5000–7000 times dilution of the 10% NBF in the processors upstream formalin vessels.
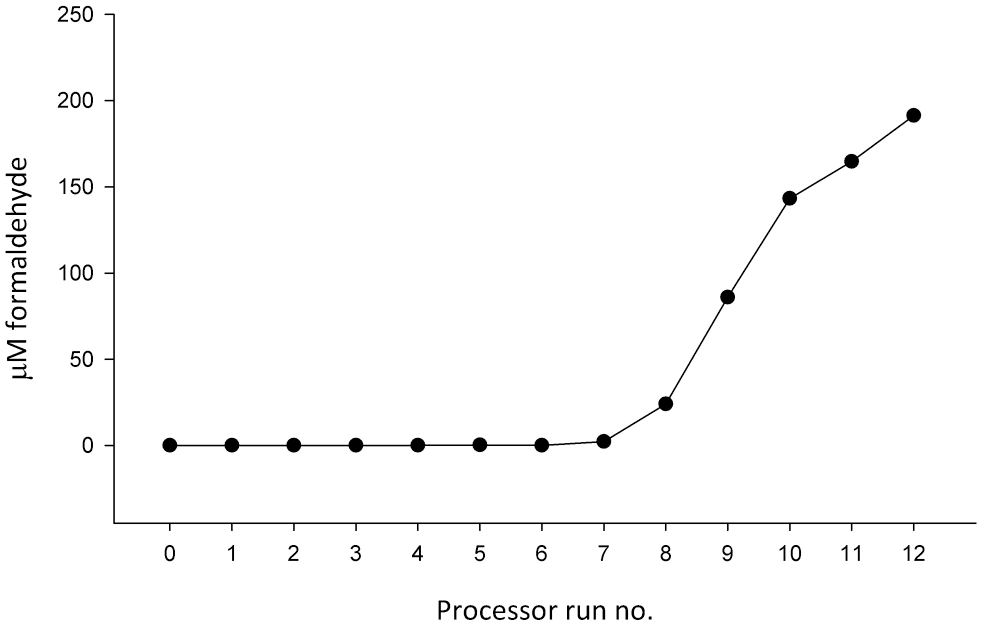
Accumulation of formaldehyde in the final water flush of the tissue processor over 12 formalin-fixed, paraffin-embedded (FFPE) processing runs following replacement of all flush reagents.
Histomorphology and IHC
There were no observable differences between NBF+ve and NBF−ve following HES staining (Supplemental Fig. 1). Morphological detail was well preserved, and the more eosinophilic coloration that is characteristic of PFPE compared with FFPE was apparent in all slides to the same extent.
MLH-1 stained positively in normal colonic epithelial cells and colonic stromal cells (normal and cancer), and in normal epithelial cells of the salivary gland and in the stromal cells of the uterus. The intensity of staining was slightly stronger in NBF−ve blocks compared with NBF+ve blocks for the colon only, but the difference was far too small to alter clinical diagnosis (Fig. 2). CK-7 stained positively in the salivary gland tissue and in the uterine tissue where adenomyosis had likely occurred. There were no differences between NBF+ve and NBF−ve blocks, or between the PFPE (Supplemental Fig. 2) and FFPE (Supplemental Fig. 3) staining protocols (the difference between them is an increase in antibody incubation time from 30 min [FFPE protocol] to 1 hr [PFPE protocol]). Ki-67 stained positively in colon epithelial cells (normal and cancer), in uterine stromal cells, and with a very low staining index in normal salivary gland cells. No difference was observed between NBF−ve and NBF+ve blocks, for either the PFPE (Supplemental Fig. 4) or FFPE (Supplemental Fig. 5) protocol, but the staining in the protocol optimized for PFPE (an increase in antibody incubation time from 16 to 32 min) was slightly clearer than the FFPE protocol.
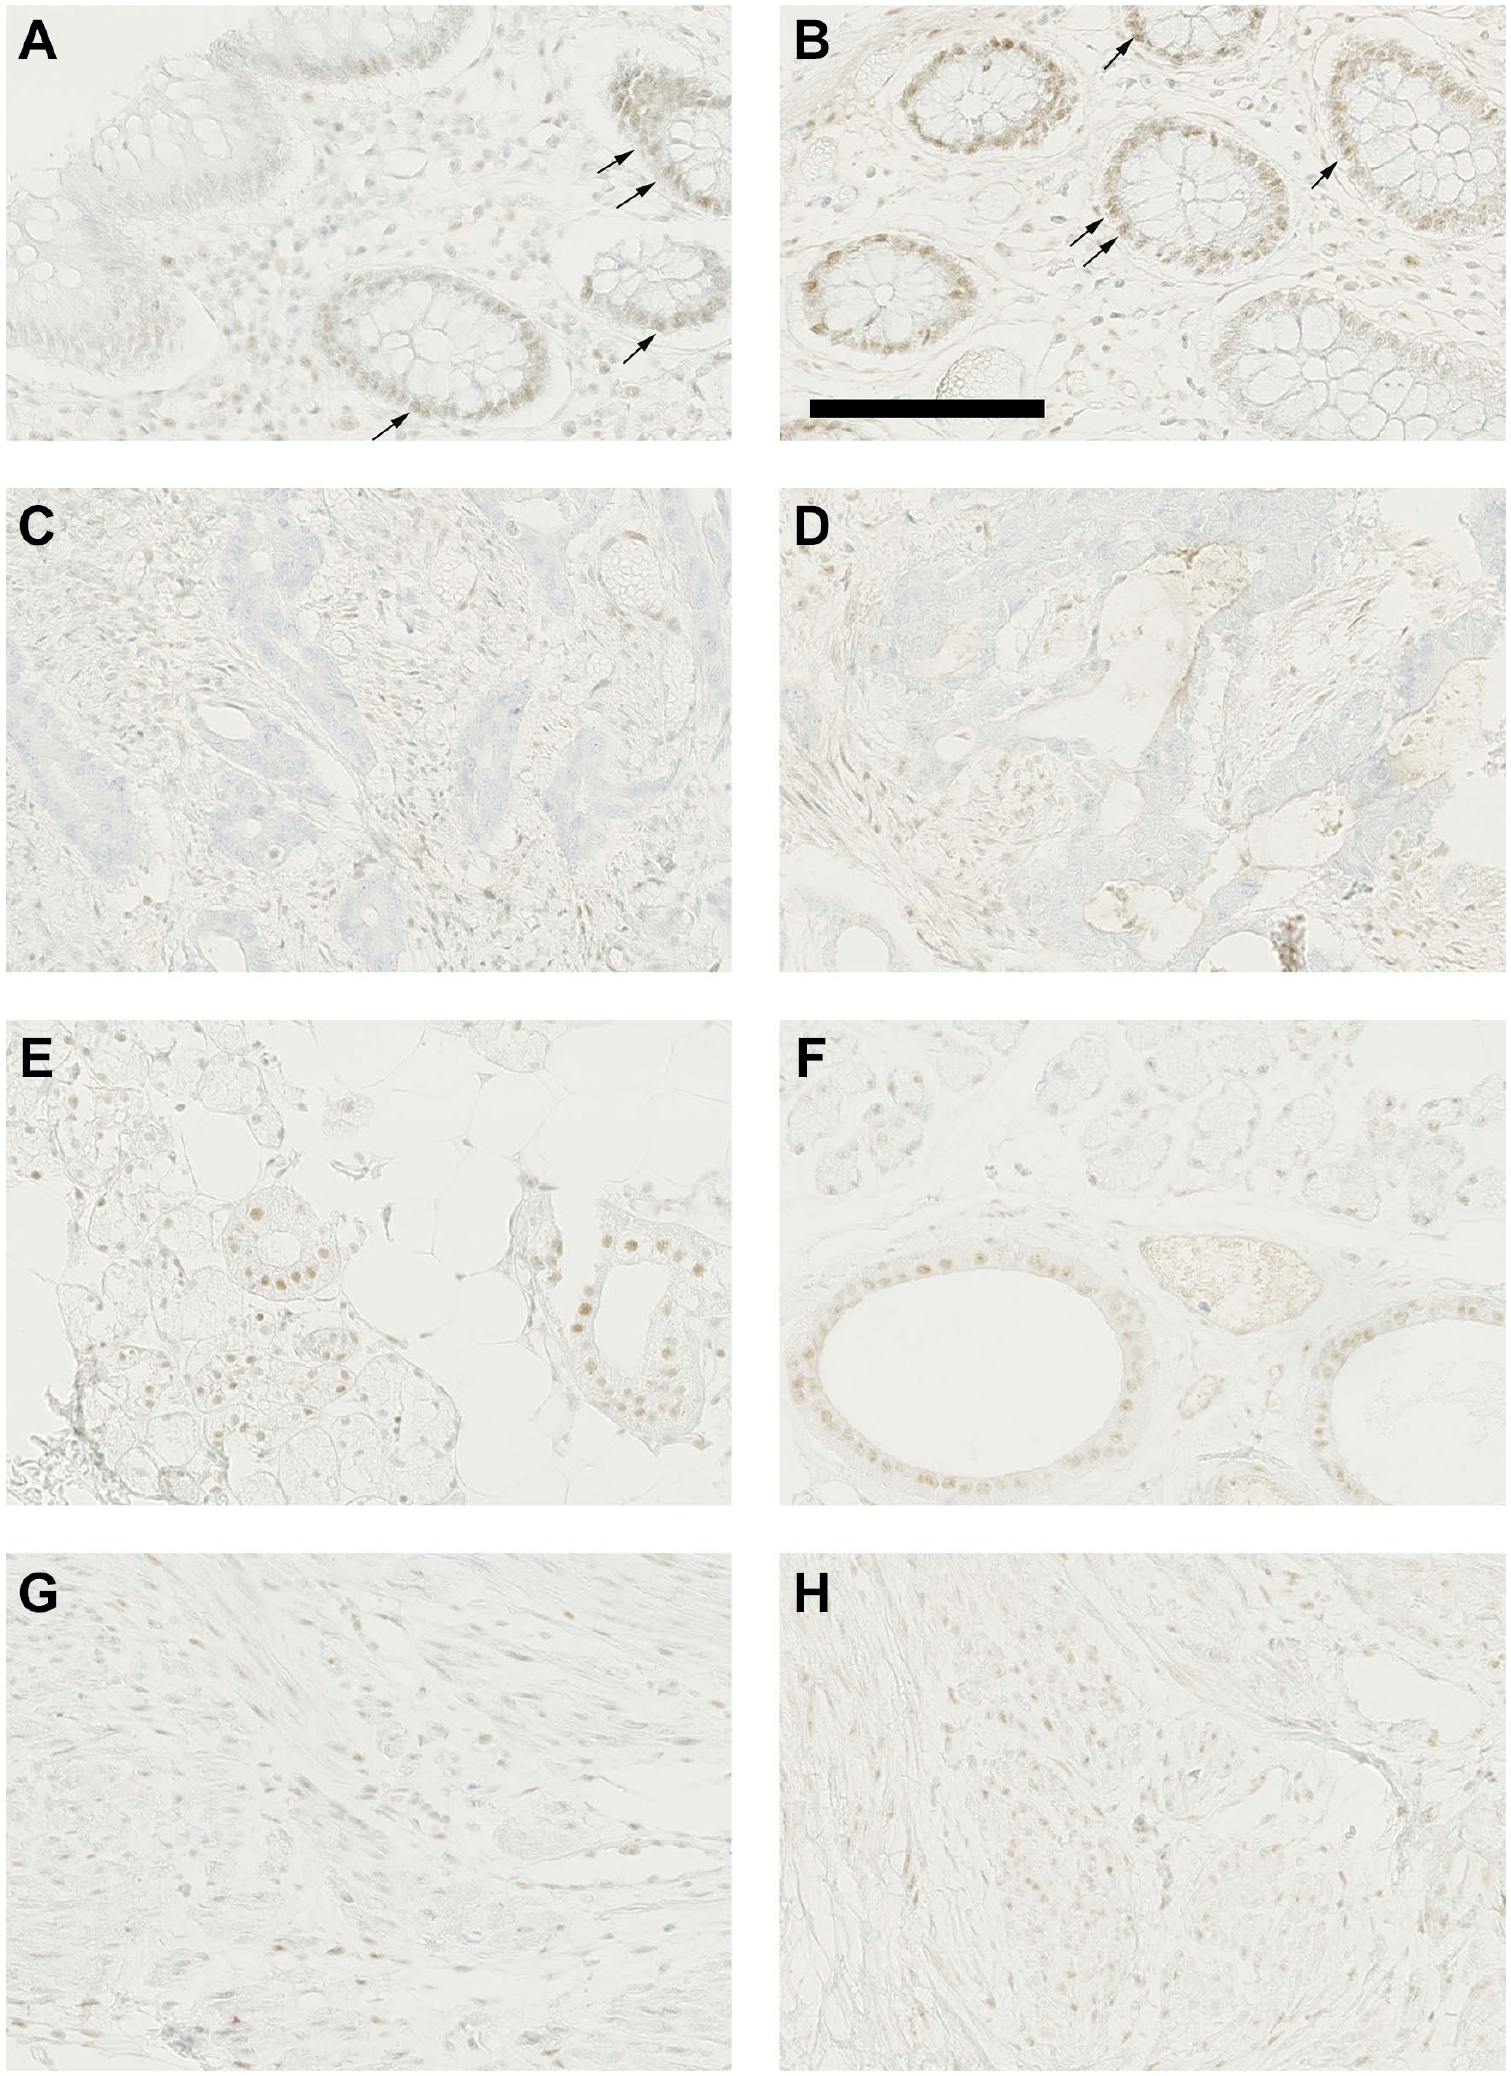
Immunohistochemistry using MLH1 antibody for PAXgene Tissue fixed, paraffin-embedded tissue (PFPE) normal colon (A, B), colon cancer (C, D), salivary gland (E, F), and uterus (G, H) tissue blocks that had been processed in a tissue processor previously used for formalin-fixed, paraffin-embedded (FFPE) (neutral buffered formalin [NBF]+ve, images A, C, E, and G) and a formalin-free system (NBF−ve, images B, D, F, and H). (A, B) In normal colon, MLH1 stained in the nucleus of epithelial cells and stromal cells, with NBF+ve (A) staining a little weaker than NBF−ve (B). (C, D) In colon cancer, MLH1 is negative in epithelial cells but is stained weakly in stromal cells. The immunohistochemical reactivity in stromal cells was a little lower in NBF+ve (C) compared with NBF−ve (D). (E, F) In normal salivary glands, MLH1 is expressed in the nucleus of acinar and ductal epithelial cells. The staining intensities were similar in both NBF+ve and NBF−ve. (G, H) In the uterus, stromal cells showed faint nuclear staining that was equivalent in NBF+ve and NBF−ve. The scale bar (B) applies in respect of all images and is 125 µM. Arrows denote positive staining cells.
RNA Yield
When extracted using the PAXgene Tissue RNA Kit (i.e., the recommendation by PreAnalytiX), mean RNA yields per five sections were 0.42 µg for the NBF+ve and 3.61 µg for NBF−ve tissue blocks (p < 0.001). This equates to a mean decline in RNA yield of 88% when PFPE blocks were processed in the formalin-contaminated processor compared with the formalin-free system. When the PAXgene extraction kit was replaced with the RNeasy FFPE extraction kit for the NBF+ve blocks, this “lost” RNA was completely rescued in every instance (p < 0.001): Mean yields were now 4.44 µg per five sections (Fig. 3). Yields were slightly higher in NBF+ve blocks extracted with the FFPE kit than in NBF−ve blocks extracted with the PAXgene kit, but this was not statistically significant (p=0.20). We tested the hypothesis that this “rescue” could be (partially) a consequence of the FFPE kit being inherently more efficient than the PAXgene kit for paraffin-embedded tissue by including a control where the FFPE kit was applied to NBF−ve blocks (n=2, randomly selected). The result was a decline in yield of 9.4% in one block and 8.0% in the other. Therefore, we conclude that the improvement in yield gained by switching to the FFPE kit when extracting RNA from NBF+ve blocks was a consequence of the NBF+ve blocks being partially fixed with formalin and had nothing to do with extraction kit efficiency. It was not possible to evaluate the effect of processing PAXgene-fixed tissue in respect of RNA yield because we could not normalize starting quantities of unprocessed (PFnPE) and processed (NBF+ve and NBF−ve) tissue.
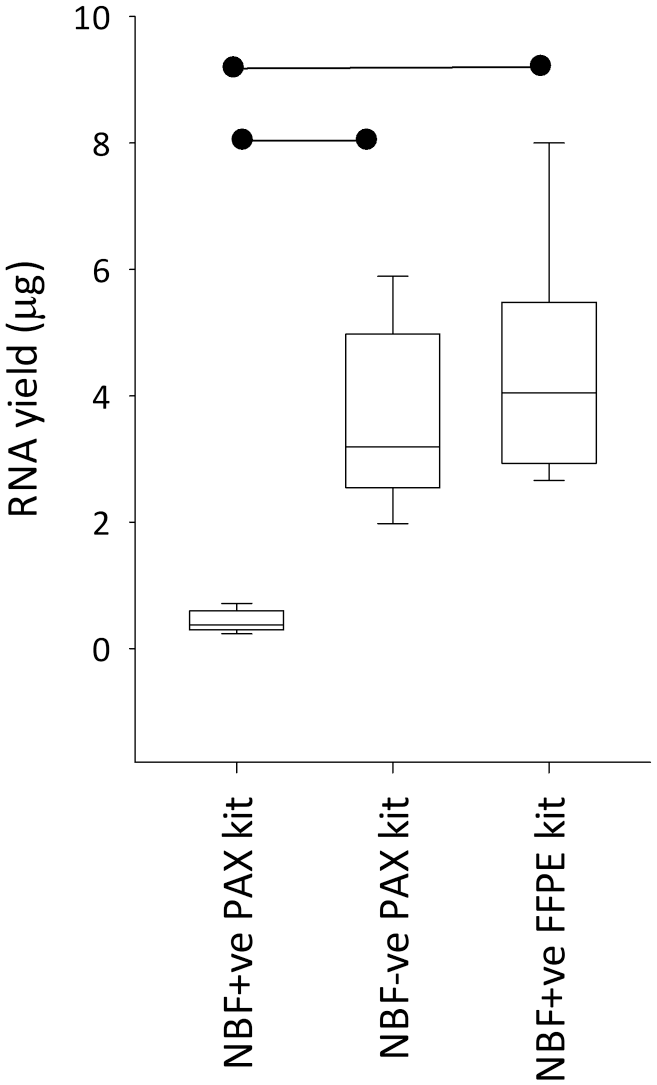
RNA yield from five 10-μm sections of PAXgene Tissue fixed, paraffin-embedded tissue (PFPE) tissue processed in a tissue processor also used for formalin-fixed, paraffin-embedded (FFPE) biospecimens (neutral buffered formalin [NBF]+ve) or in a formalin-free system (NBF−ve). RNA was extracted using the PAXgene Tissue RNA Kit (PAX kit) or the RNeasy FFPE Kit (FFPE kit). The boxes are first to third quartile intersected by the median and the whiskers are the range. The horizontal bars denote statistical significance (p < 0.001). The boxplot data are presented as individual data points in Supplemental Fig. 6A.
RNA Purity
RNA purities were assessed using 260:230 and 260:280. When the PAXgene extraction kit was used, lower ratios (i.e., lower purities) were found in NBF+ve blocks than in NBF−ve blocks: Mean 260:230 values were 0.57 (NBF+ve) and 1.21 (NBF−ve) and mean 260:280 values were 1.46 (NBF+ve) and 1.86 (NBF−ve), p < 0.04. Switching to the FFPE kit for the extraction more than recovered the purity that had been lost due to formalin contamination of the processor: It increased both ratios in the NBF+ve blocks (1.78 for 260:230 and 1.86 for 260:280, p < 0.05), such that the RNA was pure. A similar improvement in RNA purity was seen when the FFPE extraction kit was applied to the NBF−ve tissue blocks (but as n=2, the difference fell short of statistical significance), so although purities were compromised when the formalin-contaminated processor and the PAXgene extraction kit were used, part of the cause is likely the extraction kit. PFnPE tissue blocks had a mean 260:230 value of 0.95 and a mean 260:280 of value 1.97 (only the PAXgene extraction kit was used). The difference between PFnPE and NBF−ve (i.e., the effect of tissue processing) was not statistically significant for 260:230 (p=0.35) but it was for 260:280 (p < 0.001). However, the difference in 260:280 is inconsequential because ratios of 1.97 (PFnPE) and 1.86 (NBF−ve) both equate to pure RNA.
Therefore, we conclude that when extracting RNA using the PAXgene kit, using a formalin-free processing system returns purer, but not completely pure RNA. However, given that RNA from the unprocessed PFnPE tissue also had suboptimal 260:230 when the PAXgene kit was used, and as NBF+ve and NBF−ve universally returned pure RNA when the FFPE kit was used, we consider the PAXgene extraction kit, not the presence of formalin in the tissue processor to be the most influential factor.
RNA Integrity
RNA integrity was poorer in NBF+ve compared with NFB−ve in both RIN and PCR analyses. For RIN, when the PAXgene kit was used for the extractions, mean RINs were 3.8 for NBF+ve and 5.0 for NBF−ve blocks (p=0.012) (Fig. 4). When analyses were performed treating the two blocks cut from the same patient’s tissue as biological replicates (n=4), this difference fell short of statistical significance (p=0.10). In the NBF+ve samples, switching to the FFPE extraction kit caused the mean RIN to decline by 1.1 units to 2.7, p=0.009. The FFPE kit itself drove this reduction in RIN, as RINs were also reduced to 2.6 when the FFPE kit was used on the NBF−ve blocks. PFnPE had the highest RINs (mean: 6.3) and the lowest SD (0.5). The mean decline in RIN as a consequence of the processing was therefore 1.3 RIN units for the formalin-free system (p=0.007) and 2.5 units in the formalin-contaminated processor (p < 0.001).
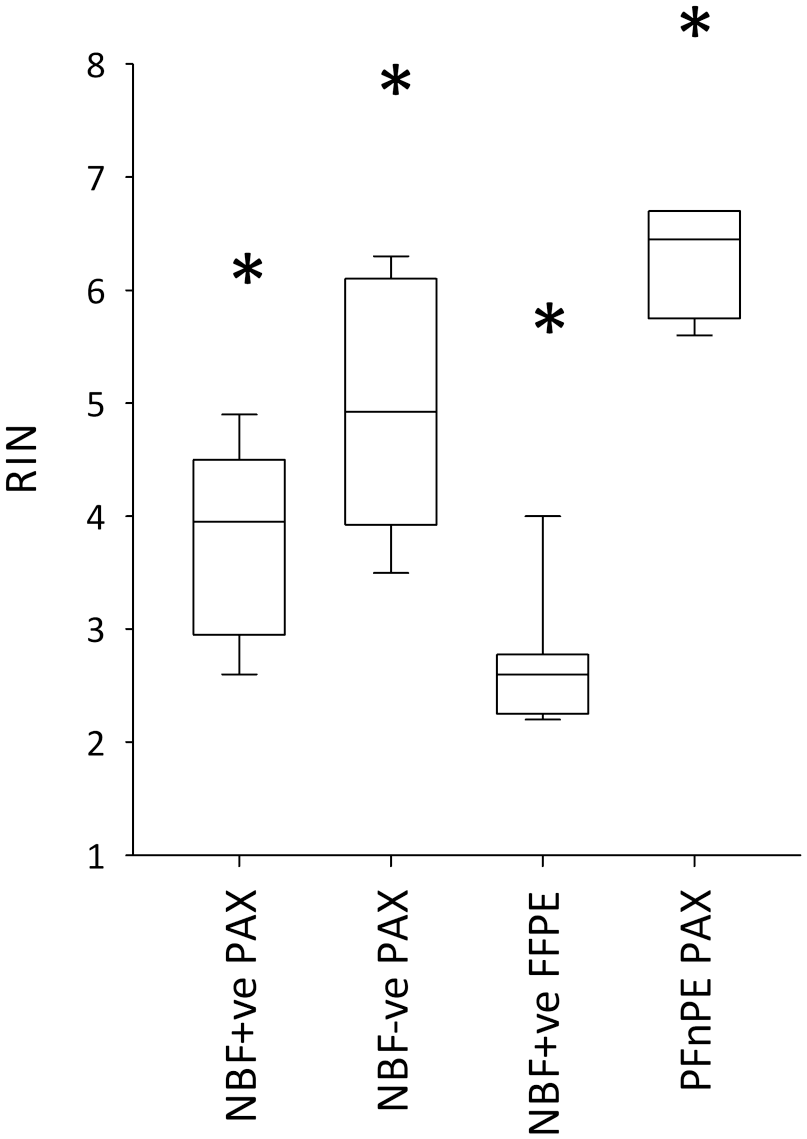
RNA integrity numbers (RINs) from PAXgene-fixed tissue processed in a tissue processor also used for formalin-fixed, paraffin-embedded (FFPE) tissue (neutral buffered formalin [NBF]+ve), in a formalin-free system (NBF−ve), or remained unprocessed (PFnPE). RNA was extracted using the PAXgene Tissue RNA Kit (PAX kit) or the RNeasy FFPE Kit (FFPE kit). The boxplots are as in Fig. 3. *All pairwise comparisons between the groups are statistically significant (p < 0.012). The boxplot data are presented as individual data points in Supplemental Fig. 6B.
The size RT-PCR experiment measures amplicon length using end-point PCR. When the PAXgene kit was used for the extractions, the longest amplicon (943 bp) was generated from 88% of NBF−ve blocks but none of the NBF+ve blocks. Moving sequentially down in size, the 535 bp amplicon was generated from 63% of the NBF+ve blocks and all NBF−ve blocks, the 266 bp amplicon in 87.5% of NBF+ve blocks and all NBF−ve blocks, and the 66 bp amplicon in every NBF+ve and NBF−ve block (Fig. 5). When the PAXgene kit was switched to the FFPE kit for the extraction, the detrimental effect the FFPE kit had on RNA integrity when measured using RIN did not recur, but instead, RNA integrity was improved; although the 943 bp amplicon could not still be amplified from any NBF+ve block, the 535, 266, and 66 bp amplicons could now be successfully generated in RNA from all blocks. Thus, for NBF+ve blocks, switching from the PAXgene extraction kit to the FFPE extraction kit was beneficial in increasing the amplicon length.
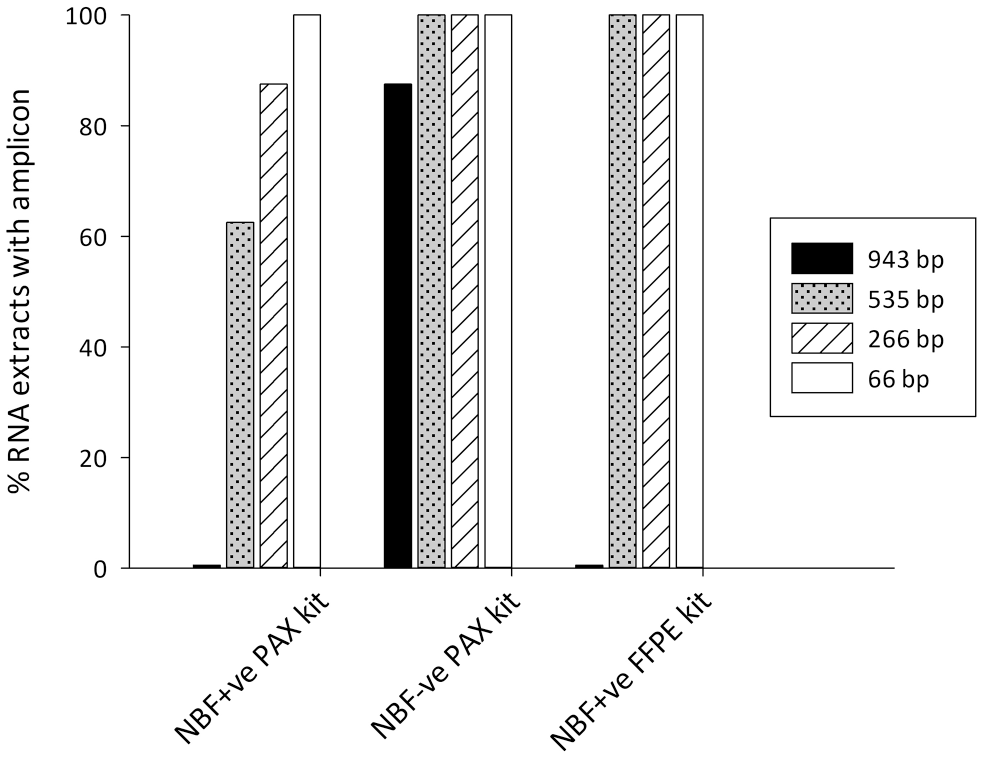
Size reverse transcription polymerase chain reaction (RT-PCR) for four amplicons (943, 535, 266, and 66 bp) of the hydroxymethylbilane synthase (HMBS) gene. PAXgene-fixed tissue was processed using a tissue processor previously used for formalin-fixed, paraffin-embedded (FFPE) biospecimens (neutral buffered formalin [NBF]+ve) or a formalin-free system (NBF−ve). RNA was extracted using the PAXgene Tissue RNA Kit (PAXgene) or the RNEasy FFPE Kit (RNeasy).
For PFnPE, the longest (943 bp) amplicon was generated from all extractions (compared with 88% of NBF−ve extractions), so there was little evidence that processing of PAXgene-fixed tissue was detrimental, provided the formalin-free system was used. If the assay was revised to include amplicons longer than 943 bp, a processing-effect might become apparent however. In contrast, processing PAXgene-fixed tissue in the formalin-contaminated processor (the difference between PFnPE and NBF+ve) resulted in a median reduction in PCR amplicon length of 408 bp (from 943 to 535 bp).
In the qRT-PCR analyses, when extractions were performed using the PAXgene kit, NBF+ve blocks had higher mean Cq (denoting poorer quality RNA) than NBF−ve blocks in all three genes tested (p < 0.001) (Fig. 6). When analyses were performed treating the two blocks cut from the same patient’s tissue as biological replicates (n=4), the lower Cq values in NBF−ve compared with NBF+ve fell just short of statistical significance (p=0.07). The mean ΔCq between NBF+ve and NBF−ve blocks was 2.0, 1.9, and 2.2 for the HPRT1, MUC1, and HMBS genes, respectively. Assuming a 100% amplification efficiency, this equates to 4.1-, 3.7-, and 4.5-fold reductions in quantified gene expression levels in NBF+ve as opposed to NBF−ve. Switching from the PAXgene kit to the FFPE kit for the extractions had no effect on Cq in any of the genes (p > 0.63). The effect of tissue processing had no observable impact on qRT-PCR results, provided the formalin-free system was used; the difference in mean Cq between PFnPE and NBF−ve was very small in magnitude (<0.2 Cq in each of the three genes) and fell well short of statistical significance in each gene (p > 0.70). In contrast, processing the tissue in the formalin-contaminated processor resulted in a mean increase in Cq of 2.2 (HPRT1), 1.8 (MUC1), and 2.3 (HMBS) (p < 0.001).
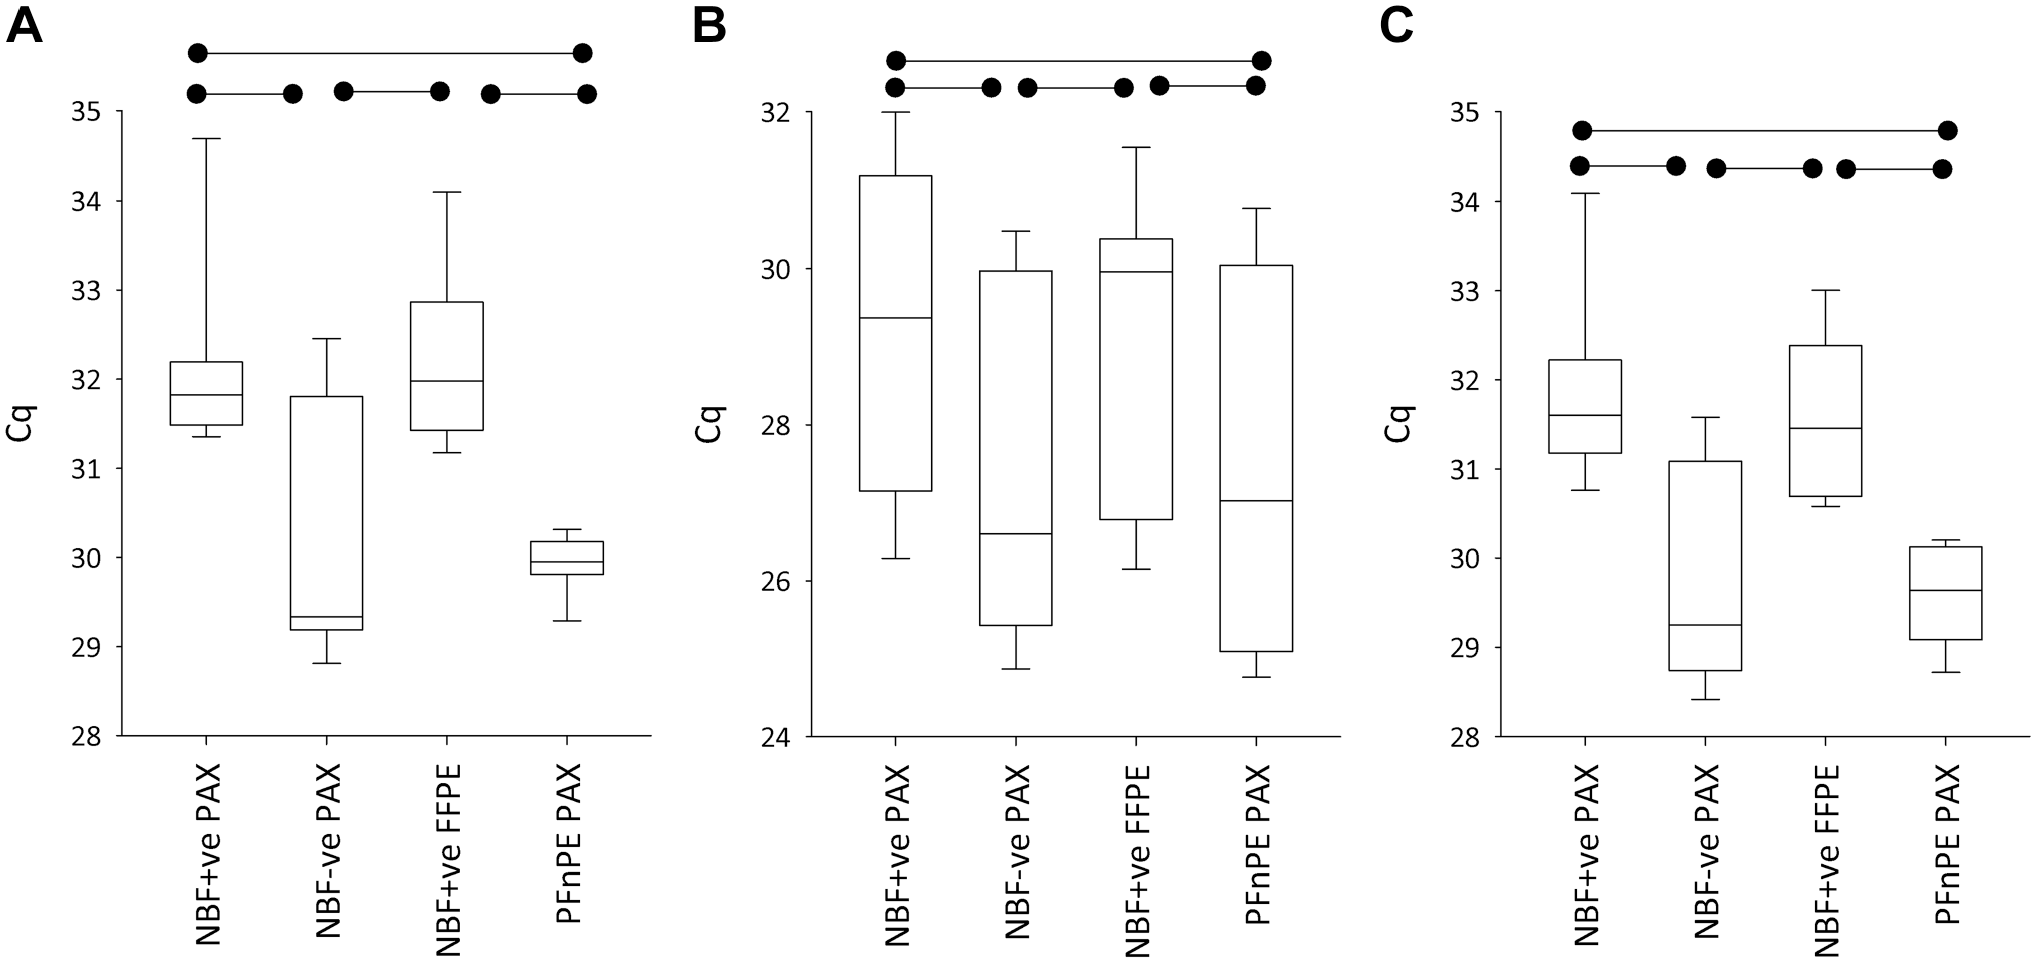
Cycle threshold numbers (Cq) following quantitative reverse transcription polymerase chain reaction (qRT-PCR) for hypoxanthine-guanine phosphoribosyl transferase (HPRT) (A), mucin 1 (MUC1) (B), and hydroxymethylbilane synthase (HMBS) (C) from PAXgene-fixed tissue processed in a tissue processor also used for formalin-fixed, paraffin-embedded (FFPE) tissue (neutral buffered formalin [NBF]+ve), in a formalin-free system (NBF−ve), or left unprocessed (PFnPE). RNA was extracted using the PAXgene Tissue RNA Kit (PAX kit) or the RNeasy FFPE Kit (FFPE kit). The boxplots are as in Fig. 3. The horizontal bars denote statistical significance (p < 0.001). The boxplot data are presented as individual data points in Supplemental Fig. 6C.
DNA Yield, Purity, and Integrity
Mean yields of DNA from the five sections were 4.1 µg (NBF+ve) and 4.6 µg (NBF−ve) for photometry and 2.3 µg (NBF+ve) and 1.7 µg (NBF−ve) for fluorometry, with the differences falling well short of statistical significance (p > 0.60). Therefore, using the formalin-contaminated processor had no effect on DNA yield. As with RNA, it was not possible to measure the effect of tissue processing on yield because we could not normalize for starting quantity between unprocessed, unembedded (PFnPE), and embedded (NBF+ve and NBF−ve) tissue. Every extraction yielded pure DNA, with mean 260:280 values of 1.86 for NBF+ve, NBF−ve, and PFnPE.
Mean % dsDNA values were 57.0% for NBF+ve and 38.6% for NBF−ve (p < 0.001) (Fig. 7A). It is perhaps counterintuitive that the difference in % dsDNA between NBF+ve and NBF−ve has strong statistical significance when both photometry and fluorometry concentrations had fallen so far short of statistical significance. However, in the % dsDNA calculation, fluorometry concentrations were divided by photometry concentrations for each extraction before the comparison between NBF+ve and NBF−ve was made. Although processing tissue in the formalin-contaminated processor returned DNA enriched in dsDNA compared with processing in the formalin-free system, the processing procedure still negatively impacted DNA integrity because % dsDNA values were significantly higher in PFnPE (mean: 78.5%) than in either NBF+ve or NBF−ve (p < 0.001).
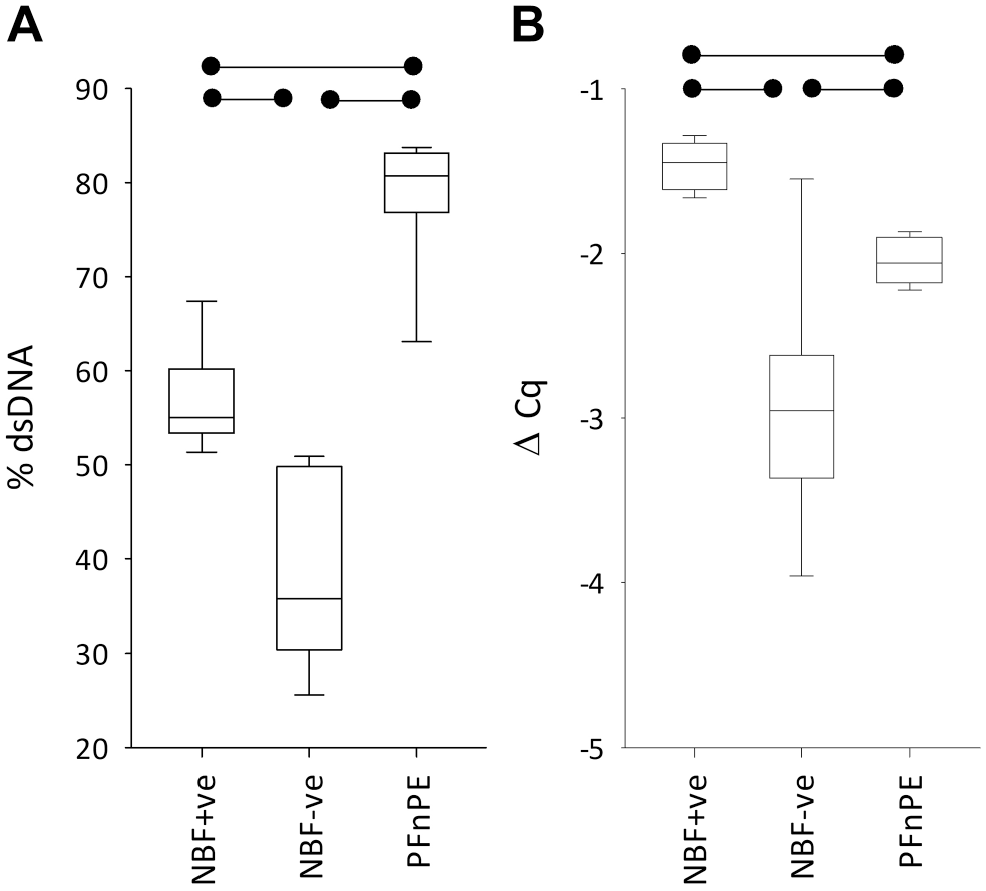
DNA integrity measured using percentage double-stranded DNA (dsDNA) (A) or ΔCq in the Illumina formalin-fixed, paraffin-embedded (FFPE) QC assay (B) from PAXgene-fixed tissue processed in a tissue processor also used for FFPE tissue (neutral buffered formalin [NBF]+ve), in a formalin-free system (NBF−ve), or left unprocessed (PFnPE). The boxplots are as in Fig. 3. The horizontal bars denote statistical significance (p < 0.01). The boxplot data are presented as individual data points in Supplemental Figs. 7A and 7B.
In the multiplex PCR, where 100, 200, 300, and 400 bp amplicons were generated from GAPDH using 35 cycles of PCR and then visualized on an agarose gel, all extracts generated all the amplicons. In qPCR (the Illumina FFPE QC assay), lower ΔCq values denote higher DNA integrity, and a negative ΔCq value occurs when a sample is less degraded than the reference template. DNA was more degraded in NBF+ve than in NBF−ve blocks: Mean ΔCq was −1.5 for NBF+ve and −2.9 for NBF−ve (p < 0.001), with ΔCq being on average 1.5 Cq units higher in the NBF+ve blocks compared with their matching NBF−ve counterpart (Fig. 7B). However, despite the lower ΔCq in NBF+ve, all extractions returned ΔCq values that are considerably below 2.0, so as previously found with the multiplex PCR assay, all extractions passed the WGS QC thresholds that are applied to FFPE with a comfortable margin.
PFnPE returned ΔCq values that were intermediate between NBF+ve and NBF−ve (mean ΔCq = −2.05, p < 0.01), which indicated that processing tissue actually improved DNA integrity in the formalin-free system but was detrimental when the formalin-contaminated processor was used. The difference between NBF−ve and PFnPE fell short of statistical significance (p=0.11) when the two blocks cut from the same patient’s tissue were treated as replicates.
Median DINs were 5.7 for NBF+ve and 5.9 for NBF−ve (Fig. 8A). Although there were no instances where NBF+ve DIN was higher than its NBF−ve counterpart, the differences between the two groups were very small (mean: 0.3 DIN units) and two of the eight NBF+ve/NBF−ve pairs had identical DINs, so overall, there was no statistical significance (p=0.22). Mean DIN in PFnPE extractions was 7.4 (1.5–1.7 units higher than NBF+ve and NBF−ve, respectively, p < 0.01).
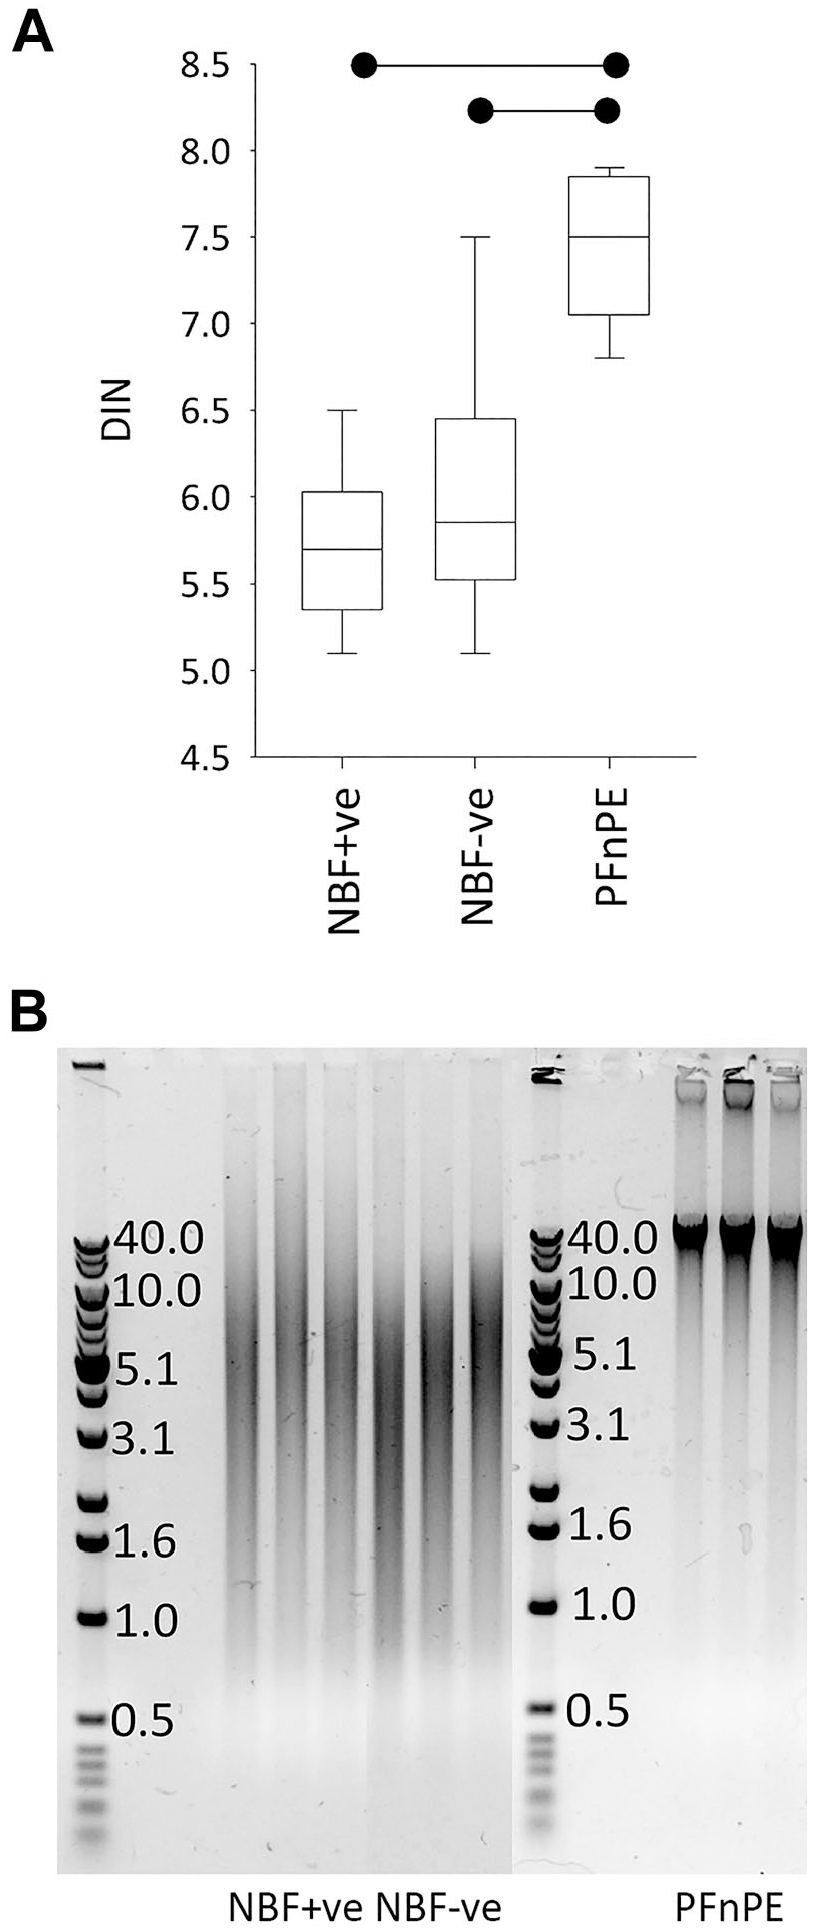
DNA integrity measured using DNA integrity numbers (A) and agarose gel electrophoresis (B) from PAXgene-fixed tissue processed in a tissue processor also used for formalin-fixed, paraffin-embedded (FFPE) tissue (neutral buffered formalin [NBF]+ve), in a formalin-free system (NBF−ve), or left unprocessed (PFnPE). The boxplot is as in Fig. 3. The horizontal bars denote statistical significance (p < 0.01). The boxplot data are presented as individual data points in Supplemental Fig. 7C.
When analyzed by agarose gel electrophoresis, DNA from NBF+ve and NBF−ve blocks was partially degraded, with all samples returning a comparable smear of DNA of range 0.5–30 kbp (Fig. 8B). Although the DIN values indicated partially degraded DNA in PFnPE, this was not evident in agarose gel electrophoresis as here PFnPE had clear and distinct bands at 20–40 kpb with very little smearing.
To summarize the DNA results, using the formalin-contaminated processor as opposed to the formalin-free system enriched for dsDNA and had no impact on DNA yield or purity. DNA integrity was unaffected when assayed using multiplex PCR up to 400 bp, DIN, or agarose gel electrophoresis, but declined when assayed using qPCR (however, the magnitude of the degradation was insufficient to cause the samples to fail the QC threshold for WGS). The tissue processing procedure caused declines in % dsDNA values and DNA integrity when assayed using DIN and agarose gel electrophoresis, but DNA purity was unaffected. The qPCR results indicated that DNA integrity improved following tissue processing when the formalin-contaminated processor was used but declined in the formalin-free system.
Discussion
We have demonstrated that formalin started to accumulate at quantifiable concentrations in our tissue processor’s water flush five FFPE processing runs after all three flush reagents had been replaced (which was nine runs after the last rotation of processing reagents). Neither flush nor processing reagents are changed between processing runs, so it was not surprising that each subsequent processing run resulted in a further increase in the quantity of formalin in the water flush. Although the formalin was much diluted (5000–7000 times after 12 processing runs) the water flush is the most distant reagent from the formalin (with 14 intermediate regents), and so is logically the least contaminated. A laboratory processing alcohol-fixed tissue blocks would disable the initial formalin vessel(s) used for processing FFPE tissue and start with tissue dehydration in the most dilute alcohol solution. This will logically be the reagent most contaminated with formalin for two reasons: It is next in the chronological order from the formalin in the FFPE tissue processing protocol and it will have the highest number of previous uses because of the processing reagent rotation regimen: 136 in our case (see Table 1).
We applied the manufacturer’s recommended processing protocol for our biospecimens, which started with a 45-min immersion in the initial alcohol solution. It is a common practice however, in overnight processing runs, for the tissue to remain immersed in the first processing reagent for several hours (and potentially up to 2 days over a weekend) to allow the processing run to end as the technicians arrive in the morning, thus avoiding extended incubations of tissues in hot paraffin wax. For formalin-fixed biospecimens, this initial reagent is formalin, but for alcohol-fixed biospecimens, it would be the initial and most formalin-contaminated alcohol reagent. Unfortunately, water was the only reagent in the processor that was compatible with the formaldehyde assay, so it was impossible to assay the formaldehyde concentration in the processor’s alcohol, Xylene substitute, or paraffin vessels. Given that the initial alcohol step is logically the most detrimental, a minimum rudimentary step that laboratories could take to ameliorate the problem of unwanted formalin fixation would be to retain a “clean” bottle of this alcohol reagent, which they exclusively use when processing alcohol-fixed biospecimens in a processor also used for formalin-fixed tissues.
There is very little known about how residual formalin in a tissue processor might impede molecular analyses of alcohol-fixed biospecimens. PreAnalytiX (PAXgene’s manufacturer) has published a technical note that presents results from an experiment where they analyzed RNA from rat liver and intestine tissue that had been fixed in PAXgene fixative and stabilizing solution according to their standard protocol, then immersed in 70% ethanol for different periods of time (representing the initial reagent in the tissue processing cascade), but with and without “1% v/v NBF” 18 (PreAnalytiX clarified upon our enquiry that they diluted a 10% NBF solution 100 times, resulting in a 0.1% formalin or 0.04% formaldehyde solution.) Unfortunately, no statistical analyses are presented, but it is clear that some decline in RNA yield and integrity occurred after 6-hr immersion in 0.1% NBF, which was much larger after 12 hr. PreAnalytiX therefore recommend users not to use reagents contaminated with even trace amounts of formalin. 18 The decline in RNA yield and integrity after 2-hr immersion appears marginal though, indicating that formalin contamination is less of an issue for laboratories using rapid processing protocols for small biopsies. Given that RNA yields from PFPE tissue are considerably higher per section than in FFPE tissue, we think that laboratories who work with RNA extracted from small, rapidly processed biopsies will likely find that PFPE still offers significantly higher RNA integrity than FFPE, even if they use a formalin-contaminated processor.12,19
The NBF+ve blocks in this study were processed in an Excelsior ES tissue processor. This enclosed type of processor has a single reaction chamber into which each processing reagent is pumped in turn via a rotary valve. The processor can accommodate up to 222 tissue cassettes in six tissue cassette baskets that are stacked in three layers in the processor’s reaction chamber (74 tissue cassettes per layer). Each processing reagent is stored in a separate vessel at a relatively large volume (5 liters), but the volume of processing reagent pumped into the reaction chamber is dependent on the number of stacked baskets present therein. In our workflow, one layer of baskets (≤74 tissue blocks) is almost exclusively used, equating to the pumping of each processing reagent into the reaction chamber to a total volume of 1.25 liters (equating to approximately 1-liter reagent plus 250-ml dead volume for the baskets, tissue cassettes, and biospecimens). In each of the three postprocessing flushing steps, however, the (now-empty) reaction chamber is filled to its maximum capacity (5 liters).
During tissue processing, each reagent is pumped from its reservoir vessel into the reaction chamber for the specified time period (during which the reagent is stirred), and then pumped back into the reservoir vessel whence it came, with the pumping time adjusted to correspond with the volume of reagent. Each reagent vessel has a dedicated tube leading directly to the reaction chamber, so there is no shared tubing where reagents can mix and carryover. Reagents enter and leave the reaction chamber via a port seal that has no dead volume, so no reagent carryover can occur here either. The only means by which reagent carryover can occur is via dampness on the surfaces of the reaction chamber, port seal, tissue basket, tissue cassettes, and in or on the tissues themselves.
Differences in processor design will equate to differences in the volume of processing liquids being carried over to contaminate downstream reagents. In a carousel (“dip and dunk”) type of processor, for example, each processing reagent is in a separate beaker and the basket containing tissue cassettes is lifted from beaker to beaker sequentially. Reagent carryover is minimized by incorporating delays into the processing program, during which the basket of tissue cassettes is suspended above each reservoir in turn, allowing the reagent to drain. This might be inherently more effective than the draining process in the reaction chamber type of processor we used, and there is no reaction chamber for dampness to adhere to in a carousel tissue processor. The maximum capacity of a rotary tissue processor in terms of the number of tissue blocks per run is also lower than in an enclosed reaction chamber processor, which might equate to reduced reagent carryover. This lower capacity is accompanied with lower volumes of reagent however, which would mean carryover reagents are less diluted. Unlike the reservoir vessels of a reaction chamber processor however, the beakers of a rotary/carousel processor can be removed and thoroughly cleaned, and the lower volumes they contain make it more feasible for a lab to retain a set of dedicated formalin-free reagents for the processing of alcohol-fixed biospecimens.
The extent to which formalin has contaminated downstream processing reagents will also depend on how many times the flush reagents have been used, the efficiency of the flush protocol, the size and number of biospecimens processed per FFPE processing run, and the number of processing runs performed since a reagent rotation. The issue is therefore complex, and comparisons between instruments and laboratories are challenging. We also need to address the possibility that different alcohol fixatives might be differently susceptible to residual formalin because of differences in their formulae. PreAnalytiX does not publish formulae for either PAXgene Tissue Fixative or PAXgene stabilizing solution, but the PAXgene Fixative’s Material Safety Data Sheet (MSDS) states it contains 50–70% methanol, 10–20% acetic acid, and 1–10% polyethylene glycol. No components of the PAXgene stabilizing solution are listed in its MSDS, but PreAnalytiX provides it in a concentrate that is diluted to a 30% working solution in pure ethanol. Therefore, the principal component in both solutions is alcohol, so like other alcohol fixatives, PAXgene’s mechanism of action will be precipitation and denaturation, not chemical modification. While we cannot speculate whether susceptibility to formalin might be lower or higher in the PAXgene fixation system compared with alternative alcohol fixatives, we see no reason why the phenomenon itself would be restricted to PAXgene and instead think this is an issue pertinent to all non-formalin fixatives, whether alcohol-based or not.
Processing PAXgene-fixed tissues in our processor, compared with the formalin-free system, had no impact on histomorphology and caused an inconsequential decline in staining intensity in one of the three antibodies used for IHC. For DNA, using a formalin-contaminated processor had no impact on yield or purity and its integrity was unaffected when assessed using nanoelectrophoresis or multiplex PCR. The qPCR results in the Illumina FFPE QC Assay were counterintuitive however: an improvement in DNA integrity in NBF−ve but not NBF+ve compared with PFnPE, indicating that tissue processing improves DNA integrity, provided the formalin-free system was used. Both NBF+ve and NBF−ve biospecimens had been stored at −80C in PAXgene stabilizing solution for <4 weeks before being processed, but the PFnPE tissue was stored in stabilizing solution at −80C for a further 6 months before DNA extraction. We reject the hypothesis that storing tissue in stabilizing solution as opposed to embedding it in a paraffin block caused additional DNA degradation in PFnPE because the other DNA integrity assays we performed found DNA extracted from PFnPE to be more intact than either NBF+ve or NBF−ve.
Instead, we think it likely that the result is a consequence of the quantification method used in the Illumina FFPE QC Assay. Illumina specifies that quantification should be performed using Pico Green, with 2.0-ng dsDNA applied to each reaction. Given that NBF+ve and NBF−ve extracts had much lower % dsDNA values than PFnPE extracts, they were enriched in single-stranded DNA (ssDNA). Indeed, on average, each NBF+ve reaction contained 1.0 ng more and each NBF−ve reaction 3.0 ng more ssDNA than its PFnPE counterpart. We think that some of this ssDNA was amplified, and as NBF+ve and NBF−ve were enriched in ssDNA compared with PFnPE, Cq and therefore ΔCq values were lowered. The same applies to the NBF+ve/NBF−ve comparison: The lower ΔCq values in NBF−ve could have been driven to some extent by their enrichment in ssDNA. Consequently, we are not confident that differences in ΔCq equate to differences in DNA integrity between the groups. This assay is designed for FFPE tissue where % dsDNA values will be less divergent than we found between PFnPE (78.5% dsDNA) and NBF−ve (38.6% dsDNA).
We therefore conclude that for pathology and DNA analyses, the effect of formalin contamination on tissue processing reagents is likely inconsequential in magnitude. The same cannot be said for RNA however: Using the formalin-contaminated processor caused a 90% reduction in yield, a decline in purity, a decline of 1.1 RIN units, a median reduction in PCR amplicon length of 408 bp in size RT-PCR, and an increase in Ct in qRT-PCR of between 1.9 and 2.2 Ct numbers (equating to a 3.7- to 5.1-fold loss of mRNA in qRT-PCR), depending on the gene. However, the RINs (mean: 3.8) and amplicon lengths (408 bp) we found in NBF+ve are still higher than we would expect from FFPE tissue. While the lost yield and purity in NBF+ve could be completely rescued by switching to the FFPE extraction kit, doing so produced only a marginal improvement in amplicon length for size RT-PCR, no improvement in qRT-PCR and the RNA was further degraded (by a mean of 1.2 units) when assessed using RIN.
There are several differences between the FFPE and PFPE RNA extraction kits that could be influential when using the FFPE kit to rescue RNA yield in NBF+ve blocks. Deparaffinization was performed using the same reagents in both kits, but the volumes were lower in the PAXgene kit compared with the FFPE kit (650-µl Xylene and ethanol as opposed to 1 ml). It is known that the deparaffinization method is a critical factor determining RNA yield and integrity. 20 However, in the control extractions in which the FFPE extraction kit was applied to the NBF−ve blocks, RNA yield and integrity both declined compared with the PFPE kit, so we reject the hypothesis that the FFPE RNA extraction kit was inherently more effective at extracting RNA from PAXgene-fixed tissues. Instead, we think RNA yields were higher in NBF+ve blocks when the FFPE extraction kit was used because the FFPE extraction kit is more effective in reversing the effects of formalin fixation than the PAXgene extraction kit.
Applying a proteinase K digest in the extraction protocol improves RNA yield and integrity in formalin-fixed tissues by digesting proteins cross-linked to RNA. 21 In the PAXgene RNA extraction kit, the digest is performed at a lower temperature (45C as opposed to 56C in the FFPE RNA kit). In addition, the FFPE extraction kit’s protocol includes an incubation at 80C for 15 min, which is not in the PAXgene kit’s protocol. The heat reverses formalin cross-links, enabling more RNA of higher integrity and fewer formaldehyde moieties to be extracted. In addition, the RNA delivered by the FFPE kit was of higher purity, and impurities are known to impede PCR efficiency. 22 In NBF−ve blocks however, the incubation at 80C would likely be detrimental.
Several publications have evaluated PFPE in respect of its ability to preserve RNA, where the presented results would likely be compromised if a formalin-contaminated processor had been used. Three studies (Sanchez et al., 10 Mathieson et al., 12 and Hognas et al. 19 ) state dedicated formalin-free tissue processors and reagents were used. The remaining papers did not state what measures were taken, so we contacted the corresponding authors for clarification. Dotsenko et al. 23 , Staff et al., 24 and Taavela et al. 25 originate from the same laboratory, who invested in a low-cost Kedee KD-TS1 processor, which they dedicated to processing PAXgene biospecimens using formalin-free reagents. The Southwood et al. 26 study used a processor also used for FFPE blocks, but they flushed it with fresh alcohol and Xylene and then replaced all reagents with new before processing the PFPE tissues. Liu and Edward 27 used a shortened, 5-hr formalin-free processing method optimized for their ocular PAXgene-fixed biospecimens, but they did not state whether this was performed manually or in a tissue processor. Ergin et al. 28 used a formalin-free, PAXgene-dedicated processor, and Yamazaki et al. 29 processed their murine tissue biospecimens manually using dedicated PFPE glassware and reagents. We were unable to obtain clarification in respect of Hara et al. 30
Walsh et al. 31 used a formalin-free processor and formalin-free reagents to process piscine liver tissue fixed for different times in PAXgene and the zinc-based fixative Z-Fix, which they then compared with FFPE tissue processed on a different processor. They extracted RNA from all three fixatives using an FFPE extraction kit, which included an incubation at 80C for 15 min, and although they found RNA yields higher in PFPE compared with FFPE, there was no statistically significant difference in the RINs. All other PFPE/FFPE comparative studies that we know of found RINs in PFPE to be higher than FFPE.9,12,19,24,28,30 Formalin contamination in the PFPE biospecimens cannot account for this result given that Walsh et al. did not use a formalin-contaminated processor, so we think using the FFPE RNA extraction kit with its 80C incubation step for PFPE tissue was the likely cause of the poor RNA integrity in the PAXgene-fixed tissues in their study.
The only other study we are aware of that has investigated how tissue processing parameters effected nucleic acid, histomorphology, and IHC in PFPE blocks is Hognas et al. 19 They processed prostatectomy core biopsies in tissue processors previously used for FFPE, but they had been fully cleaned and filled with fresh processing reagents. The authors initially compared a processor with a reaction chamber (a Pathos Delta) with a carousel processor (a Shandon Citadel 2000). The only difference in the two processors’ protocols was that the final incubation in paraffin was performed in one 2.5-hr step in the Pathos Delta and in two steps of 1 hr and 15 min. each in the Shandon Citadel. No difference in RNA integrity was found using RNA quality number (RQN) (a metric on a scale of 1–10 that is comparable to RIN) or in DNA integrity assessed using gel electrophoresis. 32 However, the authors found the RNA results to be suboptimal, with mean RQN between 4.5 and 5.5.
To improve RNA integrity, Hognas et al. then reduced the size of the biopsy cores from 301 to 170 mm3, lengthened the processing protocol to 11 hr by adding four additional steps (an immersion in “PAXgene stabilizer” [presumably PAXgene stabilizing solution], two isopropanol immersions plus an immersion in a Xylene/paraffin mixture). They also switched to a paraffin wax with a lower melting temperature. This amended processing protocol was performed in a third tissue processor, dedicated to PFPE (a carousel-type, Leica TP1020). The aim of the Hognas et al. study was to compare PFPE with FFPE and frozen tissue, so they do not present a detailed comparison between the PFPE processing methods. Nevertheless, it is clear that the optimized protocol was better because mean RQN was approximately 1.5 units higher in the optimized protocol, with no samples returning an RQN that was lower than the mean RQN found in the initial processing protocol. It is therefore clear that in addition to avoiding formalin-contaminated processing reagents, optimizing the processing protocol can return significant improvements in RNA integrity in PFPE biospecimens.
Clearly, formalin contamination of tissue processors should be avoided when processing alcohol-fixed biospecimens, particularly when RNA is the analyte of interest. However, many laboratories will find it impractical to adopt a dedicated tissue processor for alcohol-fixed biospecimens. In such instances, we recommend maintaining as comprehensive a set of dedicated reagents for alcohol-fixed biospecimens as possible. For the PAXgene fixation system, PreAnalytiX states in their latest handbook that dedicated formalin-free reagents should be used for the first five alcohol positions in the processing protocol, but beyond that there is no necessity on account of continued dilution. 33 However, we demonstrate that formaldehyde can be transferred right through the reagent cascade and into the final water flush, so recommend utilizing a dedicated formalin-free processing system for alcohol-fixed biospecimens where possible.
Supplemental Material
sj-pdf-1-jhc-10.1369_00221554211017859 – Supplemental material for Do Tissues Fixed in a Non-cross-linking Fixative Require a Dedicated Formalin-free Processor?
Supplemental material, sj-pdf-1-jhc-10.1369_00221554211017859 for Do Tissues Fixed in a Non-cross-linking Fixative Require a Dedicated Formalin-free Processor? by Sonia G. Frasquilho, Ignacio Sanchez, Changyoung Yoo, Laurent Antunes, Camille Bellora and William Mathieson in Journal of Histochemistry & Cytochemistry
Footnotes
Acknowledgements
We acknowledge the assistance and thank Mr. Robby Verstraeten of Epredia for providing technical details relating to the Excelsior ES tissue processor.
Competing Interests
The author(s) declared no potential conflicts of interest with respect to the research, authorship, and/or publication of this article.
Author Contributions
SGF performed all work relating to automated tissue processing, embedding, sectioning, histomorphological staining, created the tissue microarray, and performed the immunohistochemistry (IHC). IS performed the nucleic acid extractions and work relating to Figs. 3 to 6 and the agarose gel electrophoresis. CY evaluated the IHC, LA performed the histomorphology, and CB performed the multiplex polymerase chain reaction for the DNA. WM conceived the study, performed the manual tissue processing, the formaldehyde assay, the DNA integrity number, and statistical analyses and wrote the article.
Funding
The author(s) disclosed receipt of the following financial support for the research, authorship, and/or publication of this article: The study was performed using internal funds of the Integrated Biobank of Luxembourg, provided by the Luxembourg Ministry of Higher Education and Research.
References
Supplementary Material
Please find the following supplemental material available below.
For Open Access articles published under a Creative Commons License, all supplemental material carries the same license as the article it is associated with.
For non-Open Access articles published, all supplemental material carries a non-exclusive license, and permission requests for re-use of supplemental material or any part of supplemental material shall be sent directly to the copyright owner as specified in the copyright notice associated with the article.