
Abstract
Neprilysin (NEP) is an endopeptidase known to modulate nervous, cardiovascular, and immune systems via inactivation of regulatory peptides. In addition, it may also contribute to impaired glucose homeostasis as observed in type 2 diabetes (T2D). Specifically, we and others have shown that NEP is upregulated under conditions associated with T2D, whereas NEP deficiency and/or inhibition improves glucose homeostasis via enhanced glucose tolerance, insulin sensitivity, and pancreatic β-cell function. Whether increased β-cell mass also occurs with lack of NEP activity is unknown. We sought to determine whether NEP deficiency confers beneficial effects on β- and α-cell mass in a mouse model of impaired glucose homeostasis. Wild-type and NEP−/− mice were fed low- or high-fat diet for 16 weeks, after which pancreatic β- and α-cell mass were assessed by immunostaining for insulin and glucagon, respectively. Following low-fat feeding, NEP−/− mice exhibited lower β- and α-cell mass compared with wild-type controls. A high-fat diet had no effect on these parameters in wild-type mice, but in NEP−/− mice, it resulted in the expansion of β-cell mass. Our findings support a role for NEP in modulating β-cell mass, making it an attractive T2D drug target that acts via multiple mechanisms to affect glucose homeostasis.
Neprilysin (NEP) is a ubiquitously expressed membrane-bound and circulating endopeptidase with broad substrate specificity. It plays a role in nervous, cardiovascular, and immune systems by inactivating regulatory peptides via cleavage on the N-terminal side of hydrophobic residues. 1 In addition, studies suggest NEP may contribute to impaired glucose homeostasis such as that observed in type 2 diabetes (T2D), where insulin resistance, pancreatic islet β-cell dysfunction, and decreased β-cell mass characterize the diabetic state. 2 Thus, NEP has gained interest as a target for therapeutic interventions in the treatment of T2D. In humans, NEP expression and activity are upregulated in T2D and associated conditions, including nutrient excess.3,4 We and others have shown that plasma NEP levels are similarly increased in high fat-fed obese mice, and are positively correlated with insulin resistance and reduced β-cell function.3,5 Furthermore, NEP deficiency and/or inhibition is associated with improved glucose tolerance, enhanced insulin sensitivity, and protection against impaired β-cell function.5 –9 Given that NEP degrades and inactivates the insulinotropic hormone glucagon-like peptide-1 (GLP-1),10 –12 some of the beneficial effects of NEP ablation on glucose homeostasis may be explained by elevated active GLP-1 levels. Indeed, pharmacological inhibition of NEP in humans, 13 as well as genetic ablation of NEP in high fat-fed mice, 5 results in higher circulating levels of GLP-1.
While increased NEP activity is associated with insulin resistance and pancreatic β-cell dysfunction, its impact on β-cell mass is unknown. In obesity without frank diabetes, β-cell mass expansion occurs to meet increased demand for insulin to maintain normal glucose homeostasis.14,15 However, once progressive decline of glycemic control occurs as in T2D, β-cell mass declines, in part due to β-cell apoptosis.14,16 –19 As NEP deficiency and/or inhibition has been shown to improve glucose homeostasis via several mechanisms, it may also act to enhance β-cell mass. In this study, we investigated whether NEP deficiency increased pancreatic islet cell mass in the setting of increased dietary fat. Wild-type and NEP−/− mice were fed low- or high-fat diet for 16 weeks, after which immunohistochemistry was performed on pancreas sections to assess insulin and glucagon positivity representing β- and α-cell mass, respectively.
Material and Methods
Animals and Diets
Ten-week-old C57BL/6.NEP−/− (denoted NEP−/−; originally from Dr. Lu, Harvard Medical School, USA) and control C57BL/6.NEP+/+ (denoted NEP+/+) male mice from our colony at VA Puget Sound Health Care System (VAPSHCS) were fed diets containing either 10% or 60% kcal fat (Research Diets, Inc; New Brunswick, NJ) for 16 weeks. Glucose tolerance and β-cell function in these study mice have been previously described. 5 Studies were approved by the VAPSHCS Institutional Animal Care and Use Committee.
Body Weight, Glucose, and Insulin Measures
Baseline body weight was measured in all mice prior to initiation of low- or high-fat feeding and then after 16 weeks. Lateral saphenous vein blood was collected from fed mice at baseline and after 16 weeks of feeding for plasma glucose measures, and from overnight fasted mice after 16 weeks of feeding for fasted plasma glucose and insulin measures. Plasma glucose was determined using the glucose oxidase method. Plasma insulin was determined using the Mouse Ultrasensitive Insulin ELISA from Alpco (Salem, NH).
Preparation of Pancreata for Histology
Pancreata were excised, weighed, fixed in 10% neutral-buffered formalin overnight, paraffin-embedded, and sectioned at 4-μm thickness. Three sections of each pancreas, sampled from different regions, were deparaffinized and incubated with anti-insulin antibody (1:50, A0564; Dako, Carpinteria, CA) to visualize β cells and anti-glucagon antibody (1:2000, G2654, clone K79bB10; Sigma-Aldrich, St. Louis, MO) to visualize α cells. Sections were subsequently incubated with Cy3 and Alexa Fluor 488–conjugated anti-IgG antibodies (anti-guinea pig and anti-mouse, respectively), and counterstained with Hoechst 33258 (2 μg/ml) to visualize nuclei. Consecutive pancreas sections were stained with hematoxylin and eosin for computation of section area.
Histological Assessments
The data collector was blinded to the genotype and diet status of each specimen. Morphometric analyses were performed using NIS Elements AR 4.30.02 software on Nikon E800 and TiE microscope systems (Nikon USA, Melville, NY). Histological assessments were made for all islets visible on each of the three immunolabeled pancreas sections, averaging 61 islets per mouse. To obtain islet area, islets were identified morphologically and the edges were manually circumscribed using a multichannel image. Insulin-, glucagon-, and Hoechst-positive areas were determined for each islet using pixel thresholding. Pancreatic section areas were obtained by large area imaging at 10× magnification. From these data, the following measures were calculated: β-cell and α-cell areas are expressed relative to islet area (Σ insulin or glucagon area/Σ islet area × 100), and β-cell and α-cell mass were computed (β-cell area / pancreas area × pancreas weight and α-cell area / pancreas area × pancreas weight, respectively). The average number of cells per islet and average cell size were computed from Hoechst data as we have done previously. 15
Statistical Analyses
Data are presented as mean ± standard error of the mean (SEM) for the number of mice indicated. Statistical significance was determined using ANOVA with post hoc analysis or the Mann–Whitney U test for data that were not normally distributed. Linear regression analysis was performed using Spearman’s correlation. A p<0.05 was considered statistically significant.
Results
Body Weight, Glucose, and Insulin Levels
Body weight and fed glucose levels were measured at baseline (week 0) and at the end (week 16) of the study. There were no significant differences in body weight or fed glucose levels between groups at week 0 (Table 1). At week 16, high fat-fed mice had increased body weight, regardless of genotype (Table 1). Furthermore, fed glucose levels were elevated in high fat-fed NEP+/+ mice. In contrast, fed glucose levels did not differ between NEP−/− mice fed low- or high-fat diet for 16 weeks, consistent with a protective effect of NEP deficiency on glycemia in a high-fat setting.
Body Weight, Fasting and Fed Plasma Glucose, and Fasting Plasma Insulin Levels.
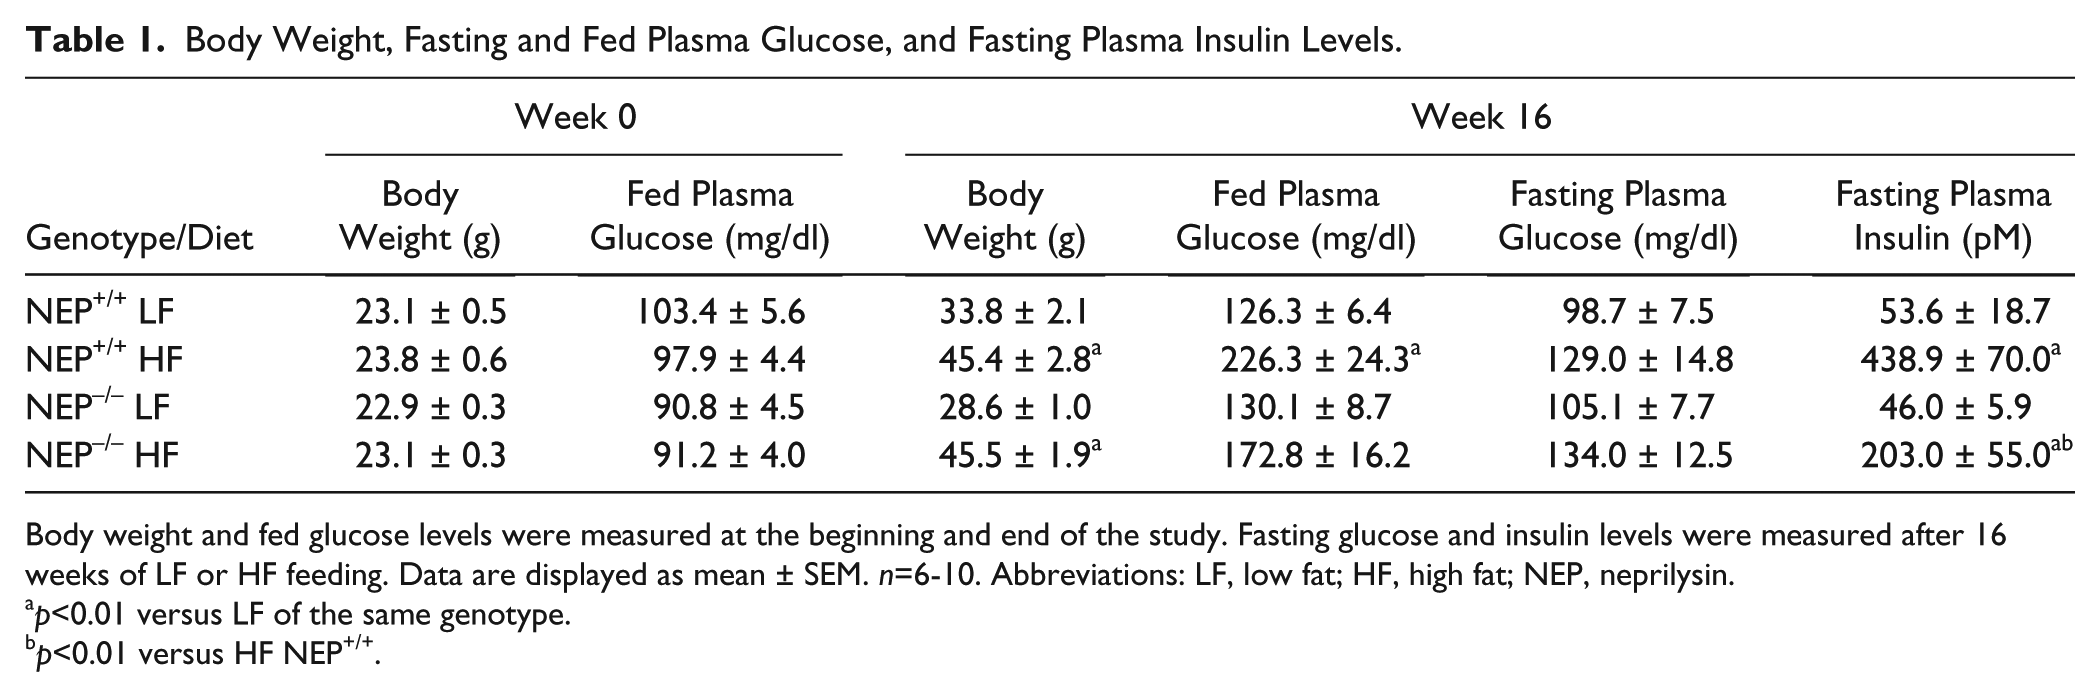
Body weight and fed glucose levels were measured at the beginning and end of the study. Fasting glucose and insulin levels were measured after 16 weeks of LF or HF feeding. Data are displayed as mean ± SEM. n=6-10. Abbreviations: LF, low fat; HF, high fat; NEP, neprilysin.
p<0.01 versus LF of the same genotype.
p<0.01 versus HF NEP+/+.
After 16 weeks of low- or high-fat feeding, fasting glucose levels were not significantly different between groups. However, fasting insulin levels were elevated in high fat-fed NEP+/+ and NEP−/− mice, versus low fat-fed mice, yet levels were lower in high fat-fed NEP−/− versus NEP+/+ mice (Table 1).
Pancreas Weight and Islet Characteristics
Pancreata were weighed at the end of the study, and islet area, number of cells per islet, and islet cell size were quantified. Under low-fat conditions, NEP+/+ and NEP−/− mice had similar pancreas weight (Fig. 1A). However, low fat-fed NEP−/− mice exhibited a trend toward decreased islet area (p=0.06), contributed to by a decrease in islet cell size (Fig. 1B and C). High-fat feeding resulted in increased pancreas weight in both genotypes (Fig. 1A). However, high fat-fed NEP+/+ mice did not exhibit increased islet area, cell size, or number of cells per islet compared with low fat-fed NEP+/+ mice (Fig. 1B–D). In contrast, high fat-fed NEP−/− mice exhibited greater islet area compared with low fat-fed NEP−/− mice due to an increase in cell number per islet and islet cell size (Fig. 1B–D).
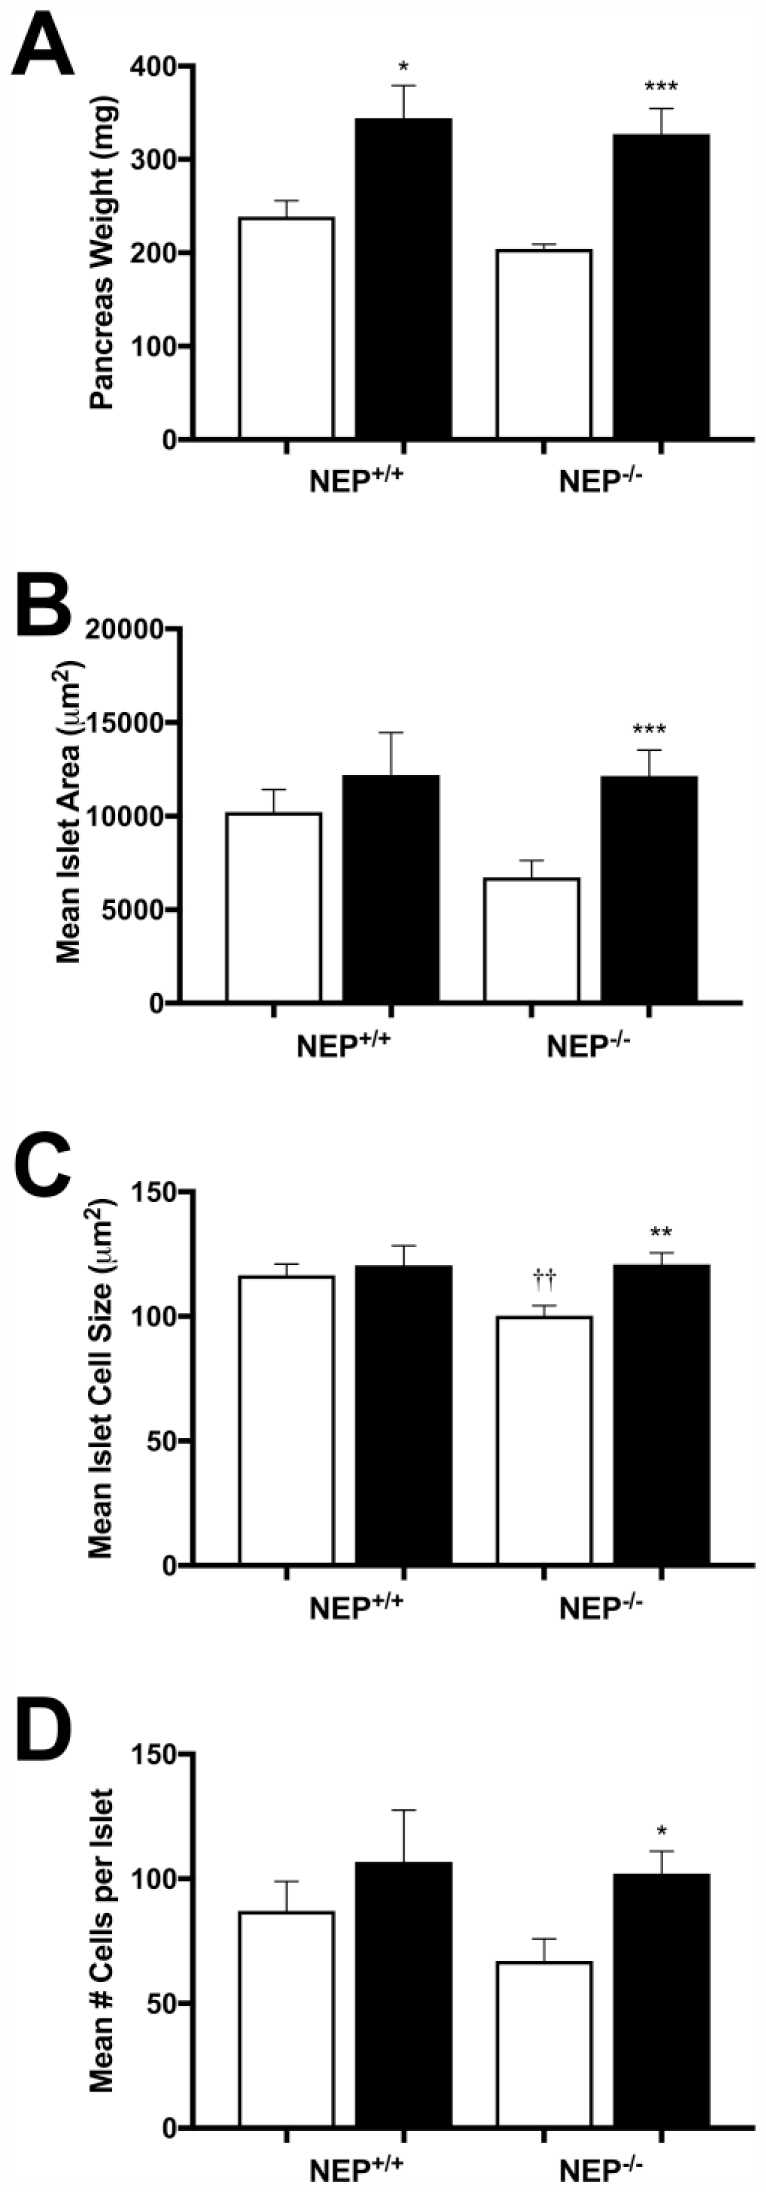
(A) Pancreas weight, (B) mean islet area, (C) mean islet cell size, and (D) mean number of cells per islet in NEP+/+ and NEP−/− mice fed low- or high-fat diet for 16 weeks. n=7-10. White bars, low fat; black bars, high fat. *p<0.01, **p<0.001, ***p<0.0001 versus low fat; ††p<0.001 versus NEP+/+. Abbreviation: NEP, neprilysin.
β- and α-Cell Mass
Under low-fat conditions, NEP−/− mice exhibited lower β-cell (Fig. 2A) and α-cell (Fig. 2B) mass, compared with NEP+/+ mice. In NEP+/+ mice, high-fat feeding did not alter β-cell (Fig. 2A) or α-cell mass (Fig. 2B). However, in NEP−/− mice, high-fat feeding was associated with elevated β-cell (Fig. 2A) but not α-cell (Fig. 2B) mass, when compared with low fat-fed NEP−/− mice. Representative images of insulin and glucagon staining are shown in Fig. 2C.
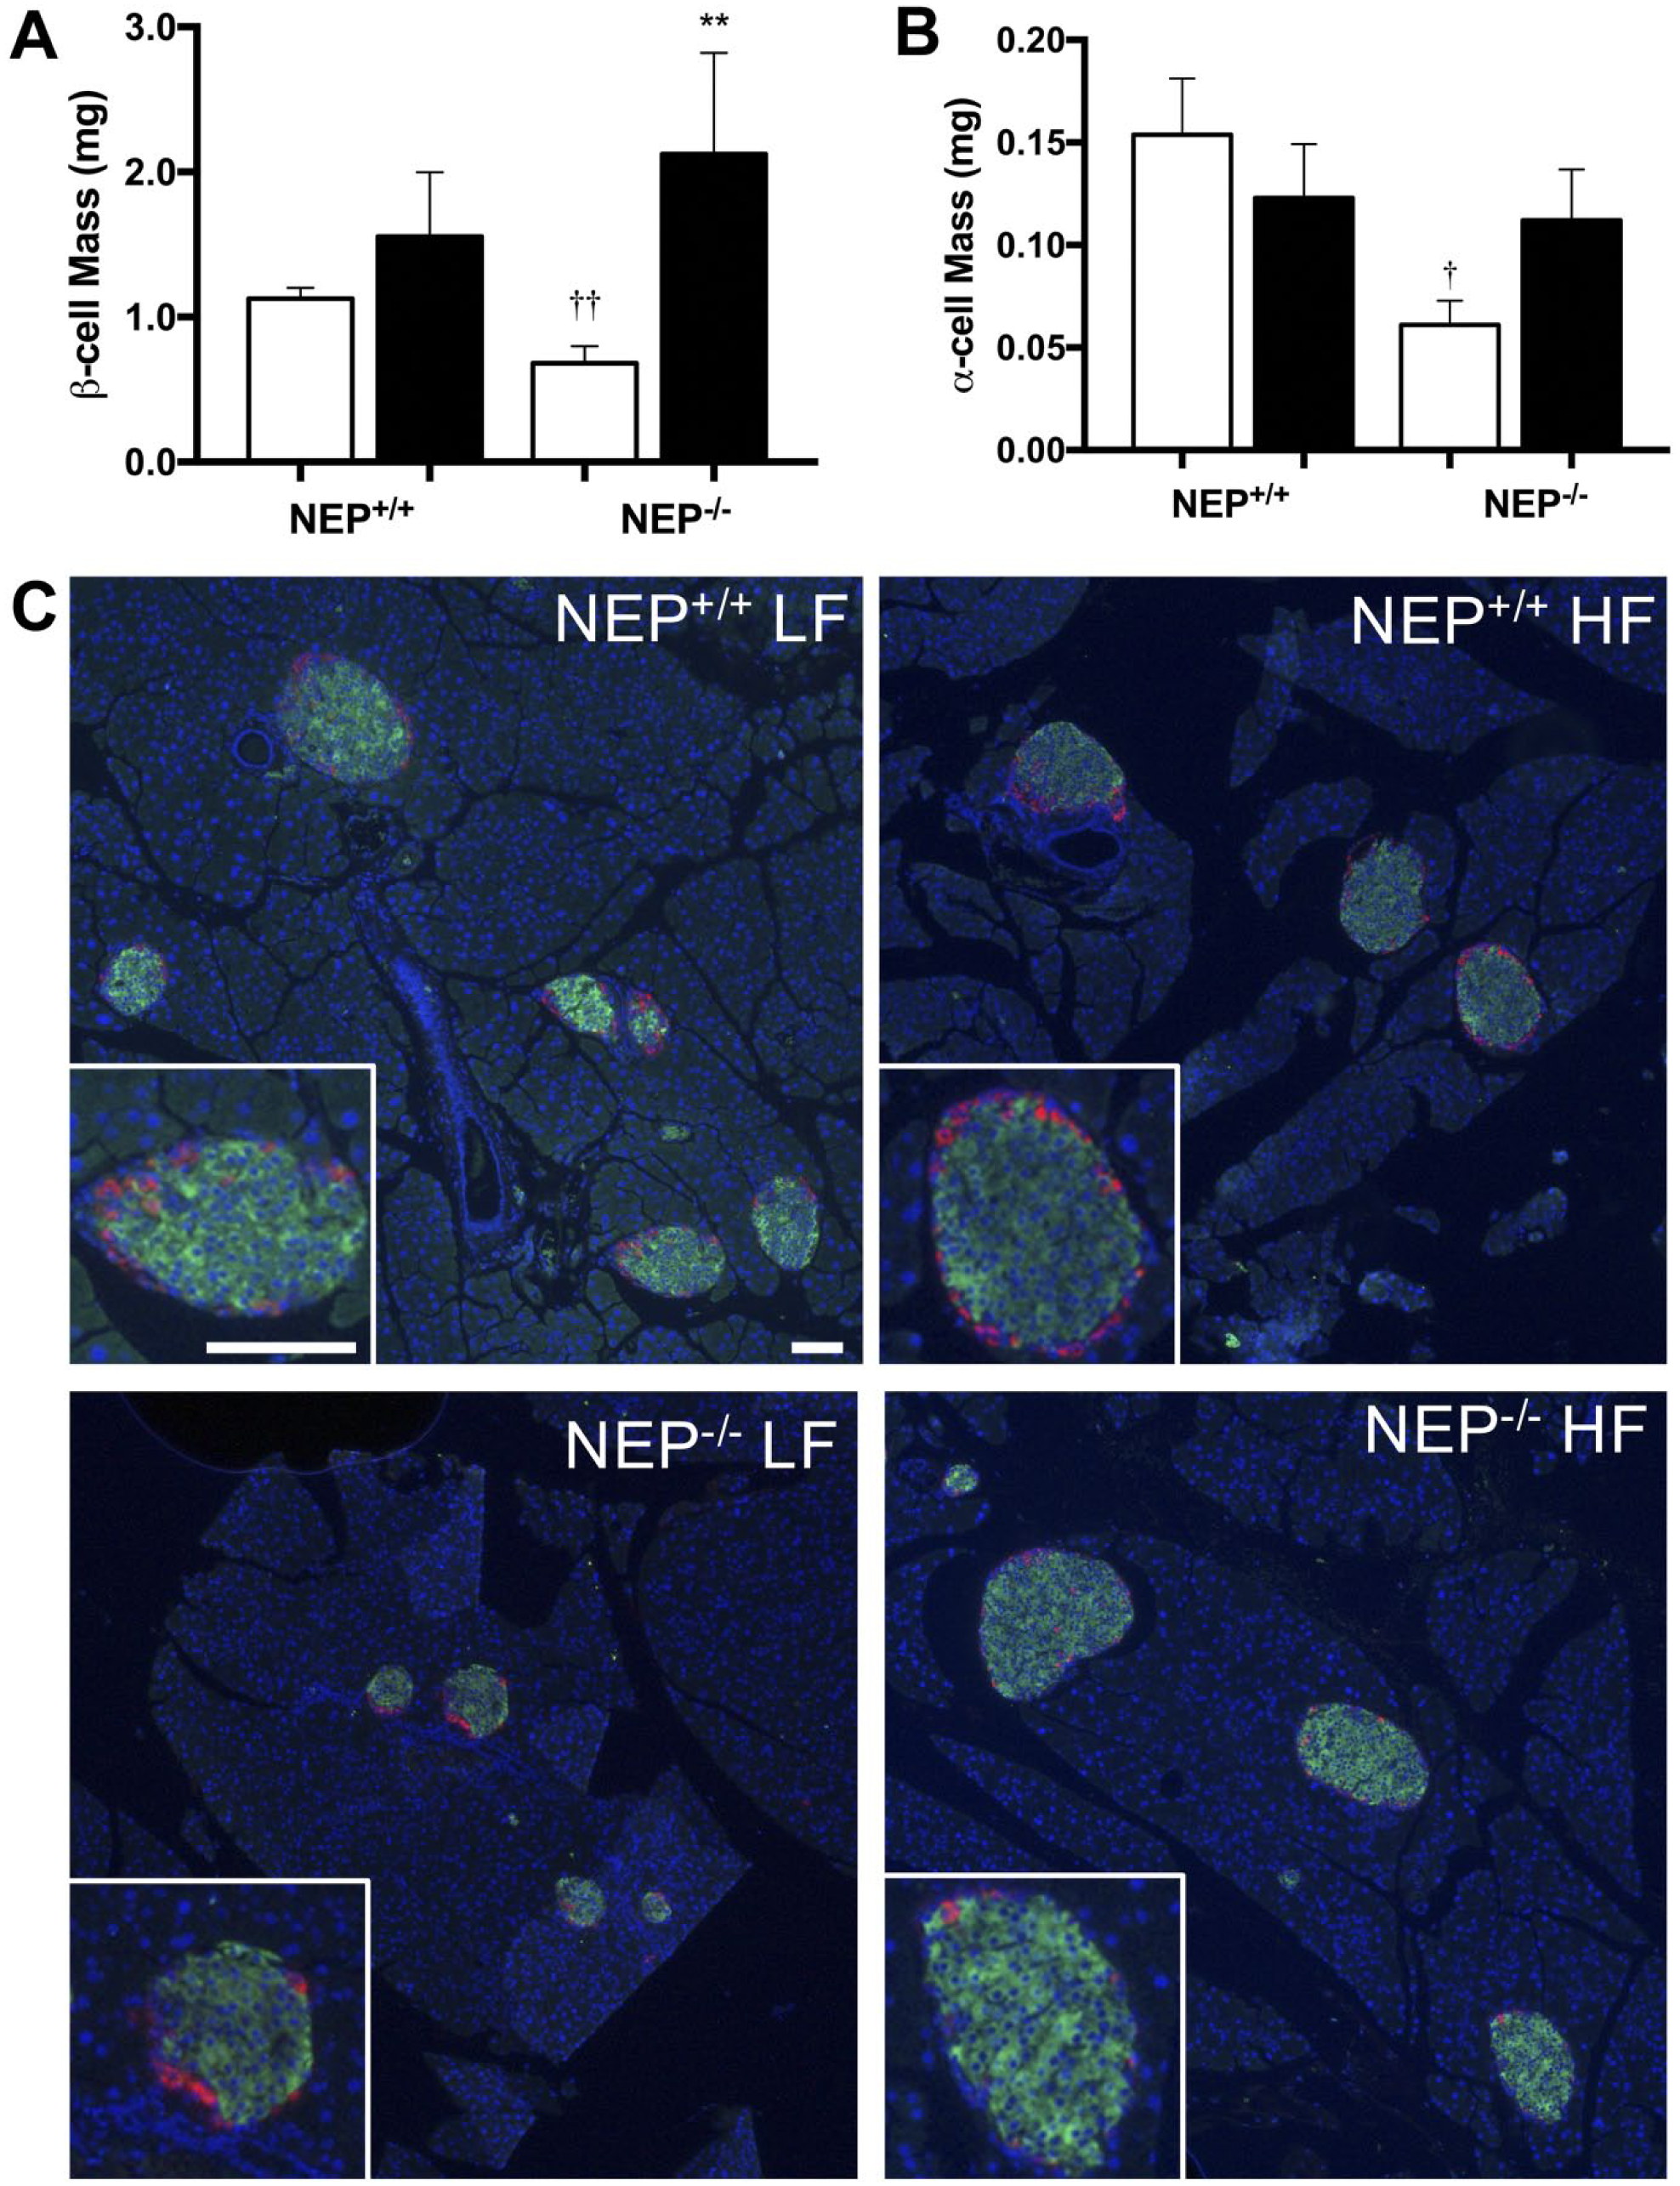
(A) β- and (B) α-cell mass in NEP+/+ and NEP−/− mice fed low- or high-fat diet for 16 weeks. n=6-10. White bars, low fat; black bars, high fat. (C) Representative images showing β-cell (insulin; green), α-cell (glucagon; red), and nuclei (blue) staining in pancreata from NEP+/+ and NEP−/− mice fed LF or HF diet; scale bars = 100 μm. **p<0.001 versus low fat; †p<0.01, ††p<0.001 versus NEP+/+. Abbreviations: NEP, neprilysin; LF, low fat; HF, high fat.
To determine whether there was a relationship between body weight gain and increased β-cell mass in high fat-fed NEP−/− mice, which would be suggestive of β-cell mass expansion to meet increased demand for insulin,14,15,17,19 we performed linear regression analysis and found a positive correlation between the two measures (r = 0.68, p≤0.05; Fig. 3). In high fat-fed NEP+/+ mice, there was no significant association between body weight gain and β-cell mass (r = 0.66, p=0.18; Fig. 3).
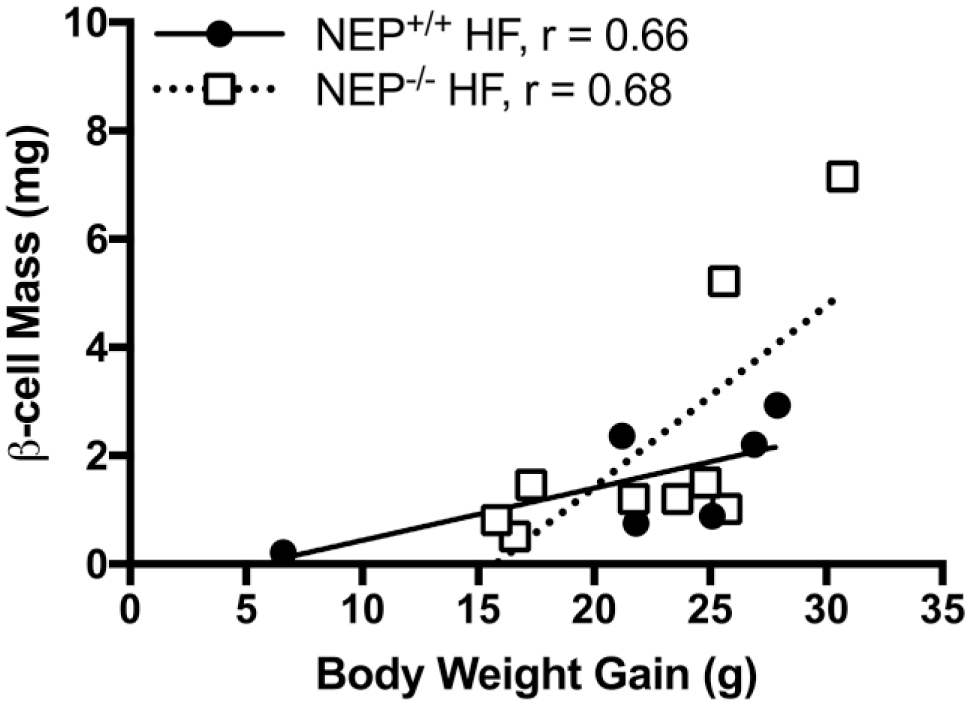
Correlation between body weight gain and β-cell mass for NEP+/+ and NEP−/− mice fed high-fat diet for 16 weeks. n=6-9. Abbreviations: NEP, neprilysin; HF, high fat.
Discussion
We show that in response to increased dietary fat, NEP−/− mice exhibit expansion of islet β-cell mass, whereas NEP+/+ mice do not. To our knowledge, this is the first report of NEP playing a role in modulating β-cell mass, and our findings are consistent with previous studies demonstrating beneficial effects of reduced NEP activity on factors regulating glucose homeostasis in conditions associated with T2D.5 –9
The high fat-fed C57BL/6J mouse model is characterized by β-cell compensation to insulin resistance, which gradually becomes insufficient to overcome elevated plasma glucose levels.20,21 This compensation arises, in part, due to the expansion of β-cell mass.14,15 In contrast to some15,22,23 but not all24,25 previous studies, we found no significant difference in β-cell mass between high fat- and low fat-fed NEP+/+ mice, and no change in islet cell size or number. Potential reasons for discrepant findings among studies may include differences in the background (sub)strain of mice, as well as variability in the fat content of diets and period of exposure to diets. Despite not detecting an increase in β-cell mass with high-fat feeding, NEP+/+ mice displayed marked fasting hyperinsulinemia, suggesting the predominant route of β-cell compensation upon consumption of increased dietary fat was via enhanced secretory function of existing β cells. Interestingly, high fat-fed NEP+/+ mice had increased pancreas weight compared with low fat-fed mice, possibly contributed to by fat infiltration within the pancreas or an increase in exocrine pancreatic mass. In keeping with these ideas, studies have shown that increased pancreas weight in C57BL/6J mice fed a high-fat diet was associated with increased ectopic fat accumulation 26 and upregulation of exocrine epithelial cell proliferation. 27
In NEP−/− mice, high-fat feeding was associated with increased β-cell mass, as well as greater islet cell size and number. The latter suggest both hypertrophy and hyperplasia may be mechanisms for the expansion of β-cell mass under conditions of NEP deficiency and elevated dietary fat. Furthermore, we found that body weight gain was positively correlated with β-cell mass in NEP−/− mice, implying that lack of NEP activity enables β-cell mass expansion in response to dietary fat–induced insulin resistance. No such relationship was observed in high fat-fed NEP+/+ mice. While both NEP+/+ and NEP−/− mice exhibited fasting hyperinsulinemia, insulin levels were lower in NEP−/− mice, likely related to enhanced insulin sensitivity as we showed previously. 5 However, unlike in NEP+/+ mice, hyperinsulinemia in NEP−/− mice was associated with normalization of fed glucose levels. Together, these findings support the notion that NEP deficiency has beneficial effects on both β-cell mass and function, creating an environment in which islets are better able to enhance glucose metabolism and compensate for the detrimental effects of increased dietary fat.
Signaling through the GLP-1 receptor is a well-known mechanism that promotes the expansion of β-cell mass.28 –33 This involves activation of pancreatic duodenal homeobox-1, which results in β-cell proliferation, differentiation, and survival.34,35 Recent studies support the idea that NEP deficiency leads to increased GLP-1 receptor signaling, which could plausibly contribute to the expansion of β-cell mass under high-fat conditions. Both pharmacological inhibition of NEP in humans and genetic ablation of NEP in high fat-fed mice result in higher circulating levels of GLP-1.5,13 Also, NEP ablation is associated with AKT activation in non-β-cells. 36 If the same were to occur in NEP-deficient β cells, it is possible that cell survival would be enhanced, as AKT activation has previously been shown to mediate such a process via GLP-1 receptor signaling. 28
Interestingly, under low-fat conditions, NEP−/− mice had lower β- and α-cell mass compared with wild-type mice. Potential modulators of islet cell mass are body weight, pancreas weight, insulin sensitivity, and active GLP-1 levels; however, none of these can explain the lower β- and α-cell mass in low fat-fed NEP−/− mice as we show here and previously 5 that these parameters did not differ between the two genotypes under low-fat conditions. It is likely that NEP plays a role in the physiological maintenance of islet cell mass and function, but the specific mechanism requires further investigation.
Our study describes a novel beneficial effect of reducing NEP activity in conditions associated with T2D, but also has limitations. First, we use a genetic knockout model with whole-body deletion of NEP. Thus, widespread and long-term loss of NEP activity results in an inability to cleave NEP substrates including, but not limited to, those that modulate islet cell mass. This complicates interpretation of our data, making it difficult to pinpoint molecular mechanisms unpinning the observed changes in β- and α-cell mass. Second, our study was performed in mice, so it remains unknown whether NEP may play a similar role in modulating islet cell mass in humans as it does in mice. A combination drug including the NEP inhibitor sacubitril is currently U.S. Food and Drug Administration (FDA)–approved for use in humans; thus, future preclinical and clinical studies with this drug could help address both limitations.
In summary, we found that NEP deficiency is associated with the expansion of β-cell mass in high fat-fed mice, thereby contributing to β-cell compensation to insulin resistance. However, regulation and modulation of β-cell mass is comprised of a complex web of signaling pathways complicated by various genetic and environmental factors. Our data add to evidence that NEP plays multiple roles in modulating glucose homeostasis, under both physiological and pathophysiological conditions. A better understanding of the mechanisms involved will be important in determining how NEP can be exploited as a pharmacological target in the treatment of T2D.
Footnotes
Acknowledgements
The authors thank Breanne Barrow, Phillip Bergquist, Daryl Hackney, Jessica Wilkins-Gutierrez, and Joshua Willard from Seattle Institute for Biomedical and Clinical Research, USA, for excellent technical support.
Competing Interests
The author(s) declared the following potential conflicts of interest with respect to the research, authorship, and/or publication of this article: S.Z. receives research support from Novartis Pharmaceuticals Corporation for preclinical studies.
Author Contributions
JHP performed experiments, analyzed data, and wrote the manuscript. RLH assisted with data analysis and edited the manuscript. SZ conceived and designed the study, analyzed data, and wrote the manuscript. All authors have read and approved the final manuscript. SZ is the guarantor of this work and as such had full access to all of the data in the study and takes responsibility for the integrity of the data and the accuracy of the data analysis.
Funding
The author(s) disclosed receipt of the following financial support for the research, authorship, and/or publication of this article: This work was supported by the National Institutes of Health grants DK-098506 and DK-080945 to S.Z., P30 DK-017047 (University of Washington Diabetes Research Center, Cellular and Molecular Imaging and Cell Function Analysis Cores), and the U.S. Department of Veterans Affairs.