
Abstract
High-fat diet (HFD) alters the glycosylation patterns of intestinal mucins leading to several health problems. We studied by histochemical and lectin-binding methods mucin alterations in the duodenum of mice fed a HFD for 25 weeks. Histochemical methods included periodic acid–Schiff, alcian blue pH 2.5, and high-iron diamine. Lectin-binding experiments were performed with SBA, PNA, WGA, MAA-II, SNA, ConA, UEA-I, LTA, and AAA. SBA, PNA, WGA, MAA-II, and SNA were tested also after desulfation and ConA after periodate-sodium borohydrate treatments (paradoxical ConA). Duodenal mucins are secreted by Brunner’s glands and goblet cells in the villi. Brunner’s glands of HFD mice showed increased secreting activity and a general reduction of glycosylated residuals, such as fucose and terminal α1,4-linked GlcNAc. Moreover, a general reduction of glycosylated residuals in the goblet cells of villi such as the fucosylated and sulfated ones was observed. Since the cited residuals are involved in cytoprotective and cytostatic functions, as well as in interactions with the intestinal microbiota and protection against parasites and inflammatory disorders, we conclude that HFD can predispose duodenum to several possible health disorders.
Introduction
The luminal surface of the intestinal tract is covered with glycan structures, forming both the glycocalyx of the epithelial cells and the outer secreted mucus layer. 1 Most of them are in form of mucins, that is, heavily glycosylated proteins with the capability of retaining water and forming gels. The major intestinal secreted mucin is expressed by MUC2 in humans and by its homologous Muc2 in rodents. 2 This mucin presents several O-linked saccharidic chains, often sialylated and/or sulfated. The chains are attached to the central part of the backbone protein. In this region, two PTS domains are found, rich in proline, serine, or threonine. 3 Intestinal mucins are involved in several functions, such as protection, lubrication, modulation of absorption, interactions with the microbiota, immunoregulation, coordination of cell proliferation, differentiation, and apoptosis.1,3–5 In the colon, the secreted mucus barrier forms two layers, that is, an outer one colonized by the microbiota and an inner one adherent to the epithelium acting as a barrier against microorganisms. 2 In the small intestine, there is only a single layer and its function is still poorly understood, being probably involved in trapping antibiotic substances secreted by the epithelium to contrast bacteria penetration. 6
Mucin amount and composition are known to vary to adapt to physiological and pathological conditions.2, 6–10 Altered glycosylation is in turn linked to inflammatory disease states, cancer/tumorigenesis, and increase of susceptibility to pathogens,10–12 so that the detection of altered glycans has been proposed as a tool in early diagnosis, disease monitoring, and prognosis.13–15 Diet can alter the intestinal glycome as well, 16 as in the case of high-fat diet (HFD), typical to Western-style eating habits. This is one of the most studied diets, predisposing to health problems, such as obesity, insulin resistance, type 2 diabetes, dyslipidemia, steatosis, and steatohepatitis.17–19 Alteration of gut microbiota and intestinal glycosylation have also been observed consequent to HFD.20,21 In rats, HFD in dams can even affect intestine glycosylation in suckling pups, resulting in a decrease of fucosylation in the brush border of enterocytes. 22 HFD does not affect the glycan composition of the brush border of adult mice, 23 whereas an increase in the sialo/sulfomucins ratio and an over-expression of both Galβ1,3GalNAc and GalNAc terminal residues was observed in the colonic mucins. 21 In the duodenum, loss of O-glycans in Double Knockout mice predispose to spontaneous tumorigenesis, 6 whereas HFD promotes tumor progression with oncogenic Kras mutations and downregulation of mucin synthesis. 24
Apart from Muc2 mucins produced by the goblet cells, the secreted mucus also contains mucins from the Brunner’s glands. These are encoded by the MUC6/Muc6 gene 25 and differ from the MUC2/Muc2 in lacking acidic residuals and having more complex patterns of glycosylation.26–28 Besides, MUC6/Muc6 is rich in terminal α1,4-linked GlcNAc, which acts both as natural antibiotic and as tumor suppressor for differentiated-type adenocarcinoma. 29 Similar to MUC2/Muc2, glycosylation of MUC6/Muc6 can be altered by diet or pathological conditions.30,31
Following our previous study with mice on the effects of HFD on the glycosylation of colonic mucins, 21 in the present work we use a histochemical approach to investigate the effects of the fat diet on the mucins secreted by the duodenum. In particular, we evaluate whether HFD alters the glycosylation of Muc6 and Muc2 mucin as seen for colonic Muc2.
Materials and Methods
Animals
Four-week-old C57BL/6J male mice were purchased from Charles River, Calco, Italy. All mice were housed in air-conditioned room with 12/12 hr dark-light cycle and allowed free access to diet and water ad libitum. To evaluate the effect of HFD on the composition of the duodenal mucins, samples of duodenal mucosa were obtained from 12 mice subdivided into two groups (n=6 in each group): control group (CTRL) were fed a standard chow diet consisting of 4% fat, 19% proteins, 6% fibers, and 12% water (10% calories from fat), and HFD group (HFD) receiving a diet composed of 42% fat, 21.6% proteins, 3% fibers, and 4% water (55% calories from fat). Both diets were purchased from Altromin-Rieper (Vandoies, Italy). The body mass was measured, and all the animals were killed by cervical dislocation (following an overnight fasting) after 25 weeks of diet. Subsequently, duodenum and liver were rapidly removed. Liver samples were used as reference to ascertain the effects of HFD by evaluating weight of the whole organ and lipid storage in hepatocytes while the samples of duodenum were processed for histochemistry. All the studies were approved by the animal care and use Committee of the University of Bari (OPBA di Ateneo) and the Italian Ministry of Health (authorization n. 326/2018-PR).
Section Preparation
Two duodenal samples were collected from each animal, and immediately fixed in 10% neutral buffered formalin, dehydrated in a graded series of ethanol and then embedded in paraffin wax as detailed elsewhere. 32 Sections were serially cut at 5 μm.
Liver samples were fixed in 4% glutaraldehyde in TBS 0.1 M, pH 7.4, and after an overnight wash in the same buffer, were post-fixed with 1% osmium tetroxide in TBS for 2 hr at 4C. Osmium tetroxide also stained in gray lipid droplets. Fixed specimens were processed for embedding in Epoxy Resin-Araldite (M) CY212 (TAAB, Aldermaston, England) as previously reported. 33 Semithin sections were serially cut into 2-μm-thick sections and observed without staining to assess lipid droplet stores and the extent of steatosis.
Classic Histochemical Staining
Samples of duodenum were stained with periodic acid-Schiff (PAS), alcian blue (AB) at pH 2.5, and high-iron diamine (HID) to demonstrate carbohydrates with 1,2 glycols, acidic residuals (both sialylated and sulfated), and sulfated residuals, respectively. Counterstaining with Mayer’s hematoxylin (HE) was performed. Protocol details were given elsewhere. 34 All the reactives cited in this section were from Sigma-Aldrich (St. Louis, MO).
Fluorescent Lectin Binding
A panel of 9 FITC-labeled lectins (SBA, PNA, MAA-II, SNA, WGA, ConA, UEA-I, LTA, and AAA) was selected among the most commonly used to detect the main residuals in the oligosaccharidic chains of mucins. Details for the lectins employed, their concentrations, their sugar specificities, and the abbreviations used for glucidic residues are summarized in Table 1. All lectins were from Vector Laboratories (Burlingame, CA). Lectin protocols followed dealer’s indications with minor modifications reported elsewhere. 35 Sections of duodenum underwent incubation for 1 hr at room temperature with the lectin solution in HEPES. After rinsing in the same buffer, they were mounted in Fluoromount for observation. Controls for lectin labeling included (1) substitution of each lectin with HEPES alone, (2) incubation with lectin added to an inhibitory sugar (types and concentrations given in Table 1, and (3) binding to samples from other sources presenting mucins that were previously demonstrated to be labeled by lectins tested in this paper, that is, the secreting epithelia of colon of mouse and the egg extra-cellular matrix of the toad Bufo bufo.36,37 The binding of WGA, SBA, and PNA lectins was also tested with a desulfation pre-treatment by a sequence of methylation-saponification. 29 Stable class-III mucins 38 were detected by the paradoxical ConA binding staining (PCS), consisting in a sequence of 1% periodate and 0.2% sodium borohydrate in 1% sodium biphosphate treatments before ConA labeling. 39 Except for lectins, all the reactives cited in this section were from Sigma-Aldrich.
Lectins Used and Their Carbohydrate Specificities.
Abbreviations: GalNac, N-acetylgalactosamine; Gal, galactose; GlcNac, N-acetylglucosamine; TACT, N, N,’ N”-triacetylchitotriose; Neu5Ac, N-acetylneuraminic acid; Man, mannose; Glc, glucose; MαM, methyl-α-mannopyranoside; Fuc, fucose.
Image Processing for Classic Histochemical Staining
Photographic documentation was shot in bright light by an Eclipse E600 photomicroscope equipped with a DMX1200 digital camera (Nikon Instruments SpA, Calenzano, Italy) under the same conditions for all the stains, tracts, and samples. One to three photos per individual were taken at 400x with a resolution of 150 dpi.
Brunner’s glands sizes were compared between CTRL and HFD groups by recording the transverse diameters of both glands and related lumina chosen among those having the best orientation. Ten glands per individual were selected, for a total of 60 glands per group.
An analysis of the variation of the intensity of each stain between CTRL and HFD groups was performed for both Brunner’s glands and duodenal goblet cells. For Brunner’s glandular cells, up to five sample areas of 900 µm2 in each photo were selected. For the goblet cells, 10 cells with the best orientation were selected in each photo. The staining intensities were estimated by computing integrated optical density (OD) values from RGB photographs processed by the color deconvolution method. 40 Color channels relative to the stain, the counterstain, and the background were separated. Stain vectors were created from single-stain slides without counterstaining. 41 Single cell ODs were then computed from mean intensities in each stain channel. 42 Staining of the enterocyte glycocalyx was also recorded, but its intensity was not measured. Analyses were performed by the Image J package 43 implemented with the color deconvolution plugin. 41
Image Processing for Fluorescent Lectin Binding
Photographic documentation was shot in epifluorescence under 495 nm light by the same photomicroscope device as previous with sensibility set to 4.’ An analysis of the variation of the intensity of each lectin-binding between CTRL and HFD groups was performed for both Brunner’s glands and duodenal goblet cells. One to three photos per individual were taken at 200x with a resolution of 150 dpi. For the image analysis of Brunner’s glands, up to five sample areas of 2500 µm2 in each photo were selected. For the analysis of goblet cells, 10 cells with the best orientation were selected in each photo. The lectin-binding intensities were estimated by computing for each area or cell the corrected total cell fluorescence (CTFC). 44 In order to avoid computing and representing too large CTFC values, all data were divided by 107. Analyses were performed by the Image J package. 43 Additionally, lectin binding to the enterocyte glycocalyx was recorded, but its intensity was not evaluated because it was difficult to measure such a relatively thin and somewhat discontinuous structure with our methods.
Statistical Analysis
For the comparison of Brunner’s glands size between CTRL and HFD, the most common descriptive statistics (mean, standard deviation, median, kurtosis, and skewness) were computed from both glands and lumina transverse diameters. 45 Significant deviation from normality of distribution of data was estimated by Shapiro-Wilk tests from skewness and kurtosis values. Significant variation of the cited measures between CTRL and HFD groups was estimated by both parametric Student’s t-test and non-parametric Mann-Whitney’s U test.
For the analysis of the variation of the intensity of each histochemical stain or lectin-binding between CTRL and HFD groups in both Brunner’s glands and duodenal goblet cells, mean OD or CTFC values were compared between CTRL and HFD by both Student’s t-test and Mann-Whitney’s U tests as previous. Statistical computations for the aforementioned analyses were generated by an Excel plugin, the Real Statistics Resource Pack software (Release 6.2). 46
Results
Classic Histochemical Staining
Liver
The liver of CTRL mice presented hepatocytes with few lipid microvesicles (Fig. 1A), whereas in the HFD group, it showed hepatocytes with several micro- and macrovesicles, indicating severe steatosis (Fig. 1B).
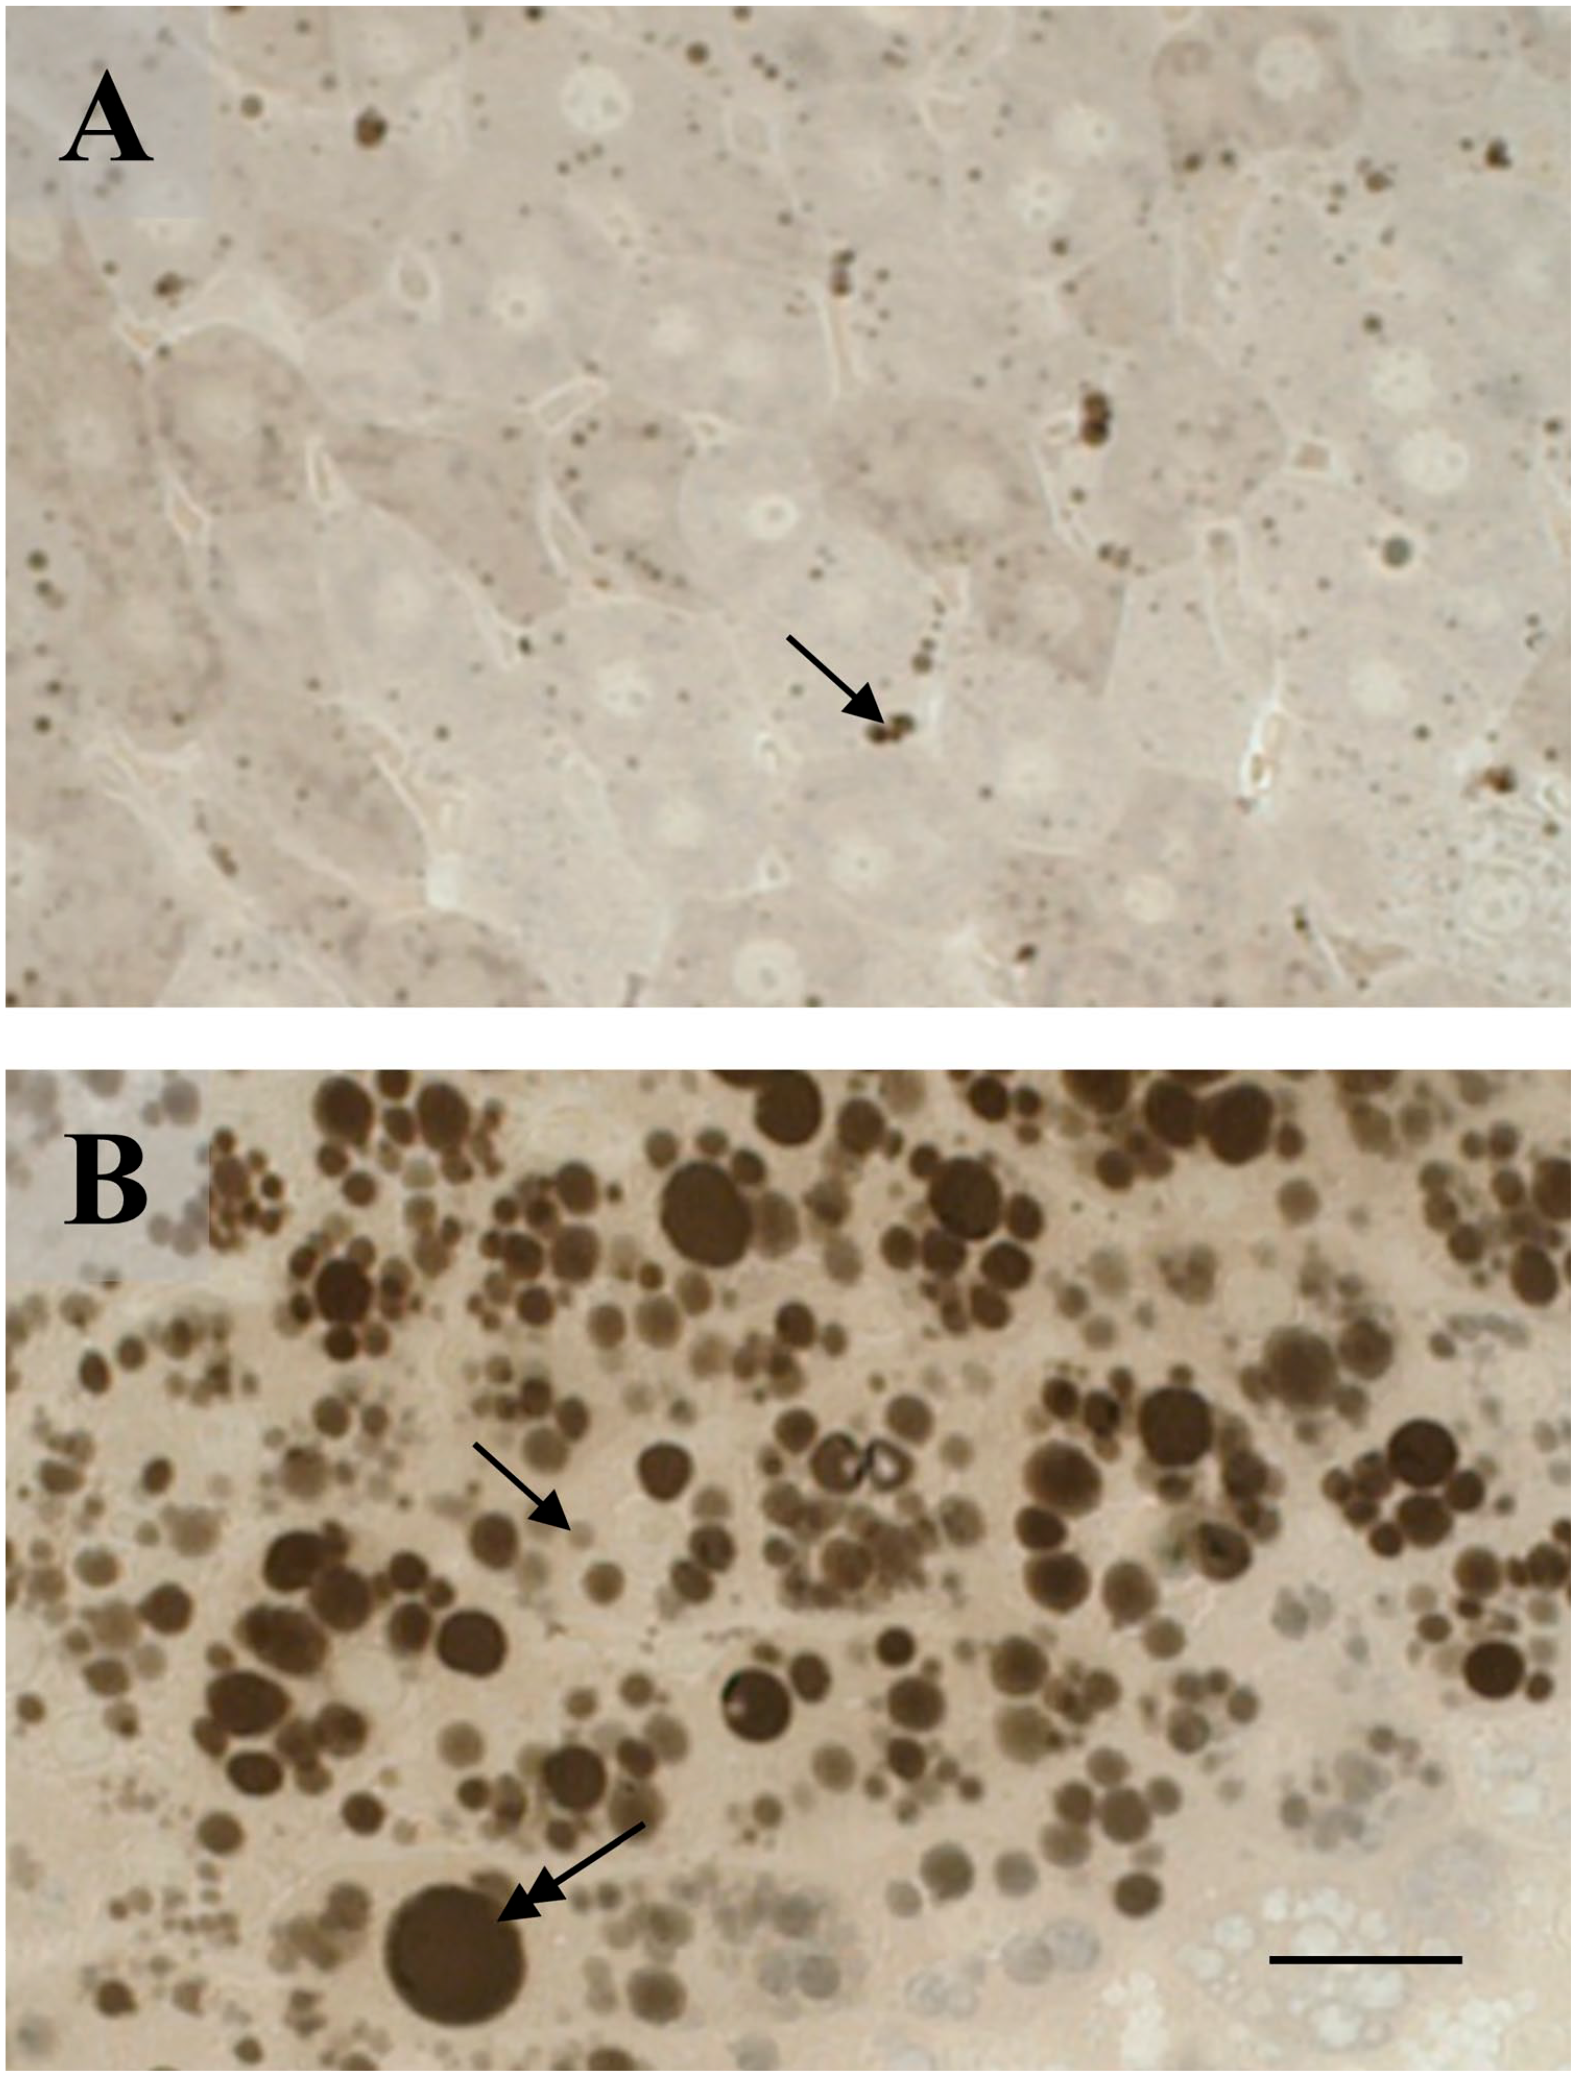
Fat accumulation in the livers of control and high-fat diet (HFD) fed mice. Few microvesicles (arrow) are seen in the control liver (A) whereas the HFD liver (B) shows a number of microvesicles (arrow) together with macrovesicles (double headed arrow). (A, B) Osmium tetroxide post-fixation. Scale bar=25 µm.
Brunner’s Glands
The transverse diameters of Brunner’s glands did not differ between CTRL and HFD, whereas the diameters of the lumina were significantly higher in the latter (Fig. 2A and B), as indicated by the statistical tests (resumed in Table 2). Brunner’s gland cells were intensely and uniformly positive to PAS (Fig. 2A), whereas in HFD, the stain was weaker and concentrated in the subapical area of cells (Fig. 2B). OD values of PAS in HFD resulted significantly lower than CTRL with both Student’s t and Mann-Whitney’s U tests (Table 3). Brunner’s glands resulted always negative for both AB pH 2.5 and HID stains (Fig. 2C to F).
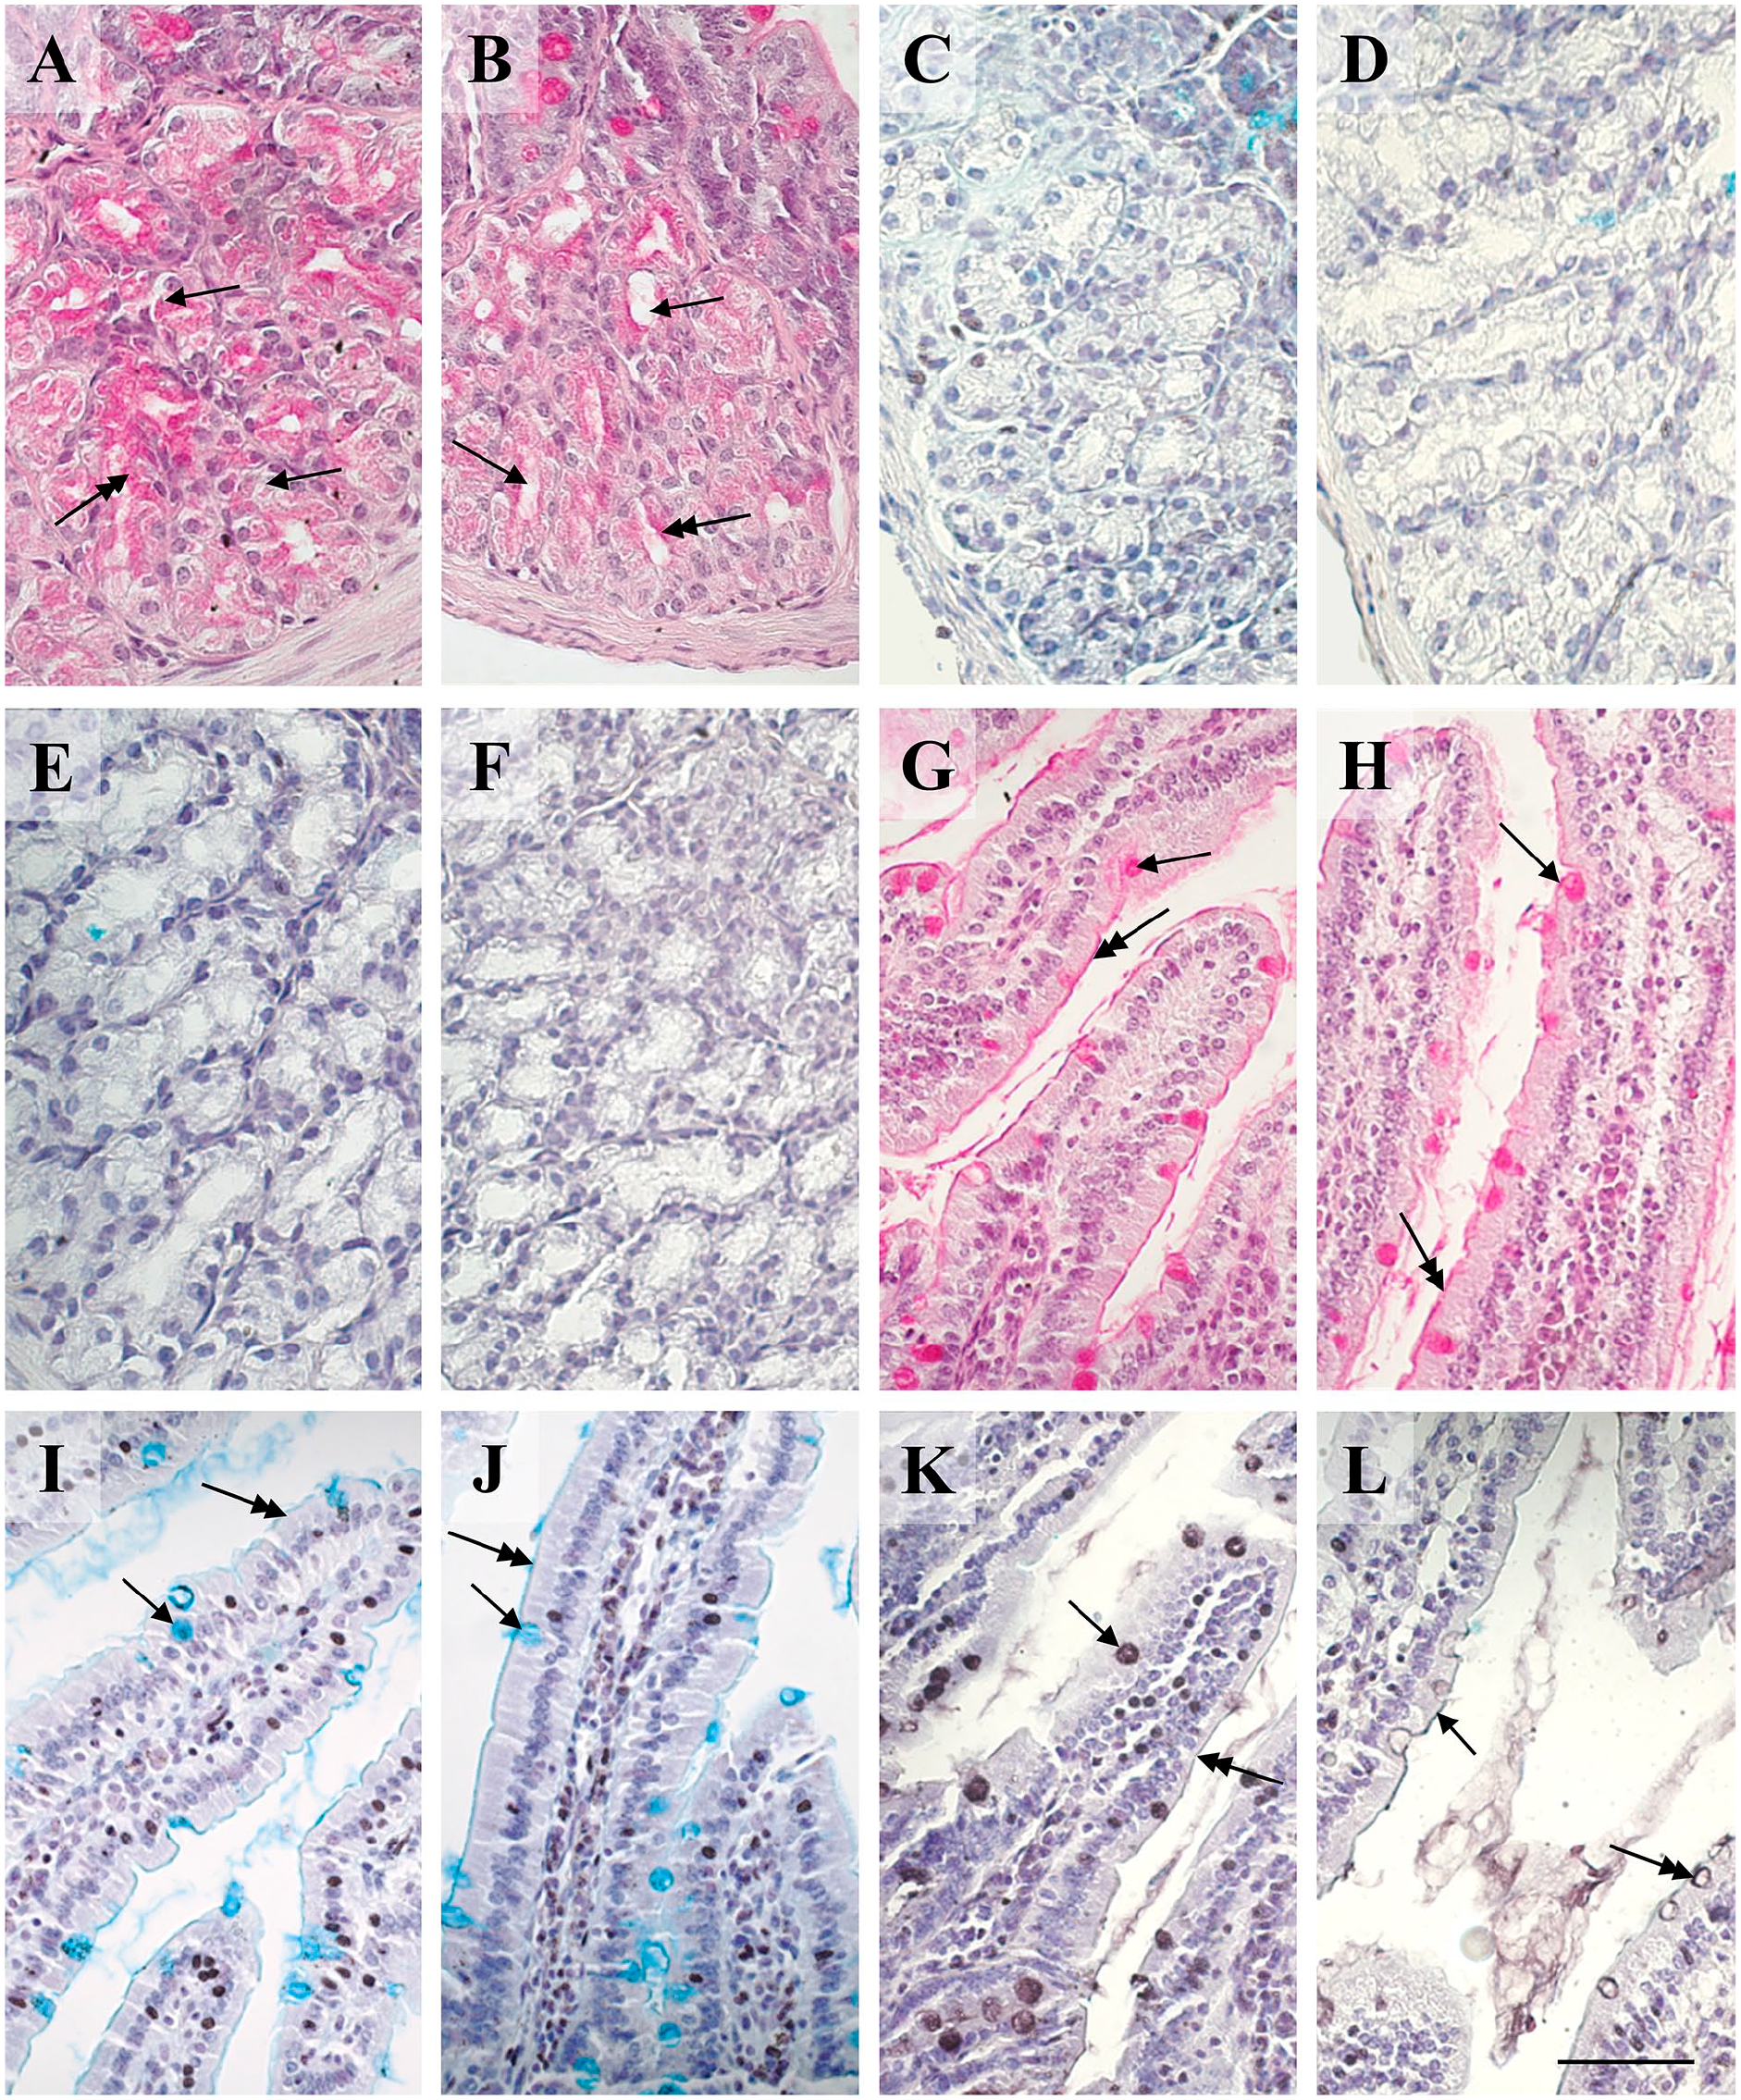
Histochemistry of Brunner’s glands and villi of control and HFD mice. (A) Brunner’s glands in the control specimen show smaller lumina (arrows) and secretion (double headed arrow) is intensely stained by PAS for carbohydrates and distributed rather uniformly. (B) In respect to control, Brunner’s glands in the HFD condition present larger lumina (arrows) and the PAS-positivity of the secretion is weaker (double headed arrow), concentrated in the subapical area of cells. (C–F) Brunner’s glands in both control (C, E) and HFD (D, F) are negative to AB pH 2.5 (C, D) and HID (E, F) stains for acidic residuals. (G, H) Villi present goblet cells (arrows) and glycocalyx (double headed arrows) positive to PAS stain without difference of intensity between control (G) and HFD (H). (I, J) Villi present goblet cells (arrows) and glycocalyx (double headed arrows) positive to AB pH 2.5 stain for acidic residuals with no apparent difference of intensity between control (I) and HFD (J). (K, L) Villi present goblet cells (arrows) and glycocalyx (double headed arrows) positive to HID stain for sulfated glycans that is more intense in control (K) than in HFD (L). (A, B, G, H) PAS-hematoxylin. (C, D, I, J) Alcian blue pH 2.5-hematoxylin. (E, F, K, L) HID-hematoxylin. Scale bar=50 µm. Abbreviations: HFD, high-fat diet; PAS, periodic acid-Schiff; HID, high iron diamine; AB, alcian blue.
Statistical Comparisons of Diameters (in µm) of Brunner’s Glands and Related Lumina Between Controls (CTRL) and High-fat Diet (HFD) Fed Groups.
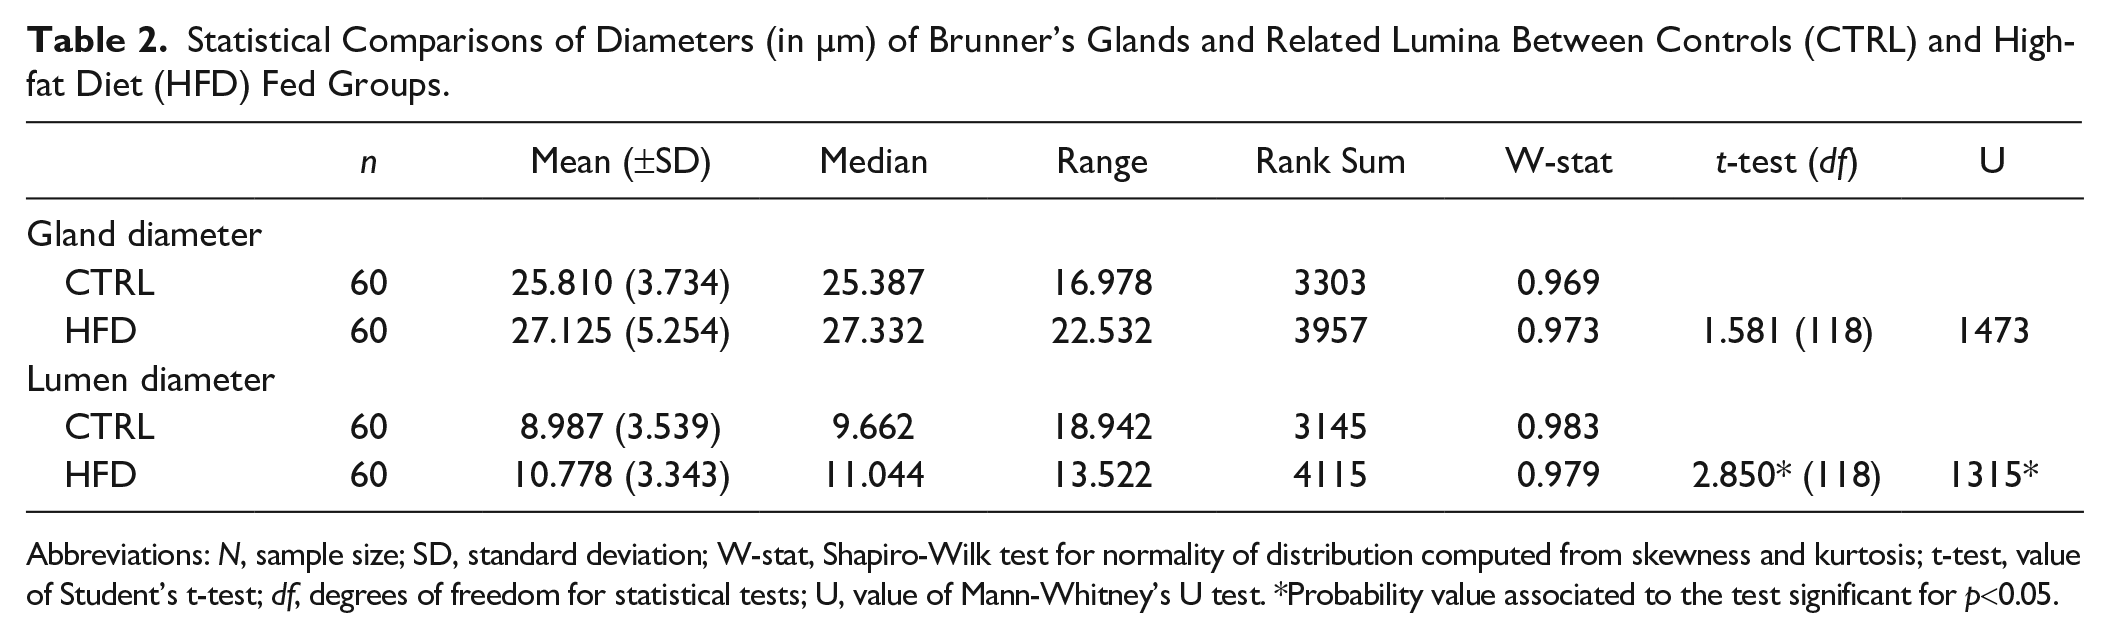
Abbreviations: N, sample size; SD, standard deviation; W-stat, Shapiro-Wilk test for normality of distribution computed from skewness and kurtosis; t-test, value of Student’s t-test; df, degrees of freedom for statistical tests; U, value of Mann-Whitney’s U test. *Probability value associated to the test significant for p<0.05.
Statistical Comparisons of OD Values From Histochemical Analyses of Brunner’s Glands and Villar Goblet Cells Between Controls (CTRL) and High-fat Diet (HFD) Fed Groups.
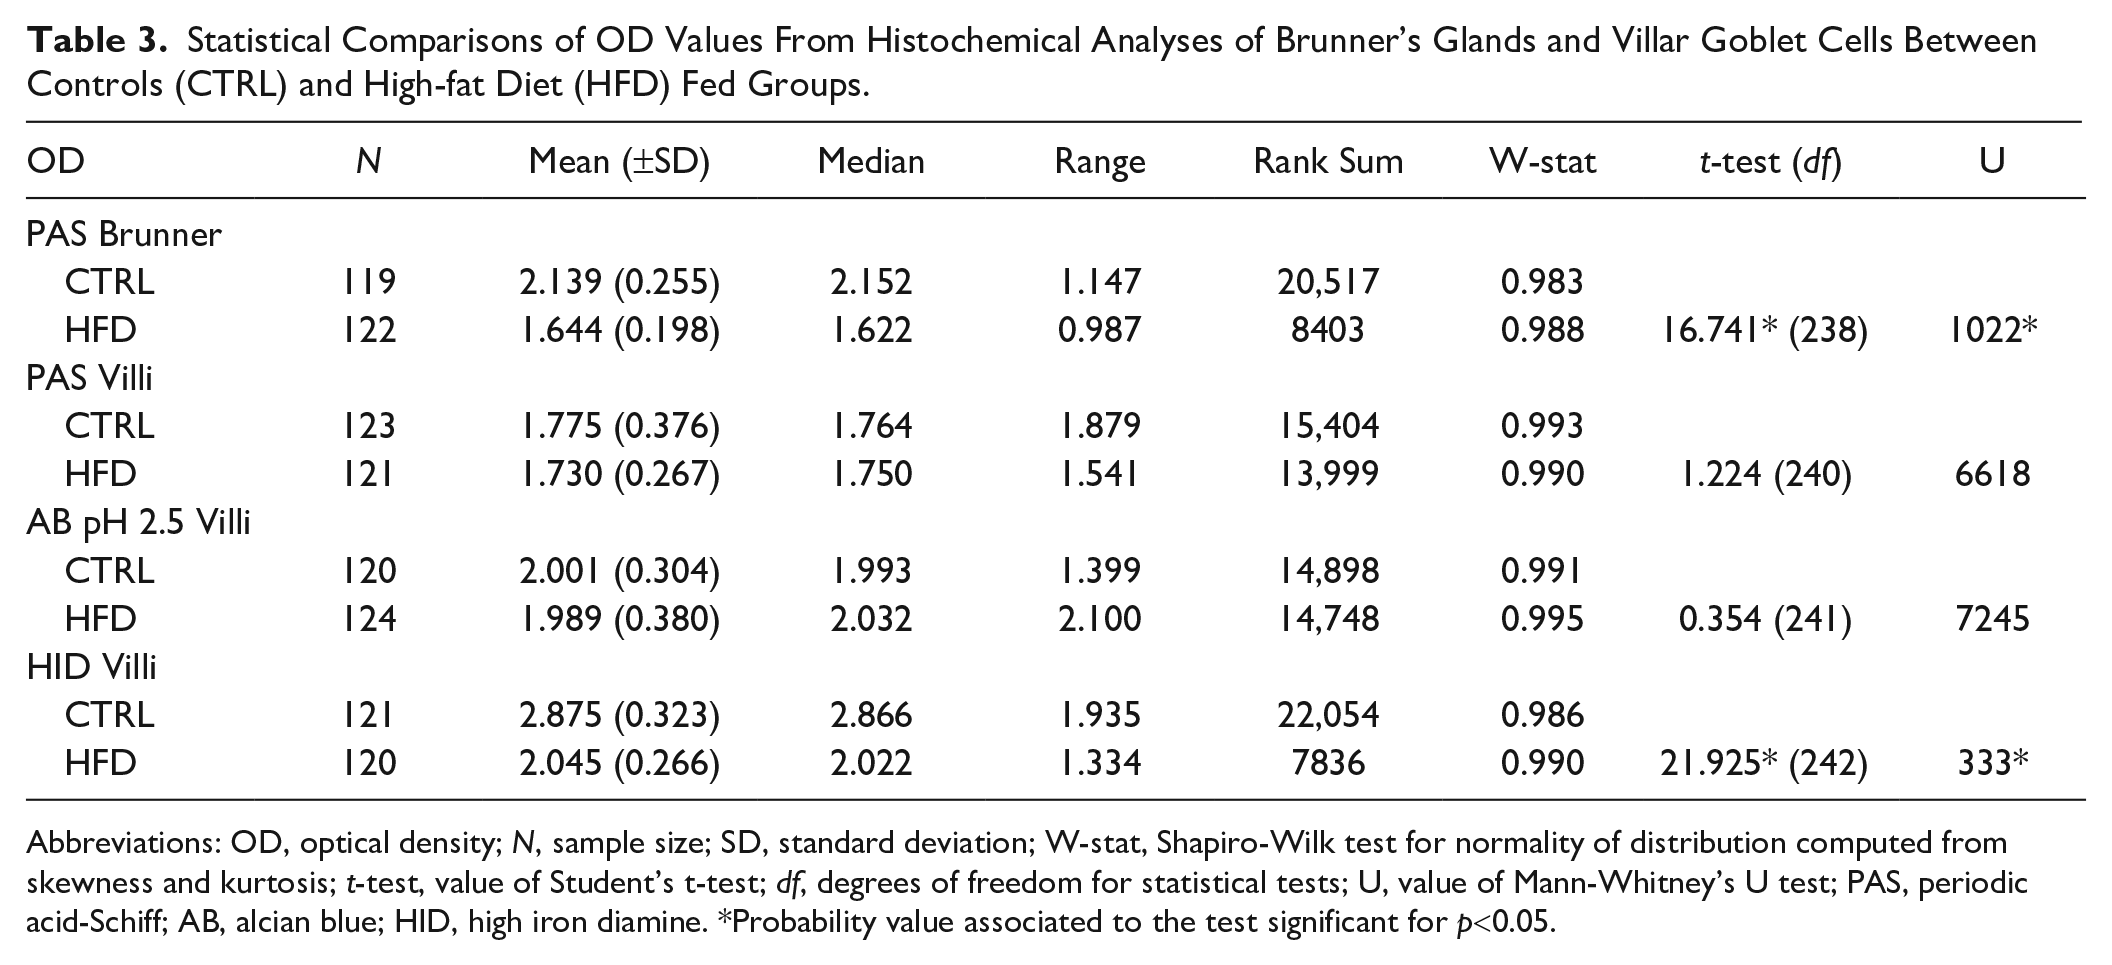
Abbreviations: OD, optical density; N, sample size; SD, standard deviation; W-stat, Shapiro-Wilk test for normality of distribution computed from skewness and kurtosis; t-test, value of Student’s t-test; df, degrees of freedom for statistical tests; U, value of Mann-Whitney’s U test; PAS, periodic acid-Schiff; AB, alcian blue; HID, high iron diamine. *Probability value associated to the test significant for p<0.05.
Villar Goblet Cells
PAS and AB pH 2.5 stained intensely the goblet cells in both the CTRL and HFD (Fig. 2G to J) with no significant difference of ODs between groups (Table 3). On the contrary, a significant decrease was observed for HID stain in the HFD in respect to the CTRL (Fig. 2K and L; Table 3). The glycocalyx of enterocytes resulted positive to all stains in both CTRL and HFD (Fig. 2G to L), but its intensity was not measured. Statistical comparisons of ODs in Brunner’s and villar secreting cells are resumed in the histogram of Fig. 3.
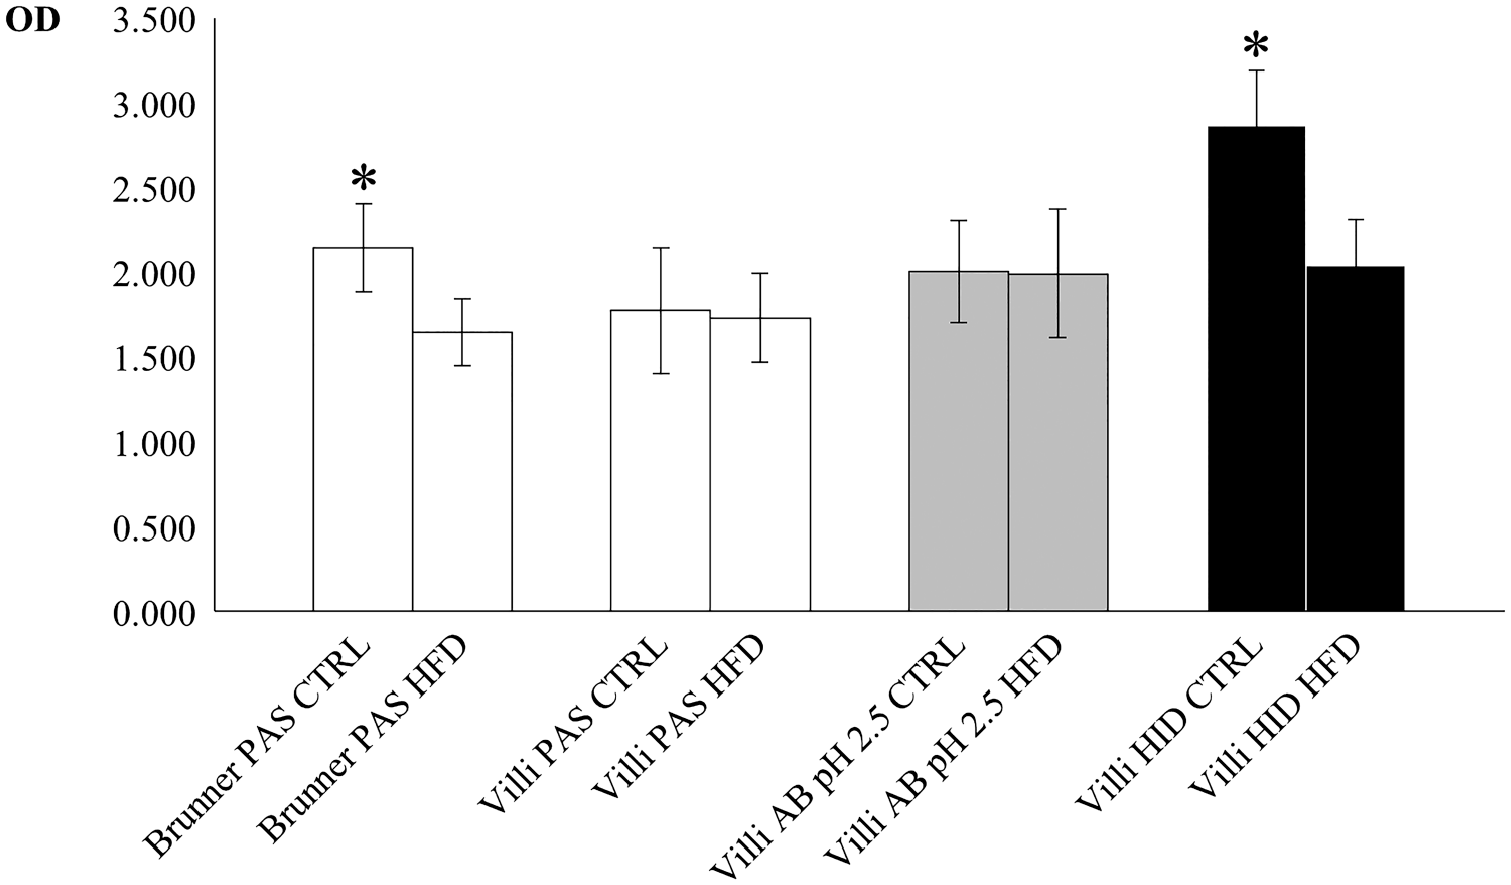
Plot of mean (±SD) optical density (OD) for the histochemical stains PAS (white), alcian blue pH 2.5 (gray), and HID (black) of Brunner’s glands and villar goblet cells in control (CTRL) and high-fat diet (HFD) fed mice. Asterisks indicate statistically significant differences of control mean values in respect to corresponding HFD (see text for details). Abbreviations: SD, standard deviation; PAS, periodic acid-Schiff; HID, high iron diamine; AB, alcian blue.
Fluorescent Lectin Binding
Brunner’s Glands
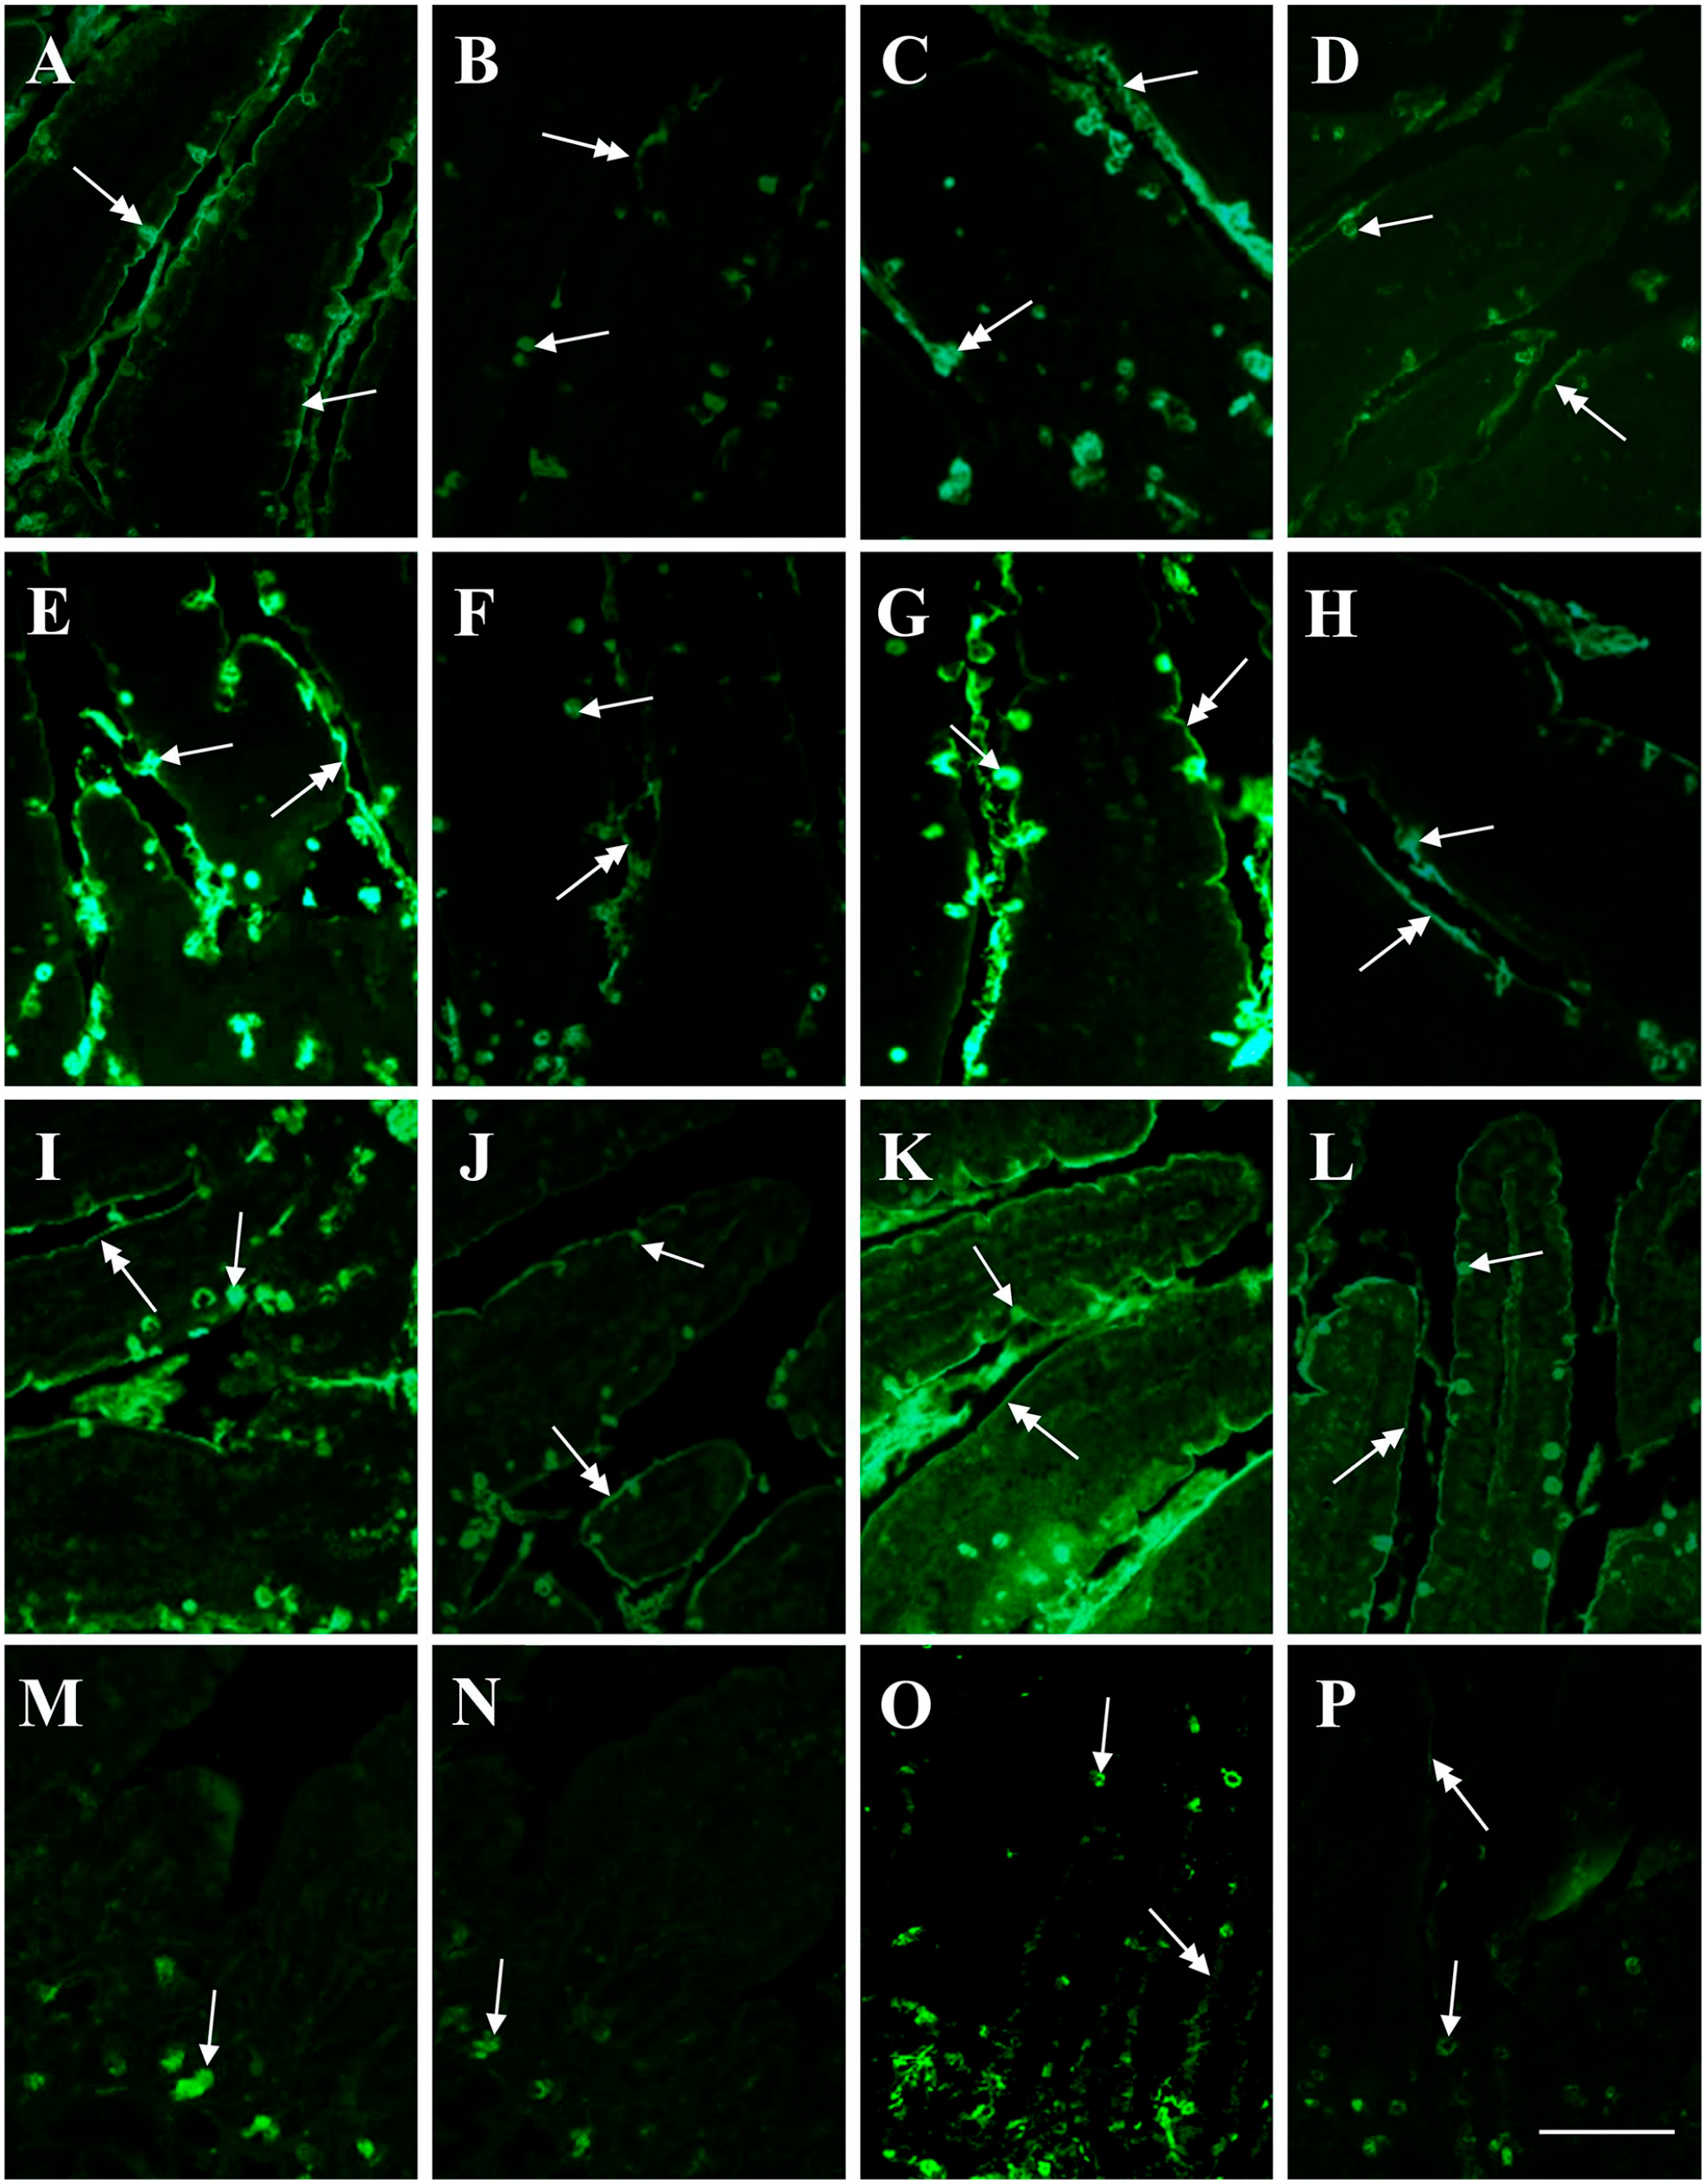
SNA and MAA-II lectins did not bind to the secretory cells. In general, binding intensity as measured by CTFC was significantly higher in CTRL than in HFD groups (Fig. 4). PNA binding was mostly observed in the deeper part of the adenomeres. A neat decrease of binding intensity in HFD was observed with PCS (Fig. 4I and J). Statistical analyses for lectin-binding intensity are reported in Table 4 and resumed in the histogram of Fig. 5.
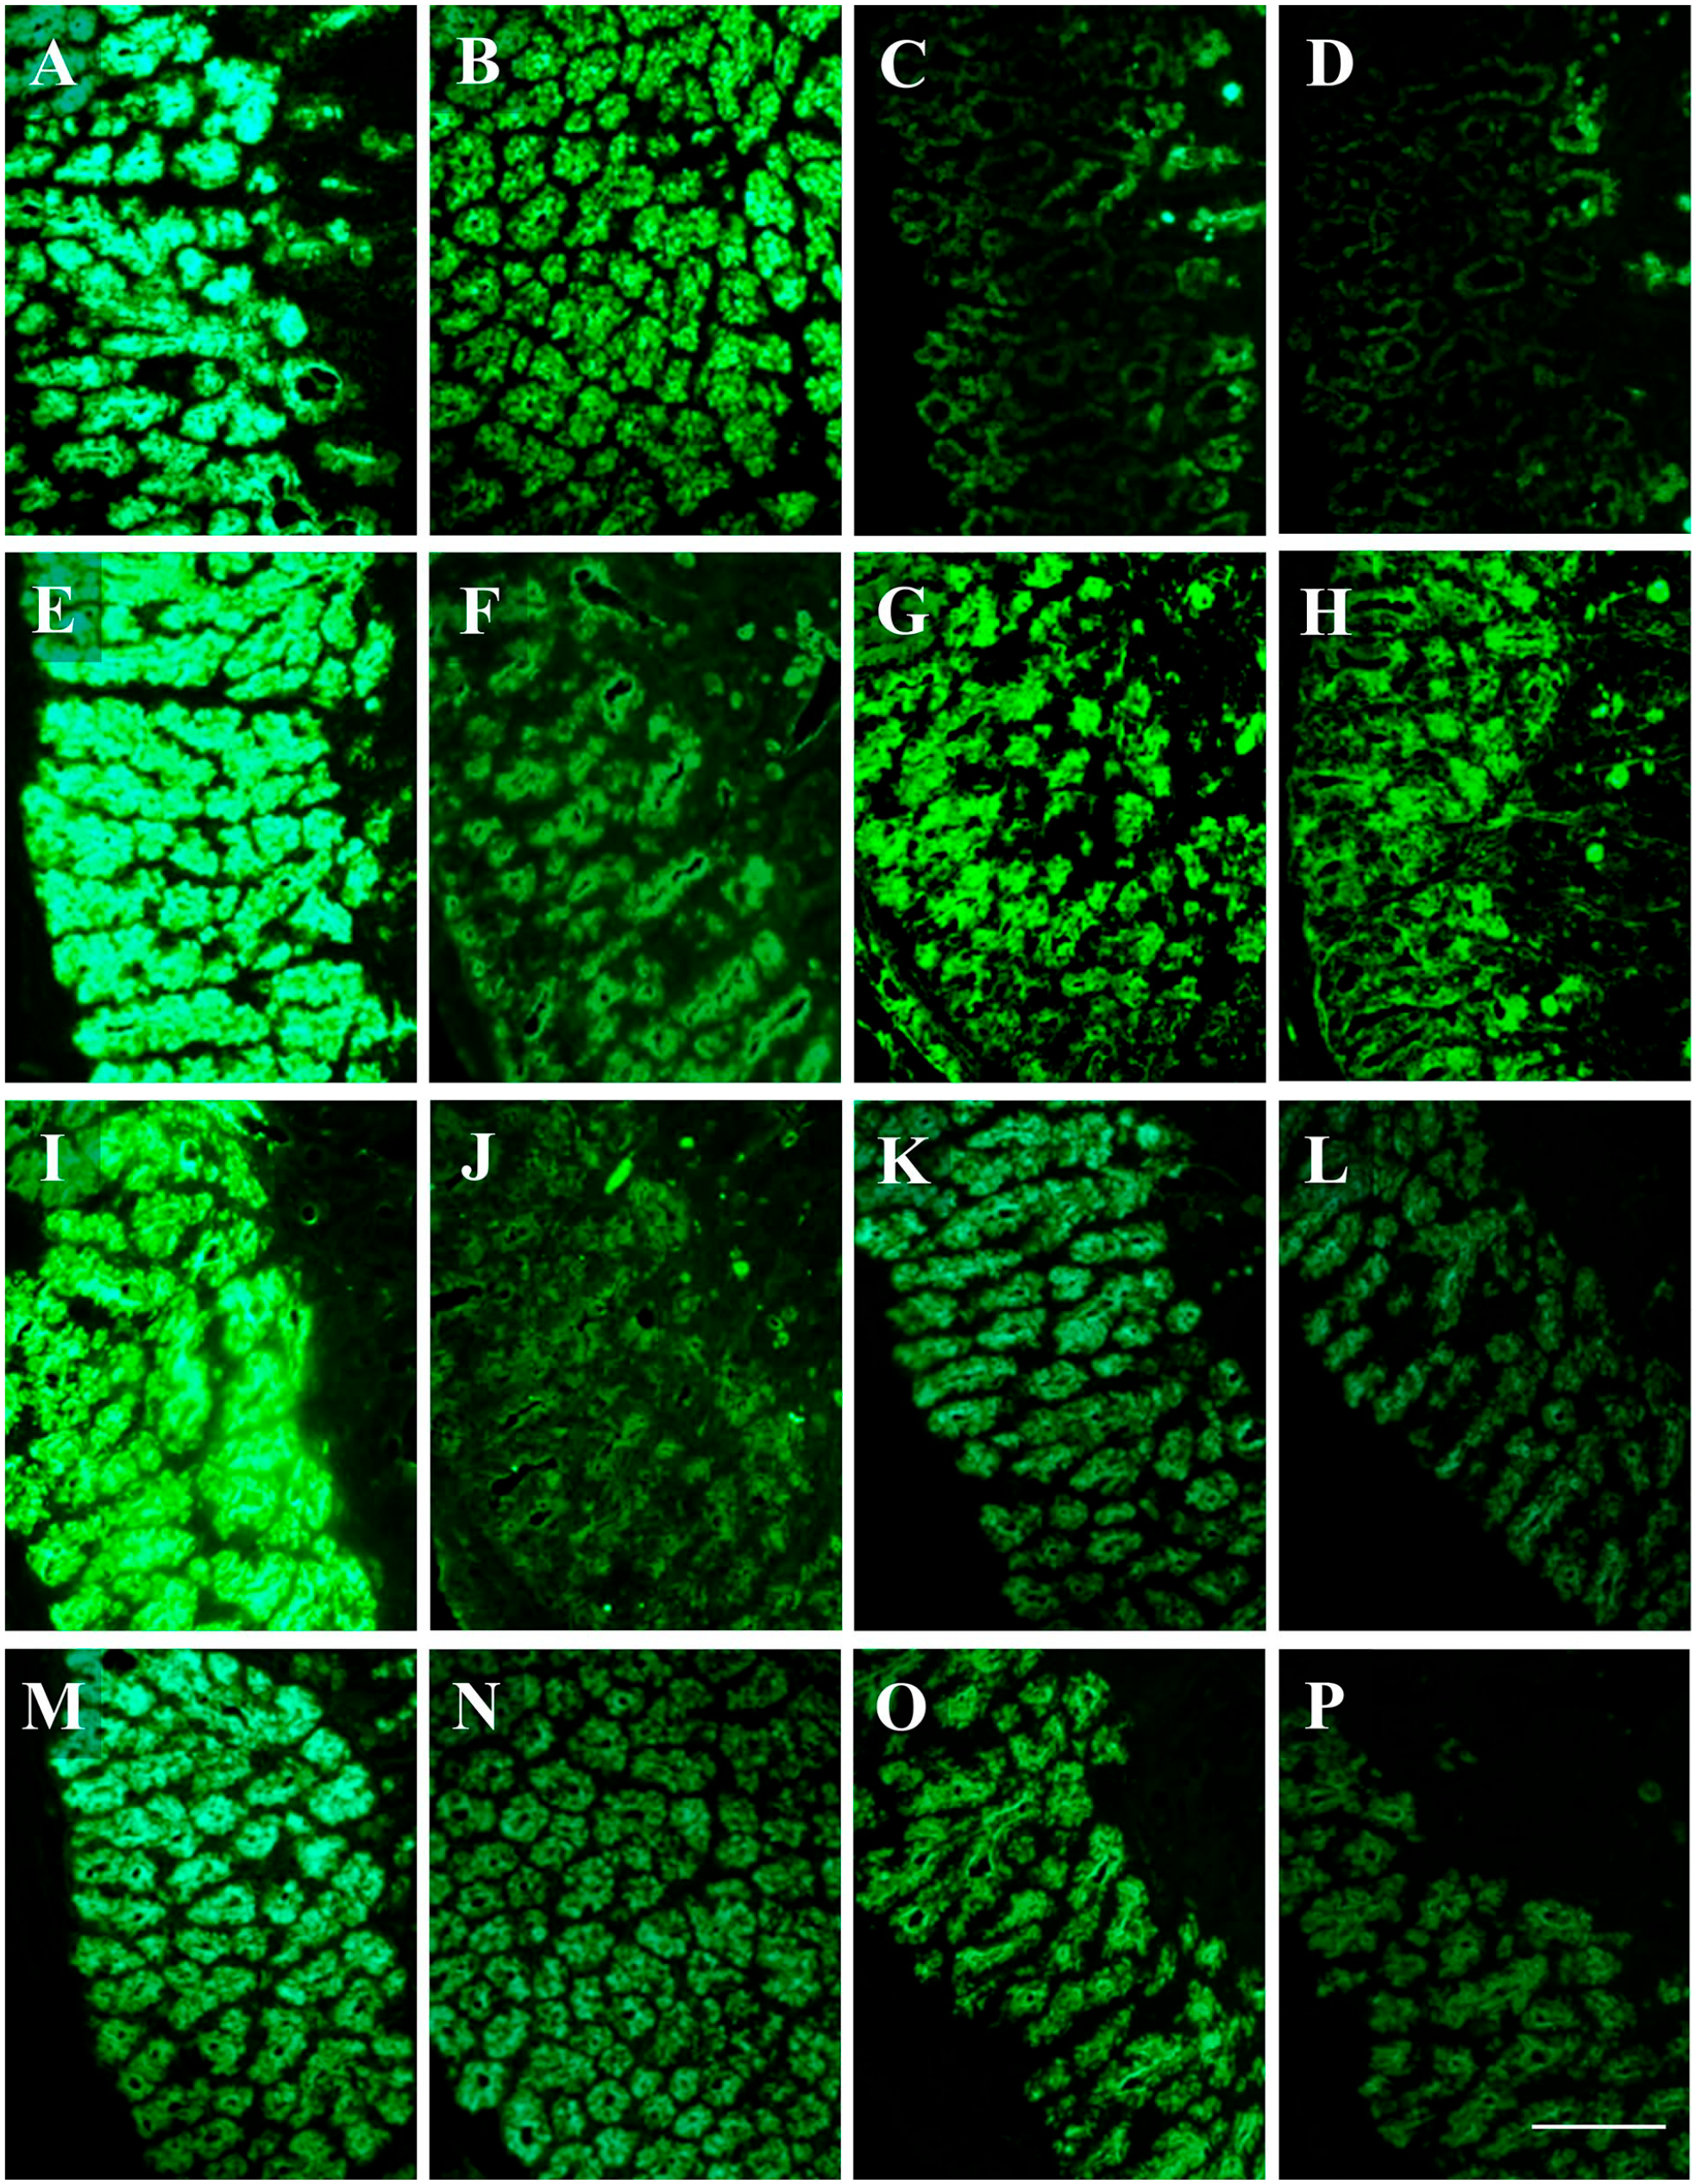
Lectin-binding of Brunner’s glands of control and high-fat diet fed mice. The intensity of binding in secreting cells is higher in the control (A, E, G, I, K, M, O) than in the HFD (B, F, H, J, L, N, P) specimen, except for PNA (C, D). (A, B) SBA-FITC. (C, D) PNA-FITC. (E, F) WGA-FITC. (G, H) ConA-FITC. (I, J) Paradoxical-ConA-FITC. (K, L) UEA-I-FITC. (M, N) AAA-FITC. (O, P) LTA-FITC. Scale bar=50 µm. Abbreviation: HFD, high-fat diet.
Statistical Comparisons of CTFC Values From Histochemical Analyses of Brunner’s Glands Between Controls (CTRL) and High-fat Diet (HFD) Fed Groups.
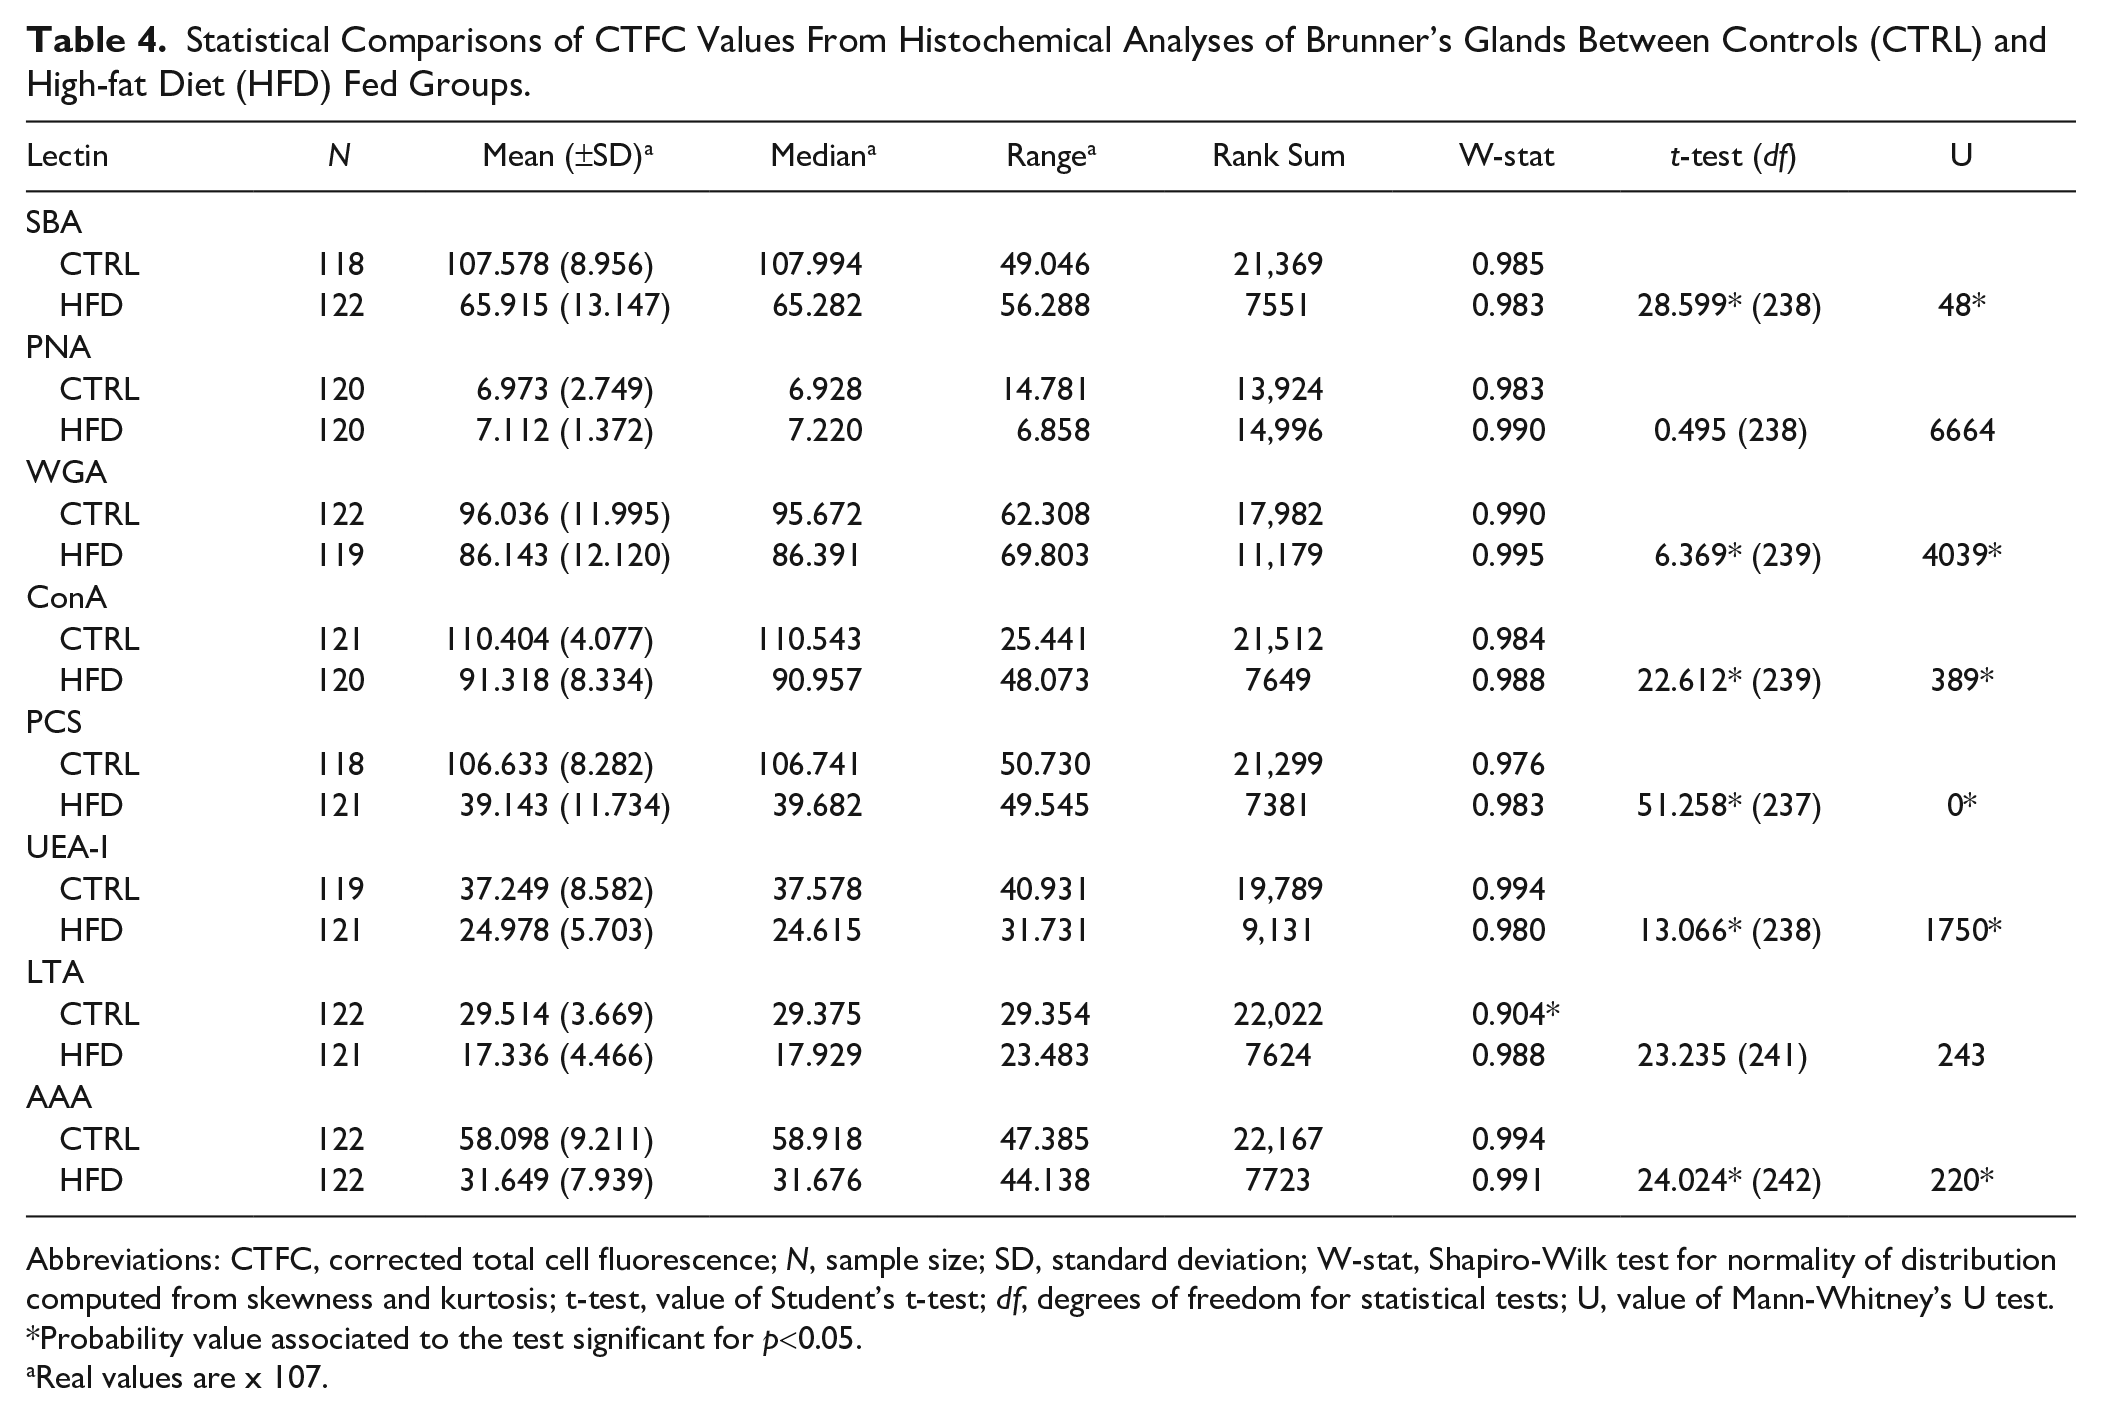
Abbreviations: CTFC, corrected total cell fluorescence; N, sample size; SD, standard deviation; W-stat, Shapiro-Wilk test for normality of distribution computed from skewness and kurtosis; t-test, value of Student’s t-test; df, degrees of freedom for statistical tests; U, value of Mann-Whitney’s U test. *Probability value associated to the test significant for p<0.05.
Real values are x 107.
Plot of mean (±SD) corrected total cell fluorescence (CTFC) values for lectin-binding of Brunner’s glands in control (CTRL, white) and high-fat diet (HFD, black) fed mice. Asterisks indicate statistically significant differences of control mean values in respect to corresponding HFD (see text for details). Abbreviations: SD, standard deviation; HFD, high-fat diet; PConA, paradoxical ConA.
Villar Goblet Cells
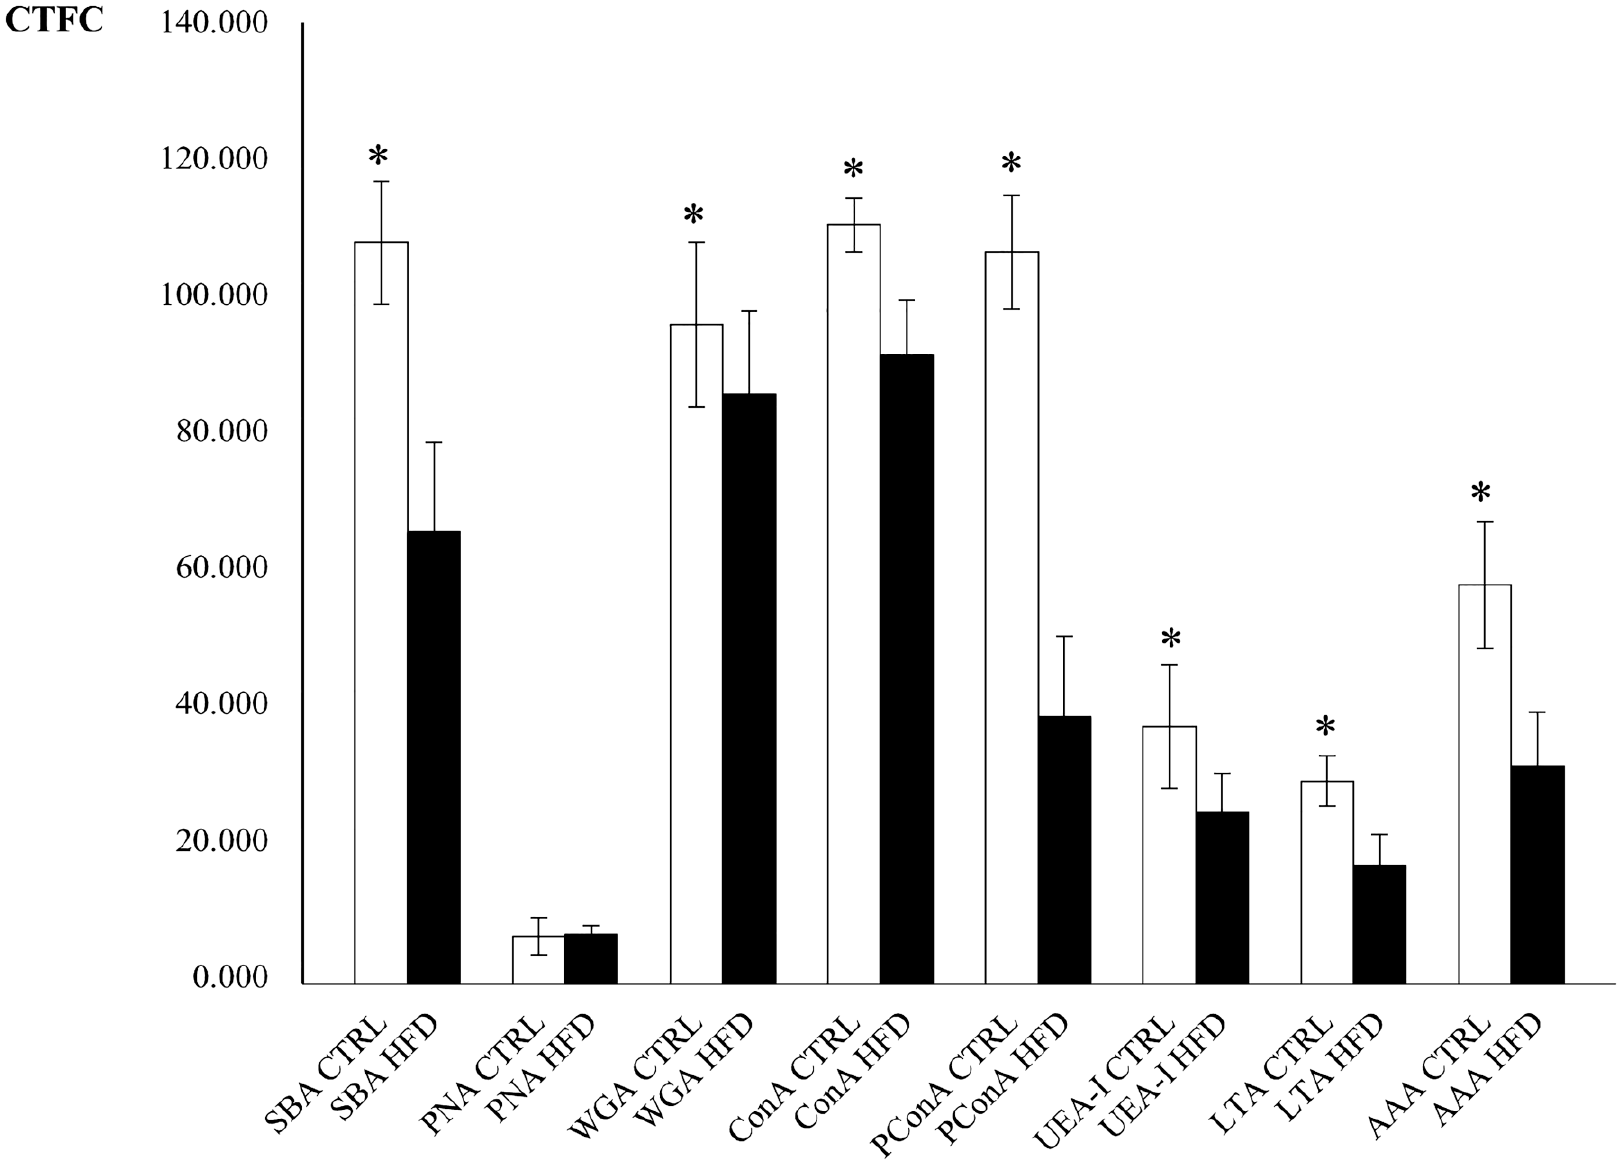
LTA, SNA, and PCS binding were never observed. MAA-II binding resulted only in the crypts (Fig. 6M and N). Desulfation resulted in an increase of SBA, PNA, WGA, and MAA-II binding only in CTRL (Fig. 6A to P). After desulfation, few cells in the crypts bound also to SNA, but they were not considered in the analyses. Significant differences between CTRL and HFD resulted for all the lectins, with higher CTFC values observed in CTRL than in HFD (Figs. 6 and 7). Statistical analyses for lectin-binding intensity are reported in Table 5 and resumed in the histogram of Fig. 8.
Lectin-binding of goblet cells (arrows) and glycocalyx (double headed arrows) of villi in control and high-fat diet (HFD) fed mice. The intensity of binding in goblet cells is higher in the control (A, E, I, M) than in the HFD (B, F, J, N) specimen. After desulfation, lectin-binding increases in control (C, G, K, O) but not in HFD (D, H, L, P). (A, B) SBA-FITC. (C, D) desulfation SBA-FITC. (E, F) PNA-FITC. (G, H) desulfation PNA-FITC. (I, J) WGA-FITC. (K, L) desulfation WGA-FITC. (M, N) MAA-II-FITC. (O, P) desulfation MAA-II-FITC. Scale bar=50 µm.
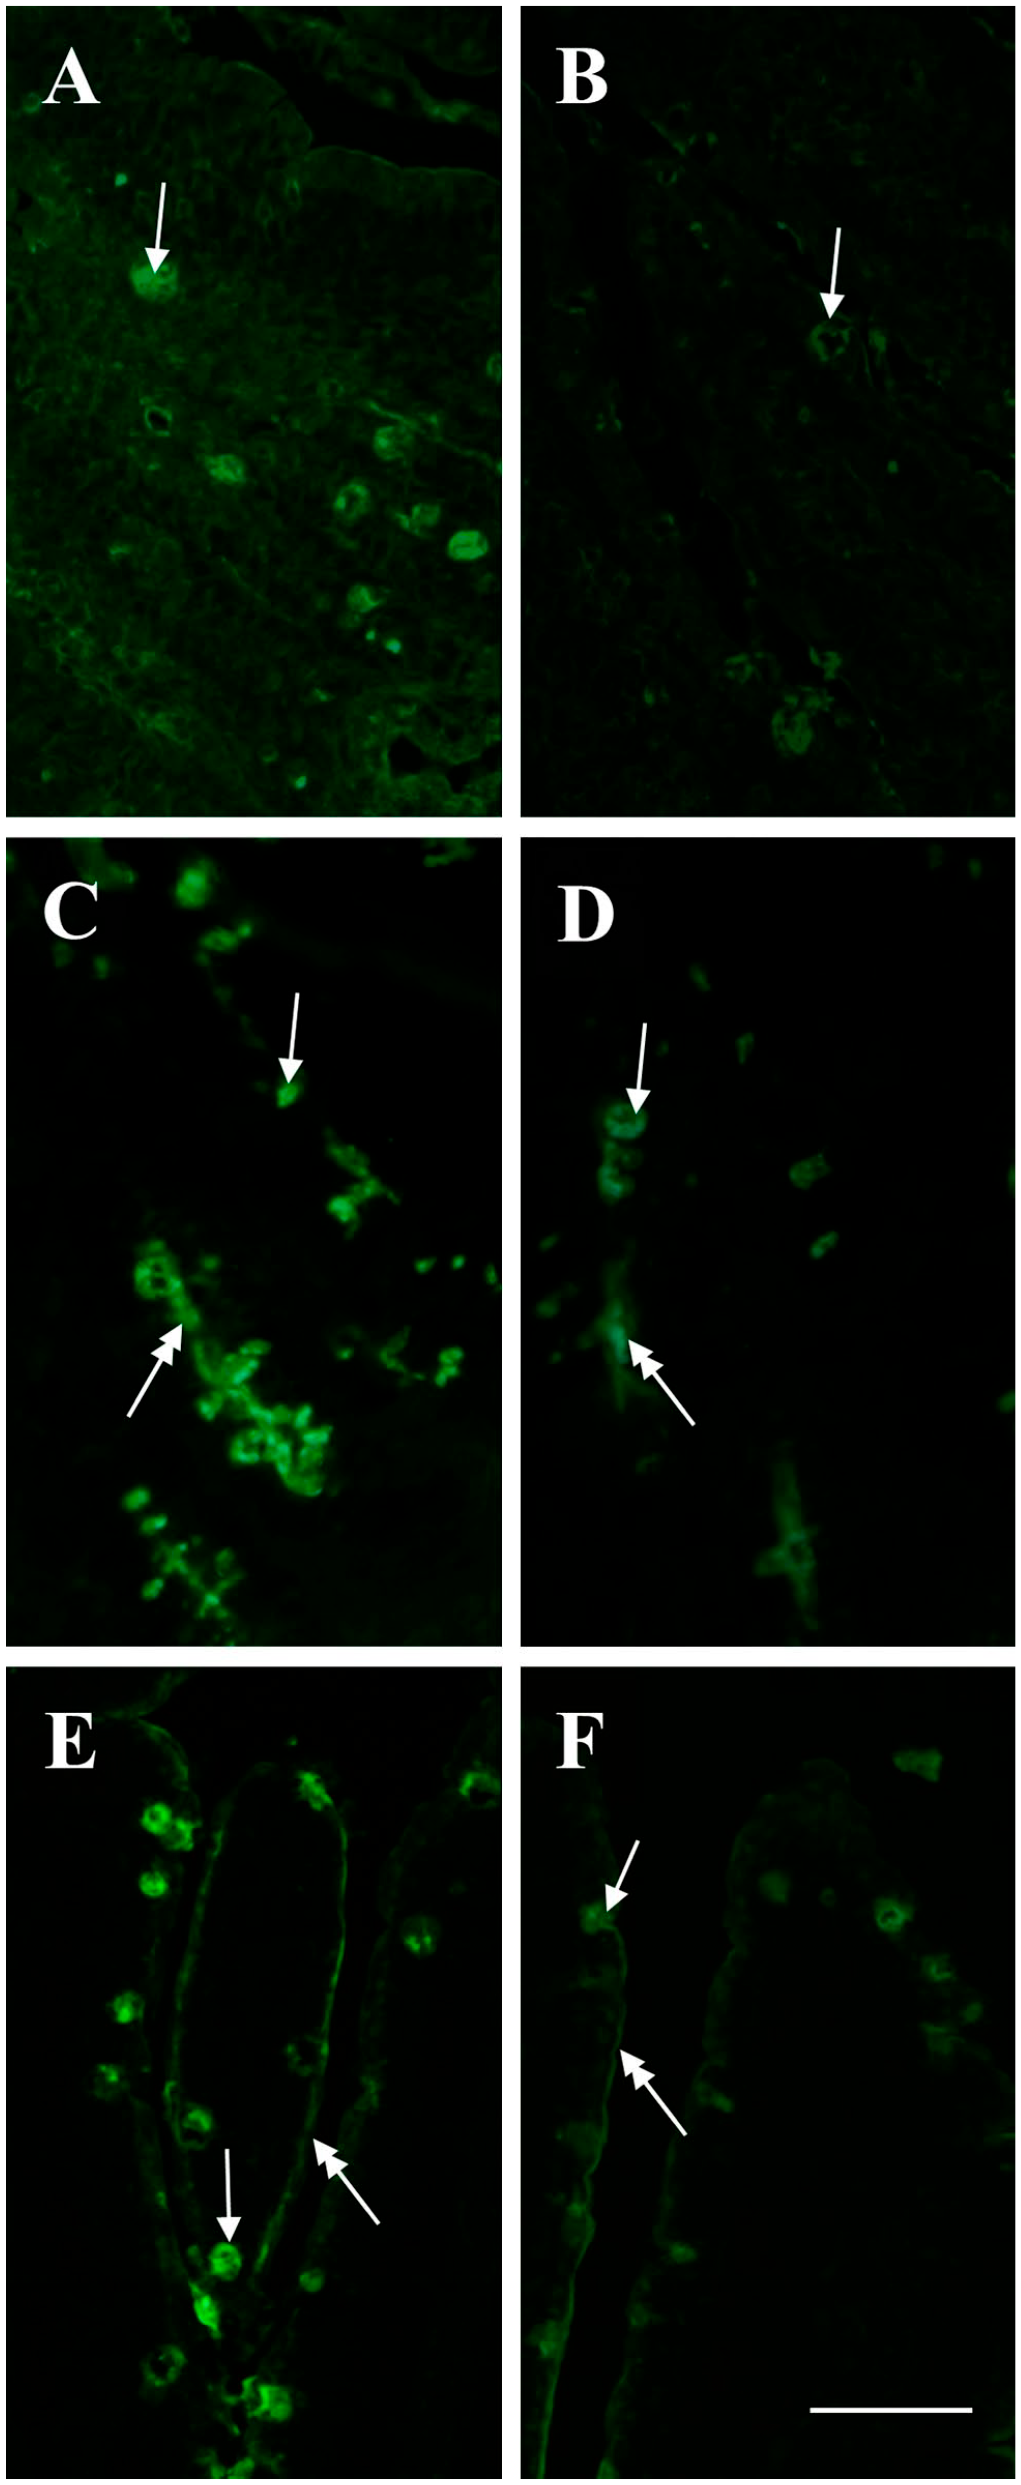
Lectin-binding of goblet cells (arrows) and glycocalyx (double headed arrows) of villi in control and HFD mice. The intensity of binding in goblet cells is higher in the control (A, C, E) than in the HFD (B, D, F) specimen. (A, B) ConA-FITC. (C, D) UEA-I-FITC. E, F AAA-FITC. Scale bar=50 µm. Abbreviation: HFD, high-fat diet.
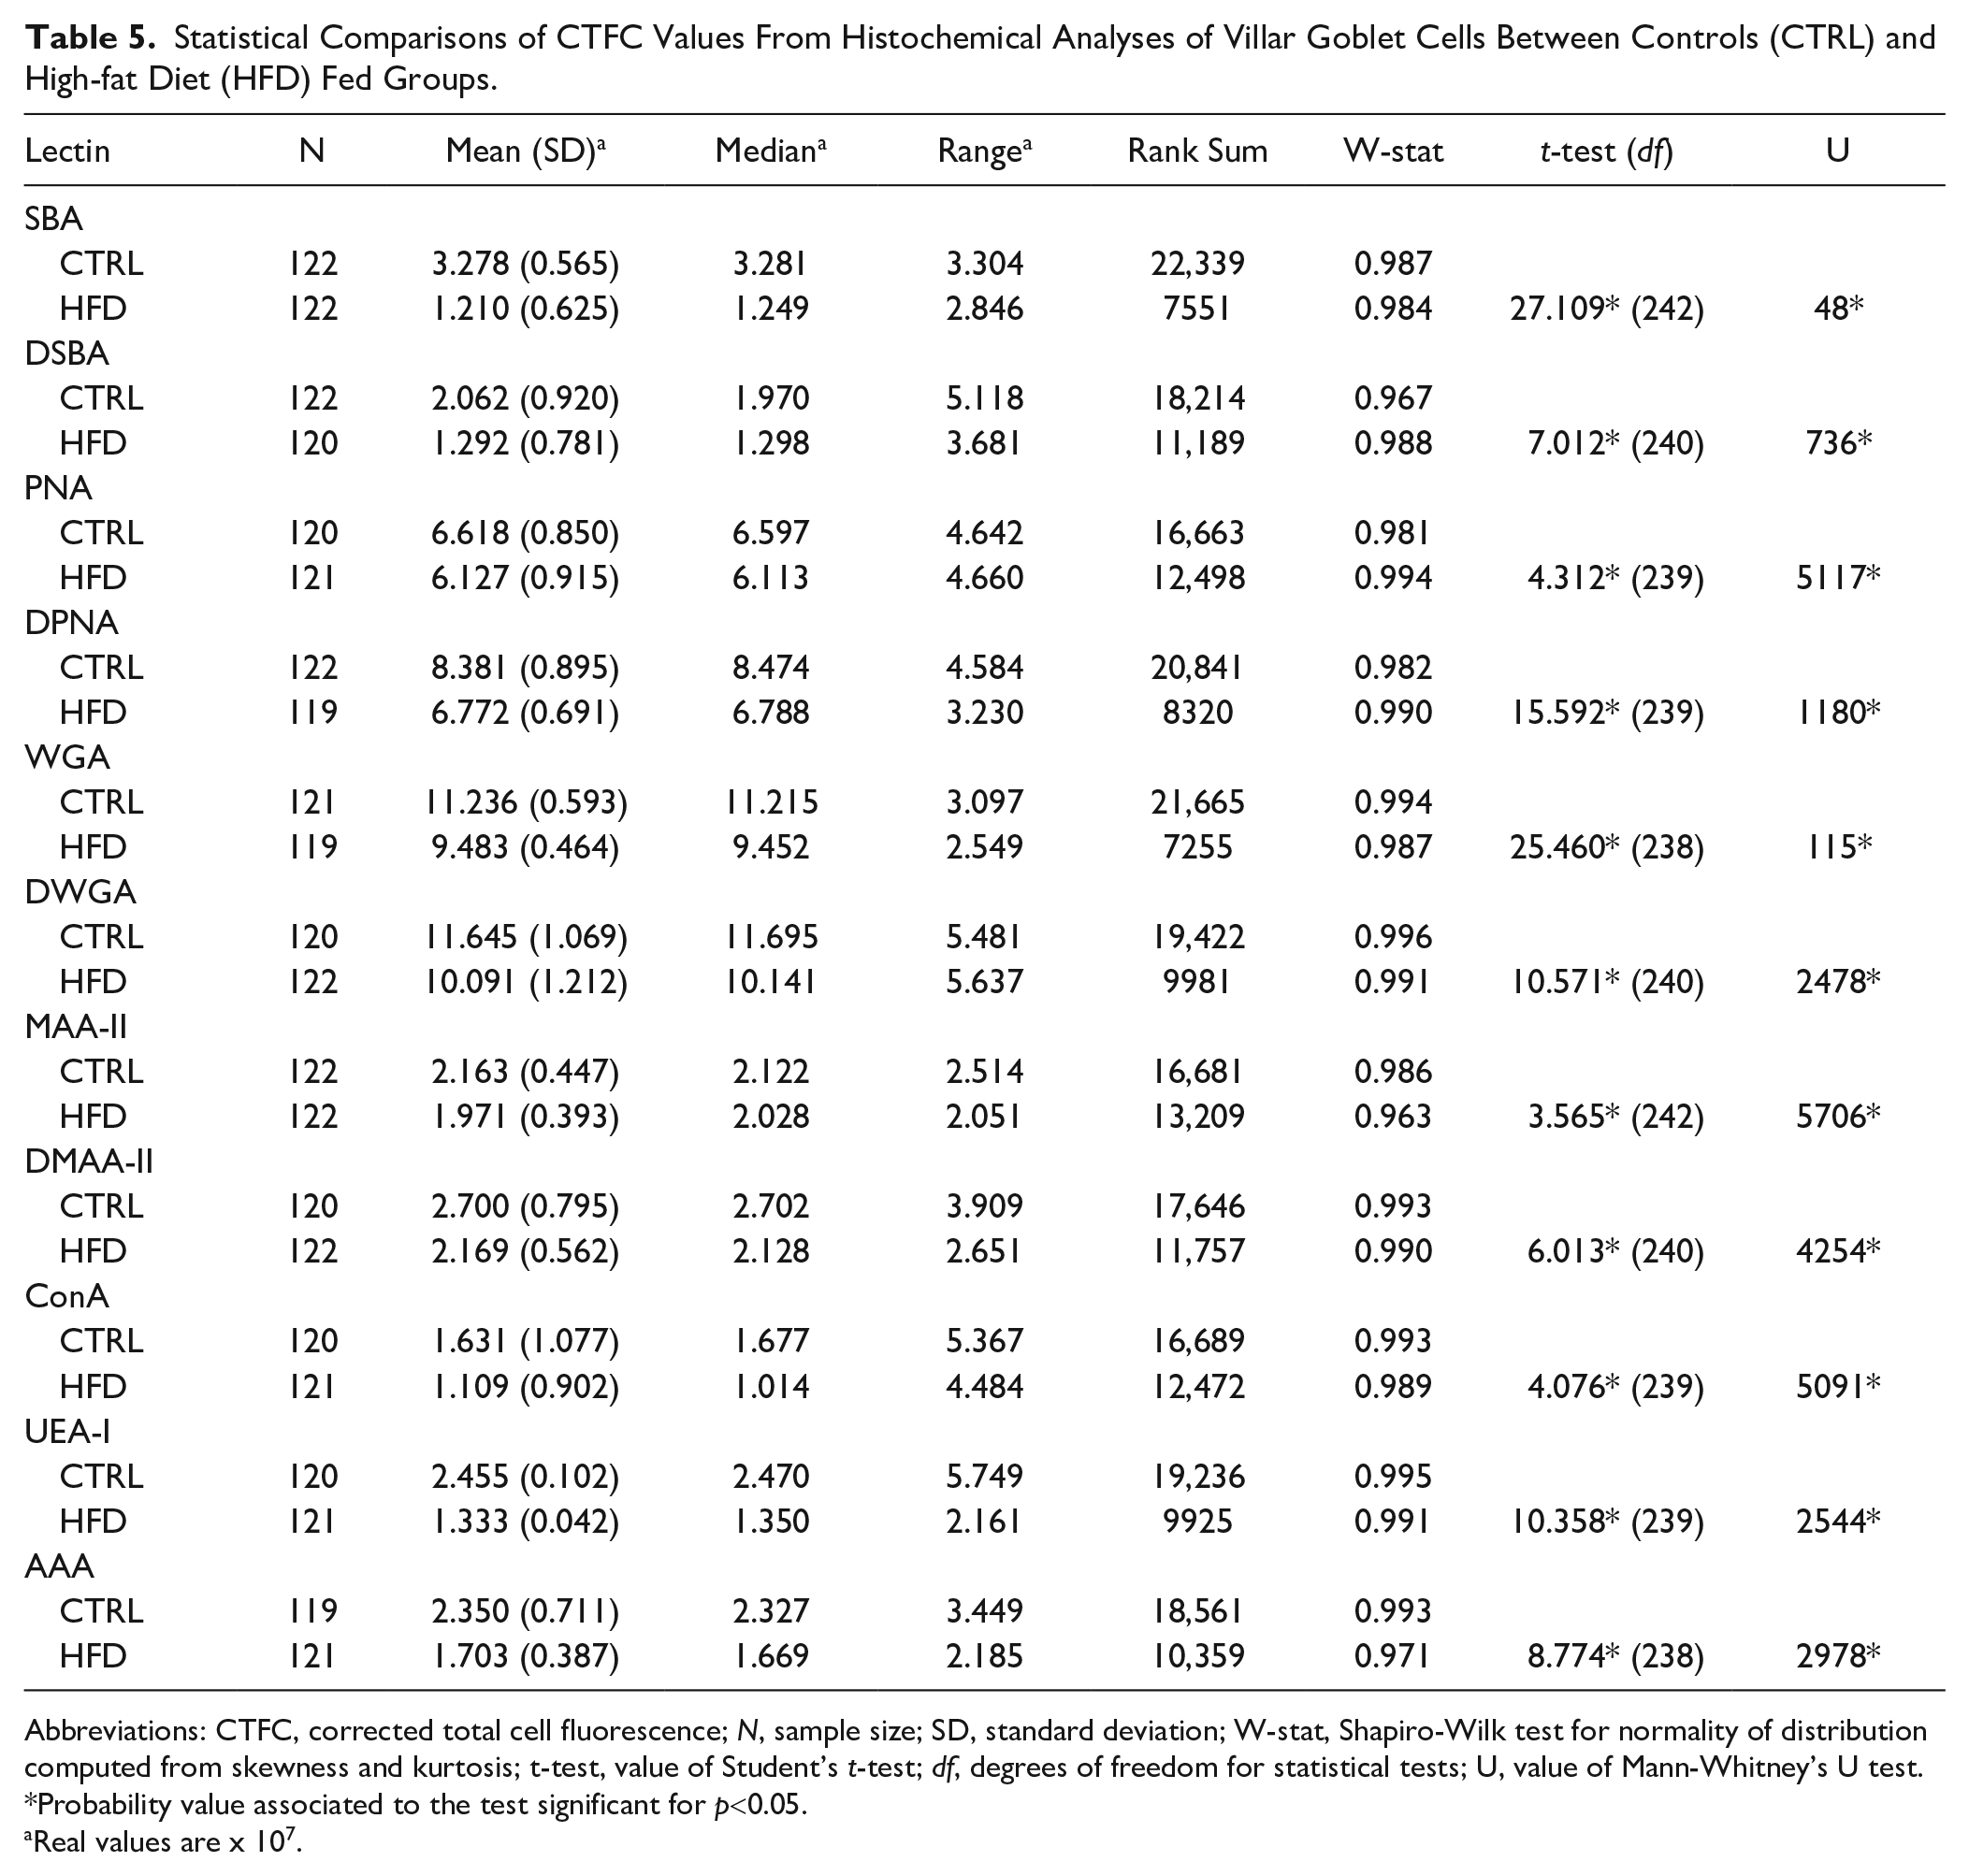
Statistical Comparisons of CTFC Values From Histochemical Analyses of Villar Goblet Cells Between Controls (CTRL) and High-fat Diet (HFD) Fed Groups.
Abbreviations: CTFC, corrected total cell fluorescence; N, sample size; SD, standard deviation; W-stat, Shapiro-Wilk test for normality of distribution computed from skewness and kurtosis; t-test, value of Student’s t-test; df, degrees of freedom for statistical tests; U, value of Mann-Whitney’s U test. *Probability value associated to the test significant for p<0.05.
Real values are x 107.
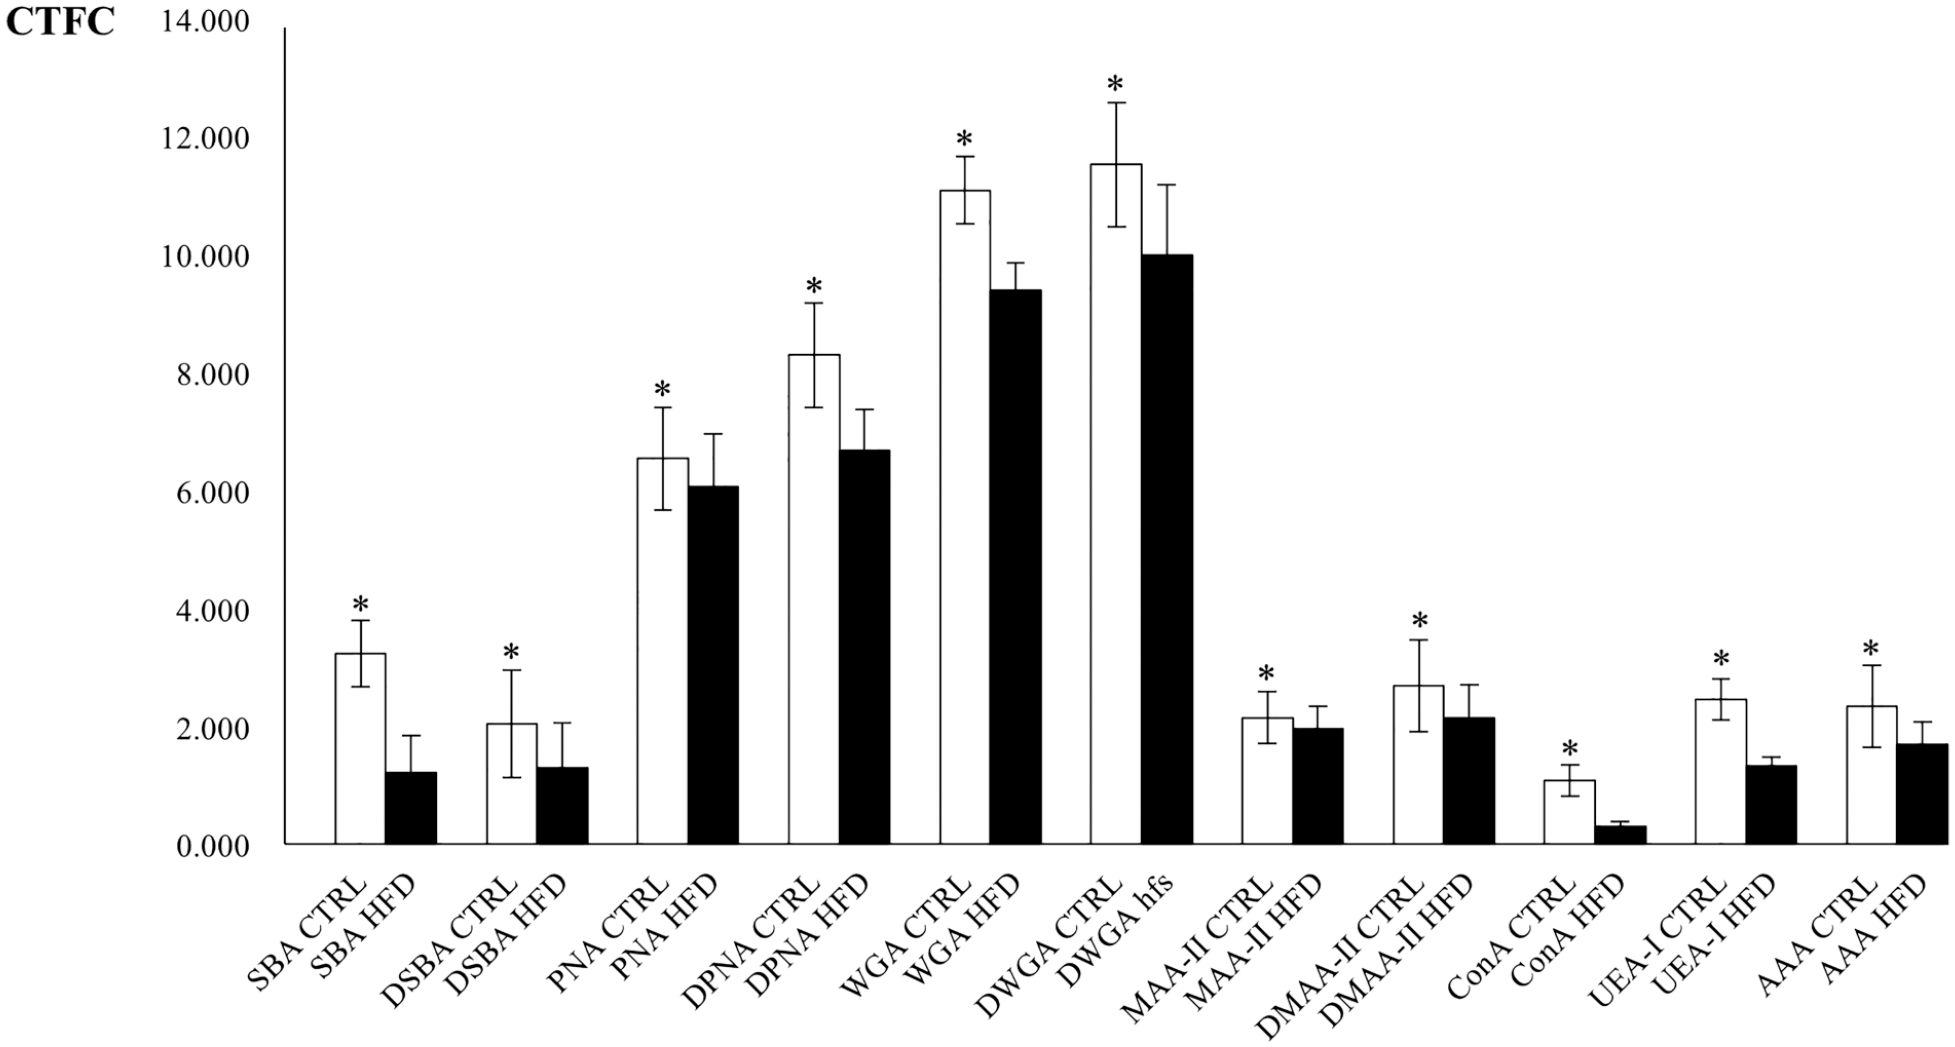
Plot of mean (±SD) corrected total cell fluorescence (CTFC) values for lectin-binding of villar goblet cells in control (CTRL, white) and high-fat diet (HFD, black) fed mice. Asterisks indicate statistically significant differences of control mean values in respect to corresponding HFD (see text for details). Abbreviation: SD, standard deviation.
The glycocalyx of enterocytes bound to SBA, PNA, WGA, ConA, UEA, and AAA (Figs. 6 and 7), and no differences were observed between groups.
Discussion
Proximal duodenum mucins are secreted by the cells of the Brunner’s glands and the goblet cells in the villi. Similar to the colon, the main mucin is expressed by MUC2/Muc2, which forms a viscoelastic gel lining the lumen, but its structural arrangement and functions are different. In the duodenum, mucus polymers form a single, non-adherent layer, 47 whereas in the colon there are two layers of mucus, the inner one adhering to the epithelium where it forms a physical barrier to bacteria and the outer one hosting a dense microbiota. Rather than a barrier, the mucus layer in the duodenum is thought to form a gradient of antibacterial substances secreted by the epithelial cell decreasing the diffusion rate of bacteria.1,3,4 The differences between colon and duodenum mucins are due to different glycosylation patterns3,47 that can be altered in pathological processes like those arising from HFD.20–25 The analysis of mucin glycopatterns by histochemical, lectin-binding, and immunohistochemical methods provides a useful tool in the detection of the above reported oligosaccharide alterations.13–15 In the present work, we show that HFD alters the glycosylation pattern of duodenum mucins in a way similar to that we previously found in the colon. 21
It should be noted that often the link between stain intensity and amount of reaction products is not linear as it should be according to the Lambert-Beer law, 41 but it is still useful in comparative analyses like those presented here. In image analysis, usually homogenous areas are selected for the evaluation of the stain intensity, like we did with the Brunner’s glands, but this approach was not possible with the goblet cells in the villar epithelium because they are irregularly arranged along the border of the villus. Consequently, we preferred to estimate the mean stain intensity of single cells. As far as the glycocalyx, it showed a rather variable thickness, so we did not measure its staining intensity but recorded only its positivity with stain or binding.
Liver steatosis, that is, abnormal accumulation of triglycerides in hepatocytes, is one of the consequences of HFD diet. 48 Having observed several steatotic hepatocytes in the HFD group, we concluded that the experimental treatment was effective.
The lumen of the Brunner’s glands in the HFD was significantly larger than that of the control group, and this can be interpreted as an increase of the secretion rate. 49 This could result in a lower amount of stored mucins and explain the significant lower value of OD in respect to the control. Similar results were observed in Guinea pig’s isolated glands after stimulation with hormonal, inflammatory, and neurocrine agents. 49 On the other side, mice were fastened overnight showing reduced secretion. Likely, the lower staining intensity seen in the HFD condition was due to a reduction in mucin glycosylation. Negative stain with AB pH 2.5 and HID confirms the lack of acidic mucins in murine Brunner’s glands, as previously observed. 28 Lectin-binding experiments indicated that in the CTRL group the oligosaccharidic chains of mucins present residuals of Gal/GalNAc (as detected by SBA/PNA), Man/Glc (ConA), GlcNAc (WGA), and fucose linked in 1,2; 1,3; 1,4; and 1,6 (UEA-I, LTA, AAA). All the cited residues are still present in the HFD group, but lower CTFC values indicate a decrease in their number. The PConA reaction was positive in the CTRL and almost negative in the HFD group indicating a massive decrease of class III mucins and thus of terminal α1,4-linked GlcNAc. 29 In the digestive system, these mucins are expressed in glandular mucous cells in the stomach (cardiac gland cells, mucous neck cells, and pyloric gland cells), in the Brunner’s gland cells, and along the biliary and pancreatic ducts. 14 α1,4-linked GlcNAc residuals are linked to serine or threonine residues of the scaffold protein expressed by MUC6 and bind to the ConA lectin after periodate-sodium borohydrate treatment. 50 MUC6 is expressed in Brunner’s glands and in other tissues in the embryonic life around the 19th week, and it is involved in epithelia cytoprotection against several substances in both fetal and adult life. 25 Besides, α1,4-linked GlcNAc residuals have a cytostatic functions and class III mucins are expressed in gastric, pancreatic, biliary, and pulmonary adenocarcinomas, serving as a tumor suppressor. 29 It has been also observed that αGlcNAc residuals act as a natural antibiotic against Helicobacter pylori infection. 29 Thus, the massive reduction of class III mucins in mice fed an HFD could increase the vulnerability of the duodenum to the cited diseases. The reduction of other residuals in the HFD group could increase the susceptibility to pathologies, as well. As an example, Gal/GalNAc residuals are important in preventing amoebiasis, since they interact with Entoameba inhibiting adhesion to the underlying epithelium. 51 Fuc residuals are involved in mucus viscosity and in modeling the microflora composition in favor of fucose-degrading commensals. 52 Changes in the expression of fucosylated residuals were observed in cancer and inflammation, 53 so that altered fucosylation following HFD could promote microflora alteration and pathologies.
The goblet cells of villi in the CTRL group secrete acidic mucins, as indicated by positivity to AB pH 2.5 and HID. OD values for PAS and AB pH 2.5 did not vary between CTRL and HFD groups, indicating that neutral and acidic carbohydrate amounts were not affected by the treatment. On the opposite, OD for HID stain was significantly lower in HFD, suggesting a decrease in the sulfation of glycans. This finding parallels the condition of mucins in the mouse colon, in which desulfation was observed in HFD-fed individuals. 21 Sulfated residuals are involved in regulating the interactions with microorganisms and parasitic helminths, as well as in preventing inflammatory disorders.1,11,54 Thus, it is reasonable to hypothesize that the reduction of sulfation in duodenal glycans leads to pathophysiological alterations.
Lectin-binding experiments in the CTRL group showed the presence of residuals of Gal/GalNAc (SBA/PNA), GlcNAc/NeuNAc (WGA, MAA-II), Man/Glc (ConA), and fucose linked in 1,2; 1,3; 1,4; and 1,6 (UEA-I, AAA). Desulfation experiments resulted in an increase of binding for SBA, PNA, WGA, and MAA-II, suggesting that sulfated residuals are linked to Gal/GalNAc and to GlcNac/NeuNAc. Similar to what it was observed in the Brunner’s glands, in the HFD group a significant decrease of CTFC values in respect to the CTRL group binding takes place probably due to a decrease in glycosylation. Desulfation experiments did not increase significantly the binding intensity of SBA, PNA, WGA, and MAA-II, likely due to a lower number of sulfated residuals with respect to the CTRL group, confirming the results from HID stain. Lectin-binding to glycocalyx was not affected by the experimental treatment and presented residuals of Gal/GalNac, GlcNAc/NeuNAc, Glc/Man, and Fuc.
Our results indicate that HFD reduces the amount of glycosylated residuals, which parallels the downregulation of mucin synthesis observed in Kras-mutant mice induced by the same diet. 24 In both Kras and Double Knockout mutants, loss of O-glycans is associated with tumorigenesis6,24 and our results suggest that wild type mice are also exposed to a higher risk of tumorigenesis when fed a HFD, due to the reduced synthesis of Muc2, which is regarded as an important tumor suppressor. 55 Like Muc6, galactosaminylation and fucosylation are reduced in HFD, and the consequences could be similar to those inferred for Brunner’s glands.
In conclusion, our data demonstrate that in line with what it has been previously observed in the colon, HFD affects both the amount and the glycosylation pattern of both Muc2 and Muc6. Thus, a number of secreting cells in different tracts of the intestine are object of the alterations induced by the high-fat diet, increasing the risk of dysfunctions such as those related to gut microbiota and tumorigenesis.
Footnotes
Acknowledgements
The authors thank Patrizia Gena for technical help.
Competing Interests
The author(s) declared no potential conflicts of interest with respect to the research, authorship, and/or publication of this article.
Author Contributions
All authors have contributed to this article as follows: MM, GC, and GS conceived the study and wrote the article; GC designed and performed the experimental treatments; MM, DM, and GS performed the histological experiments and analyzed the data; all authors discussed the results, provided comments, and approved the manuscript as submitted.
Funding
The author(s) disclosed receipt of the following financial support for the research, authorship, and/or publication of this article: Financial support to GC and MM from Italian “Programmi di Ricerca Scientifica di Rilevante Interesse Nazionale 2017” (PRIN2017; grant # 2017J92TM5) is gratefully acknowledged.