
Abstract
Liver regeneration is a well-orchestrated compensatory process that is regulated by multiple factors. We recently reported the importance of the chromatin protein, a high-mobility group box 2 (HMGB2) in mouse liver regeneration. However, the molecular mechanism remains unclear. In this study, we aimed to study how HMGB2 regulates hepatocyte proliferation during liver regeneration. Seventy-percent partial hepatectomy (PHx) was performed in wild-type (WT) and HMGB2-knockout (KO) mice, and the liver tissues were used for microarray, immunohistochemistry, quantitative polymerase chain reaction (qPCR), and Western blotting analyses. In the WT mice, HMGB2-positive hepatocytes colocalized with cell proliferation markers. In the HMGB2-KO mice, hepatocyte proliferation was significantly decreased. Oil Red O staining revealed the transient accumulation of lipid droplets at 12–24 hr after PHx in the WT mouse livers. In contrast, decreased amount of lipid droplets were found in HMGB2-KO mouse livers, and it was preserved until 36 hr. The microarray, immunohistochemistry, and qPCR results demonstrated that the expression of lipid metabolism–related genes was significantly decreased in the HMGB2-KO mouse livers. The in vitro experiments demonstrated that a decrease in the amount of lipid droplets correlated with decreased cell proliferation activity in HMGB2-knockdown cells. HMGB2 promotes de novo lipogenesis to accelerate hepatocyte proliferation during liver regeneration:
Introduction
High-mobility group (HMG) proteins are the most abundant non-histone chromatin-associated proteins involved in gene transcription, replication, recombination, and repair processes. 1 A high-mobility group box 2 (HMGB2) is a member of the HMG protein that binds to DNA without sequence specificity, and is involved in the fine-tuning of gene transcription by facilitating the accessibility of transcription factors and direct protein–protein interactions. 2 HMGB2 is highly expressed in all tissues during embryogenesis and carcinogenesis, and becomes depleted in senescent cells and aging tissues.3–5 Recently, we reported the pivotal role of HMGB2 in male and female reproductive tissues.6–8 We also reported the crucial role of HMGB2 in the regulation of hepatocyte proliferation and cellular size during mouse liver regeneration. 9 However, the detailed molecular mechanisms of HMGB2 in regulating liver regeneration remain largely unknown.
Liver regeneration is an extraordinarily complex process that involves a variety of signaling pathways, cytokines, transcription factors, and chromatin-associated proteins. 10 It is clinically important to understand the molecular mechanisms of liver regeneration because liver regeneration is crucial after partial hepatectomy (PHx) and liver transplantation, which are major treatments for hepatocellular carcinoma and severe liver diseases.11,12 After PHx, the remnant liver rapidly reg-enerates in patients with normal liver parenchyma. However, liver regeneration is impaired in patients with hepatic steatosis. Because obesity is a major risk factor for developing steatosis, and among the estimated 1.9 billion overweight adults worldwide, approximately 650 million are obese, 13 it is important to study the effects of steatosis on liver regeneration.
In a PHx mouse model, hepatocyte proliferation was correlated with hepatic fat accumulation; in particular, hepatocyte replication appeared concurrently with mitotic peaks during liver regeneration. 14 In a recent report, HMGB2 was reported to be a novel adipogenic gene that is involved in fat metabolism and adipogenic differentiation. 15 In another study, HMGB2 was shown to have a pivotal role in adipogenic differentiation through binding of the CCAAT enhancer-binding protein beta (C/EBPb) promoter, and to affect the mitotic clonal expansion stage. 16 However, the role of HMGB2 in hepatic fat accumulation and cell proliferation remains largely unknown.
In this study, we first investigated the role of HMGB2 in the transient accumulation of lipid droplets using a 70% PHx model in wild-type (WT) and HMGB2-knockout (KO) mice. Hepatocyte proliferation was examined by the analysis of cell cycle–specific markers. The accumulation of lipid droplets was examined by Oil Red O (ORO) staining. We also performed in vivo experiments, and confirmed the fin-dings in Hepa 1-6 cells, a mouse hepatocellular carcinoma cell line. The accumulation of lipid droplets and cell proliferation activity were examined in HMGB2-siRNA-transfected cells (HMGB2-knockdo-wn cells) after de novo lipogenesis.
Materials and Methods
Chemicals and Biochemicals
Paraformaldehyde (PFA) was purchased from Merck (Darmstadt, Germany). Trizma base, bovine serum al-bumin (BSA), 3-aminopropyl-triethoxysilane, Triton X-100, tyramine hydrochloride, and Brij L23 were purchased from Sigma Chemical Co. (St Louis, MO). Clariom S microarray chip for mouse, FITC- and rhodamine-succinimidyl esters, and Lipofectamine RNAi-MAX were purchased from Invitrogen (California). 3-(4,5-dimethyl-2-thiazolyl)-2,5-diphenyltetrazolium bromide (MTT) was purchased from Nacalai Tesque (Kyoto, Japan). All other reagents used in this study were purchased from Fujifilm Wako Pure Chemical (Osaka, Japan).
Animals and Tissue Preparation
Male C57BL/6 WT and HMGB2-KO mice (8 weeks old) were used in this study. The ARRIVE Essential 10 guideline was used to formulate study design, sample preparation, result observation, and data analysis. The derivation of genomic HMGB2-KO mouse has been described previously. 17 HMGB2 KO mice, kindly provided by Prof. Marco E. Bianchi (San Raffaele University; Milano, Italy) via Fukuoka University (Fukuoka, Japan), were backcrossed to C57BL/6J WT mice for more than five generations and maintained by heterozygous breeders. Mice were fed normal chow and allowed to drink water ad libitum. The experimental protocol was approved by the Animal Ethics Review Committee of the University of Miyazaki (2018-510-7), and all experiments were performed in accordance with institutional guidelines of the Animal Experiment Committee. Mice were anesthetized by inhalation of isoflurane and 70% PHx was performed using a previously described technique.9,18 After PHx, mice were sacrificed at 0, 12, 24, 36, 48, 72, 120, and 168 hr, and tissues were sampled as described below. Liver tissue was cut into several small pieces and some were snap frozen and kept at −80C until use in microarray, quantitative polymerase chain reaction (qPCR), and Western blotting analysis. The remaining pieces of liver tissue were fixed overnight in 4% PFA in phosphate-buffered saline (PBS) at room temperature and subsequently embedded in paraffin using standard methods. Five to six mice were used in each experimental group.
Immunohistochemistry
Paraffin-embedded tissues were cut into 5-µm-thick sections and placed onto silane-coated slide glasses. The sections were deparaffinized with toluene and rehydrated using a graded ethanol series, and then autoclaved at 120C for 15 min in 10-mM citrate buffer (pH 6.0).19,20 After inhibition of endogenous peroxidase activity with 3% H2O2 in methanol for 30 min, the sections were preincubated with 500-µg/ml normal goat IgG and 1% BSA in PBS for 1 hr to block nonspecific binding of antibodies. The sections were then reacted with the following primary antibodies for 16–17 hr: anti-HMGB2 (cat. no ab124670; Abcam), anti-proliferating cell nuclear antigen (PCNA) (cat. no M0879; Dako), anti-cyclin A2 (cat. no ab181591; Abcam), HNF4α (cat. no ab181604; Abcam), anti-FAT/CD36 (cat. no NB400-144; Novus Bio), antiphosphorylated H3S10 (cat. no #9708; Cell Signaling), and anti–sterol regulatory element-binding protein 1 (SREBP1) (cat. no NB100-2215; Novus Bio). After washing with 0.075% Brij L23 in PBS, the sections were reacted with horse radish peroxidase (HRP)-goat anti-mouse IgG or HRP-goat anti-rabbit IgG for 1 hr. After washing in 0.075% Brij L23 in PBS, the HRP sites were visualized with FITC-conjugated tyramide, and then microwaved at 95C for 15 min in 10-mM citrate buffer (pH 6.0). Then, next primary antibody was reacted for overnight and repeated its detection with rhodamine-conjugated tyramide and then counterstained with 4′,6-diamidino-2-phenylindole (DAPI).6,8 3, 3′-diaminobenzidine (DAB) visualization was used for FAT/CD36 and SREBP1 detection. As a negative control, normal mouse or rabbit IgG was used at the same concentration instead of the primary antibody in each experiment. For immunocytochemistry, anti-pH3S10 (cat. no #9708; Cell Signaling) or cyclin A2 antibodies were reacted for 2 hr, and then, phalloidin (F-actin) and DAPI were stained in all slides. Microphotographs were taken using Olympus DP74 camera and Olympus BX53 light microscope (cellSens Imaging Software, version 3.1). Fluorescent micrographs were taken using DAPI (excitation 360 nm), fluorescein isothiocyanate (FITC) (excitation 470 nm), and tetramethylrhodamine-isothiocyanate (TRITC) (ex-citation 545 nm) filters and Keyence BZ-X700 microscope. Microphotos were taken under 200× or 400× magnification.
qPCR Analysis
Total RNA was extracted from snap frozen liver tissues using Isogen II (Nippon Gene; Tokyo, Japan), as reported previously.21,22 Total RNA was extracted from the Hepa 1-6 cells using the ReliaPrep RNA Tissue Miniprep System (Promega), and RNA was reverse transcribed to cDNA using Moloney murine leukemia virus reverse transcriptase (Invitrogen; Carlsbad, CA). Transcript expression levels were analyzed by an ABI StepOnePlus Real-Time PCR System (Applied Bios-ystems; Waltham, MA) using Fast SYBR Green (App-lied Biosystems). β-Actin was used for normalization, and relative gene expression was calculated using the 2 −ΔΔct method. The primer pairs were listed in Appendix Fig. 4.
Microarray
RNA was isolated from WT and HMGB2-KO mouse livers (n=3 each), and cRNA was prepared as described previously. 9 Fifteen micrograms of fragmented cRNA from each sample was hybridized to a preequilibrated Clariom S mouse microarray chip, which was then washed, stained, and scanned in an HP ChipScanner (Affymetrix Inc.; Santa Clara). Data normalization was performed using GeneSpring (Agilent Technologies; Santa Clara, CA). All entities (22,206 genes) were filtered based on significant changes in gene expression between WT and HMGB2 KO mouse livers. Data were analyzed in Transcriptome Analysis Console software (version 4.0.2.15; Thermo Fisher Scientific).
Cell Culture
To evaluate the HMGB2 role in vitro analysis, mouse hepatocyte carcinoma cells (Hepa 1-6) were selected and maintained in Dulbecco’s Modified Eagle’s Medium with
MTT Assay
Cell viability was examined by the 3-(4,5-dimethylthiazol-2-yl)-2,5-diphenyl-2H-tetrazolium bromide (MTT) assay as described previously. 24 Briefly, cells were seeded in a 96-well plate at a density of 2 × 10³ cells/well and incubated at 37C overnight. Hepa 1-6 cells were incubated at 37C for 1, 2, and 3 days, and after adding MTT solution (5 mg/ml), the cells were incubated at 37C for 2 hr. After removal of the MTT reagent, DMSO was used to dissolve the formazan crystals. The resulting intracellular purple formazan was quantified with a spectrophotometer at an absorbance of 562 nm using Multimode detector DTX 800 (Beckman Coulter).
ORO Staining
Fresh frozen liver tissues of 5 µm thickness were cryosectioned. After completely dried out, sections were fixed with 4% PFA, and then stained with ORO in 60% isopropanol. Hematoxylin was used for counterstaining.
De Novo Lipogenesis
In Hepa 1-6 cells, de novo lipogenesis was induced by adipogenic cocktail containing 10-μg/ml insulin, 1-μM dexamethasone, and 0.5-mM 3-isobutyl-1-methylxanthine (IBMX). 25 Cells were fixed on differentiation day 1, 3, and 7, and lipid droplets were stained with BODIPY 493/503 (Invitrogen) and nuclei were counterstained with DAPI (Invitrogen). In some experiments, 0.6-mM oleic acid was added into culture medium to induce the accumulation of lipid droplets in Hepa 1-6 cells. 26 After 24 hr, the accumulation of lipid droplets was confirmed by ORO and BODIPY stainings.
PAS Staining
For glycogen detection, periodic acid–Schiff (PAS) staining was performed after PCNA staining in liver sections by incubation in 0.5% periodic acid for 5 min followed by staining with Schiff’s reagent for 15 min, followed by Mayer’s hematoxylin staining for 1 min.
Western Blot Analysis
Liver tissues were homogenized in hot SDS lysis buffer with a glass-teflon homogenizer, as described previously. 27 After centrifugation of the homogenate at 15,000 rpm for 30 min at 4C, the supernatant was collected and stored at −80C. The protein concentration in each preparation was determined using a bicinchoninic acid (BCA) assay kit. Lysate containing 20 µg of protein was separated by 10% SDS-PAGE, and the proteins were electrophoretically transferred onto polyvinylidene fluoride membranes. The membranes were blocked with 5% non-fat milk in Tris-buffered saline (TBS; 20-mM Tris buffer pH 7.6, 150-mM NaCl) for 1 hr at room temperature and then incubated overnight with anti-PCNA, cyclin A2, FAT/CD36, and SREBP1c antibodies diluted with TBS/0.05% Triton X-100 buffer. As a secondary antibody, HRP-goat anti-rabbit IgG or HRP-goat anti-mouse IgG was diluted with TBS buffer for 1 hr, and the membranes were washed 3× for 10 min each with TBS/0.05% Triton X-100 buffer. Bands were visualized with DAB, Ni, Co, and H2O2. 7 Densitometric analysis was performed using ImageJ software (NIH; Bethesda, Maryland). β-Actin was used as an internal standard in each lane for normalization of target protein expression. Original scanned images were quantified for bands of the appropriate molecular weight, excluding minor bands. For the figures, contrast was adjusted to match (Fig. 1F, HMGB2-KO was noted to have been overexposed with resultant high background).
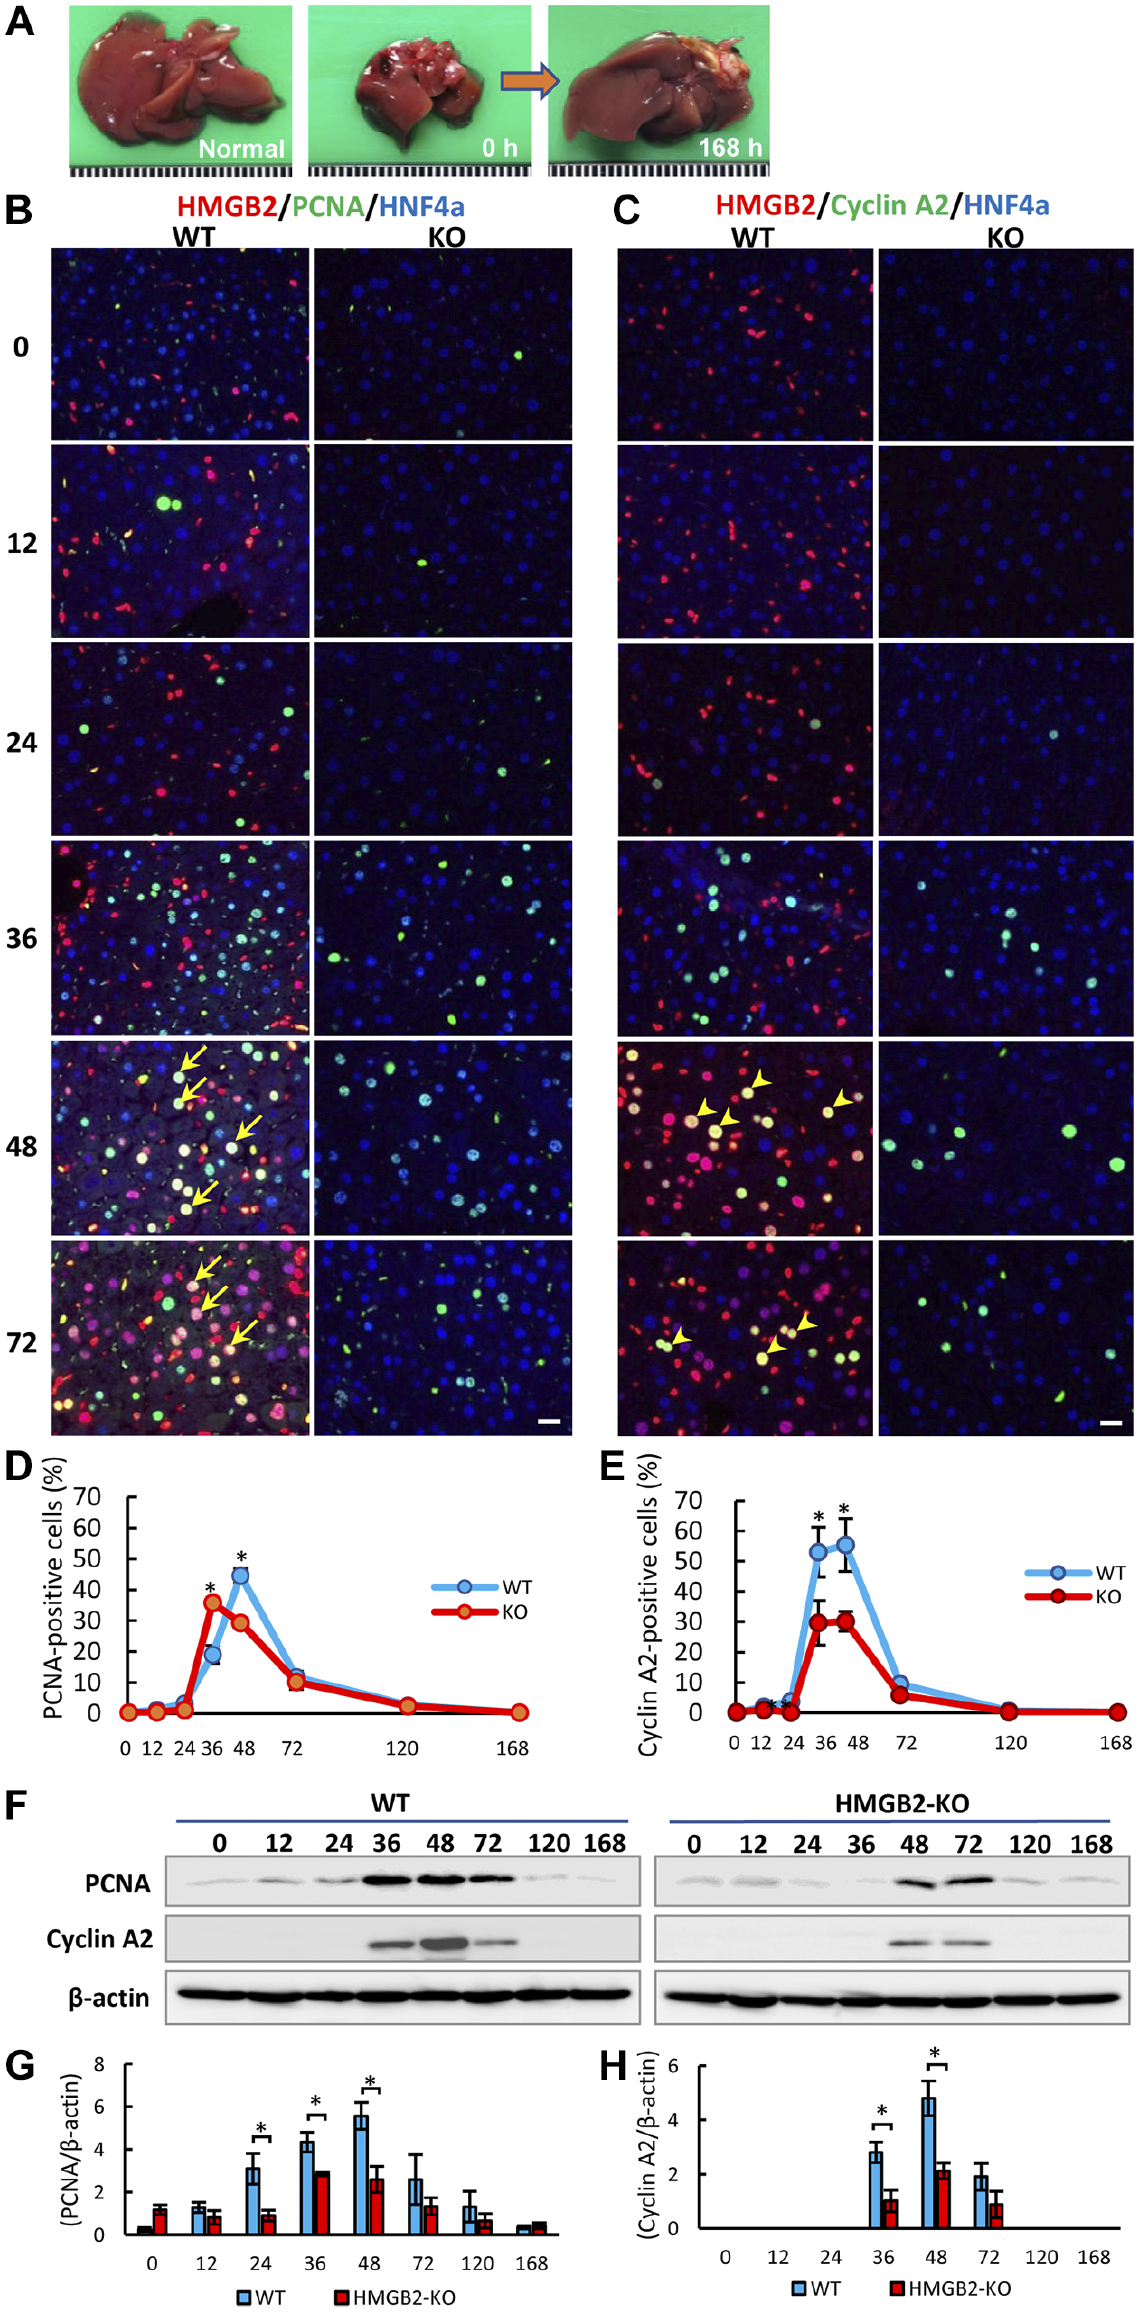
HMGB2 expression in mouse liver during regeneration. (A) Mouse model of liver regeneration. Macrophotography includes intact liver, remnant liver after 70% PHx, and regenerated liver after 168 hr, respectively. Liver tissues were sampled at 0, 24, 36, 48, 72, 120, and 168 hr after PHx. Immunofluorescence for HMGB2 (red), PCNA (green) (B) / Cyclin A2 (green) (C) and HNF-4α (blue) in WT and HMGB2-KO mouse livers after PHx. Arrows indicate double-positive hepatocytes for HMGB2 and PCNA. Arrowheads indicate double-positive hepatocytes for HMGB2 and Cyclin A2. Scale bar 20 μm. The number of PCNA- (D) and Cyclin A2-positive (E) hepatocytes was counted at each time-point after PHx. Data represent the mean ± SEM from four mice per group. (F) Western blotting of PCNA and Cyclin A2 in WT and HMGB2-KO mouse livers after PHx. Densitometry analysis of PCNA (G) and Cyclin A2 (H) expression. Asterisks indicate statistically significant differences (*p<0.05), Student’s t-test (two tailed).
Quantitative Analysis
To count PCNA and cyclin A2-positive hepatocytes, we used HNF4a-positive cells, which is hepatocyte-specific marker. The number of hepatocytes and proliferating cells was counted in 10 random high-magnification fields per mouse using ImageJ software. In Hepa 1-6 cells, the number of pH3S10 and cyclin A2-positive cells was counted in 10 random areas (magnification 200×) from each experiment. Immunocytochemistry for pH3S10 and cyclin A2 was repeated by three independent experiments. Lipid droplets in ORO staining were measured in five mice (five random high-magnification fields per mouse), and ORO-positive stained areas were analyzed by ImageJ using color deconvolution plug-in and results were revealed as percentage.
Statistical Analysis
All data are expressed as mean ± standard error of the mean (SEM). Statistical significance was assessed using the Student’s t-test. A value of p<0.05 was considered to be statistically significant. All analyses were performed with Statistical Package for the Social Sciences (version 20; IBM Corp., Armonk, NY). MTT assay and the accumulation of lipid droplets were calculated by GraphPad Prism 10.
Results
HMGB2 Is Crucial for Liver Regeneration
To investigate the role of HMGB2 in mouse liver regeneration, we performed 70% PHx in WT and HMGB2-KO mice, and remnant liver tissues were sampled at various time-points (Fig. 1A). Immunofluorescence of HMGB2, PCNA, and HNF4α was performed to examine the expression of HMGB2 during liver regeneration. In WT mouse livers, double-positive cells for HMGB2 and PCNA were mostly found at 48 and 72 hr after PHx. There were significantly fewer PCNA-positive cells in HMGB2-KO mouse livers than in WT mouse livers (Fig. 1B, D). HMGB2-positive cells were not detected in HMGB2-KO mouse livers, indicating the complete depletion of the target gene. The quantitative analysis of PCNA by Western blotting revealed a significant decrease in PCNA in the HMGB2-KO mouse livers at 24–48 hr after PHx (Fig. 1F, G). The number of proliferating cells did not differ significantly at 120 and 168 hr (micrographs are not shown). These findings were confirmed by the staining of cyclin A2, which is another key regulator of the cell cycle. Both immunohistochemistry (Fig. 1C, E) and Western blotting (Fig. 1F, H) results demonstrated that cyclin A2 expression was significantly decreased at 36 and 48 hr after PHx in HMGB2-KO mouse livers when compared with WT mouse livers. Indeed, faint bands were detected at 12, 24, and 36 hr in HMGB2-KO mouse livers at the different molecular weight. Therefore, we did not include in densitometry analysis.
Transient Accumulation of Lipid Droplets in WT and HMGB2-KO Mouse Livers
We searched the reason of differences in liver regeneration between the WT and HMGB2-KO mice. First, we performed a microarray analysis to screen for significant differentially expressed genes (DEGs) between intact WT and HMGB2-KO mouse livers (Fig. 2A). Pathway analysis revealed that the DEGs were related to lipid metabolism, such as PPAR signaling and SREBF in cholesterol and lipid homeos-tasis. The DEGs included Srebf1, Hsd17b1, Pltp, Mef2a, Cyp4a10, and Cyp4a31, which are crucial transcription factors and regulators of lipid metabolism in the liver (Fig. 2B). Second, we performed ORO staining to detect lipid droplets in the hepatocytes of regenerating livers (Fig. 2C). In WT mouse livers, intense accumulation of lipid droplets was seen at 12 hr; it decreased at 24 hr after PHx and was not detectable at the subsequent time-points during liver regeneration. Interestingly, in HMGB2-KO mouse livers, the amount of lipid droplets significantly decreased at 12 and 24 hr; however, it was still preserved at 36 hr after PHx (Fig. 2C, D). Key regulators and transcription factors of hepatic lipid metabolism were examined by qPCR. Significantly decreased expression of perilipin 2 mRNA was found at 12 hr after PHx in the HMGB2-KO mouse livers (Fig. 2E). Moreover, at 36 and 48 hr after PHx, PPARg and CEBPb mRNA expression was significantly higher in HMGB2-KO mouse livers than in WT mouse livers (Fig. 2F, G). These results demonstrated that HMGB2 is important for the transient accumulation of lipid droplets in hepatocytes, and that this transient accumulation may affect liver regeneration.
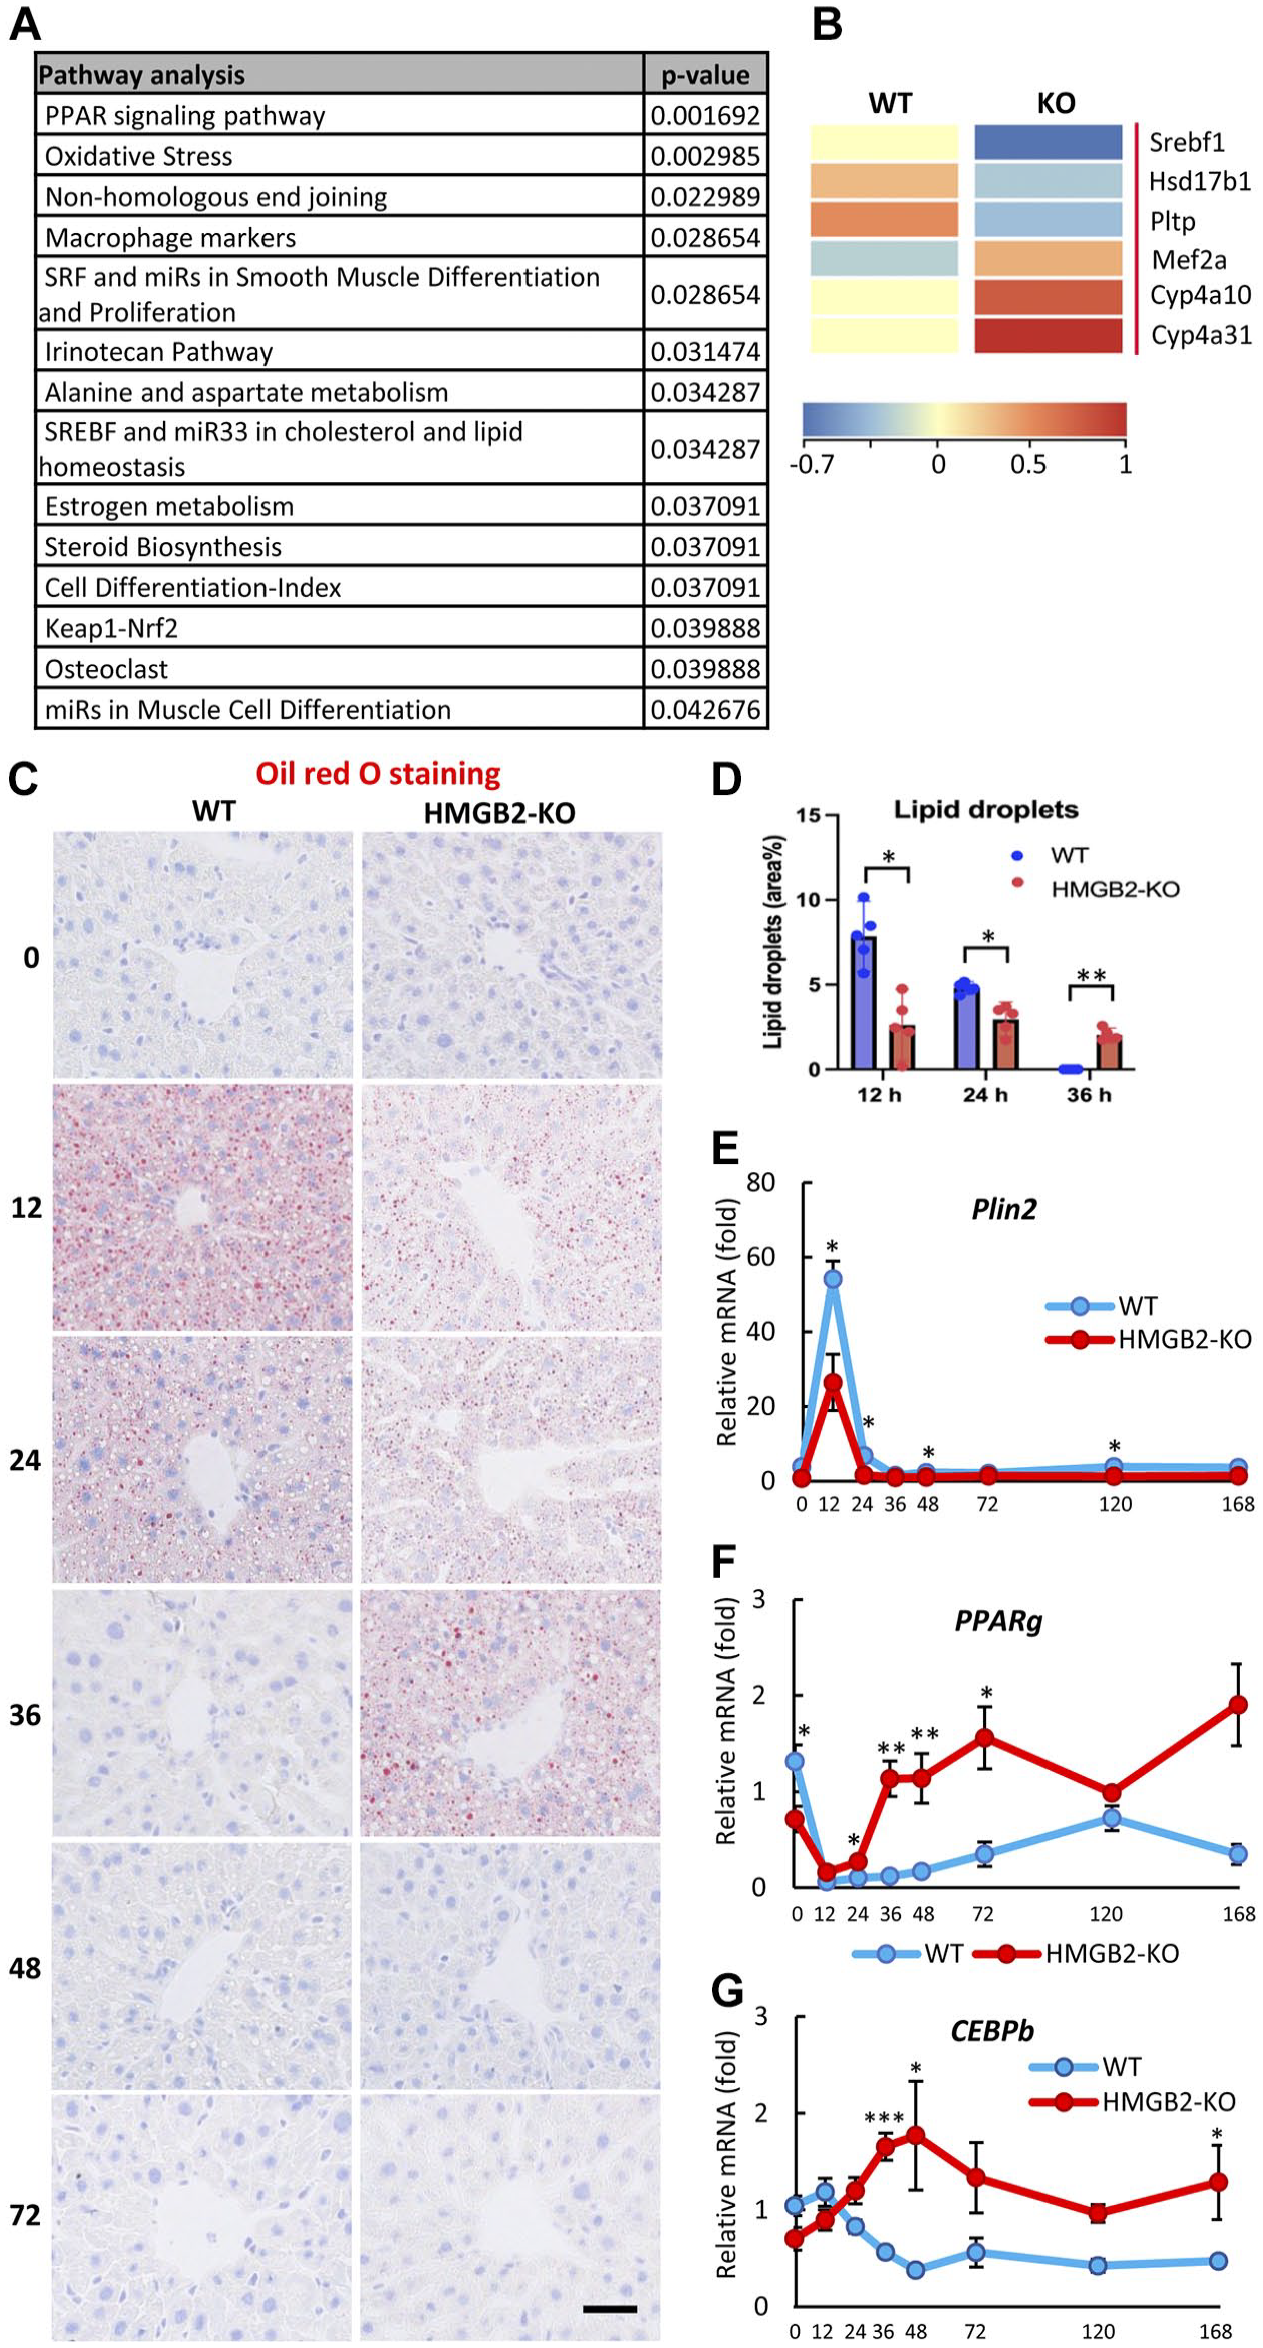
Transient accumulation of lipid droplets during mouse liver regeneration. (A) Microarray analysis in WT and HMGB2-KO mouse livers. Pathway analysis of genes that were significantly decreased in HMGB2-KO mouse livers. (B) Heatmap of genes that involved in hepatic lipid metabolism. Microarray results were analyzed in Transcriptome Analysis Console software (version 4.0.2.15; Thermo Fisher Scientific) https://www.thermofisher.com/jp/en/home/global/forms/life-science/download-tac-software.html. (C) ORO staining in WT and HMGB2-KO mouse livers after 70% PHx. Scale bar 50 μm. (D) Lipid droplets are quantified by ImageJ and results revealed as percentage of positive areas. qPCR analysis of Plin2 (E), PPARg (F), and CEBPb (G) mRNA in WT and HMGB2-KO mouse livers. Data represent the mean ± SEM from four mice per group. Asterisks indicate statistically significant differences.
Decreased Fatty Acid Intake in HMGB2-KO Mouse Hepatocytes
To better understand the differential accumulation of lipid droplets in the WT and HMGB2-KO mouse livers, we examined the expression of fatty acid translocase/CD36 (FAT/CD36) by immunohistochemistry. In WT mouse livers, FAT/CD36 localized to the hepatocyte membrane, and intense staining was found at 12 hr, then decreased gradually thereafter (Fig. 3A). There are no obvious changes in FAT/CD36 expression in periportal area in WT and HMGB2-KO mouse livers (Appendix Fig. 1). In HMGB2-KO mouse livers, intense staining was found at 12 hr after PHx then decreased significantly. Western blotting confirmed the significant decrease in FAT/CD36 at 24–48 hr after PHx in HMGB2-KO mouse livers when compared with WT mouse livers (Fig. 3C, D). Next, we performed immunohistochemistry for PCNA and PAS staining to examine the intracellular glycogen content in the regenerating livers (Fig. 3B). In the normal state, glycogen enrichment was found in both WT and HMGB2-KO mouse livers. Interestingly, the states of glycogen depletion and enrichment alternated in cycles during liver regeneration in WT mice livers. In HMGB2-KO mouse livers, the glycogen depletion was continued from 12 to 36 hr, and enrichment was started at 48 hr. These time-points corresponded to the times of peak proliferation activity in the HMGB2-KO mouse livers. Indeed, PCNA-positive cells were mostly appeared in glycogen-depleted cells during liver regeneration (Appendix Fig. 2).
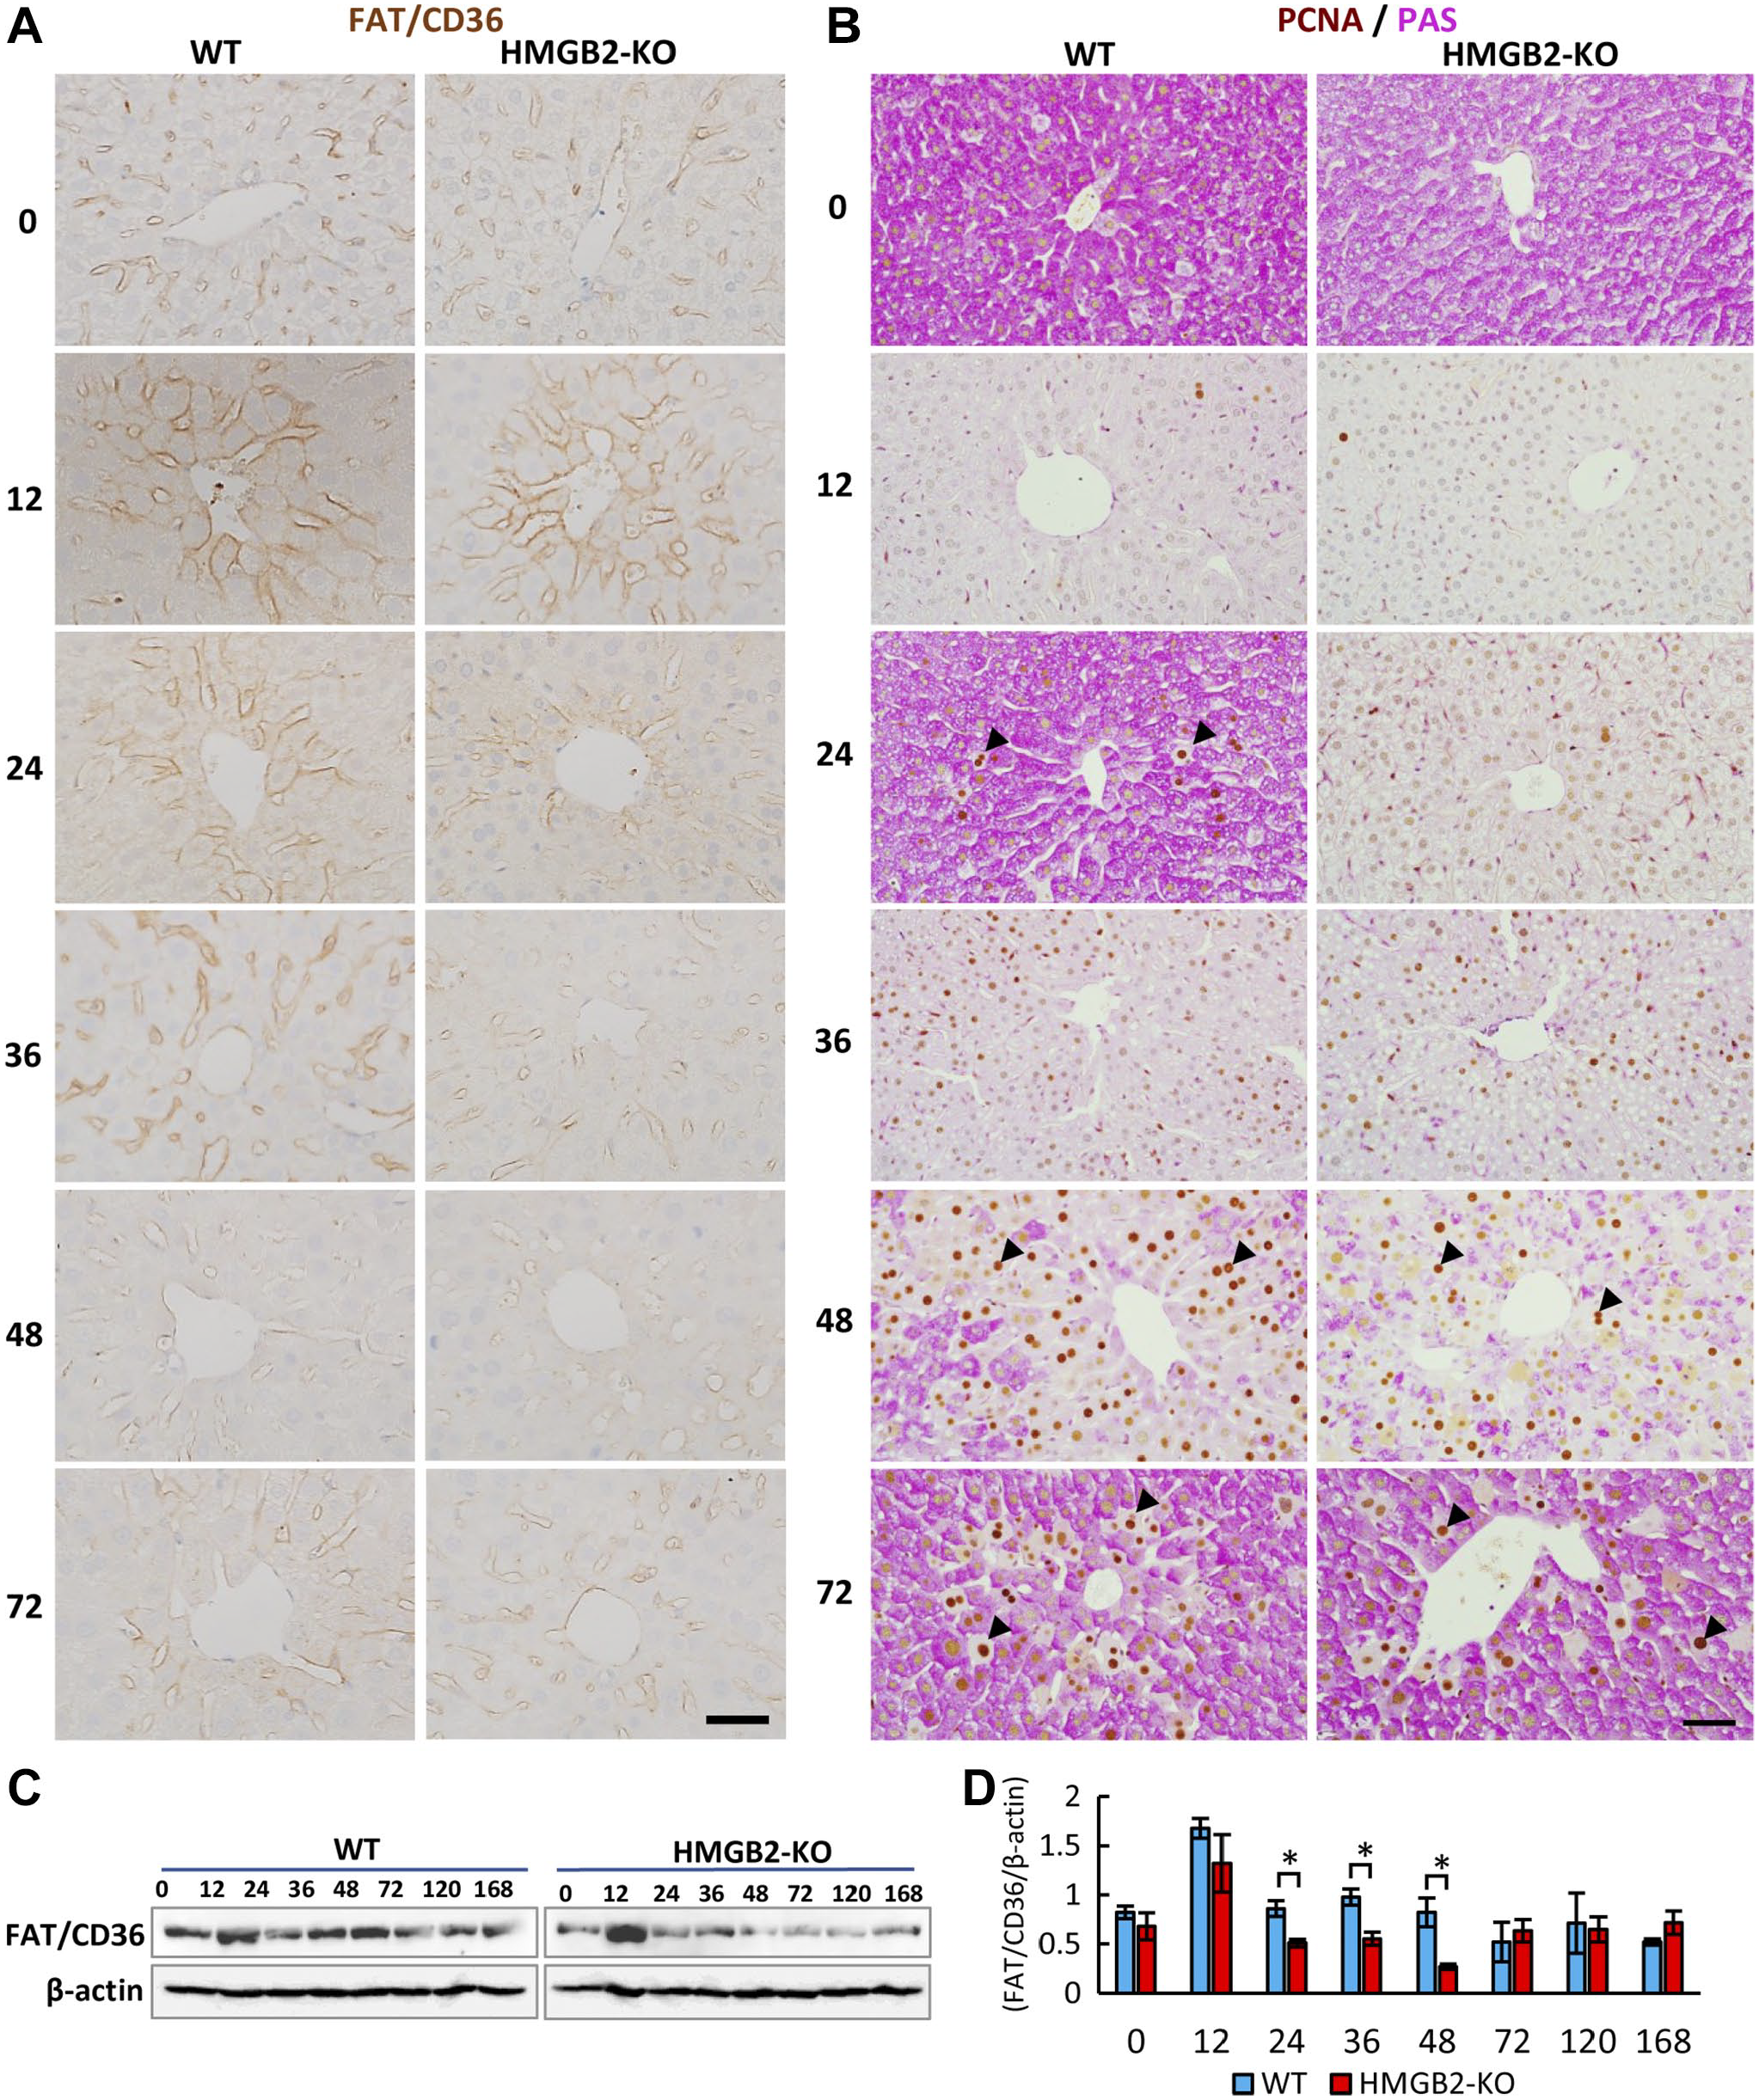
Expression of FAT/CD36 during liver regeneration. (A) Immunohistochemical localization of FAT/CD36 surrounding central vein area in WT and HMGB2-KO mouse livers after PHx. Scale bar 50 μm. (B) immunohistochemistry for PCNA and PAS staining in WT and HMGB2-KO mouse livers after PHx. (C) Western blotting of FAT/CD36 in WT and HMGB2-KO mouse livers after PHx. (D) Densitometry analysis. Data represent the mean ± SEM from four mice per group. Asterisks indicate statistically significant differences (*p<0.05), Student’s t-test (two tailed).
Next, the expression of SREBP1c, which is a master regulator of the lipogenic pathway, was examined by immunohistochemistry. In both WT and HMGB2-KO mouse livers, SREBP1c localized to the cytoplasm of hepatocytes, and the SREBP1c level was increased at 12 hr and then decreased significantly thereafter (Fig. 4A). Western blotting results confirmed the significantly higher expression level of SREBP1c at 12 hr in the WT mouse livers when compared with the HMGB2-KO mouse livers (Fig. 4B, C). Altogether, these results suggest that HMGB2 is important for fatty acid intake and hepatic lipid metabolism.
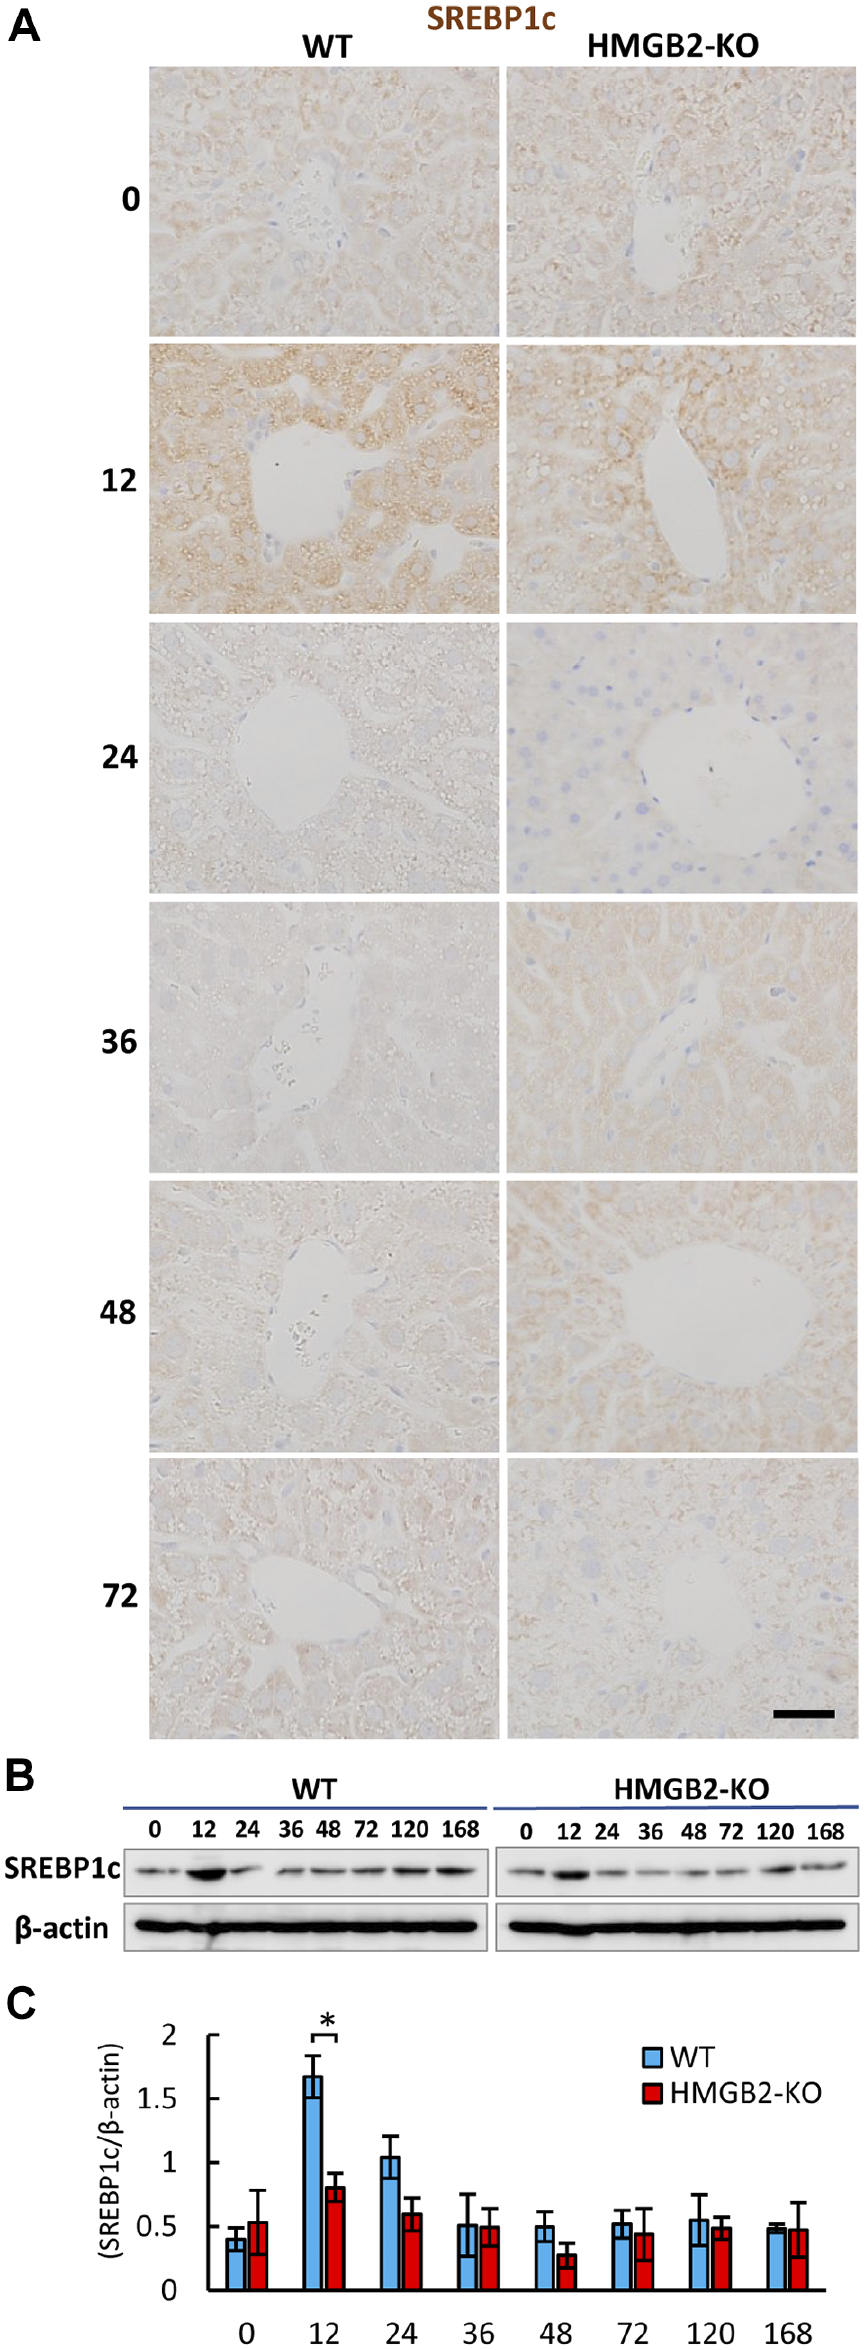
Expression of SREBP1c during liver regeneration. (A) Immunohistochemical localization of SREBP1c in WT and HMGB2-KO mouse livers after PHx. Scale bar 50 μm. (B) Western blotting of SREBP1c in WT and HMGB2-KO mouse livers after PHx. (C) Densitometry analysis. Data represent the mean ± SEM from four mice per group. Asterisks indicate statistically significant differences (*p<0.05), Student’s t-test (two tailed).
HMGB2 Is Important for Cell Proliferation
We performed MTT assay on days 1–3 to examine the cell proliferation activity in the HMGB2-knockdo-wn cells. On day 3, the cell proliferation activity was significantly lower in the HMGB2-knockdown cells than in the control cells (Fig. 5A). Moreover, we pe-rformed immunofluorescence staining to localize pH3S10, a marker of the M phase of the cell cycle, in the control and HMGB2-knockdown cells. The results revealed that there were significantly less pH3S10-positive cells among the HMGB2-knockdown cells than among the control cells (Fig. 5B, D). Similar findings were also seen from the immunofluorescence staining of cyclin A2 (Fig. 5C, E). Quantitative analysis of pH3S10- and cyclin A2-positive cells revealed that on day 3, there were significantly less pH3S10- and cyclin A2-positive cells among the HMGB2-knockdown cells than among the control cells. Taken together, the in vivo and in vitro experimental results indicated that HMGB2 is important for hepatocyte cell proliferation.
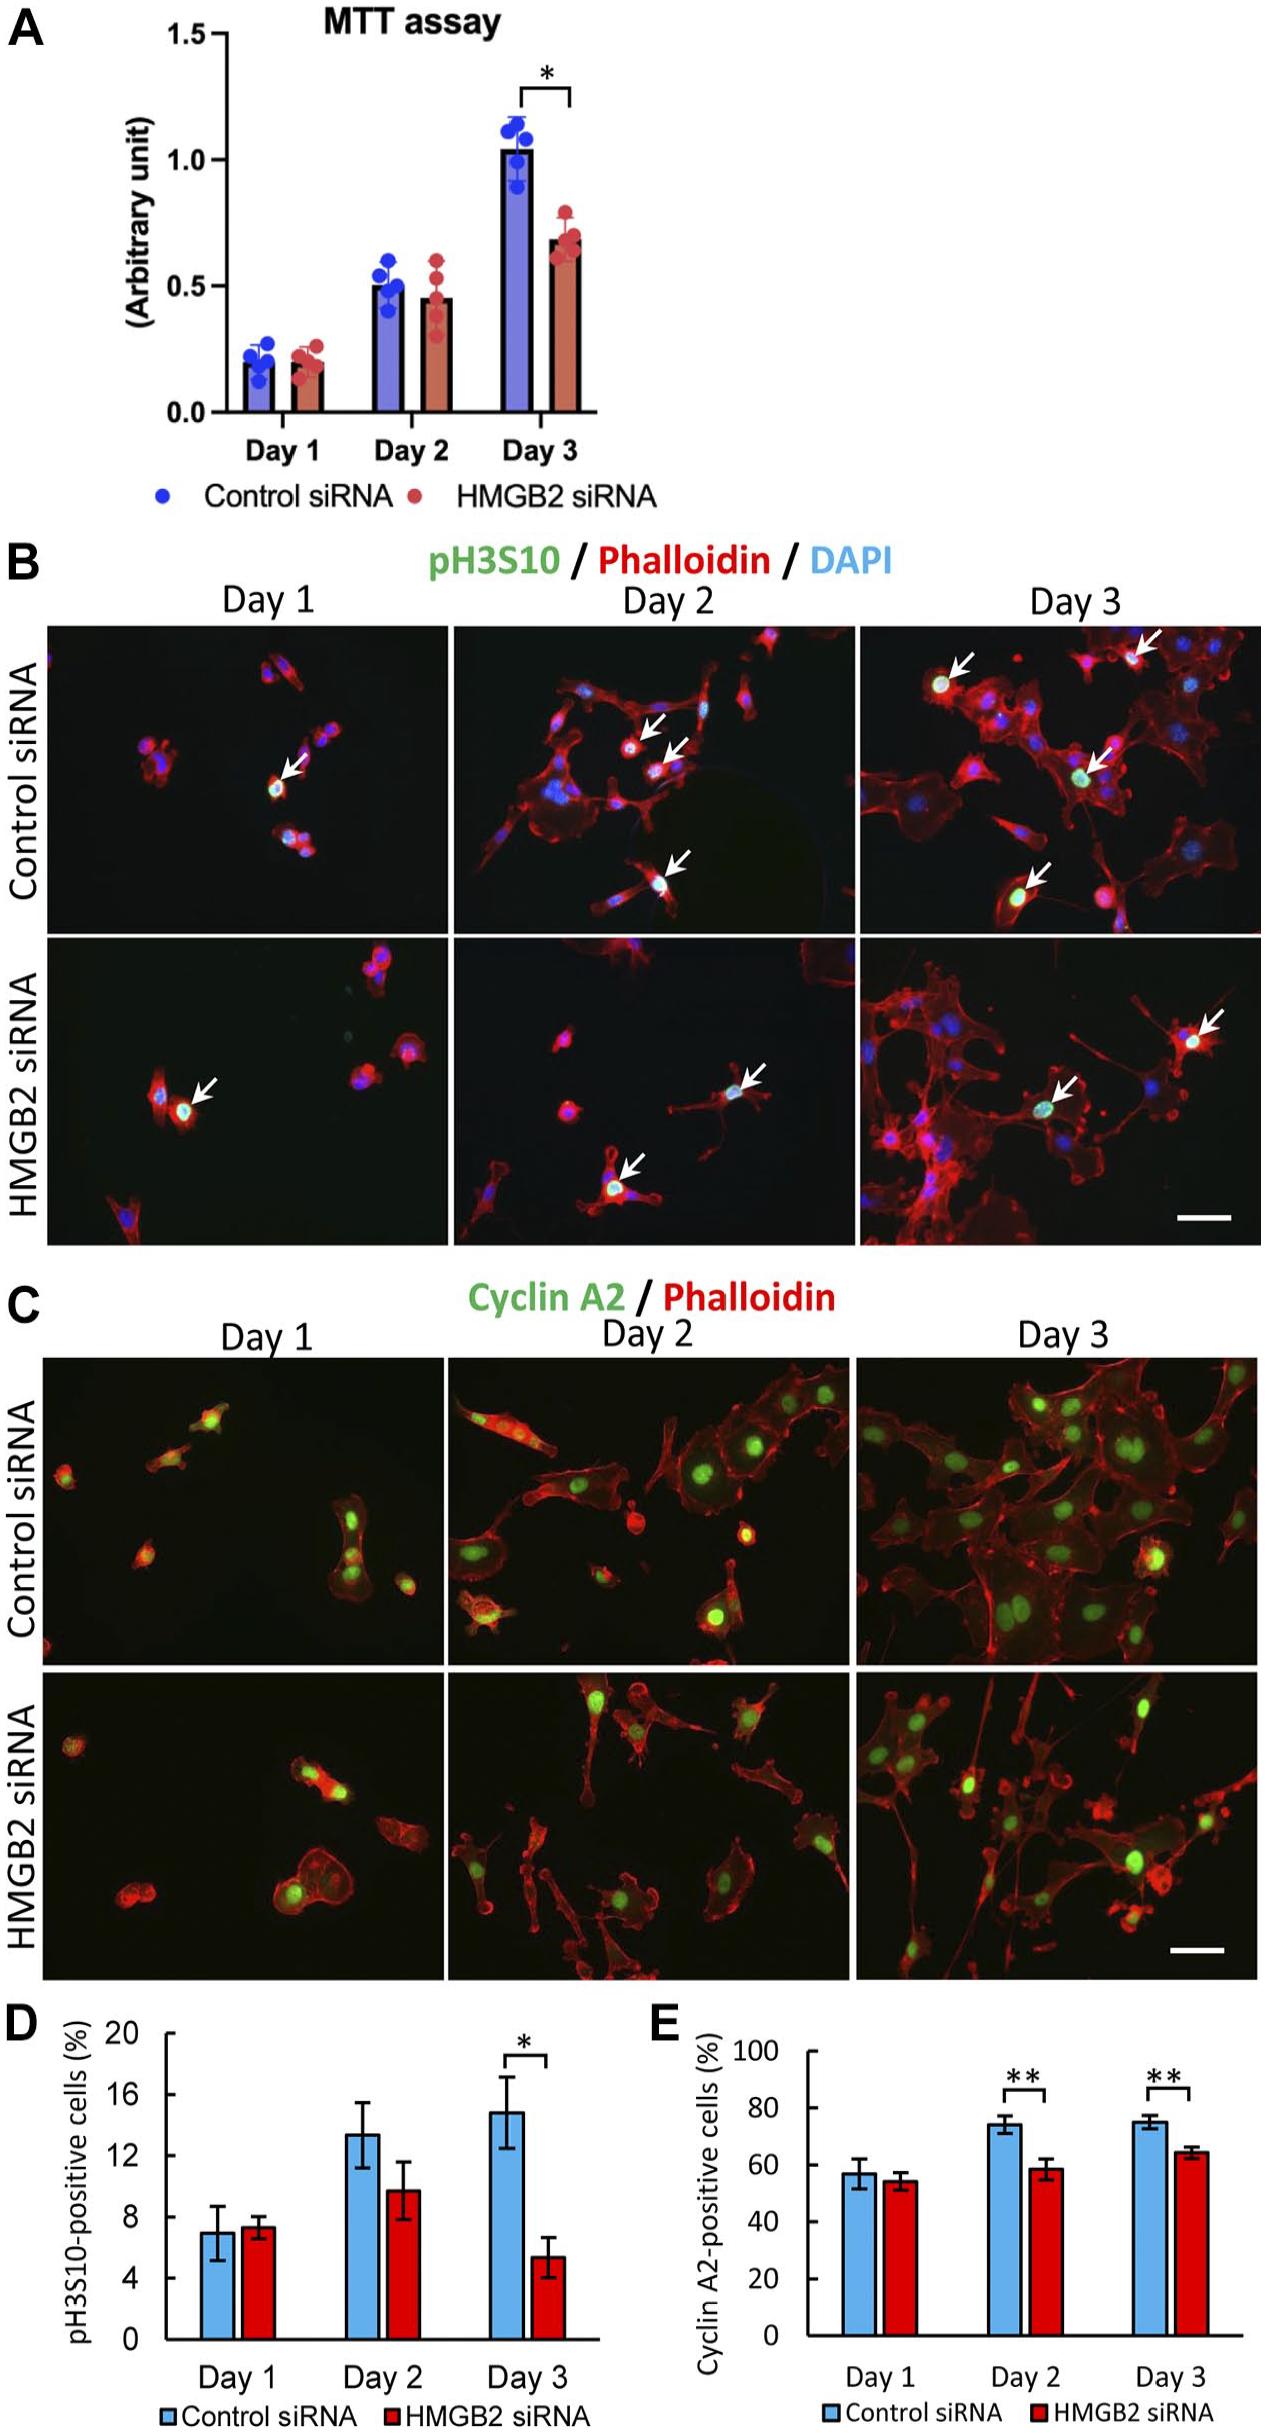
Cell proliferation activity in Hepa 1-6 cells after HMGB2-knockdown. (A) MTT assay in control- and HMGB2-siRNA-transfected cells. Immunofluorescence for pH3S10 (B) or cyclin A2 (C) and phalloidin in control- and HMGB2-siRNA-transfected cells. Nuclei were counterstained with DAPI (blue). Scale bar 50 μm. Counting results of pH3S10- (D) and cyclin A2-positive cells (E) after control and HMGB2-siRNA transfection. Data represent the mean ± SEM from three independent experiments. Asterisks indicate statistically significant differences (*p<0.05, **p<0.01), Student’s t-test (two tailed).
Decreased Lipid Droplets and Cell Proliferation in HMGB2-Knockdown Cells
The transient accumulation of lipid droplets in hepatocytes is considered to be crucial for cell proliferation as cholesterol acts as a source material for new cell membranes, while triglycerides and fatty acids act as energy sources that are required for hepatocyte proliferation.28,29 Therefore, we hypothesized that an insufficient accumulation of lipid droplets would lead to decreased cell proliferation in HMGB2-KO mice. To confirm this hypothesis, the HMGB2 gene was kn-ocked down by HMGB2 siRNA in Hepa 1-6 cells, a mouse hepatocellular carcinoma cell line. After transfection of the HMGB2 siRNA, de novo lipogenesis and cell proliferation activity were examined in the Hepa 1-6 cells (Fig. 6A). In the control siRNA-transfected cells, lipid droplet accumulation could be seen at days 1 and 3, and then the amount of lipid droplets dec-reased at day 7. Similar to the in vivo results (Fig. 2C), HMGB2 siRNA transfection induced a decrease in the accumulation of lipid droplets in the Hepa 1-6 cells. We examined the HMGB2-knockdown efficiency, and found 50%, 74%, and 20% knockdown on days 1, 3, and 7 of de novo lipogenesis, respectively (Fig. 6B). These findings indicated that the HMGB2-knockdown efficiency peaked on days 1 and 3 of de novo lipogenesis. Next, we performed qPCR to examine the key molecules of lipid metabolism in hepatocytes (Fig. 6C to I). The results indicated that the expression levels of genes related to fatty acid transporters (FAT/CD-36, FATP1, LDLR), transcription factors (SREBP1c, CEBPb), and fatty acid synthesis (Plin2, FASN) we-re significantly decreased in the HMGB2-knockdown cells. Interestingly, microarray results revealed that PPAR signaling was significantly downregulated in HMGB2-KO mouse liver (Fig. 2A). To examine the relationship of HMGB2 and PPARα, we performed PPARα-knockdown and examined the expression of HMGB2 in Hepa 1-6 cells. Lipid droplets were not accumulated in PPARa-knockdown cells (Appendix Fig. 3A). Moreover, the expression of HMGB2 and FAT/CD36 mRNA was decreased in PPARα-knock-down cells (Appendix Fig. 3C, D).
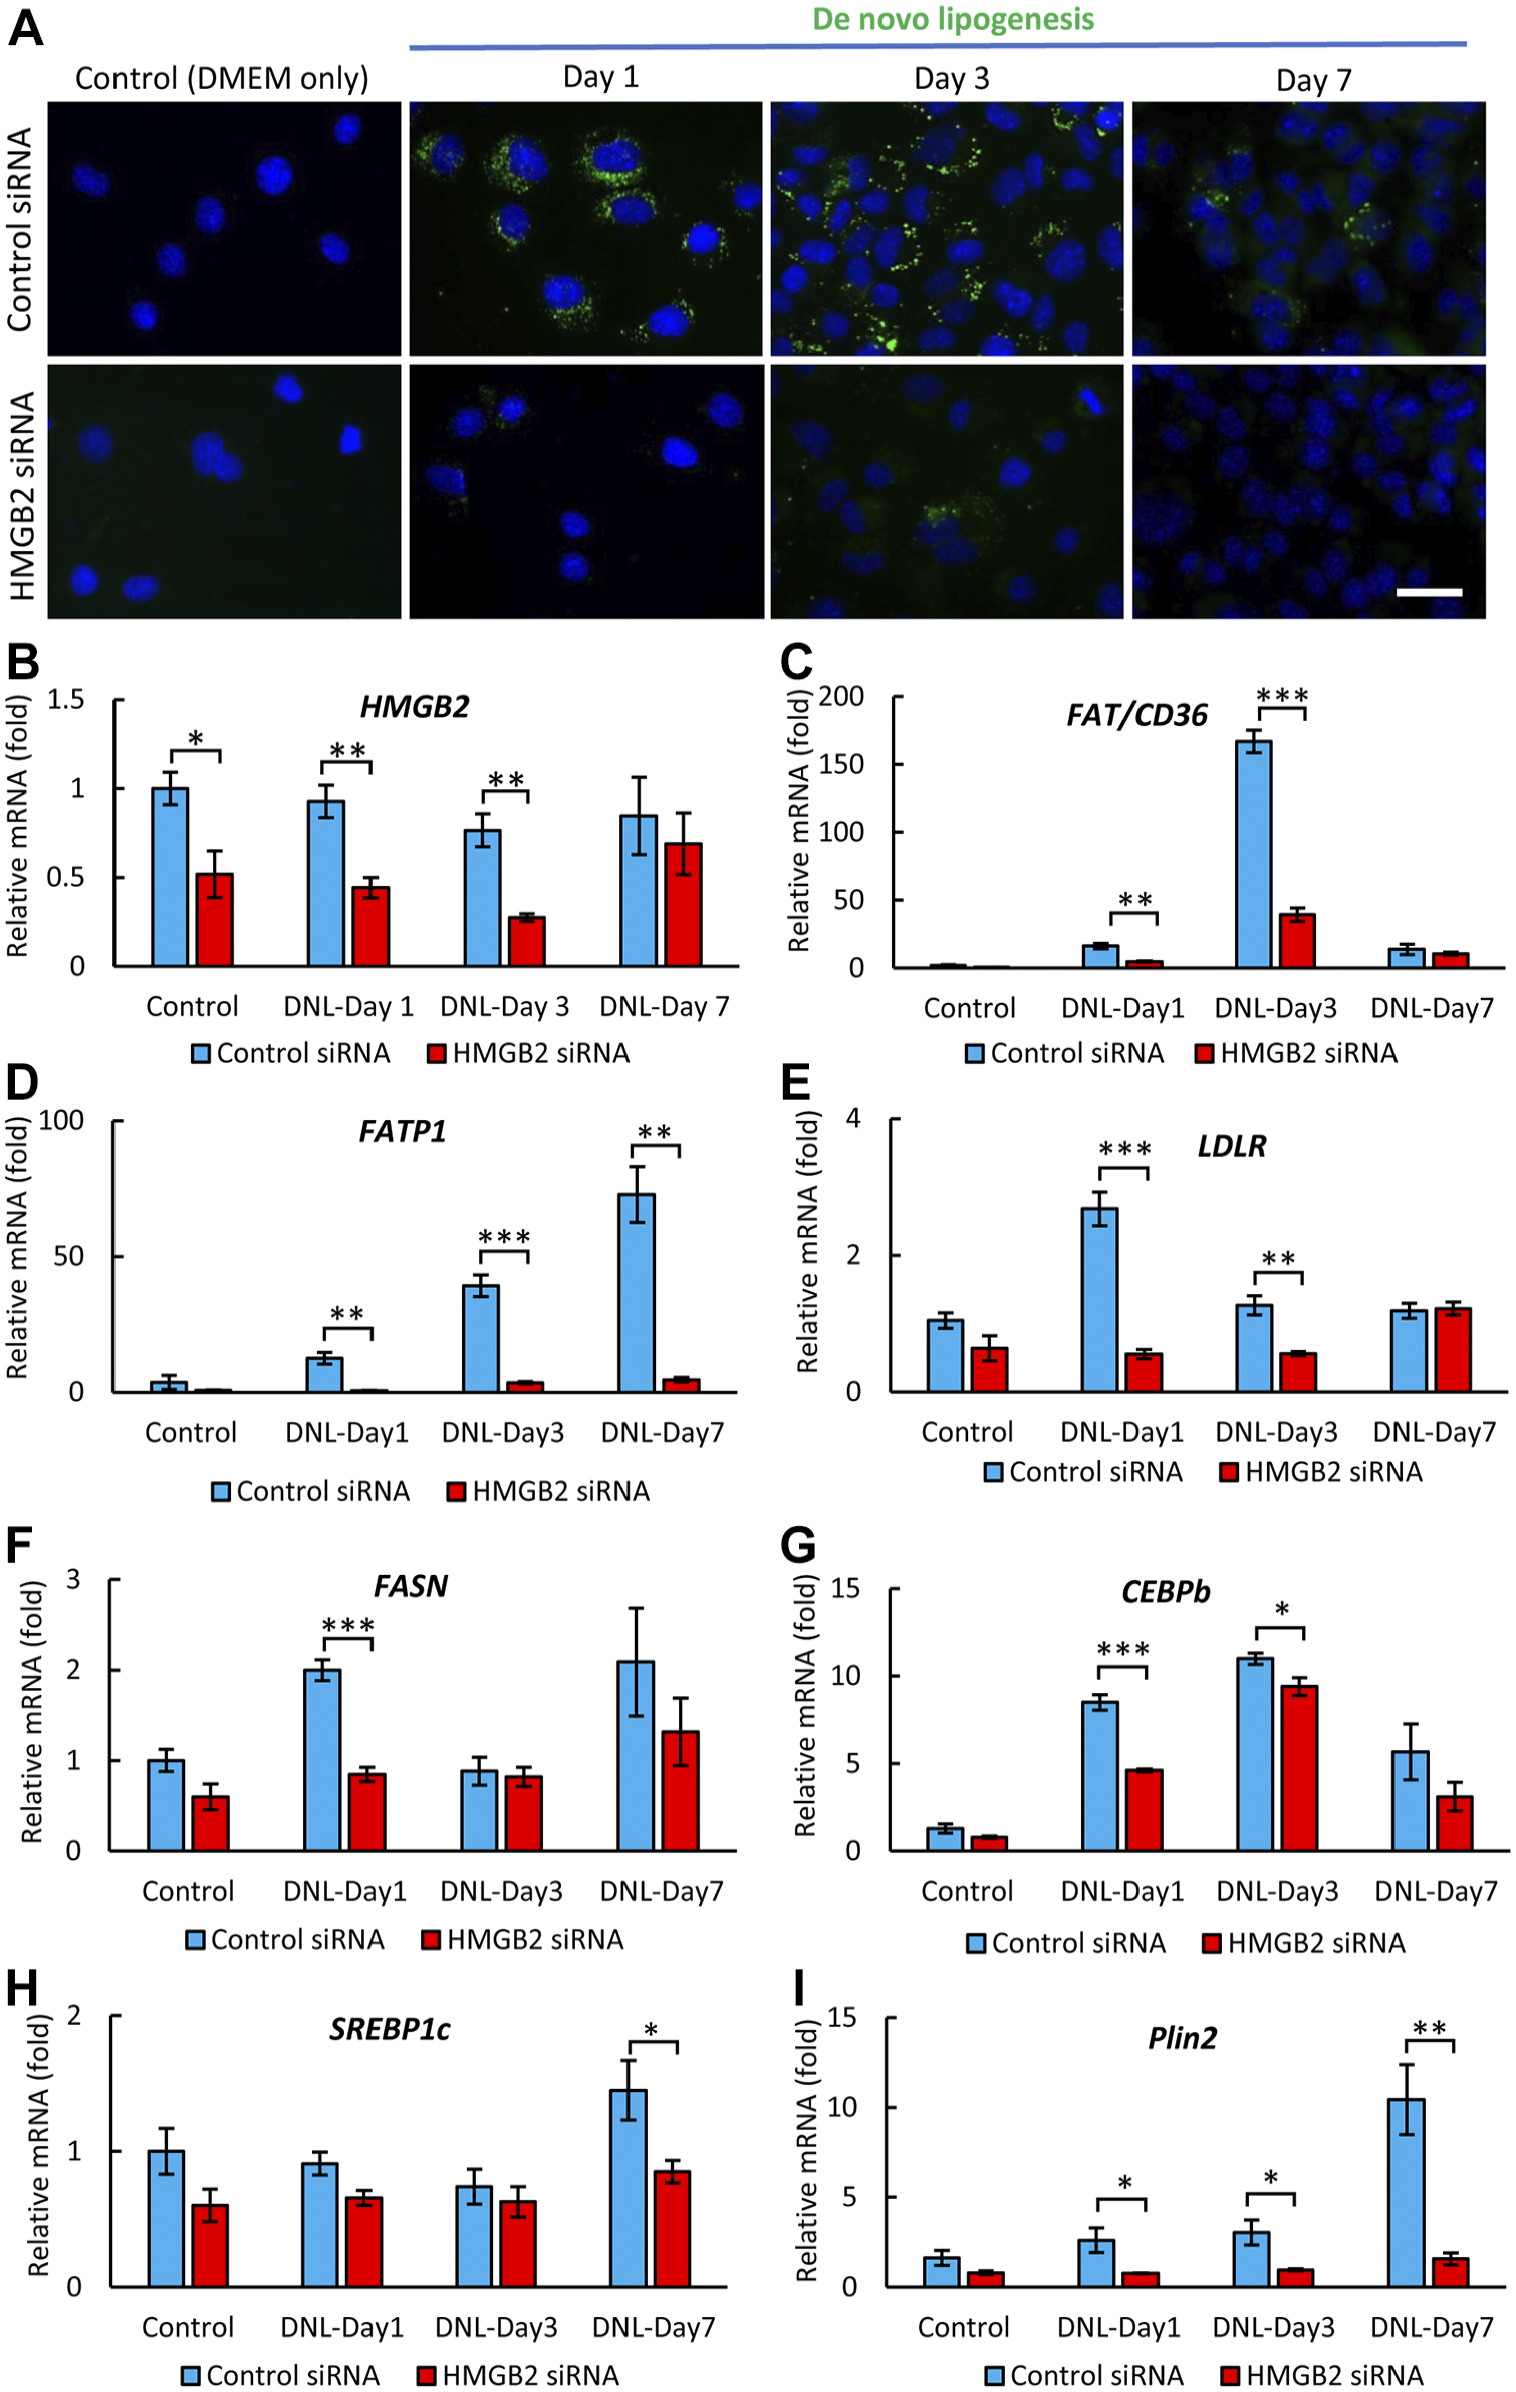
De novo lipogenesis in Hepa 1-6 cells after HMGB2-gene knockdown. (A) BODIPY staining (green) in Hepa 1-6 cells after transfection with control and HMGB2-siRNA. Control cells were treated with control siRNA or HMGB2 siRNA for 1 day (without de novo lipogenesis). Cells were analyzed on day 1, 3, and 7 days after DNL. Nuclei were counterstained with DAPI (blue). Scale bar 20 μm. qPCR analysis of HMGB2 (B), FAT/CD36 (C), FATP1 (D), LDLR (E), FASN (F), CEBPb (G), SREBP1c (H), and Plin2 (I) mRNAs in control and HMGB2-siRNA-transfected cells. Data represent the mean ± SEM from 4 independent experiments. Asterisks indicate statistically significant differences (*p<0.05, **p<0.01, ***p<0.001 Student’s t-test (two tailed). (*p<0.05).
To further examine the cell proliferation activity, we performed qPCR for cyclin A2, B1, and D1, which are key molecules of cell division (Fig. 7A to C). These cyclin molecules indicate different stages of the cell cycle. The levels of all three cyclin molecules were significantly decreased in the HMGB2-knockdown cells on days 1–7.
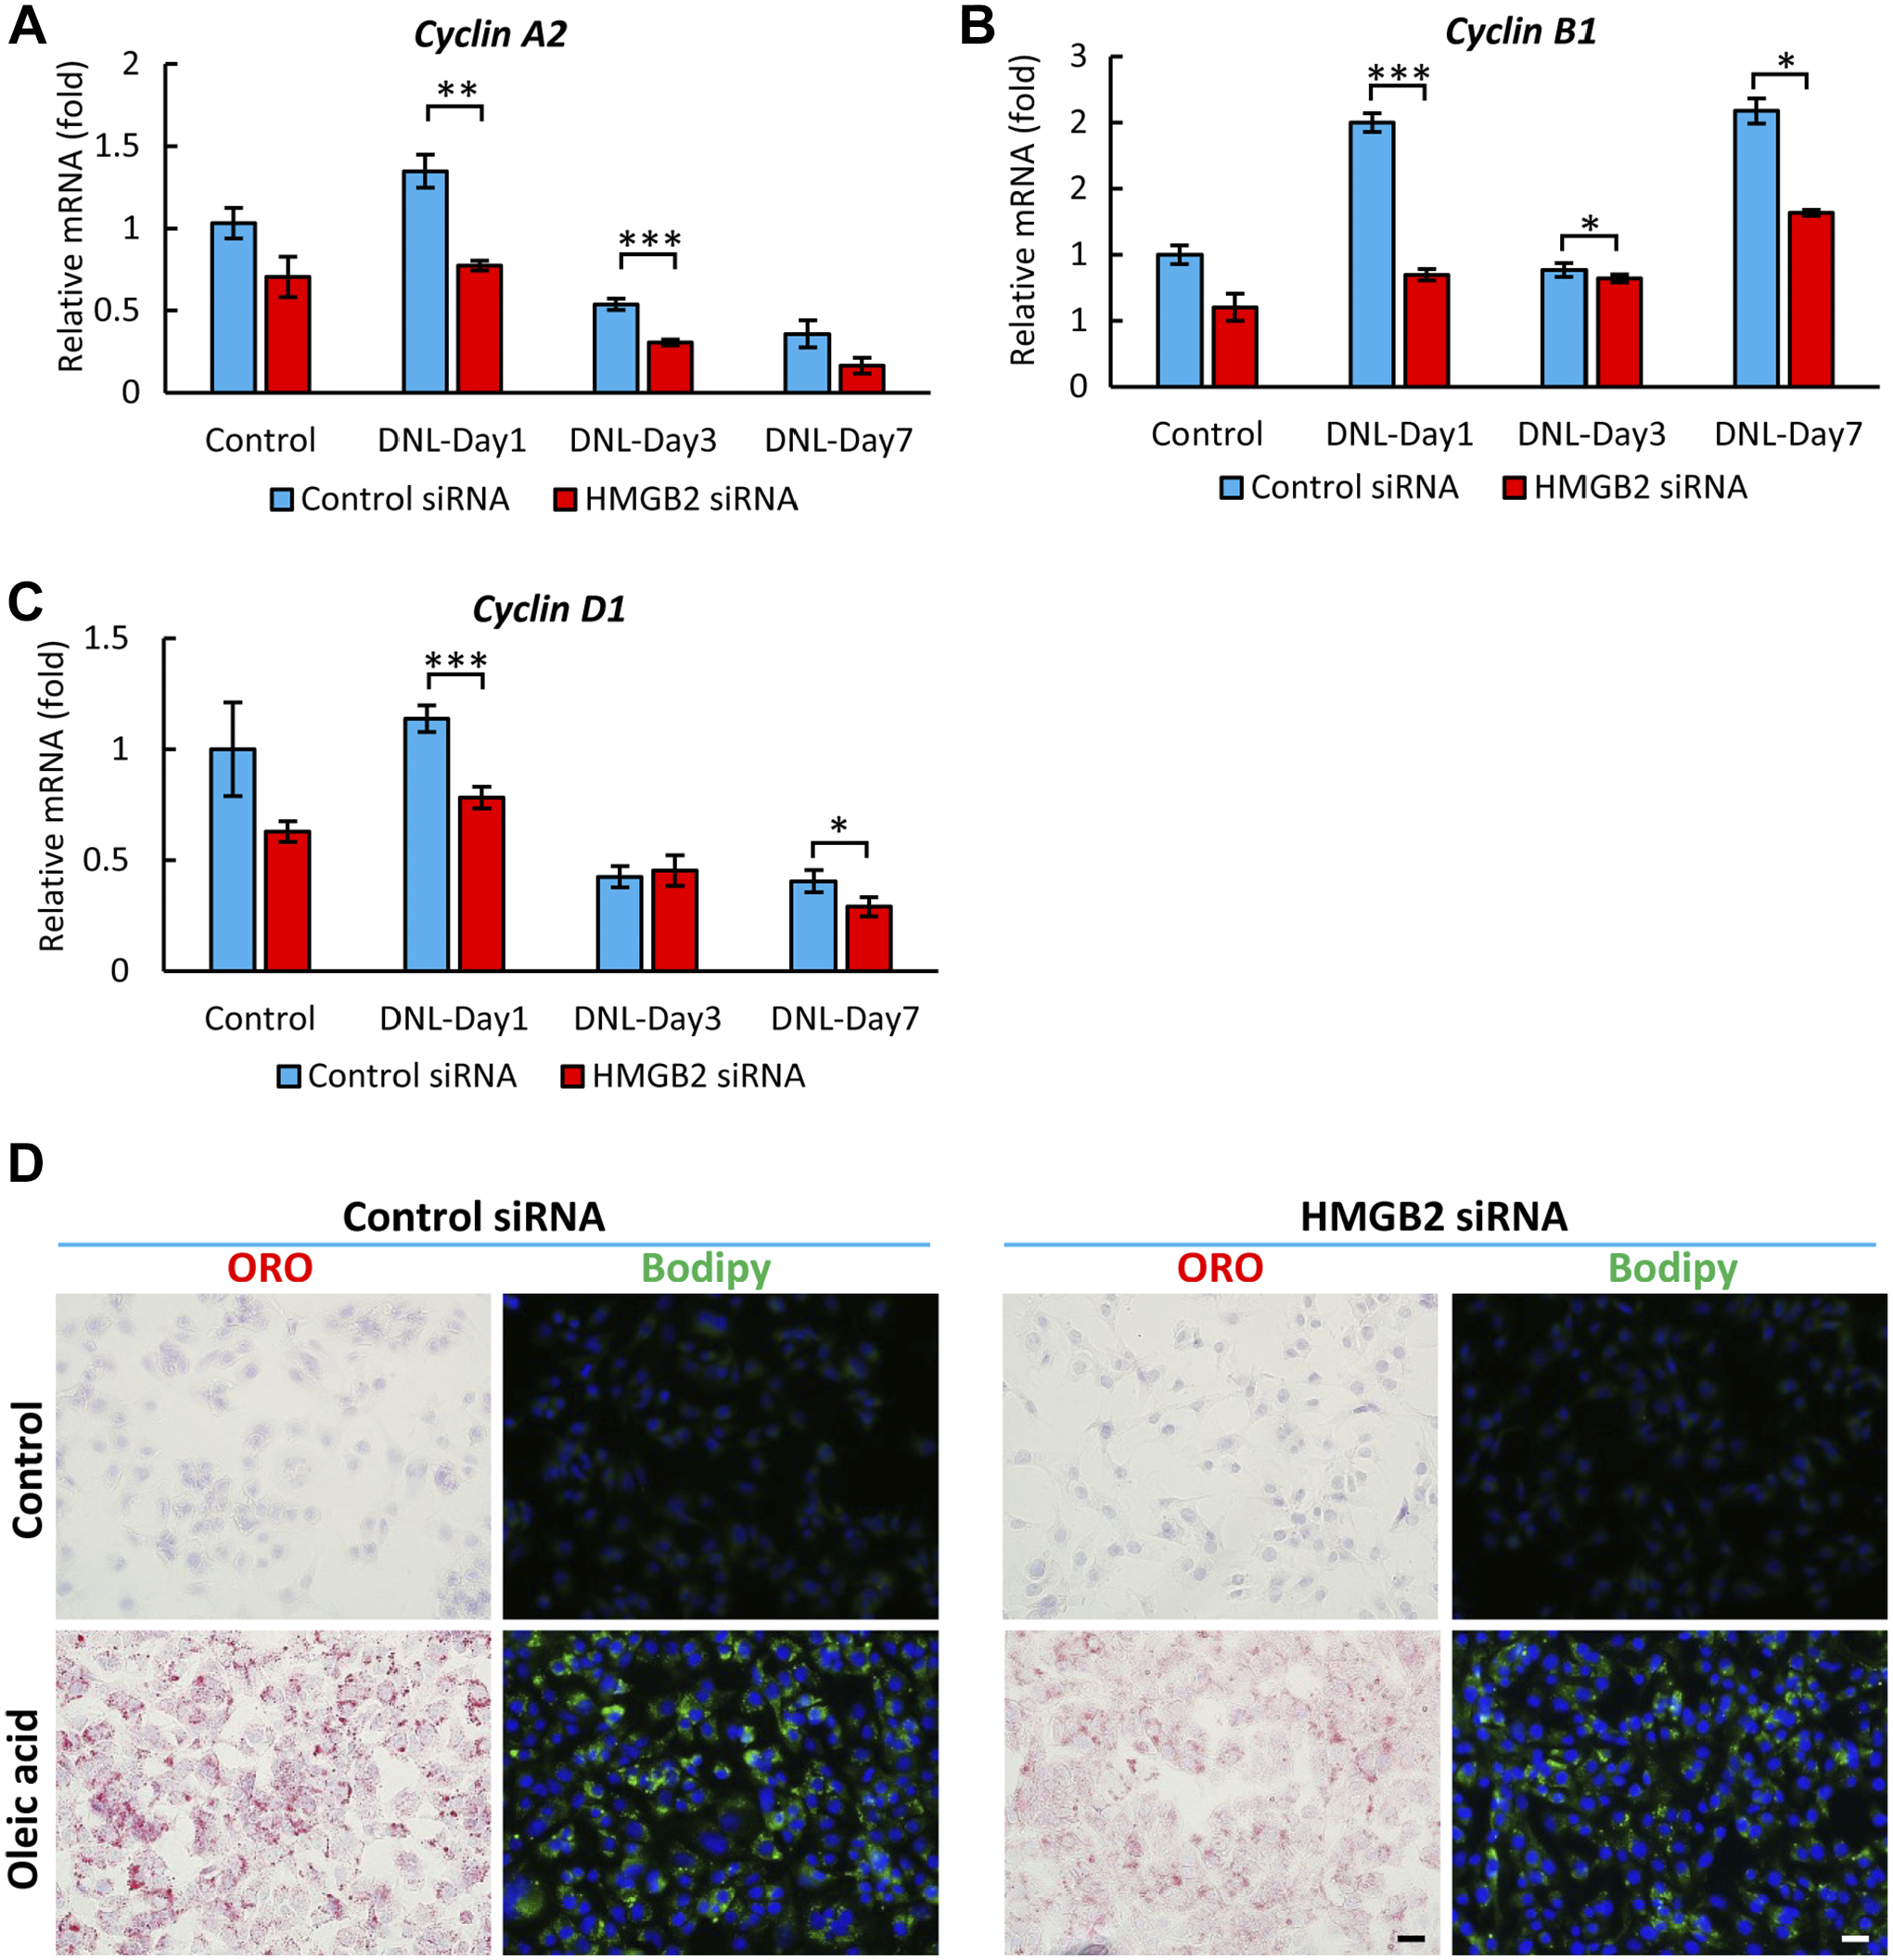
Cell proliferation in Hepa 1-6 cells after HMGB2-gene knockdown and de novo lipogenesis. qPCR analysis of Cyclin A2 (A), Cyclin B1 (B), and Cyclin D1 (C) mRNAs in control and HMGB2-siRNA-transfected cells. Data represent the mean ± SEM from 4 independent experiments. Scale bar 20 μm. Asterisks indicate statistically significant differences (*p<0.05, ***p<0.001 Student’s t-test (two tailed). (D) Accumulation of lipid droplets detected by ORO (red) and BODIPY (green) staining in oleic acid treated Hepa 1-6 cells after control and HMGB2-siRNA transfection. Results represent three independent experiments.
The accumulation of lipid droplets was induced via an intrinsic mechanism in an insulin-, IBMX-, and dexamethasone-mediated de novo lipogenesis model (Fig. 6A). The role of HMGB2 in lipid droplet accumulation was further demonstrated in an oleic acid–induced model, which represents an extrinsic mechanism. Both ORO and BODIPY staining revealed that the accumulation of lipid droplets was lower in HMGB2-knockdown cells (Fig. 7D). Collectively, these models revealed that HMGB2 is important for lipid accumulation, which is necessary for cell proliferation.
Discussion
In this study, the major findings were that HMGB2 is important for the transient accumulation of lipid droplets after PHx, which was in turn crucial for hepatocyte proliferation during liver regeneration. The importance of HMGB2 in hepatocyte proliferation was confirmed in a PHx model with HMGB2-KO mice in comparison with WT mice, and also in HM-GB2-knockdown cell lines.
In this study, 8-week-old WT and HMGB2-KO mice were used. There were no significant differences in the body weight and other phenotypes between the WT and HMGB2-KO mice, indicating that the depletion of HMGB2 does not affect major vital functions, including liver metabolism. Our results revealed that the number of HMGB2-positive cells significantly increased during liver regeneration, and that these cells colocalized with proliferating cells, such as PCNA- and cyclin A2-positive cells. Importantly, HMGB2 expression was seen in hepatocytes during active liver regeneration in the WT mouse livers. In HMGB2-KO mouse livers, the number of proliferating cells was significantly decreased when compared with the WT mouse livers. All these results indicated that the spatiotemporal expression of HMGB2 is crucial for hepatocyte proliferation. Our other recent studies have also confirmed that HMGB2 is important for cell proliferation in mouse liver, testis, and ovary.6–8
In recent studies, HMGB2 has been reported to be a novel adipogenic gene. The expression of HMGB2 induces adipogenesis in mesenchymal stem cells and fat infiltration into skeletal muscles through the HMG-B2-PDGFRα signaling cascade. 15 In another study, HMGB2 was found to mediate adipogenesis through the enhancement of C/EBPβ by binding to its promoter, especially during the mitotic clonal expansion stage, and the exogenous expression of C/EBPβ could rescue the adipogenic activity of preadipocytes with inhibited HMGB2. 16 Indeed, our microarray results revealed that the expression of lipid metabolism–related genes was significantly decreased in HMGB2-KO mouse livers. SREBF and Pltp genes have a central role in lipid metabolism, and these genes were expressed at a significantly lower level in the intact HMGB2-KO mouse livers than in the WT mouse livers. Our ORO staining results showed the transient accumulation of lipid droplets at 12 and 24 hr in the WT mice. These time-points corresponded to the time before the peak proliferative activity of liver regeneration was seen. Interestingly, in HMGB2-KO mouse livers, the amount of lipid droplets was significantly decreased at 12 and 24 hr, while it was also preserved until 36 hr. Taken together, these findings suggest that HMGB2 is essential for the accumulation of lipid droplets in regenerating liver.
The correlation between hepatic lipid accumulation and hepatocyte proliferation has been studied in relation to circadian rhythm regulation. Four waves of hepatocyte proliferation were coupled to three waves of hepatic fat accumulation during liver regeneration. 14 However, there have been conflicting reports on the role of lipid droplets in hepatocyte proliferation. Sydor et al. reported that steatosis does not impair liver regeneration. 30 Despite this finding, severe steatosis induced hepatocellular injury and impaired liver regeneration in a non-alcoholic steatohepatitis rat model. 31 The difference between these might be due to differences in the mouse food used to induce steatosis; one study used a Western diet, while the other study used a methionine choline–deficient diet.
In this study, a significant decrease in FAT/CD36 was detected in HMGB2-KO mouse livers. FAT/CD36 has been reported to be a key regulator of de novo lipogenesis in liver. 32 Hepatocyte-specific depletion of FAT/CD36 attenuated fatty liver, and improved insulin sensitivity in mice fed with a high-fat diet. 33 Similar to a report by Kohjima et al., our results revealed that delayed cell cycle progression was correlated with decreased expression of Plin2 in HMGB2-KO mouse livers. 34
De novo lipogenesis is a complex and highly regulated process of lipid synthesis from glucose in hepatocytes. 35 SREBP1c is a transcription factor that has a central role in the regulation of lipogenesis. It is activated by insulin and carbohydrate response element-binding protein. SREBP1c knockdown in db/db mice resulted in a significant reduction of triglyceride accumulation, and liver-specific overexpression of SREBP1c was associated with fatty liver and an increased visceral fat mass in mice.36,37 In our results, the significant decrease in SREBP1c expression correlated with the decreased number of lipid droplets in the hepatocytes of HMGB2-KO mouse livers, confirming that HMGB2 is essential for the accumulation of lipid droplets in hepatocytes. Moreover, interaction between HMGB1 and SREBP has been re-ported to enhance the binding of these molecules to DNA, potentiating their transcriptional activities in the regulation of lipogenic and cholesterogenic gene expression. 38 Indeed, HMGB1 and HMGB2 proteins have more than 80% identity in their amino acid sequences, and there is strong evidence that HMGB1 and HMGB2 are completely interchangeable.39,40 Therefore, HMGB2 may directly interact with SREBP1c to upregulate the transient accumulation of lipid droplets in hepatocytes. Cell proliferation activity is strongly dependent on the metabolic status of the cells. Similar with previous report, our results revealed that relatively glycogen-depleted areas are associated with more proliferating hepatocytes during liver regeneration. 41 In our study, glycogen depletion and enrichment alternated in cycles during liver regeneration in WT mice; however, a delay in glycogen enrichment was observed until 48 hr, suggesting decreased hepatocyte proliferation in HMGB2-KO mouse livers.
Our in vivo findings were confirmed in Hepa 1-6 cells. The expression of genes related to fatty acid transporters, transcription factors, lipid metabolism, and fatty acid synthesis was significantly decreased in HMGB2-knockdown cells. In HMGB2-KO mouse liver specimens, a significant decrease in cell proliferation markers was also seen, indicating that the accumulation of lipid droplets was essential to promote cell proliferation.
In conclusion, this study demonstrated that HM-GB2 is important for the transient accumulation of lipid droplets, which promotes hepatocyte proliferation during liver regeneration. HMGB2 depletion results in delayed cell proliferation due to decreased lipid droplet accumulation in hepatocytes because lipid droplets are needed as an energy source for cell division and a lipid source for the synthesis of new cell membranes.
Footnotes
Appendices
Acknowledgements
We would like to thank Momoe Yano, Ikuyo Tsuchimochi, and Ayako Nakatake for technical assistance. We app-reciate Prof. Arata Honda (Jichi Medical University, Ja-pan) for kind contribution of FAT/CD36 and sterol regulatory element-binding protein 1 antibodies. We gratefully acknowledge the Frontier Science Research Center at the University of Miyazaki for allowing us to use their facilities.
Competing Interests
The author(s) declared no potential conflicts of interest with respect to the research, authorship, and/or publication of this article.
Author Contributions
NC and YH designed all experiments, wrote the manuscript, and analyzed the data. NC, KY, and BL-E performed experiments. SS, TK, F, TI, KK, and EC provided mouse, reagents, and information. All authors have read and approved the final manuscript.
Funding
The author(s) disclosed receipt of the following financial support for the research, authorship, and/or publication of this article: This study was supported in part by a Grant-in-Aid for Scientific Research from the Japan Society for the Promotion of Science (No. 19K16477 to N.C., No. 21K06738 to Y.H.).
Data Availability
Original micrographs and any other information are available on request from the corresponding author.