
Abstract
We characterized more complex peroxisomal structures, i.e., tubulo-reticular peroxisomal clusters, in greater detail under in vivo conditions in COS-7 cells that were transfected with a GFP-PTS1 fusion protein. Live cell imaging revealed the dynamic nature of peroxisomal clusters and allowed a detailed analysis of the motile properties of a heterogeneous peroxisome population. Furthermore, peroxisomal clusters were found to be associated with lipid droplets. The frequency of peroxisomal clusters correlated with an increase in cell density and in the size of lipid droplets. These data provide further evidence for the dynamic nature of the peroxisomal compartment and indicate that peroxisomal clusters have a function in lipid metabolism.
P
Microscopic observations reveal most mammalian peroxisomes to be spherical. However, the peroxisomal compartment is highly plastic and complex. Several morphologically distinct types of peroxisomes, including elongated, tubular organelles, have been described in various mammalian tissues and cell lines, first by electron microscopic studies (Hicks and Fahimi 1977; Gorgas 1984; Yamamoto and Fahimi 1987; Roels et al. 1991) and recently at the light microscopic level (Schrader et al. 1994, 1995; Litwin and Bilinska 1995). A heterogeneous and more complex peroxisomal compartment has been observed under conditions of rapid growth, e.g., after hepatectomy (Yamamoto and Fahimi 1987) or after stimulation of cultured cells with defined growth factors (e.g., nerve growth factor), polyunsaturated fatty acids, or free radicals (Schrader et al. 1998a,1999), and in tissues actively engaged in the synthesis of special kinds of lipids, e.g., ether glycerolipids and waxes (Gorgas 1987). At present, however, little information is available on the exact function of complex peroxisomal structures, the mechanism of their formation, and their dynamic behavior. Recently, we reported on the tubulation and fission of elongated peroxisomes after overexpression of Pex11βp (Schrader et al. 1998b). These processes are believed to contribute to peroxisome proliferation in HepG2 cells (Schrader et al. 1996,1998b). Reticular peroxisomes, which were first proposed by Lazarow et al. (1980), have been described by serial section reconstructions in lipid-synthezising epithelia and in regenerating liver (Gorgas 1987; Yamamoto and Fahimi 1987). However, a reticular network has not been studied in cultured cells or under in vivo conditions, and it still remains unclear if it fulfills an important metabolic function or if it plays a role in the formation of new peroxisomes by budding or fission out of a preexisting compartment (Wilcke et al. 1995).
In this study, we used GFP-PTS1 labeling of COS-7 and HepG2 cells to characterize more complex peroxisomal structures in greater detail under in vivo conditions. We were able to document the existence and the dynamic nature of tubulo-reticular peroxisomal clusters and we report here on their association with lipid droplets.
Materials and Methods
Cell Culture
HepG2 and COS-7 cells were obtained from the American Type Culture Collection (ATCC; Rockville, MD) and were cultured in Dulbecco's modified Eagle's medium (DMEM) supplemented with 2 g/liter sodium bicarbonate, 2 mM glutamine, 100 U/ml penicillin, 100 μg/ml streptomycin, and 10% fetal calf serum (FCS) (all from Gibco BRL; Gaithersburg, MD) at 37C in a humidified atmosphere containing 5% CO2.
Transfection Experiments
HepG2 and COS-7 cells were either transfected by electroporation as described (Schrader et al. 1998b) or by incubation with polyethylenimine (25 kD PEI; Sigma Aldrich, Deisenhofen, Germany). For PEI transfection (Fischer et al. 1999; Bieber and Elsässer 2001), 2.4 × 10⁴ cells/cm2 were seeded on coverslips (in 6-cm dishes) and after 24 hr the medium was changed to a volume of 2.5 ml. For three dishes, 10 μg plasmid and 100 μl of PEI stock solution (0.9 mg/ml, pH 7.4) were diluted to 750 μl each with 150 mM NaCl. After 10 minutes at room temperature the PEI solution was pipetted to the DNA and after 10 more min 500 μl of the PEI/DNA solution was added to the cells. After 6 hr the medium was changed and cells were processed for indirect immunofluorescence or live cell imaging 24–48 hr after transfection.
cDNAs and Antibodies
pGFP-PTS1, encoding the S65T mutant from the green fluorescent protein (GFP) and the PTS1 under the control of the CMV promoter, was a gift from Dr. S. J. Gould (Johns Hopkins School of Medicine; Baltimore, MD) (Kalish et al. 1996). Rabbit anti-PMP70 (Lüers et al. 1993), rabbit antiacyl-CoA oxidase and, rabbit anti-catalase polyclonal antibodies (Beier et al. 1988) were a gift from Dr. A. Völkl (University of Heidelberg; Heidelberg, Germany). Species-specific anti-IgG antibodies conjugated to TRITC were obtained from Dianova (Hamburg, Germany).
Indirect Immunofluorescence and Deconvolution
Cells grown on glass coverslips were fixed with 4% paraformaldehyde in PBS, pH 7.4, permeabilized with 0.2% Triton X-100, and incubated with primary and secondary antibodies as described (Schrader et al. 1995). Transfected cells were processed for immunofluorescence 24–48 hr after transfection. For double-labeling experiments, transfected cells were incubated with antibodies to peroxisomal marker proteins and subsequently with goat anti-rabbit IgG conjugated to TRITC. Samples were examined using a Leitz Diaplan (Leica; Wetzlar, Germany) or an Axiovert 100 microscope (Carl Zeiss; Jena, Germany) equipped with the appropriate filter combinations and photographed on Kodak TMY film or digitalized. Deconvolution studies were performed with a Delta Vision system (Applied Precision; Issaquah, WA) using an Axiovert S100 2T microscope (Carl Zeiss) for optical sectioning. The deconvolved images in Figures 1F and 1G were taken at 200-nm intervals with a ×100 Plan Apo objective with a 1.4 numerical aperture through focus.
Staining of Lipid Droplets
For staining of lipid droplets, cells were fixed with 4% paraformaldehyde in PBS, pH 7.4, for 20 min and incubated with a 1:1000 dilution of a Nile red (Molecular Probes; Leiden, The Netherlands) stock solution (100 μg/ml in acetone) for 5 min (Greenspan et al. 1985). Alternatively, lipid droplets in fixed cells were stained with Sudan black (Serva; Heidelberg, Germany) (0.1% in 70% ethanol) for 20 min. Excess dye was removed by washing in PBS. GFP and Nile red were localized simultanously using a FITC filter set. For quantitative evaluations, 100–200 cells per coverslip (with three to five coverslips per preparation) were examined at the fluorescence microscope and categorized according to the size of lipid droplets. The data in Figure 5 are from three or four independent experiments. Measurements of the size of lipid droplets were performed on photographs at ×1000–2000.
Nocodazole Treatment
Cells transfected with the GFP-PTS1 expression construct were treated with 15 μM nocodazole by adding the microtubule-destabilizing agent directly to the live cell assay (see below) and incubating for 15–30 min.
Live Cell Imaging
Cells transfected with GFP-PTS1 cDNA were grown in culture dishes with a glass bottom. For time-lapse studies they were placed in a temperature- and CO2-controlled chamber (Carl Zeiss; CTI Controller 3700, TRZ 3700) on a heating stage of a Zeiss LSM 410 inverted microscope equipped with a ×63/1.4 objective. As light source, an argon ion laser with wavelength of 488 nm and appropriate filter combinations were used. Images were collected at intervals of 5 sec up to 5 min, and the cells were monitored at various time intervals for a total of 1–4 hr. Real-time imaging studies were performed using high-magnification video-enhanced fluorescence microscopy as described (Valetti et al. 1999; Schrader et al. 2000) and the motile events recorded on video tape. Two or three coverslips were observed per experiment and between five and 10 different fields were viewed on each coverslip. For analysis of real-time imaging data, the tracks of individual GFP-labeled peroxisomes were traced from the video monitor onto transparency sheets and the distance of each translocation measured manually. The start and stop frames corresponding to each movement were used to determine the duration and to calculate velocities. A movement was defined as a saltation (at a single velocity) of 0.5 μm or longer. For peroxisomes undergoing multiple movements, each individual saltation was scored separately.
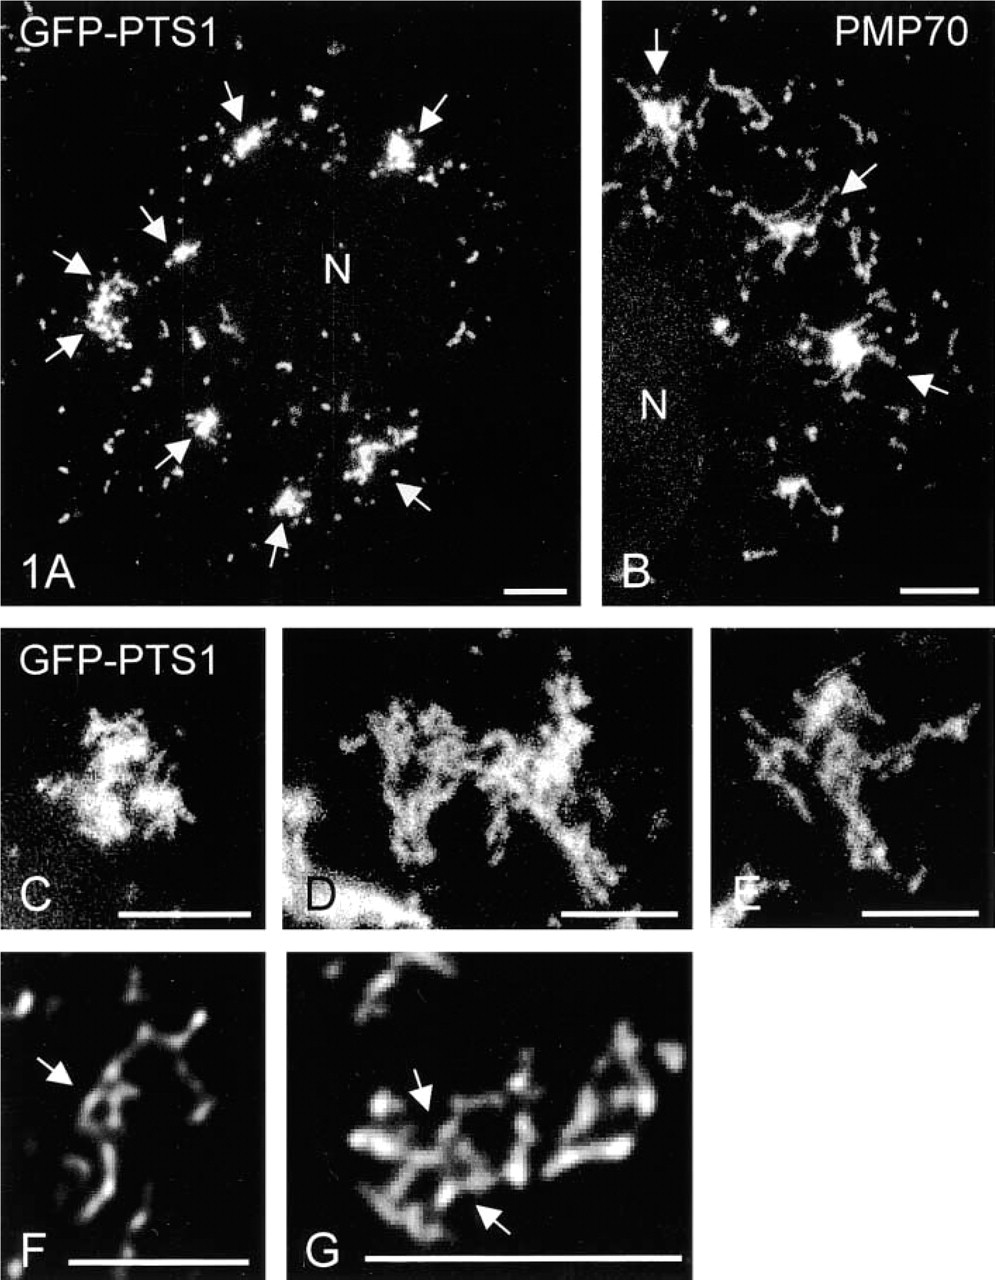
Tubulo-reticular peroxisomal clusters can be visualized in COS-7 cells by GFP-PTS1. Fluorescence localization of GFP-PTS1 in living (
Results
COS-7 Cells Contain Tubulo-reticular Clusters of Peroxisomes
For morphological characterization of their peroxisomal compartment, COS-7 cells were processed for indirect immunofluorescence and stained with antibodies directed to the peroxisomal membrane protein PMP70 (Figure 1B). In addition to a heterogeneous mixture of spherical and tubular peroxisomal structures similar to the ones described in HepG2 cells (Schrader et al. 1994,1995), some COS-7 cells contained clusters of peroxisomes (Figure 1B). To exclude fixation artifacts, COS-7 cells were transfected with a cDNA construct encoding a GFP-PTS1 fusion protein. When live cells were observed, peroxisomal clusters similar to the ones in fixed cells could be seen (Figure 1A). The GFP-PTS1 fusion protein was targeted exclusively to peroxisomes, as indicated by its co-localization with different peroxisomal marker proteins in fixed cells (not shown). Usually, one to seven clusters of peroxisomes varying in size from 5 to 15 μm were found in approximately 20% of the cells under routine culture conditions (Figure 5B). The clusters were also positive for other peroxisomal marker proteins (e.g., catalase, acyl CoA oxidase; not shown).
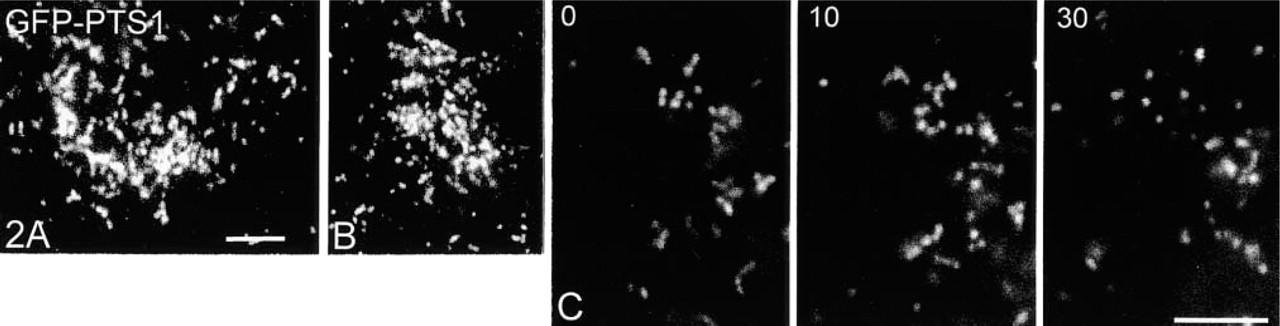
Some of the clusters resembled accumulations of tubulo-reticular peroxisomes (Figures 1B, 1D, and 1E), whereas others had a more compact, grape-like structure (Figures 1A, 1C, and 3). By conventional imaging methods, the immunofluorescence signal of these clusters appeared mostly as a bright focus of material (Figures 1A and 1B). More detail was provided using previously developed deconvolution software (Delta Vision) (Figures 1F and 1G). After deconvolution, interconnections between tubular peroxisomes were visible, forming tubulo-reticular structures (Figures 1F and 1G). A ring-like structure with tubular extensions is shown in Figure 1F. Furthermore, peroxisomal clusters were found to be dynamic and transient in nature. In time course experiments, an increase of the number of cells with clusters could be observed after 3–4 days in culture, with a maximum after 5–6 days, which was then followed by a slight decrease (Figure 5B). Accumulations of spherical peroxisomes were observed after prolonged time in culture and are suggested to result from the breakdown of peroxisomal clusters (Figures 2A and 2B). The breakdown of elongated peroxisomes into spherical organelles could be demonstrated by live cell imaging of COS-7 cells expressing the GFP-PTS1 fusion protein (Figure 2C). The fission of elongated peroxisomes and the separation/distribution of spherical peroxisomes took about 20–30 min. Although the complete breakdown of peroxisomal clusters could not yet be demonstrated in live cells, a similar mechanism is suggested.
Live Cell Imaging of Peroxisomal Clusters and Single Peroxisomes
To analyze the dynamic properties of the peroxisomal clusters, live cell imaging of COS-7 cells expressing the GFP-PTS1 fusion protein was performed (Figure 3). Interestingly, tubulo-reticular clusters exhibited highly dynamic movements which were accompanied by drastic changes in shape (Figure 3). Remodeling of these structures could be observed, involving the formation and/or detachment of tubular processes that appeared to interconnect adjacent peroxisomes (Figure 3). These movements were not inhibited by nocodazole treatment, suggesting that they were microtubule-independent. Such short-range, non-directed oscillatory movements were seen for the majority of the peroxisome population in a given cell (~90%). All morphologically distinct peroxisomal structures exhibited random, vibration-like, microtubule-independent movements similar to the ones described recently in CHO and CV-1 cells (Rapp et al. 1996; Huber et al. 1997; Wiemer et al. 1997).
A small subset (~10%) of the peroxisomes in COS-7 cells underwent fast directional movement that could be blocked completely by nocodazole, indicating that it was microtubule-dependent. Similar observations have been made using CHO and CV-1 cells transfected with a GFP-PTS1 construct (Rapp et al. 1996; Huber et al. 1997; Wiemer et al. 1997). The dynamic properties of the microtubule-dependent movements of morphologically different individual peroxisomes in COS-7 cells were analyzed in detail and compared to those of HepG2 cells, which were also transfected with the GFP-SKL construct and observed in vivo (Table 1). The morphological and biochemical properties of the peroxisomes in HepG2 cells have been well characterized in recent studies (Schrader et al. 1994, 1996). Our analysis revealed that the frequency of microtubule-dependent movements was higher in COS-7 than in HepG2 cells. This was also true for the microtubule-dependent movements of other subcellular organelles, e.g., endosomes and lysosomes, which were labeled with Cy3-α2-macroglobulin (not shown), indicating cell-specific differences in organelle motility. Nevertheless, peroxisomes in HepG2 cells exhibited similar velocities (mean 0.58 μm/sec) and moved over comparable distances (up to 10 μm) as in COS-7 cells (Table 1). It should be noted that spherical as well as elongated peroxisomes moved in a microtubule-dependent manner, although the movements of spherical organelles were more frequent. However, extremely elongated tubules (>3 μm), reticular structures, or peroxisomal clusters in COS-7 cells were not observed to translocate along microtubules. Elongated peroxisomes moved with slightly lower velocities than spherical ones, but over longer distances (Table 1). Furthermore, peroxisome velocities and distances traveled in COS-7 and HepG2 cells were comparable to the motile properties of GFP-labeled peroxisomes reported for CHO (Rapp et al. 1996) and CV-1 cells (Wiemer et al. 1997) (Table 1) and might be a general feature of microtubule-based peroxisomal motility.
Tubulo-reticular peroxisomes in COS-7 cells are transient structures. (
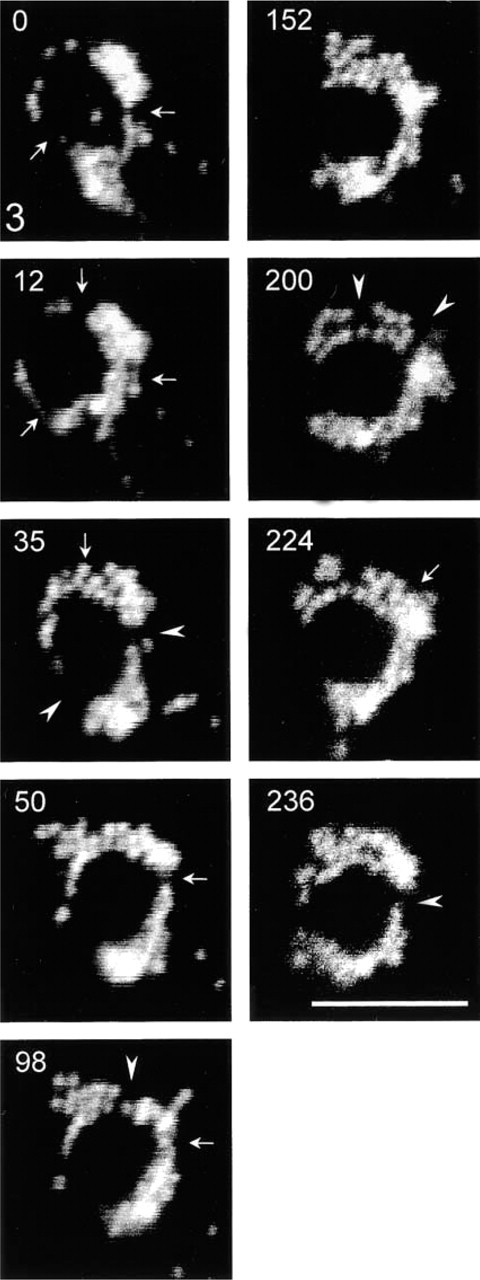
Time-lapse imaging of GFP-PTS1 labeled peroxisomal clusters in living COS-7 cells. The dynamic nature of the clusters and the changes in morphology are shown. Arrowheads point to regions where interconnections are detached, whereas arrows point to regions where connections are formed. Elapsed time is in seconds. Bar = 5 μm.
Peroxisomal Clusters Are Associated with Lipid Droplets
Because it is known that peroxisomes play important functions in lipid metabolism (van den Bosch et al. 1992; Reddy and Mannaerts 1994) and can be found associated with lipid droplets in adipocytes (Blanchette 1966; Novikoff et al. 1980; Blanchette-Mackie et al. 1995), we stained lipid droplets in GFP-PTS1-transfected COS-7 cells with Nile red and performed co-localization studies (Figure 4). Single peroxisomes were occasionally observed to be associated with lipid droplets (Figure 4A) as described for adipocytes (Blanchette 1966; Novikoff et al. 1980; Blanchette-Mackie et al. 1995). Surprisingly, about 60% of the peroxisomal clusters were associated with lipid droplets (Figures 4B-4E). Small lipid droplets were frequently observed at the tips of elongated peroxisomes.
The size of the lipid droplets was highly dependent on the cell density in culture (Figure 5A). COS-7 cells with small lipid droplets (<0.9 μm in diameter) were more frequent at lower density (35–40% of the cells at 3 ~ 103 cells/3.5 cm2) and decreased in frequency1 with higher cell densities. In contrast, cells with larger lipid droplets (>2.0 μm in diameter) were more frequent at higher cell densities. Interestingly, peroxisomal clusters were also observed to be more frequent at higher cell densities (Figure 5B). In a dynamic culture situation, the number of cells with peroxisomal clusters increased with time and increasing cell density. The increase in peroxisomal clusters was accompanied by an increase in the number of cells with enlarged lipid droplets. After a maximum at Days 5 and 6, a slight decrease was observed. This decrease is presumably caused by an unefficient supply of the cells with nutrition due to the high cell density. At any time, about 60% of the peroxisomal clusters were found to be associated with lipid droplets, mostly with the larger ones. However, the size of the peroxisomal clusters was increased after prolonged time in culture. These findings support a special role for tubulo-reticular peroxisomal clusters in lipid metabolism in conjunction with lipid droplets.
Discussion
In this study, we used GFP-PTS1 labeling of cultured cells to characterize more complex peroxisomal structures in more detail under in vivo conditions. We analyzed the microtubule-dependent movements of a heterogeneous peroxisome population in greater detail and provide insight into the dynamic behavior of peroxisomal clusters using live cell imaging. Furthermore, our data indicate that tubulo-reticular peroxisomal clusters in COS-7 cells are associated with lipid droplets and correlate with their size and with cell density.
Analysis of microtubule-dependent peroxisomal movements a
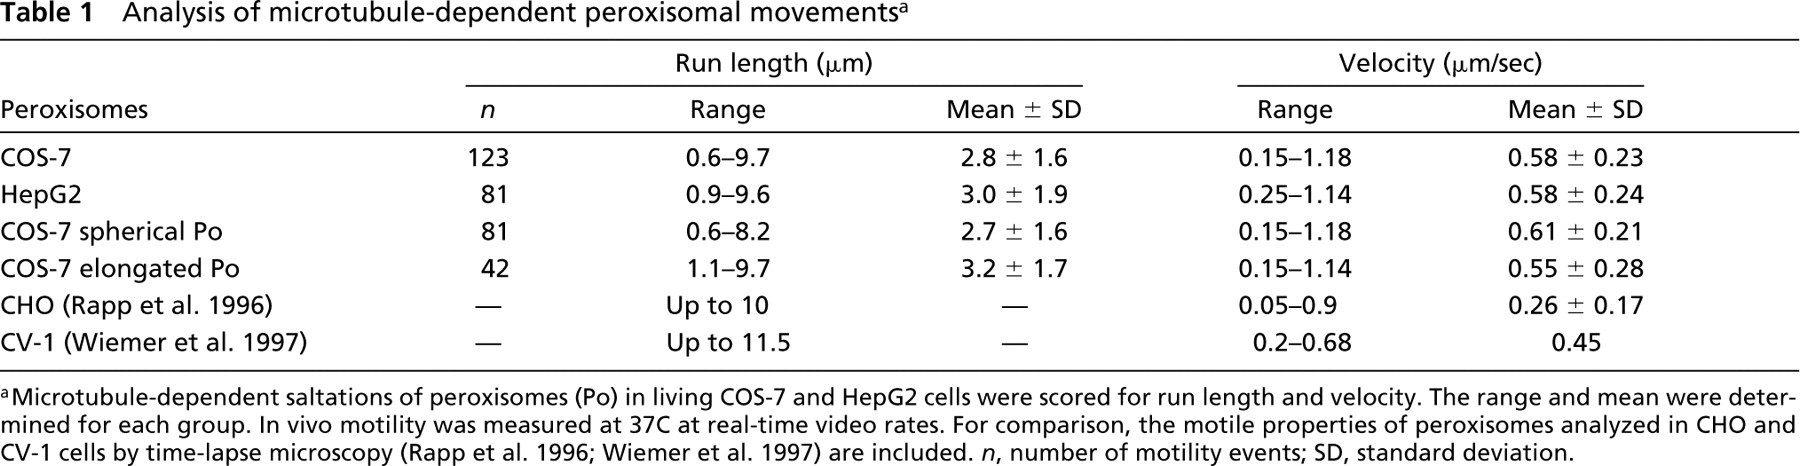
Microtubule-dependent saltations of peroxisomes (Po) in living COS-7 and HepG2 cells were scored for run length and velocity. The range and mean were determined for each group. In vivo motility was measured at 37C at real-time video rates. For comparison, the motile properties of peroxisomes analyzed in CHO and CV-1 cells by time-lapse microscopy (Rapp et al. 1996; Wiemer et al. 1997) are included. n, number of motility events; SD, standard deviation.
Peroxisomal Tubulo-Reticular Clusters in COS-7 Cells
As indicated, GFP-PTS1 targeting to peroxisomes provides a useful tool for the in vivo labeling of a variety of morphologically distinct and complex peroxisomal structures, including tubules as well as reticula. GFP-PTS1 labeling of COS-7 cells revealed the existence and the dynamic nature of tubulo-reticular networks of peroxisomes in living cells that are reminiscent of the “peroxisomal reticulum” postulated by Lazarow et al. (1980). These authors suggested that peroxisomes may be transiently interconnected, if not permanently, by fission and fusion, into a “peroxisomal reticulum.” The reticula observed in vivo in COS-7 cells exhibited highly dynamic, microtubule-independent movements and were engaged in transient contacts. Whether or not these interactions facilitate the metabolic functions of peroxisomes and represent fusion events is now under investigation.
Like the tubular peroxisomes described recently in HepG2 cells, the tubulo-reticular clusters were transient in nature and were found to divide into spherical peroxisomes. However, the formation and breakdown of tubular peroxisomes in HepG2 cells was most prominent at low cell densities after 24–48 hr in culture (Schrader et al. 1996), whereas peroxisomal clusters in COS-7 cells were more common at higher cell densities. The formation of peroxisomal clusters has also been described in HepG2 cells after treatment with microtubule-depolymerizing agents (Schrader et al. 1996) or during maturation of peroxisomes in differentiating hepatoblastoma cells after a prolonged time in culture (Stier et al. 1998). Furthermore, their association with lipid droplets in COS-7 cells supports a role in lipid metabolism rather than in peroxisome proliferation, as described for tubular peroxisomes in HepG2 cells (Schrader et al. 1996,1998b). Interestingly, reticular peroxisomes were described by serial section reconstruction in lipid-synthesizing epithelia (Gorgas 1987) and regenerating rat liver (Yamamoto and Fahimi 1987). An elaborate peroxisomal network was found in tissues actively engaged in the synthesis of special kinds of lipids (Gorgas 1987), whereas in regenerating rat liver the reticulum consisted of focal interconnections between three to five dilated peroxisomes (Yamamoto and Fahimi 1987). Previous studies have shown tubular and segmented structures to be a characteristic feature of the peroxisomal compartment in a variety of cell lines (Schrader et al. 1995,1996; Litwin and Bilinska 1995), but a reticulum had not been observed thus far under culture conditions. This failure might be due to the transient nature and the enormous plasticity of complex peroxisomal structures, and to the technical approach selected for their detection. Their preservation requires special precautions in fixation (Schrader et al. 1995). In addition, reticular structures are not easily resolved by conventional fluorescence microscopy. Studies with other cell lines using deconvolution microscopy indicate that reticular structures are more spread than previously expected (unpublished observation).
Microtubule-based Motility of Peroxisomes
Our detailed live cell imaging analysis of microtubule-based peroxisomal movement revealed some general features of peroxisomal motility: (a) microtubule-based peroxisome movement might be a low-frequency event; (b) peroxisomes do not show a high degree of bidirectional movements, which is a characteristic of particles involved in trafficking of proteins and membranes (unpublished observations); (c) peroxisomal movements occur in all areas of the cytoplasm and show no direction preference, and organelles move towards and away from the cell center in a random fashion; and (d) peroxisomes can move over very long distances. The motile properties of peroxisomes in both HepG2 and COS-7 cells were comparable to data obtained in other cell lines by time-lapse microscopy (Table 1; Rapp et al. 1996; Wiemer et al. 1997). Furthermore, peroxisome velocities and distances traveled were similar to the motile properties of other intracellular organelles, e.g., endosomes and lysosomes in COS-7 cells or hepatocytes (Valetti et al. 1999; Schrader et al., unpublished observations). The physiological relevance of these motile events is poorly understood, but translocations might be a prerequisite for the interaction of individual peroxisomes (Schrader et al. 2000). Furthermore, little is known about the molecular basis of peroxisomal movement. In a recent study (Schrader et al. 2000; Thiemann et al. 2000), we obtained evidence for the involvement of the dynein/dynactin complex in peroxisomal motility. Peroxisomal movements could be inhibited by disrupting dynein function either by overexpression of the dynamitin subunit of dynactin (Echeverri et al. 1996), or by microinjection of a function-blocking antibody to the dynein intermediate chain. These observations support a role for the dynein/dynactin motor in peroxisome motility and indicate that besides the complex import machinery other multiprotein complexes are present on the peroxisomal membrane which are not only required for regulated tethering to and translocation along microtubules but also for fission and, presumably, even fusion events of the peroxisomal compartment. It is a great challenge for future investigations to characterize further components of these machineries and to determine how they are regulated.
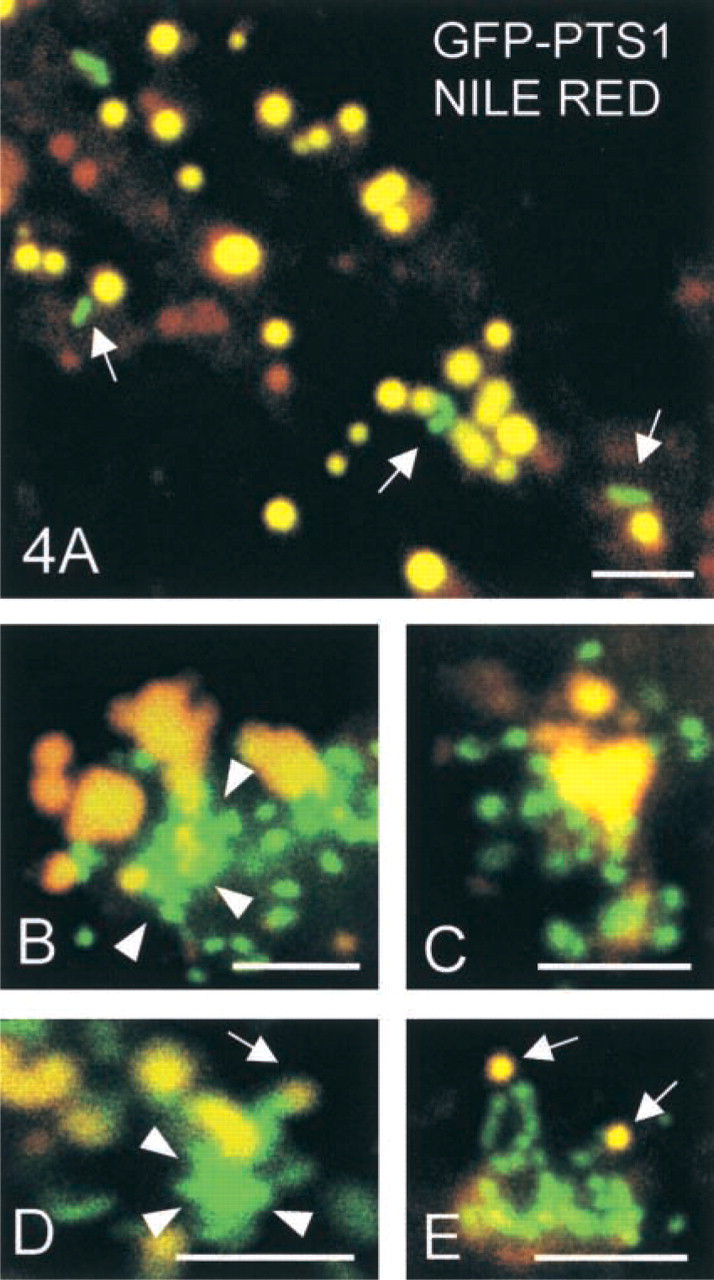
Co-localization of GFP-PTS1-labeled peroxisomal clusters and lipid droplets in COS-7 cells stained with Nile red. (
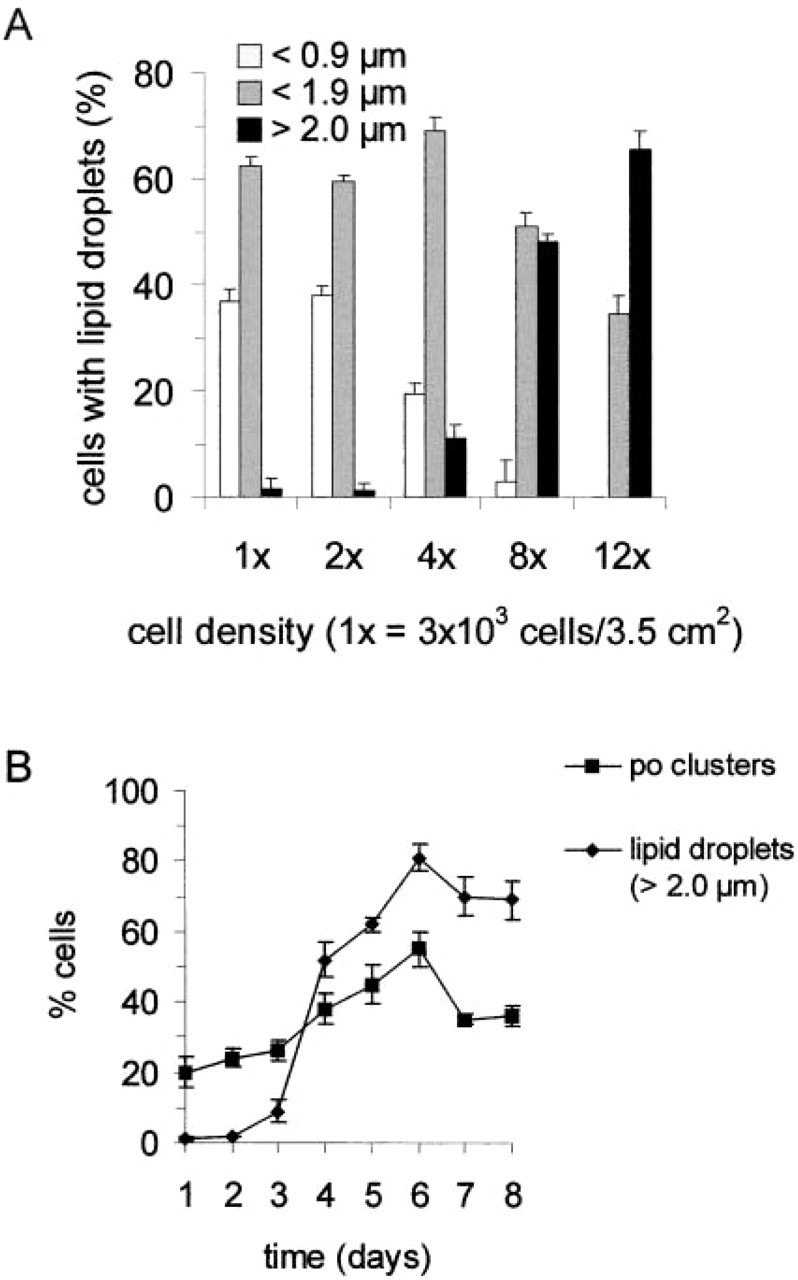
Correlation between the number of peroxisomal clusters, the size of lipid droplets, and cell density. (
Footnotes
Acknowledgments
Supported by a fellowship of the Deutsche Forschungsgemeinschaft (DFG) to MS.
I am grateful to Drs S.J. Gould and A. Völkl for providing antibodies and cDNA constructs. I thank Dr H.-P. Elsässer for assistance with image acquisition. The technical assistance of Katharina Elsässer and Waltraud Sperling is gratefully acknowledged.