
Abstract
Summary
PI3K/Akt/mTOR pathway activation is a hallmark of high-grade gliomas, which prompted clinical trials for the use of PI3K and mTOR inhibitors. However, the poor results in the original trials suggested that better patient profiling was needed for such drugs. Thus, accurate and reproducible monitoring of mTOR complexes can lead to improved therapeutic strategies. In this work, we evaluated the expression and phosphorylation of mTOR, RAPTOR, and rpS6 in 195 human astrocytomas and 30 normal brain tissue samples. The expression of mTOR increased in glioblastomas, whereas mTOR phosphorylation, expression of RAPTOR, and expression and phosphorylation of rpS6 were similar between grades. Interestingly, the overexpression of total and phosphorylated mTOR as well as phosphorylated rpS6 (residues 240–244) were associated with wild-type IDH1 only glioblastomas. The expression and phosphorylation of mTOR and phosphorylation of rpS6 at residues 240–244 were associated with a worse prognosis in glioblastomas. Our results suggest that mTOR and rpS6 could be used as markers of overactivation of the PI3K-mTOR pathway and are predictive factors for overall survival in glioblastomas. Our study thus suggests that patients who harbor IDH1 wild-type glioblastomas might have increased benefit from targeted therapy against mTOR.
Keywords
Introduction
Astrocytomas are brain tumors of glial origin and can be histologically classified into grades I–IV. 1 Pilocytic astrocytomas (grade I) are benign tumors commonly found in children that can be surgically cured. 2 Diffuse astrocytomas (grade II) are non-malignant tumors found in adults. Surgical resection is the standard-of-care, but these tumors often recur at a higher grade. 3 Anaplastic astrocytomas (grade III) are malignant, and treatment includes surgical resections, radiotherapy, and chemotherapy. Progression of the disease to a higher grade is frequently observed, and overall survival is approximately 40–50% at 2 years. 4 Glio-blastomas (GBM-grade IV) are malignant, and despite advances in treatment options, they have overall survival rates of approximately 2.2% in 3 years.5,6 Thus, an improved knowledge of the biology of this tumor type is still required to improve therapies.
Recently, large international consortia determined the most frequent genomic alterations in astrocytomas. Among the main findings, it has been reported that the PI3K/Akt/mTOR pathways is altered in a large percentage of GBM cases, with a PTEN loss in 41% of cases and PI3K amplification or mutation in 25% of cases. 7 mTOR can form two complexes with distinct components and functions: mTOR complex 1 (mTORC1) and mTOR complex 2 (mTORC2). 28 mTORC1 is formed by mTOR, RAPTOR (regulatory associated protein of mTOR), MLST8 (also known as GβL), and PRAS40 (proline-rich AKT substrate 40 kDa). Chemical inhibition of PI3K/mTOR has been used in clinical trials for GBM.8,9 –11 However, the first studies with these drugs were disappointing,9,11 suggesting that patients should be selected for the trials on the basis of PI3K-Akt-mTORC1 pathway activation. 10 Thus, the search for patient subgroups that would benefit from mTORC1 inhibition needs predictive biomarkers, so that the accurate and reproducible monitoring of the PI3K-Akt-mTORC1 pathway is needed before the introduction of these drugs into the clinic. The presence and activation of PI3K-Akt-mTORC1 in gliomas has been evaluated via the phosphorylation of PI3K, Akt, and mTOR and also by the phosphorylation of downstream components such as p70S6K, 4E-BP, and rpS6.12 –23 However, the overall impact of the expression of these proteins on survival remains controversial 24 and often incomplete. For example, the evaluation of the total protein expression (phosphorylated and non-phosphorylated forms) is limited to a reduced number of studies, 24 whereas the expression levels of other proteins of the mTORC1 complex (mLST8 and PRAS40) have not been evaluated or were analyzed only in pediatric low-grade gliomas (RAPTOR).
In this work, we evaluated in 199 cases of astrocytomas (pilocytic, diffuse, anaplastic, and GBM) for the presence and phosphorylation of the mTORC1 components mTOR and RAPTOR. We also evaluated the presence and phosphorylation of the mTORC1 downstream target rpS6 along with their relationship to overall survival and IDH1 mutation R132H.
Materials and Methods
Patient Selection
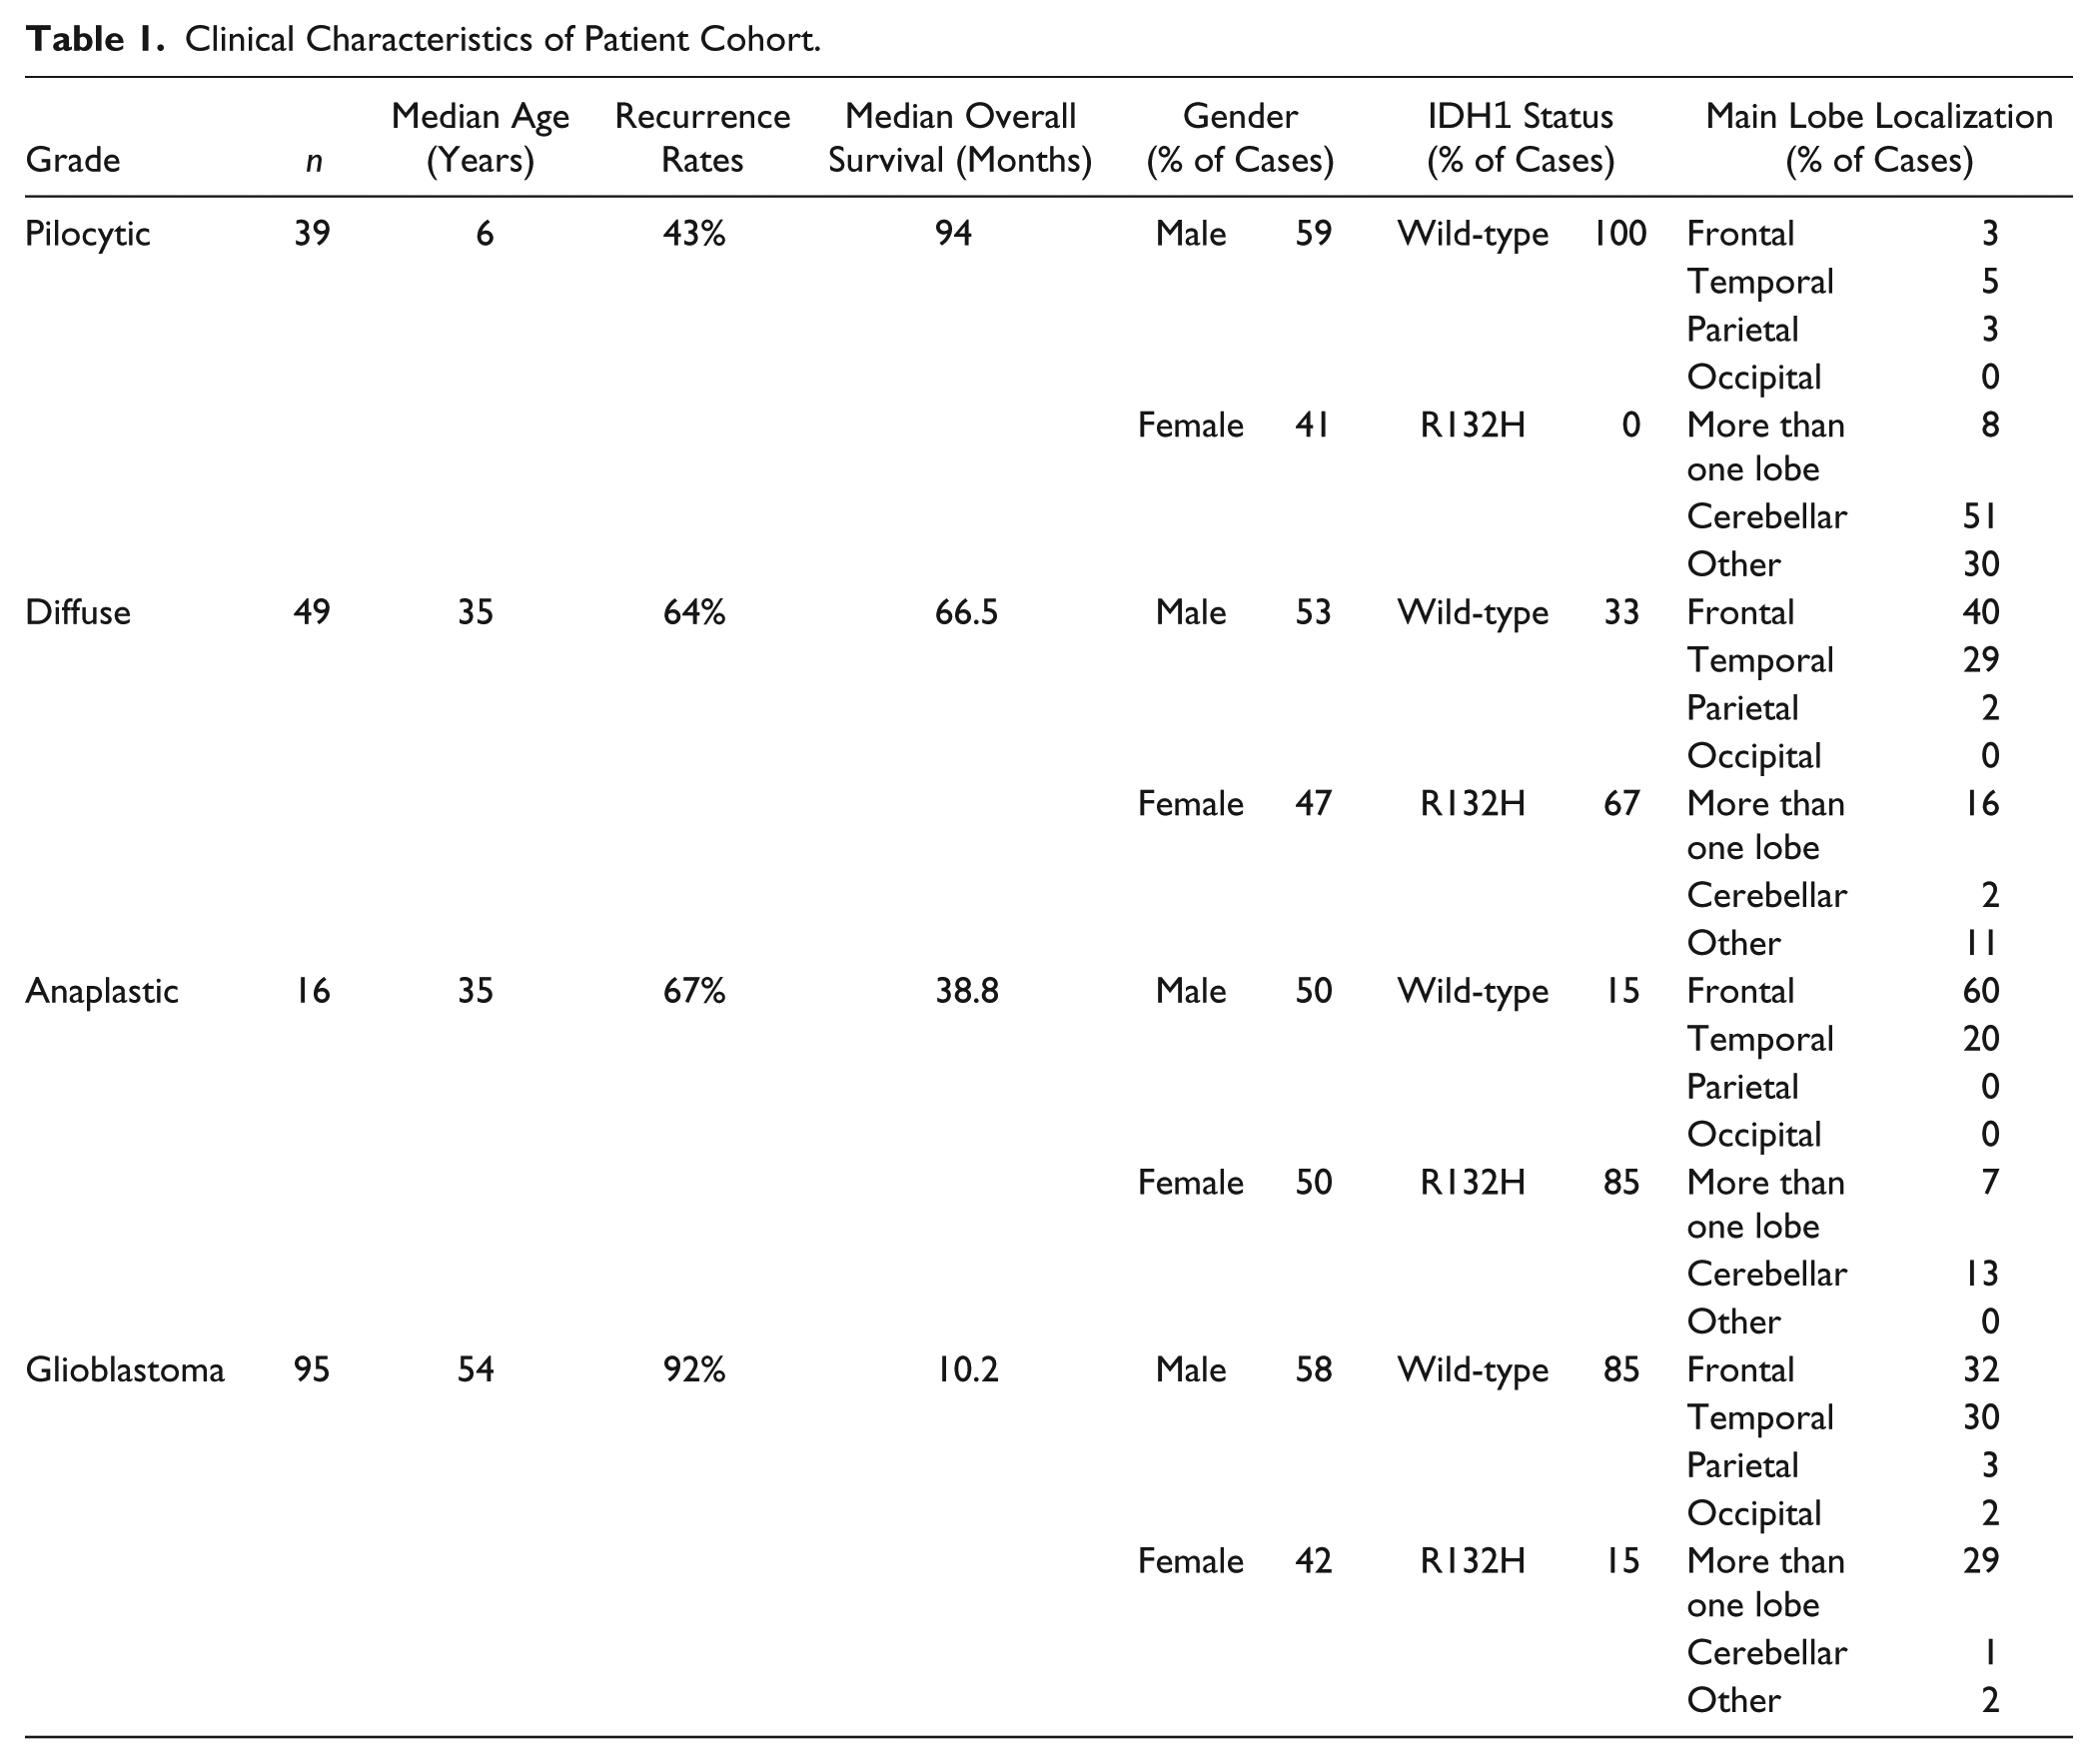
The samples included in this study were used in our previous publications. 24 The cohort includes 199 patients with astrocytomas from the A.C.Camargo Cancer Center, São Paulo, Brazil, from 1980 to 2004. The study population contains 39 cases of pilocytic astrocytomas, 49 diffuse astrocytomas, 16 anaplastic astrocytomas, 95 GBMs, 14 non-tumor brain (NB) tissues, and 16 reactive gliosis tissue from epilepsy surgeries. No oligodendroglial or glioneuronal tumors were included. The study was approved by the Ethical Committee of the A.C.Camargo Cancer Center (approval number 1485/10). 24 The clinical and pathological characteristics of the cohort were included in Table 1.
Clinical Characteristics of Patient Cohort.
Immunohistochemistry
Immunohistochemistry was performed as described 25 using a tissue microarray (TMA) that contained all cases. Briefly, TMA sections were deparaffinized by incubation at 60C for 24 hr, followed by two successive immersions in xylene 30 min each, followed by hydration in solutions with decreasing concentrations of ethanol (100%, 95%, 80%, and 70%). For antigen retrieval, the slides were incubated in 10-mM citrate buffer (pH 6.0) in a pressure cooker for 30 min with preheating for 14 min. To block endogenous peroxidase, sections were incubated in 10% H2O2. Nonspecific staining was blocked by the use of Dako Protein Block (Dako). Sections were incubated with anti-RAPTOR (clone 24C12; Cell Signaling) at a 1:50 dilution, anti-P(S2448)-mTOR (49F9; Cell Signaling) at 1:50 dilution, anti-mTOR (7C10; Cell Signaling) at 1:50 dilution, anti-S6 (5G10; Cell Signaling) at 1:100 dilution, pS235/236-S6 (#4857S; Cell Signaling) at 1:200 dilution, pS240/244-S6 (#2215S; Cell Signaling) at 1:200 dilution, and anti-IDH1 R132H (H09; Dianova) at 1:100 dilution. All staining was done in 1% bovine serum albumin in PBS for 18 hr at 4C in a humidity chamber. Secondary antibody staining was performed using EnVision+ Dual Link (Dako). Color was developed by diaminobenzidine (DAB), and the sections were counterstained with Harris hematoxylin. The quality of the antibodies was verified by Western blot analyses of GBM cell lines and snap frozen glioma tissues. Positive controls included tissues with known protein expression; the primary antibody was omitted for negative controls.
Quantification of HSCORE was digitally made by ScanScope XT from Aperio as described in previous studies. 25 Briefly, each pixel was classified as 0 (negative, threshold 256–220), 1 (weakly positive, threshold 220–175), 2 (positive, threshold 175–100), or 3 (strong positive, threshold 100–0). The number of pixels in each category was then counted. An HSCORE 26 was calculated according to the formula HSCORE = Σ(i × Pi), where Pi = percentage of positive pixels, varied from 0% to 100%, and pixel staining intensity i = 0, 1, 2, or 3. IDH1 R132H immunohistochemistry was used to classify samples as wild-type, when no staining was observed, or mutant when staining of any intensity was observed. The presence of IDH1 mutations R132C, R132G, or R132L was not evaluated.
Statistical Analysis
Differences in expression were tested by Kruskal–Wallis ANOVA and Dunn’s multiple comparison tests. Correlation was assessed by Spearman’s non-parametrical test. The overall survival was assessed by the Kaplan–Meier method and log-rank test using death from disease as the endpoint. Patients below 20 years of age and patients presenting additional tumors in other topologies were excluded from the survival analysis. For survival analysis, the cutoff point was the first quartile value of HSCORE (i.e., values above the first quartile were considered high and values below the first quartile were considered low). The joint effect of different factors was assessed using multivariate Cox regression using SPSS version 12.0 for Windows. Differences were considered statistically significant at p<0.05.
Results
We first determined the expression of mTOR in TMAs containing cases of astrocytomas of different histological grades and non-tumor samples (Fig. 1A–C). We observed that cases with expression of mTOR higher than NB and gliosis were progressively more common with grades I–III (Fig. 1D). In IDH1 wild-type GBMs, the expression of mTOR was significantly increased compared with normal tissue (p<0.0001). This was not observed for R132H IDH1 GBMs where the expression of mTOR was similar to NB and to tumor of other grades. In the GBM group, mTOR expression in wild-type IDH1 is significantly higher than in the R132H IDH1 group (p=0.002).
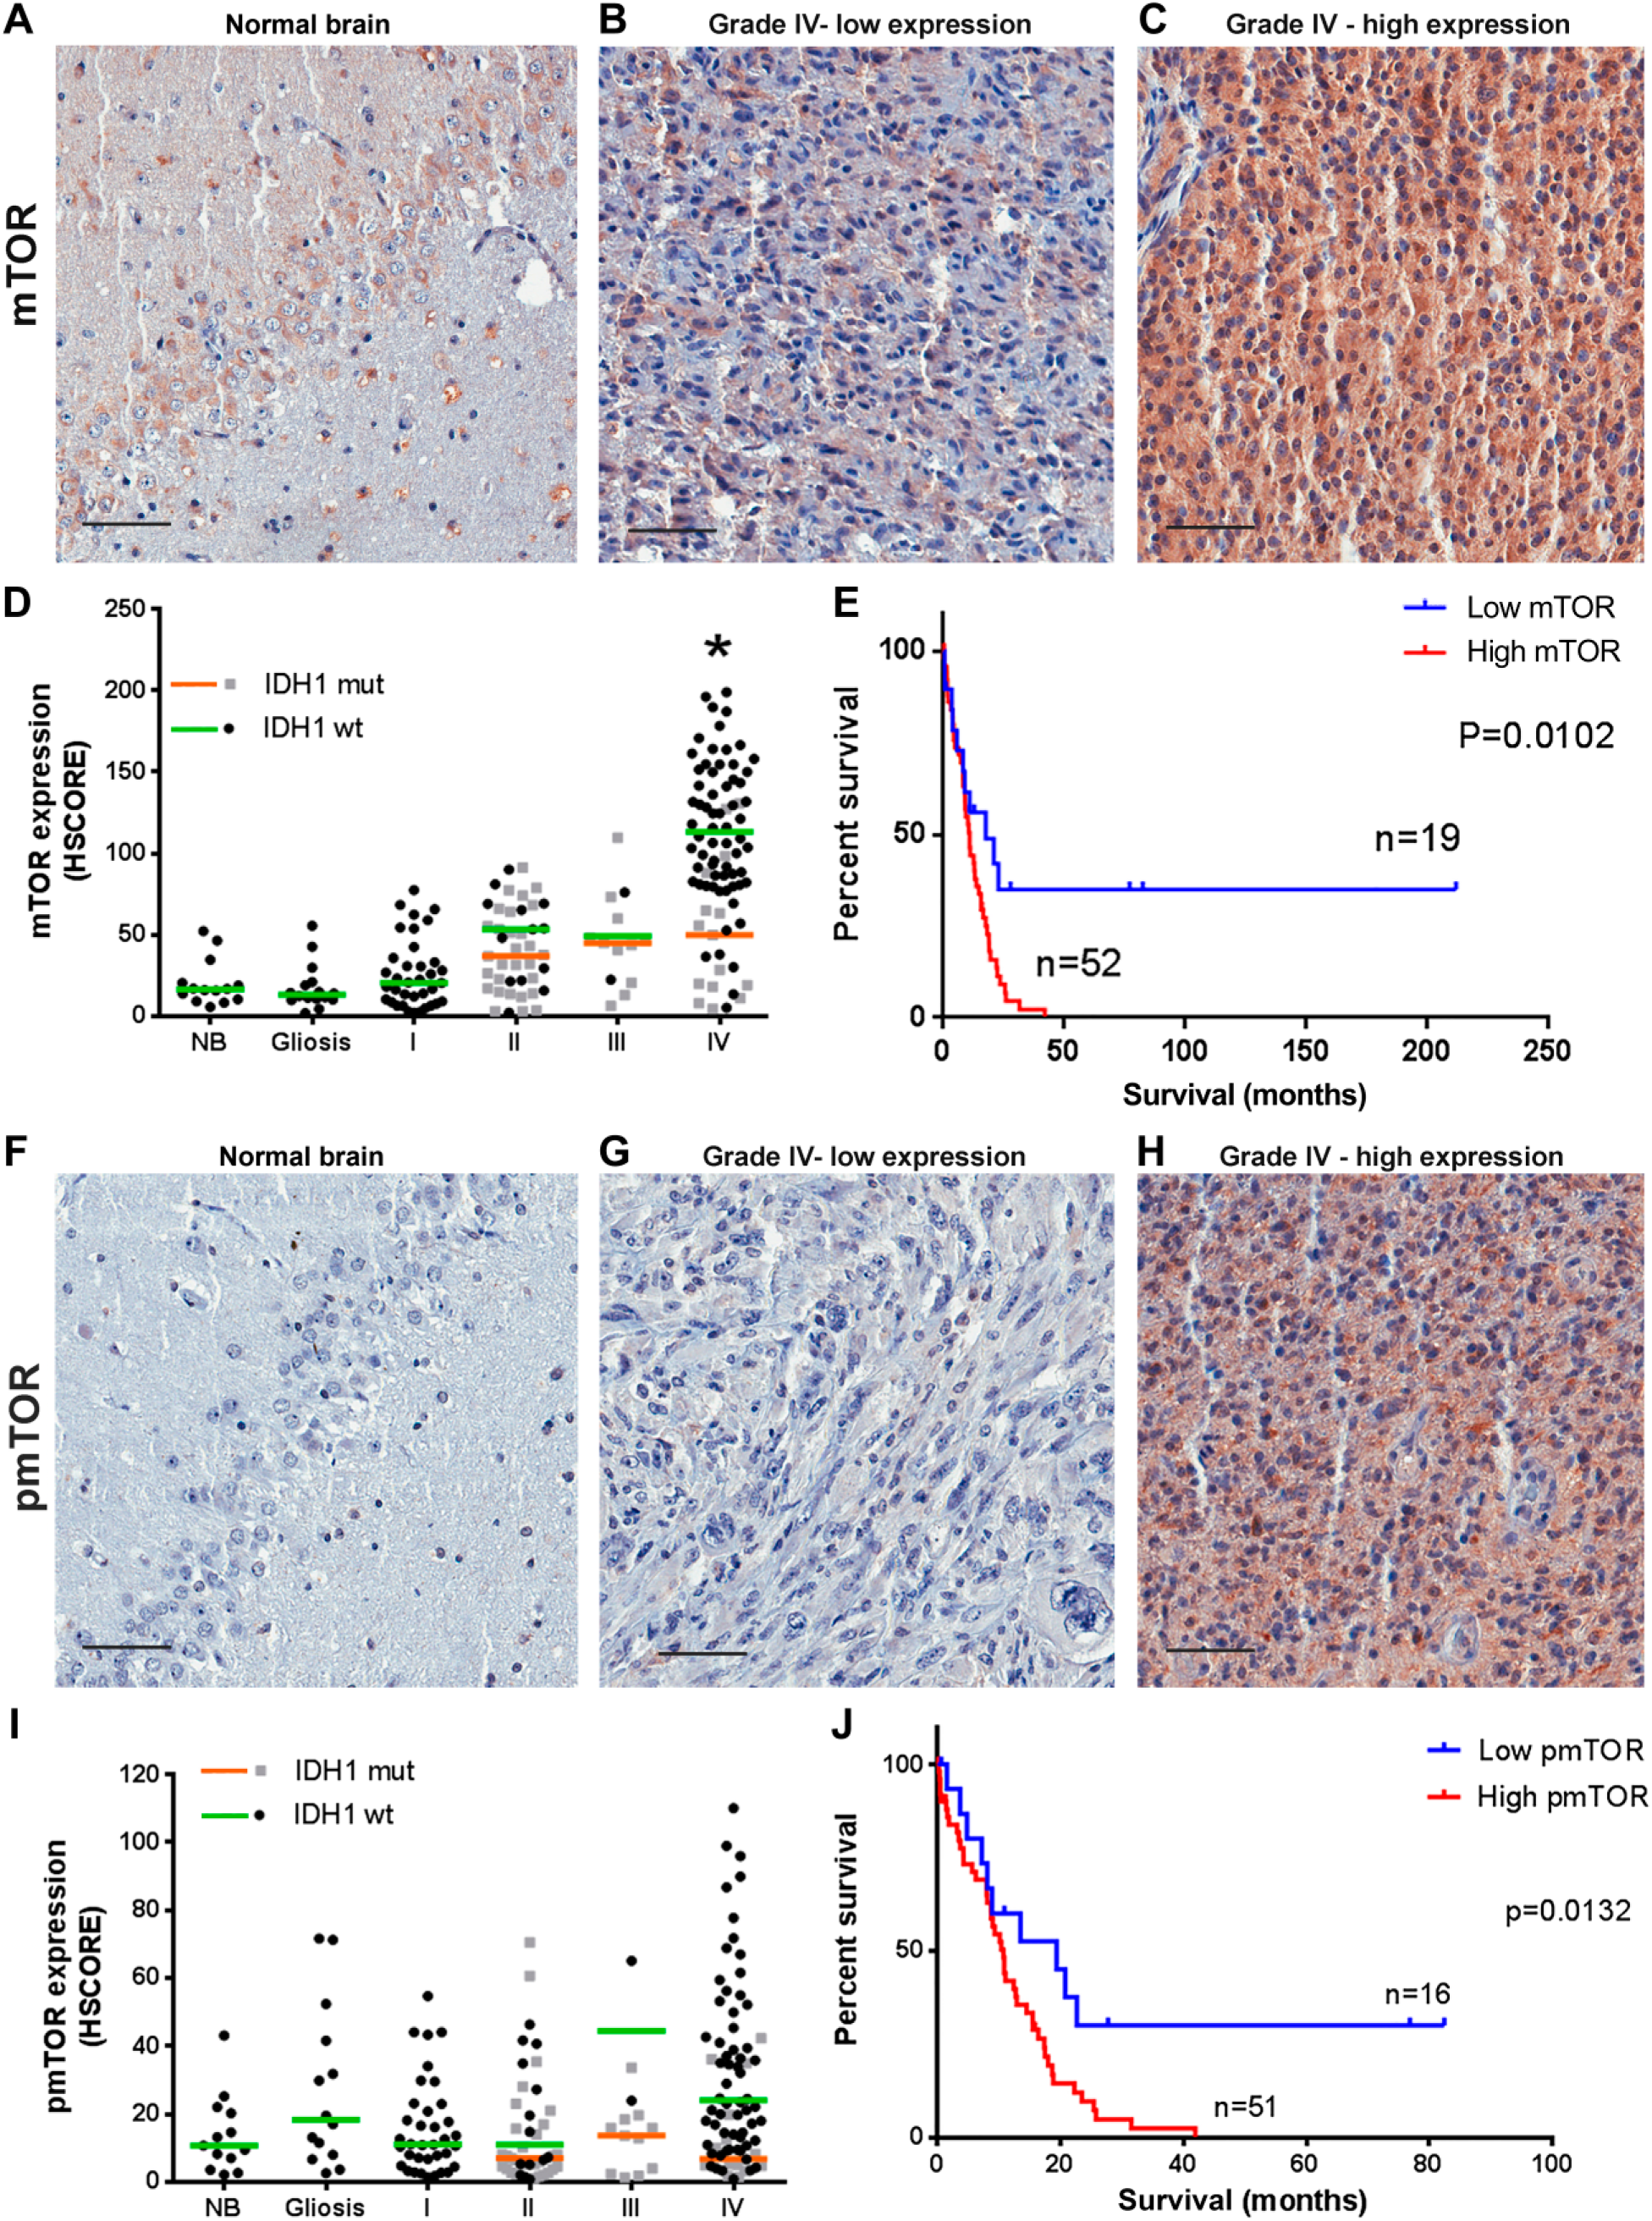
mTOR expression and phosphorylation in astrocytomas according to grade and IDH1 status. Tissues of non-tumoral brain (NB), reactive gliosis (gliosis), and astrocytomas of grades I–IV (pilocytic: I, diffuse: II, anaplastic: III, and GBM: IV) were spotted into a TMA, and immunohistochemistry reactions were performed for p(S2448)-mTOR, mTOR, and IDH1 R132H. Representative immunohistochemistry is shown for NB (A and F) as well as GBMs with low (B and G) and high (C and H) mTOR expression and phosphorylation, respectively. Reactions were quantified automatically, and the HSCORE was calculated considering the intensity of labeling and number of labeled cells for mTOR expression (D) and phosphorylation (I). Samples positive for IDH1 R132H were classified as mutant (mut), and samples negative for IDH1 R132H were classified as wild-type. The overall survival curve of GBM patients according to the levels of mTOR expression (E) and phosphorylation (J) is shown. The cutoff for classification of the sample between high and low was the first quartile (HSCORE 69 for mTOR and 9.21 for pS2448-mTOR). *Statistically different from NB, p<0.0001. Scale bar 50 µm. Abbreviations: NB, non-tumor brain; GBM, glioblastoma; TMA = tissue microarray.
Interestingly, three quarters of the samples presented an HSCORE above 69 (first quartile), while only six samples from diffuse astrocytoma and three from anaplastic astrocytoma presented such strong expression. The 25% of samples with mTOR expression lower than HSCORE 69 (first quartile) have increased survival compared with patients with expression higher than HSCORE 69 (Fig. 1E, log-rank hazard ratio of 0.4443, p=0.0102).
The phosphorylation of mTOR at S2448 showed no significant variation between NB, gliosis, and astrocytomas of all grades (Fig. 1F–I). However, within the GBM group, mTOR phosphorylation in IDH1 wild-type is significantly higher than in the R132H IDH1 group (p=0.0354). In addition, we noted a positive correlation between total mTOR and p(S2448)-mTOR in GBMs (Table 1) as well as increased survival in the one fourth (first quartile, HSCORE 9) of patients with lower p(S2448)-mTOR expression (Fig. 1J, log-rank hazard ratio of 0.4425, p=0.0132). These results suggest that upregulation of mTOR might be an important signaling mechanism in primary GBMs that is related to decreased survival.
Next, we studied the expression of the mTORC1 component, RAPTOR (Fig. 2A–C). We observed that the expression of RAPTOR was highly variable within each group (NB, gliosis, and astrocytomas I–IV). The median and range of RAPTOR expression were similar between groups (Fig. 2D) regardless of the IDH1 status. We also detected a strong association between the expression of RAPTOR and mTOR in pilocytic, diffuse, and GBMs. However, no correlation was observed in anaplastic astrocytomas—probably due to the reduced number of cases (Table 2). We saw no correlation between phosphorylation of mTOR and RAPTOR expression (Table 2). The expression and survival in GBMs were not associated with RAPTOR (log-rank hazard ratio of 0.7291, p=0.3246).
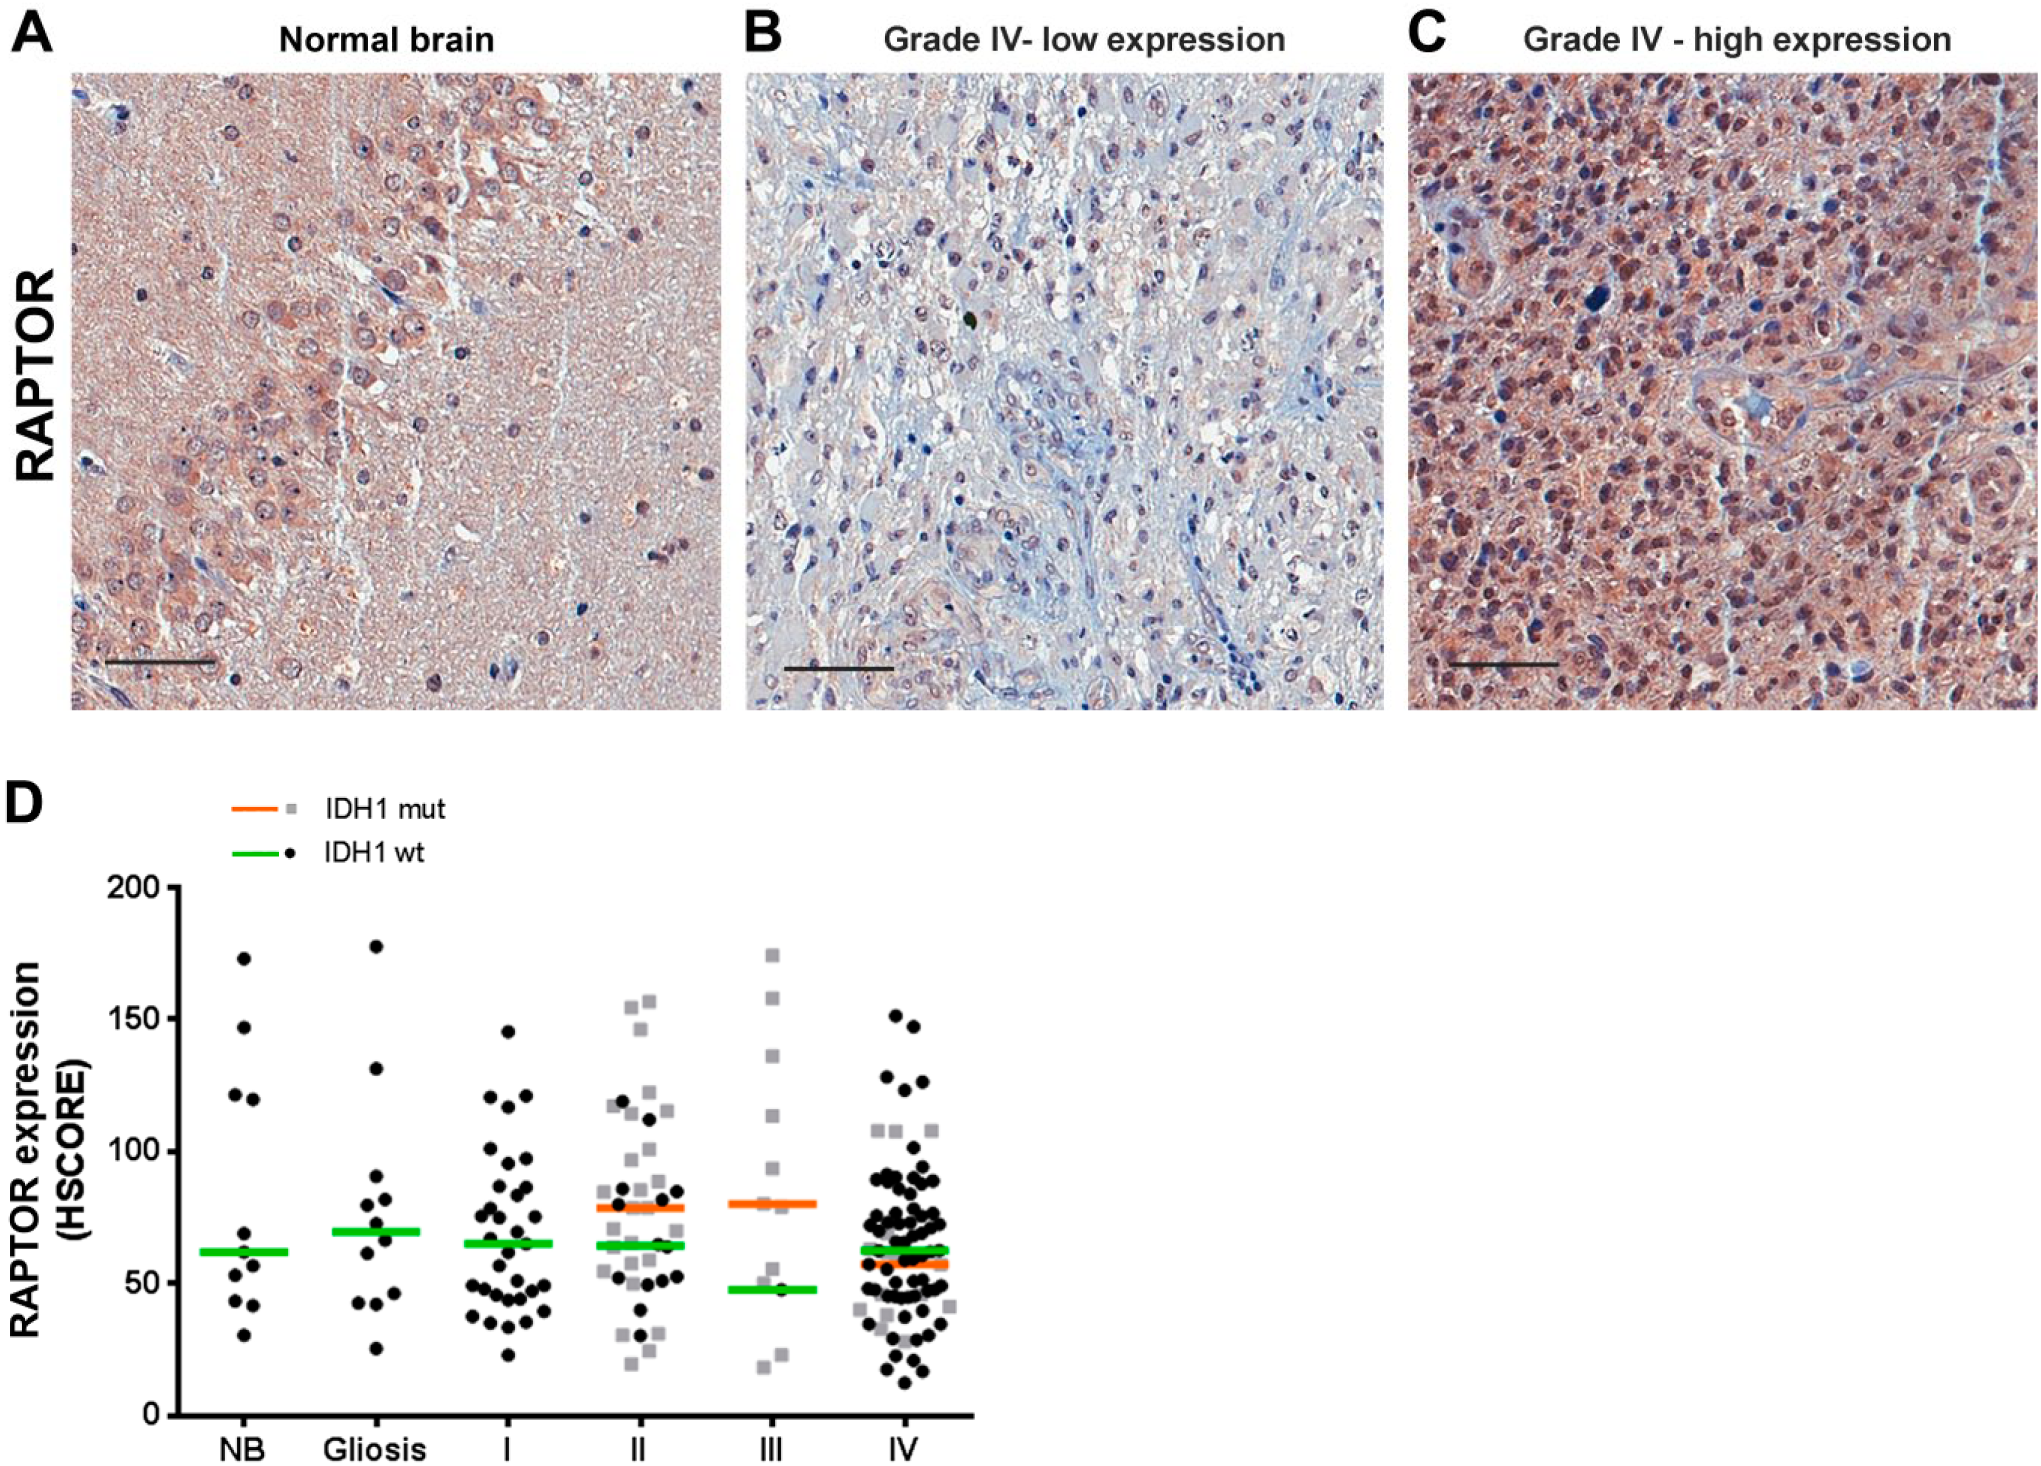
RAPTOR expression in gliomas according to grade and IDH1 status. Tissues of non-tumoral brain (NB), reactive gliosis (gliosis), astrocytomas of grades I–IV (pilocytic: I, diffuse: II, anaplastic: III, and GBM: IV) were spotted into a TMA, and immunohistochemistry reactions were performed for RAPTOR. Representative immunohistochemistry of NB (A) as well as GBMs with low (B) and high (C) RAPTOR expression. Reactions were quantified automatically, and the HSCORE was calculated considering the intensity of labeling and number of labeled cells for RAPTOR (D). Samples positive for IDH1 R132H were classified as mutant (mut), and samples negative for IDH1 R132H were classified as wild-type. Not statistically different when compared with NB. Kruskal–Wallis ANOVA and Dunn’s multiple comparison test. Scale bar 50 µm. Abbreviations: NB, non-tumor brain; GBM, glioblastoma; TMA = tissue microarray.
Correlation Analysis of the Expression of the Proteins Analyzed in This Study.
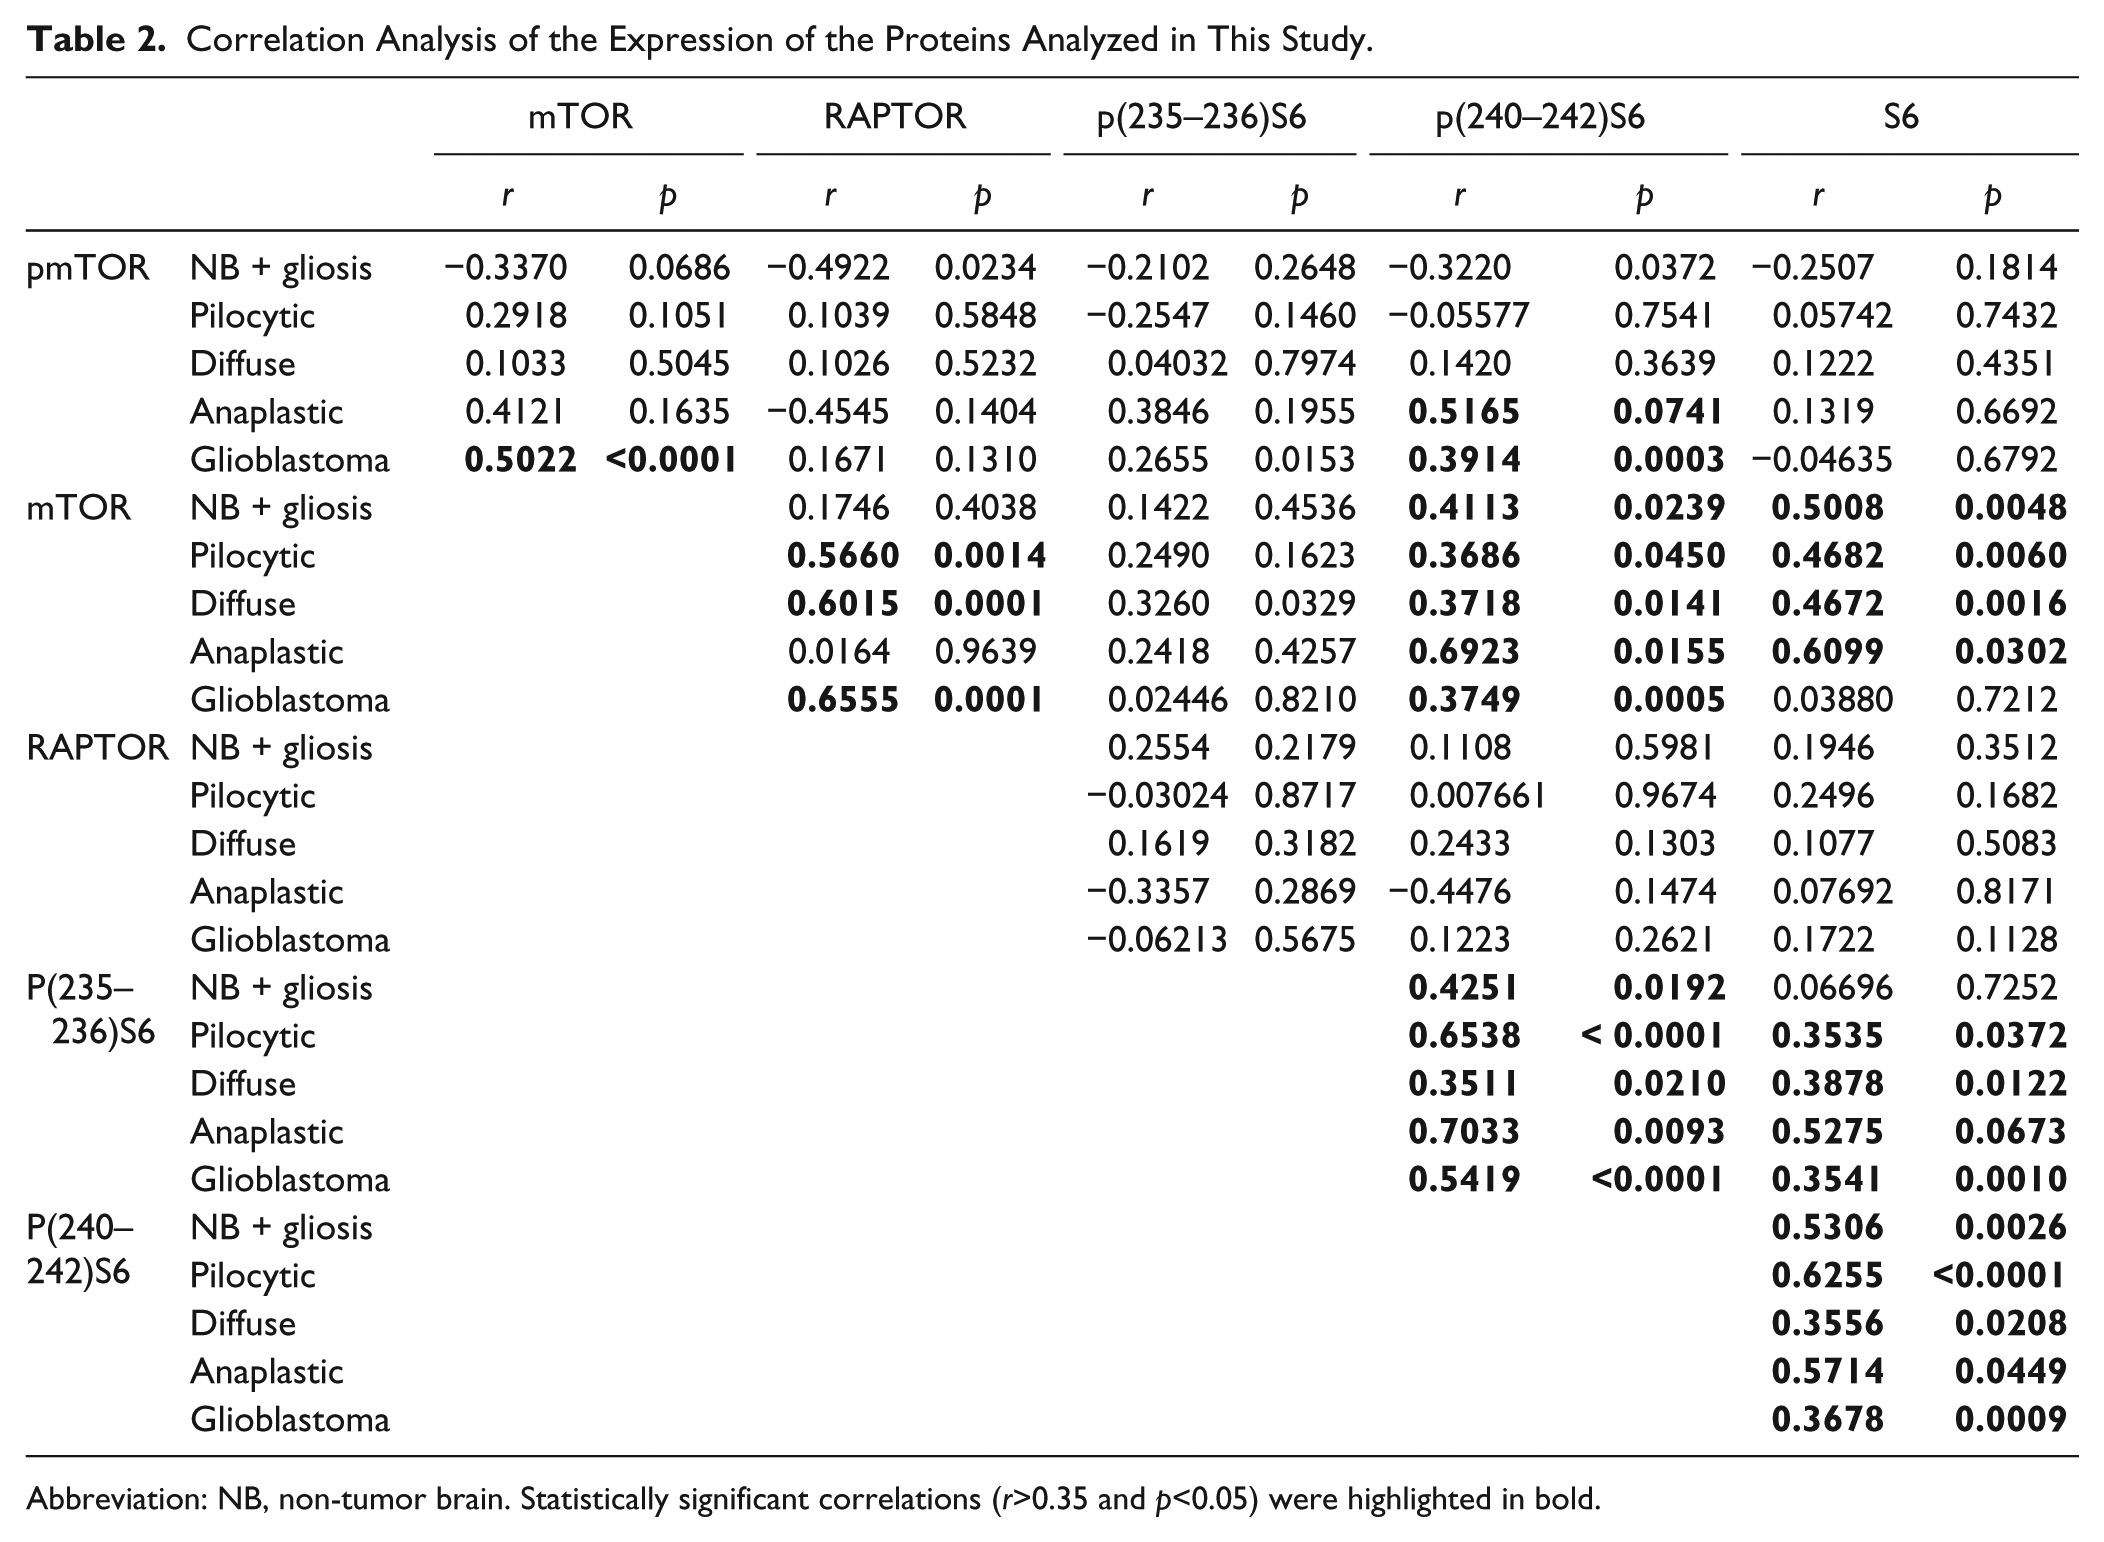
Abbreviation: NB, non-tumor brain. Statistically significant correlations (r>0.35 and p<0.05) were highlighted in bold.
We also observed the presence and phosphorylation of the mTORC1 downstream target rpS6. Expression and phosphorylation of rpS6 are especially abundant on neurons and are visible in the photomicrographs of NB tissue (Fig. 3A, C, and E). In tumors of all grades, the expression and phosphorylation of rpS6 are very variable within groups and there were no differences in the median expression of rpS6 (Fig. 3G–I, L) or phosphorylation in residues 235–236 and 240–244 (Fig. 3A–F, J–K) between groups regardless of IDH1 status. However, within the GBM group, rpS6 phosphorylation of residues 240–244 in IDH1 wild-type is significantly higher than in the R132H IDH1 group (p=0.0018).
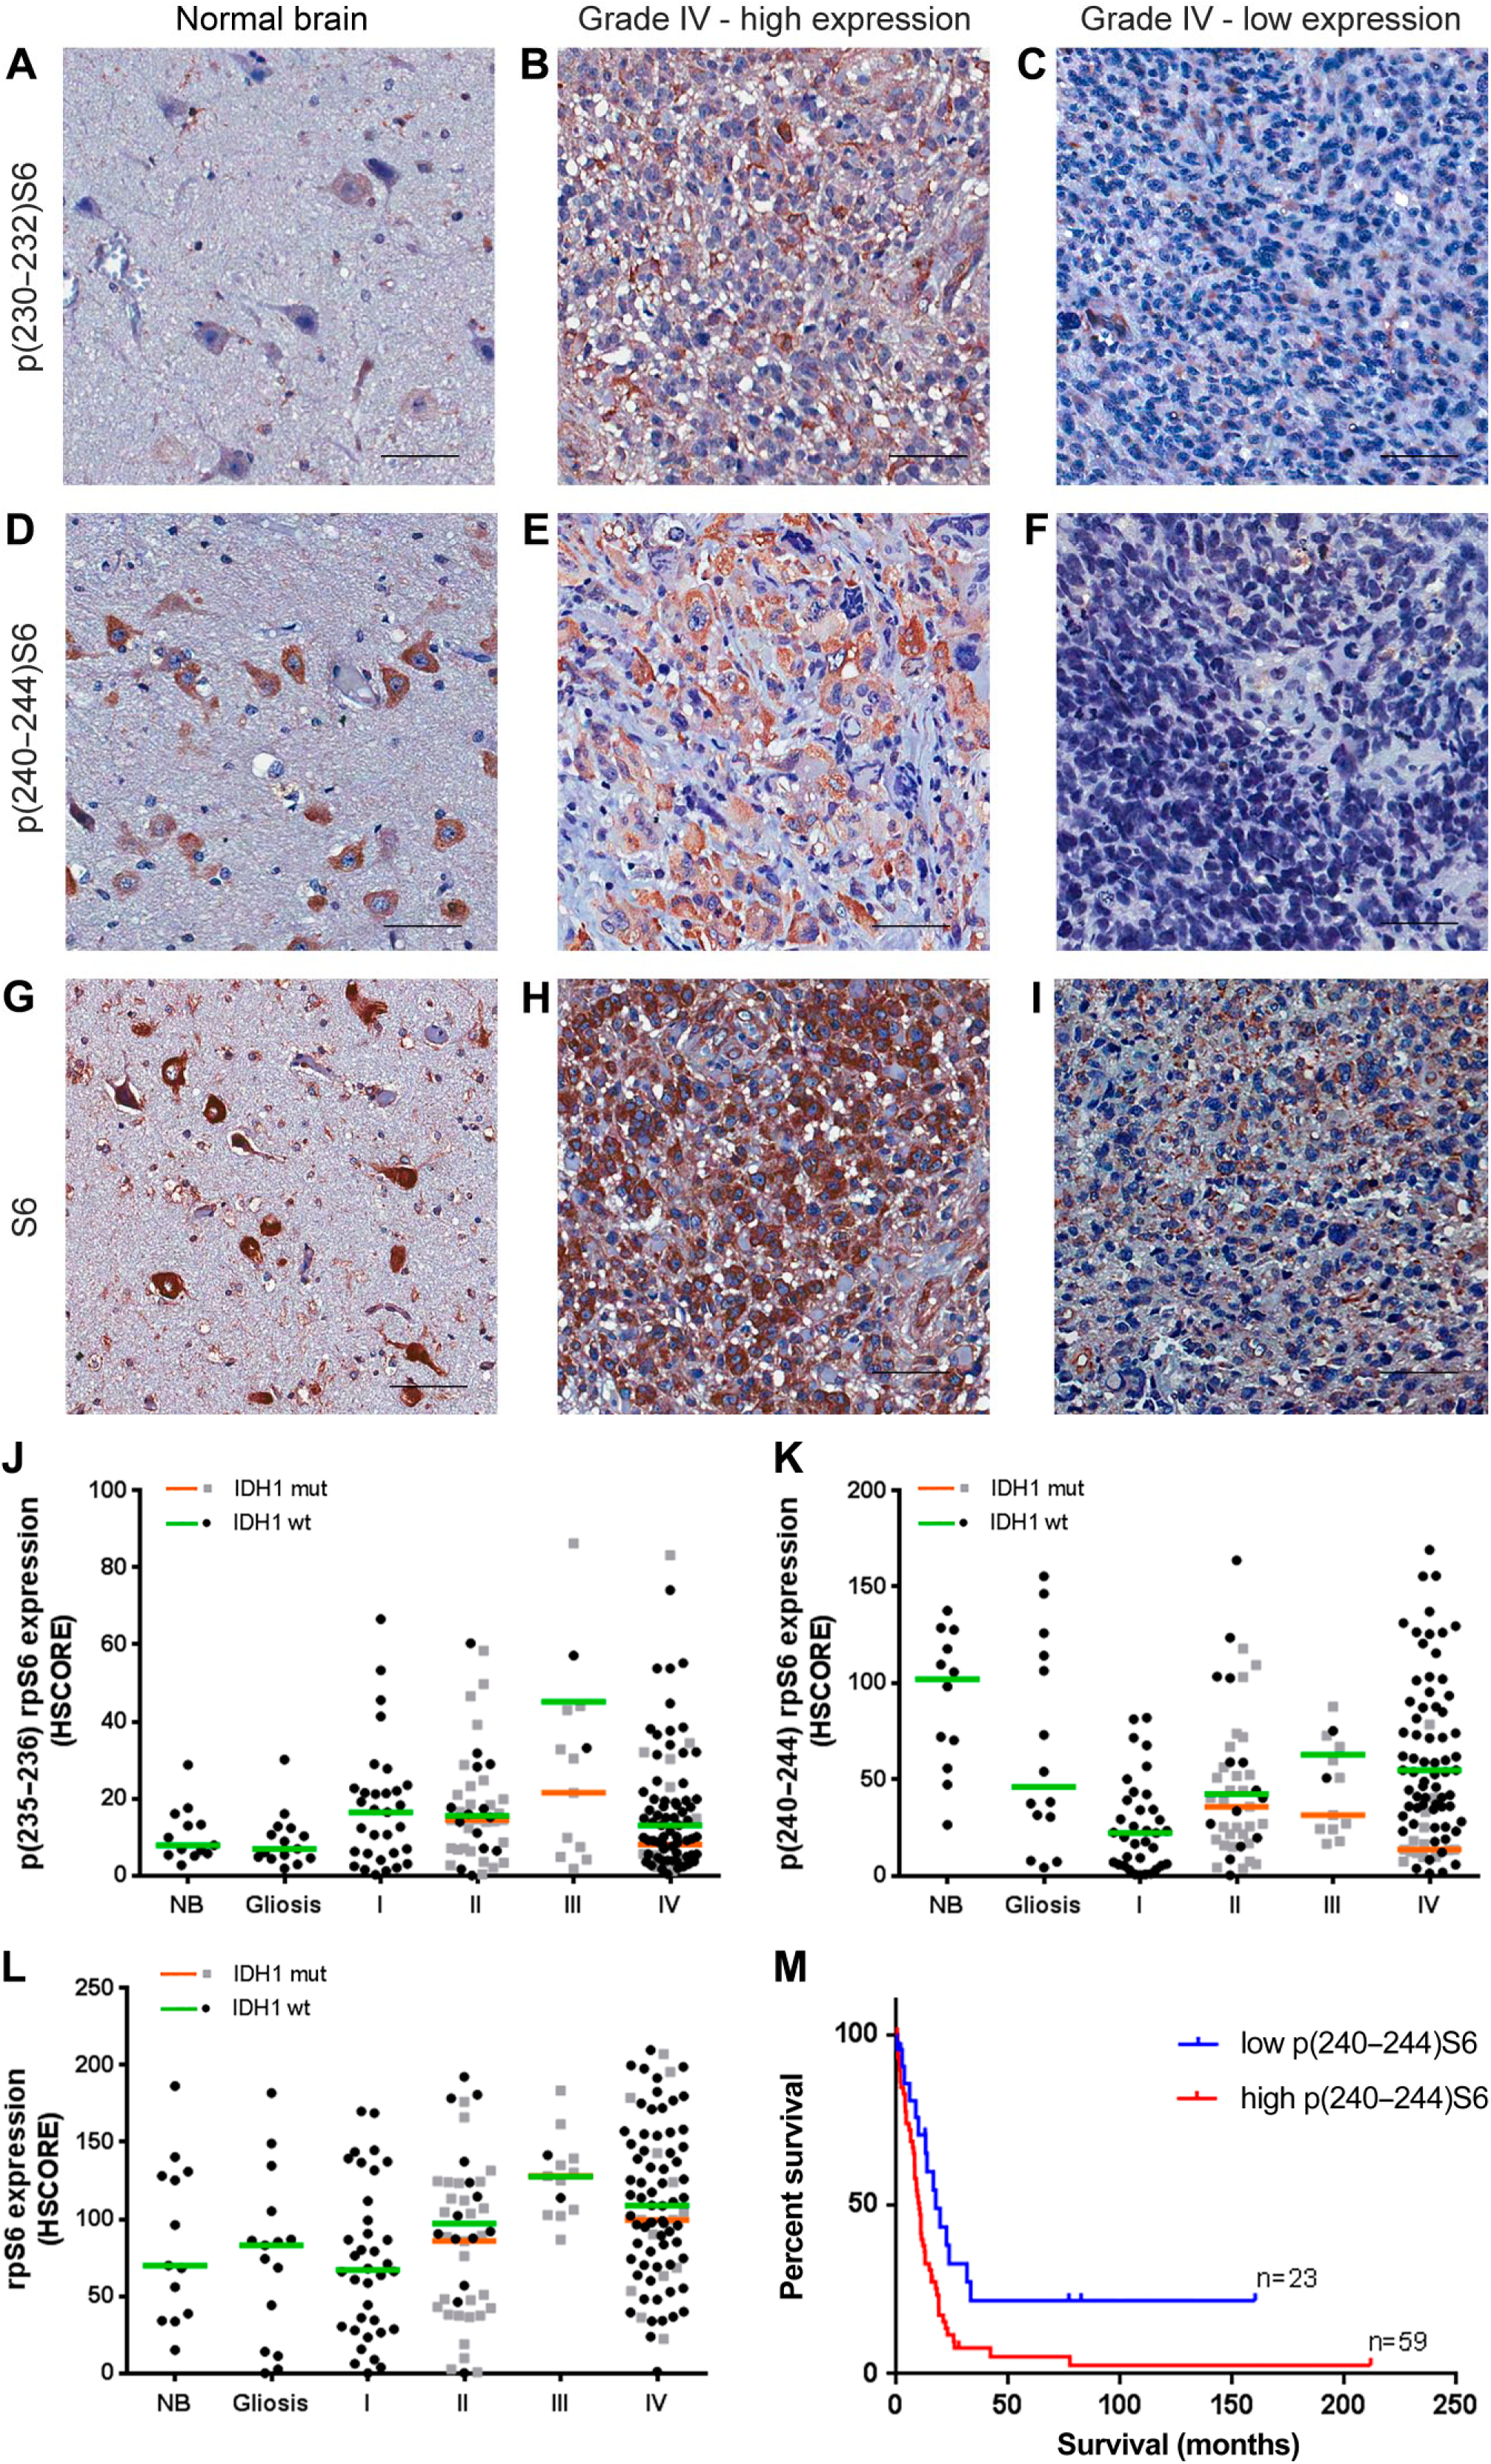
rpS6 expression and phosphorylation in gliomas according to grade and IDH1 status. Tissues of non-tumoral brain (NB), reactive gliosis (gliosis), and astrocytomas of grades I–IV (pilocytic: I, diffuse: II, anaplastic: III, and GBM: IV) were spotted into a TMA, and immunohistochemistry reactions were performed for p(232–235)S6, p(240–244)S6, total S6, and IDH1 R132H. Representative immunohistochemistry of non-tumoral brain (A, D, and G) as well as GBMs with high (B, E, and H) and low (C, F, and I) S6 phosphorylation at 232–235 and 240–244, respectively. Reactions were quantified automatically, and the HSCORE was calculated considering the intensity of labeling and the number of labeled cells for the phosphorylation of residues 232–235 (J), 240–244 (K), and total expression (L). Samples positive for IDH1 R132H were classified as mutant (mut), and samples negative for IDH1 R132H were classified as wild-type. The overall survival curve of GBM patients according to the levels of S6 phosphorylation at residues 240–244 is also shown (M). The cutoff for classification of the sample between high and low was the first quartile (HSCORE 45). Not statistically different from NB, p<0.05. Scale bar 50 µm. Abbreviations: NB, non-tumor brain; GBM, glioblastoma; TMA = tissue microarray.
We observed a strong association between the phosphorylation of the 235–236 and 240–244 residues and the expression of rpS6 (Table 2). There is also an association between expression and phosphorylation of mTOR and the expression and phosphorylation of rpS6 at residues 240–244 (Table 2).
Regarding survival, we observed an impact of p(240–244)S6 expression. Increased survival was observed in the first quartile (HSCORE 45) of patients with lower p(240–244)S6 expression (Fig. 3K, log-rank hazard ratio of 0.4762, p=0.0079). No association between patient survival and S6 expression or phosphorylation in residues 232–235 was observed (log-rank hazard ratio of 0.9216, p=0.7799 for p(232–235)S6 and 0.5761, p=0.0552 for rpS6 expression). Multivariate Cox regression indicated that age, IDH1 status, and p(240–244)S6 were independent prognostic factors compared with mTOR expression, pmTOR expression, sex, chemotherapy, and radiotherapy response. These results reinforce the idea that upregulation of mTORC1 might be an important mechanism in primary GBMs.
Discussion
The mTOR kinase is responsible for the integration of several signaling pathways within the cell, such as tyrosine kinase receptor signaling, glucose sensing, presence of essential amino acids, Ras GTPases, and so on. 27 mTORC1 targets include the 70-kDa S6 kinase (p70S6K) and the eIF4E binding protein (4E-BP). 29 p70S6K is responsible for the phosphorylation of ribosomal protein S6 (rpS6) in residues 232, 235, 240, and 244, which is thought to increase mRNA translation. 30 rpS6 can also be phosphorylated in residues 240–244 by the 90-kDa S6 kinase (RSK), which is a target of the Ras/ERK1/2 signaling pathway. 31
Studies evaluating mTOR phosphorylation are not consensual on the importance of this protein for progression or survival. Our data showed no increase in the phosphorylation of mTOR in GBMs compared with normal tissue. However, mTOR phosphorylation was associated with a worse prognosis in GBMs (Fig. 1). Four publications analyzed the relationship of pmTOR (S2448) with histological grade, with conflicting results. One study observed no difference of pmTOR with grade; however, the study included only patients below 21 years of age. 23 Three other studies showed an increase in pmTOR (S2448) expression with grade.12,17,18 Two reports showed a negative impact of pmTOR on survival and two others did not. These differences (summarized in Table 3) might be due to methodological inconsistencies, such as different statistical analysis (paired analysis of two groups instead of ANOVA-based analysis), inaccurate grouping of samples (grouping grade I and II tumors together, grouping all grades together for the survival analysis, disease-free survival analysis including GBMs), different age groups (patients below 21 years of age), or score-based differences. These contradictions indicated the need for further studies to define the importance of these proteins in gliomas. Our methodology included the use of TMA, which guarantees the homogeneity of the immunohistochemistry reaction between the tissues and automated evaluation, which reduces human errors as well as produces a continuous HSCORE for accurate and reproducible evaluation of immunohistochemistry.
Expression of mTOR, rpS6 and Its Phosphorylated Forms, and RAPTOR in Gliomas.
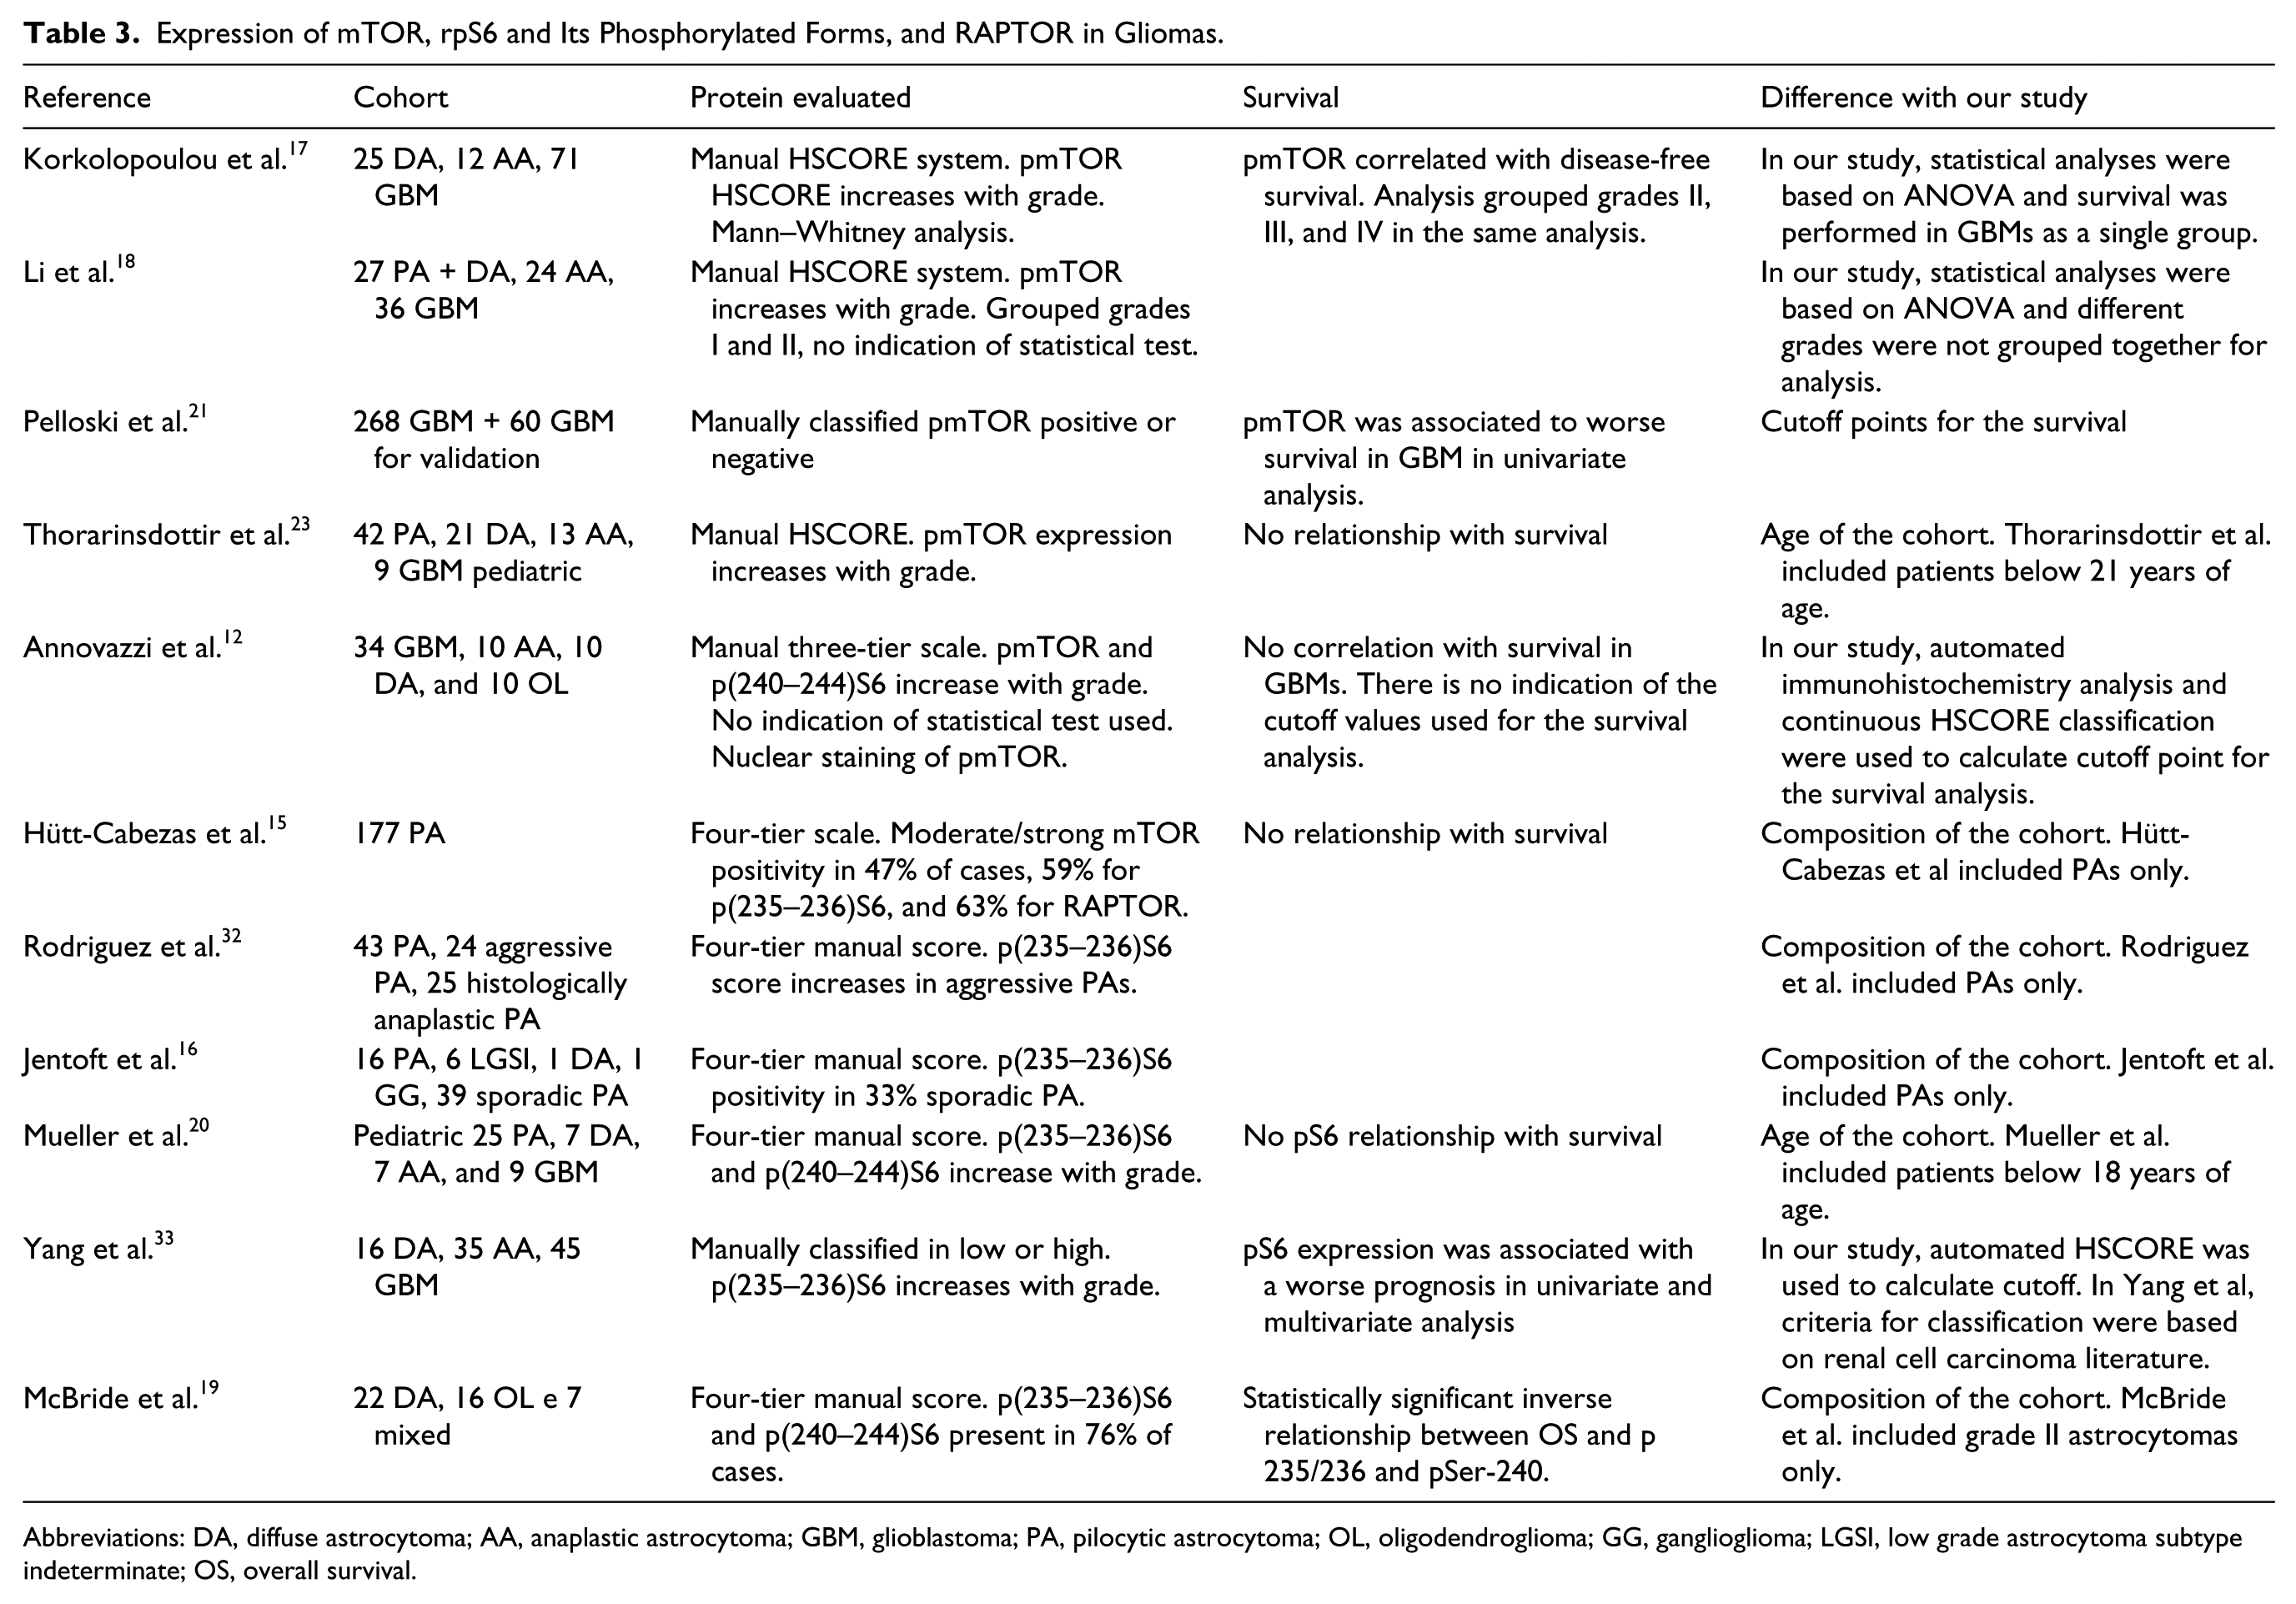
Abbreviations: DA, diffuse astrocytoma; AA, anaplastic astrocytoma; GBM, glioblastoma; PA, pilocytic astrocytoma; OL, oligodendroglioma; GG, ganglioglioma; LGSI, low grade astrocytoma subtype indeterminate; OS, overall survival.
In spite of the many studies that evaluated pmTOR, the total mTOR levels were evaluated in only one pediatric tumor study. 15 Thus, to the best of our knowledge, this is the first work to indicate that mTOR expression increases in GBM and is related to worse overall survival (Fig. 1).
The presence of RAPTOR has been evaluated in one study of pediatric low-grade tumors. 15 Its expression might be another mechanism by which tumors can alter the activity of the complex. Even though RAPTOR expression was highly variable, our results demonstrate that RAPTOR expression retained a similar distribution within each group studied. Accordingly, no correlation was observed between RAPTOR and survival. These results suggest that the increase in mTORC1 activity in gliomas is not due to an increase in RAPTOR expression.
The activation of the PI3K/AKT/mTORC1 pathway can be measured by its downstream targets including the phosphorylation of the ribosomal protein S6, which is a target of both p70 and p90 S6 kinases (p70S6K and RSK).30,31 The phosphorylation of rpS6 was shown mainly for residues 232–235. The phosphorylation of these residues was shown to increase with grade12,33 and to correlate with mTOR phosphorylation. 14 The relationship with survival, however, is controversial and has been associated with poor prognosis of grades I and IV in some studies32,33 but not in others.12,15,16 Our study shows no association with grade or survival for the phosphorylation of this residue. Again in this case, differences may be due to methodological inconsistencies (Table 3), such as different cutoff points, different age groups (many studies included only pediatric cases), or score-based differences. As discussed above, the methodology applied here enables a more accurate and reproducible evaluation of the immunohistochemistry results.
Phosphorylation of S6 residues 240–244 was seen only in two articles: one describes a relationship with survival in diffuse astrocytomas, 19 and one describes an increase of phosphorylation with grade in pediatric cases. 20 Surprisingly, the phosphorylation of these residues displayed a strong association with survival of GBM patients and was the only protein whose expression was independently associated with survival in a multivariate analysis. The activation of ERK1/2 pathways may contribute for this phosphorylation, because these residues can be phosphorylated by both p70S6K and RSKs.
An increase in the expression of rpS6 could account for an increase in its phosphorylation. In addition, rpS6—particularly its unphosphorylated form—is a mediator of apoptotic cell death induced by TRAIL. Thus, it is important to determine total expression levels of this protein. 34 Curiously, the expression levels of this protein were not evaluated despite the significant number of articles in the literature observing phosphorylation of rpS6 in human gliomas. Our results showed no association with histological grade or impact in survival.
Interestingly, there was a strong increase in mTOR expression, phosphorylation, and rpS6 phosphorylation in primary GBMs (wild-type for IDH1) when compared with secondary GBMs. The levels of mTOR, pmTOR, and p(240–244)S6 in secondary GBMs were very similar to diffuse and anaplastic astrocytomas. These results suggest that primary GBMs may have a tumorigenic pathway that is much more dependent on mTOR than secondary GBMs. Therefore, suggesting that therapies targeted at mTOR would only benefit primary GBMs. A limitation to our study is that we did not evaluate IDH1 mutations R132C, R132G, or R132L, which collectively represent less than 10% of the alterations observed in IDH1. In our cohort, we would expect only one or two cases bearing R132C, R132G, or R132L, which is insufficient to determine whether these mutations would also impact the expression of mTOR and rpS6.
Previous studies have addressed the relationship between IDH1 and mTOR activation in glioma experimental models.35,36 However, conversely to what we have suggested, it was observed that R132H IDH1 mutation increased mTOR pathway activity via an imbalance of the cell’s redox state. However, the experimental models tested so far induced overexpression of IDH1, which may not match human GBMs.35,36 Furthermore, an increase in the expression of p(240–244)S6 in R132H IDH1 was observed in astrocytomas of grades II and III; however, data presented included only six cases (with no quantification data) and no grade IV astrocytomas. 36 Our data showed no statistical association between IDH1 status and proteins of the mTOR activation pathway in grades II and III. An additional article demonstrated no relationship between R132H IDH1 and pmTOR. However, this analysis grouped together astrocytomas of grades II, III, and IV, 17 which may obscure the relevance of IDH1 and mTOR activation in GBMs.
Thus, this work presents strong data to support an overactivation of the mTOR pathway in primary astrocytomas that are associated with a worse survival. If confirmed, these results may indicate that targeted therapies against mTOR in GBM would preferentially benefit patients with primary GBM and warrant further clinical trials with mTOR-targeted therapies.
Footnotes
Acknowledgements
The authors are very grateful to Dr. Rui Reis and the Pathology Department of the Hospital de Câncer de Barretos for the IDH1 R32H antibody. Samples were provided by the A.C.Camargo Cancer Center Biobank.
Competing Interests
The author(s) declared no potential conflicts of interest with respect to the research, authorship, and/or publication of this article.
Author Contributions
AWA, LEM, and FFS conducted the immunohistochemistry reactions and analyzed the data; LEM reviewed clinical data; and LFBT reviewed pathological classification. IWC and MDB supervised the immunohistochemistry, reviewed pathological classification, and analyzed the data. VRM and MR analyzed the data. GNMH analyzed the data and wrote the paper. Each author has read and approved the manuscript prior to submission.
Funding
The author(s) disclosed receipt of the following financial support for the research, authorship, and/or publication of this article: This work was funded by Fundação de Amparo à Pesquisa do Estado de São Paulo (FAPESP) grants to G.N.M.H. (2014/15550-9) and M.R. (2015/15451-3). Coorde-nadoria de Apoio à Pesquisa (CAPES) fellowships to A.W.A. and L.E.M. are gratefully acknowledged.