
Abstract
The mammalian target of rapamycin (mTOR) binds to several protein partners and forms two complexes, termed mTOR complexes 1 and 2 (mTORC1/2), that differ in components, substrates, and regulation. mTORC2 contains the protein Rapamycin-insensitive companion of mTOR (RICTOR); phosphorylates kinases of the AGC family, such as Akt; and controls the cytoskeleton. Even though the regulation of mTORC2 activity remains poorly understood, the hyperactivation of this signaling pathway has been shown to contribute to the oncogenic properties of gliomas in experimental models. In this work, we evaluated expression and phosphorylation of Akt, and expression of RICTOR and Ki-67 in 195 human astrocytomas of different grades (38 cases of grade I, 49 grade II, 15 grade III, and 93 grade IV) and 30 normal brains. Expression and phosphorylation of Akt increased with histological grade and correlated with a worse overall survival in glioblastomas (GBMs). RICTOR was overexpressed in grade I and II astrocytomas and demonstrated a shift to nuclear localization in GBMs. Nuclear RICTOR was associated to increased proliferation in GBMs. Our results point to an increase in total and phosphorylated Akt in high-grade gliomas and to a possible role of RICTOR in proliferations of high-grade GBM cells.
Keywords
Introduction
Gliomas are the most common type of brain tumors. The World Health Organization (WHO) classifies gliomas in astrocytic, oligodendroglial, and ependymal tumors. Based on histopathological properties, the astrocytomas are further classified into grades I to IV.1,2 Grade I astrocytomas, also known as pilocytic astrocytomas (PA), are most common in children. They present slow growth and, in general, absence of malignant progression. Complete resection yields 100% recurrence-free survival without adjuvant therapy. 3 However, when the tumors are located in anatomic regions that do not allow surgical resection, traditional therapies are not effective. 4 Grade II or diffuse astrocytomas have a mean age of incidence of 35 to 45 years and are also considered nonmalignant. However, grade II astrocytomas may recur to a higher grade. 1 Grade III or anaplastic astrocytomas have a median age of onset at 46 years and represent 10% to 15% of all astrocytomas. Survival rates after surgery plus radiotherapy and chemotherapy are of approximately 40% to 50% in 2 years and 18% in 5 years.2,5 Grade IV astrocytomas or glioblastomas (GBMs) are among the deadliest tumor types, with a survival rate after diagnosis of 2.2% in 3 years. Standard treatment includes surgical resection, radiotherapy, and concomitant adjuvant treatment with the DNA alkylating drug, temozolomide.6,7 Thus, deciphering the molecular pathways involved in the progression of astrocytomas is fundamental for the development of more specific and effective therapies.
The mammalian Target of Rapamycin (mTOR) kinase is one of the master regulators of cell metabolism and physiology. It can form two different protein complexes with distinct components and functions, namely, mTOR complex 1 (mTORC1) and mTOR complex 2 (mTORC2). 8 mTORC1 is formed by mTOR, raptor (regulatory associated protein of mTOR), MLST8 (also known as GβL), and PRAS40 (proline-rich Akt substrate 40 kDa) and, among several functions, controls mRNA translation initiation, cell growth, and proliferation. 9 A wide variety of stimuli can signal to mTORC1, such as the presence of growth factors through the PI3K/Akt pathway, glucose sensing through the AMP-activated protein kinase (AMPK) pathway, and the presence of essential amino acids, Ras GTPases, among others. 10 A common finding in several types of cancers is an exacerbation in mTORC1 signaling. In fact, mTOR inhibitors, such as rapamycin, are currently being tested in clinical trials for several types of cancers. 11 Rapamycin has been used in clinical trials for GBMs, however, with disappointing results. 11 One possible explanation for this fact is that mTOR also participates in another complex, called mTORC2, composed by the proteins Rapamycin-insensitive companion of mTOR (RICTOR), stress-activated map kinase-interacting protein 1 (SIN1), and protein observed with RICTOR (Protor-1), that is much less sensitive to rapamycin. 12 Among the functions of mTORC2 are the phosphorylation of some AGC kinases, including Akt (S473), and the control of cytoskeleton. 12
The presence and activation of PI3K-Akt-mTORC1 in gliomas has been extensively studied, monitored mainly by the phosphorylation of PI3K, Akt, mTOR, and also by the phosphorylation of downstream components such as p70S6K (mostly T389), 4E-BP (mostly Thr37/46), and S6 (mostly S235/236), where they have been correlated to a worse prognosis.13–24 The presence or activity of the mTORC2, however, was less explored (Table 1). mTORC2 activity and RICTOR expression have been described in cell lines, in a few GBM samples, 25 and in pediatric low-grade gliomas, 20 where it was suggested that mTORC2 would also contribute to tumorigenesis. Thus, the impact of mTORC2 in gliomas remains largely unaddressed. In this work, we evaluated the presence of RICTOR and Akt phosphorylation on S473 in 195 cases of astrocytomas of all grades, along with their relationship with overall survival and proliferation.
Meta-Analysis of Published Studies That Evaluated Protein Expression of Akt, mTOR, Raptor, or RICTOR in Human Gliomas.
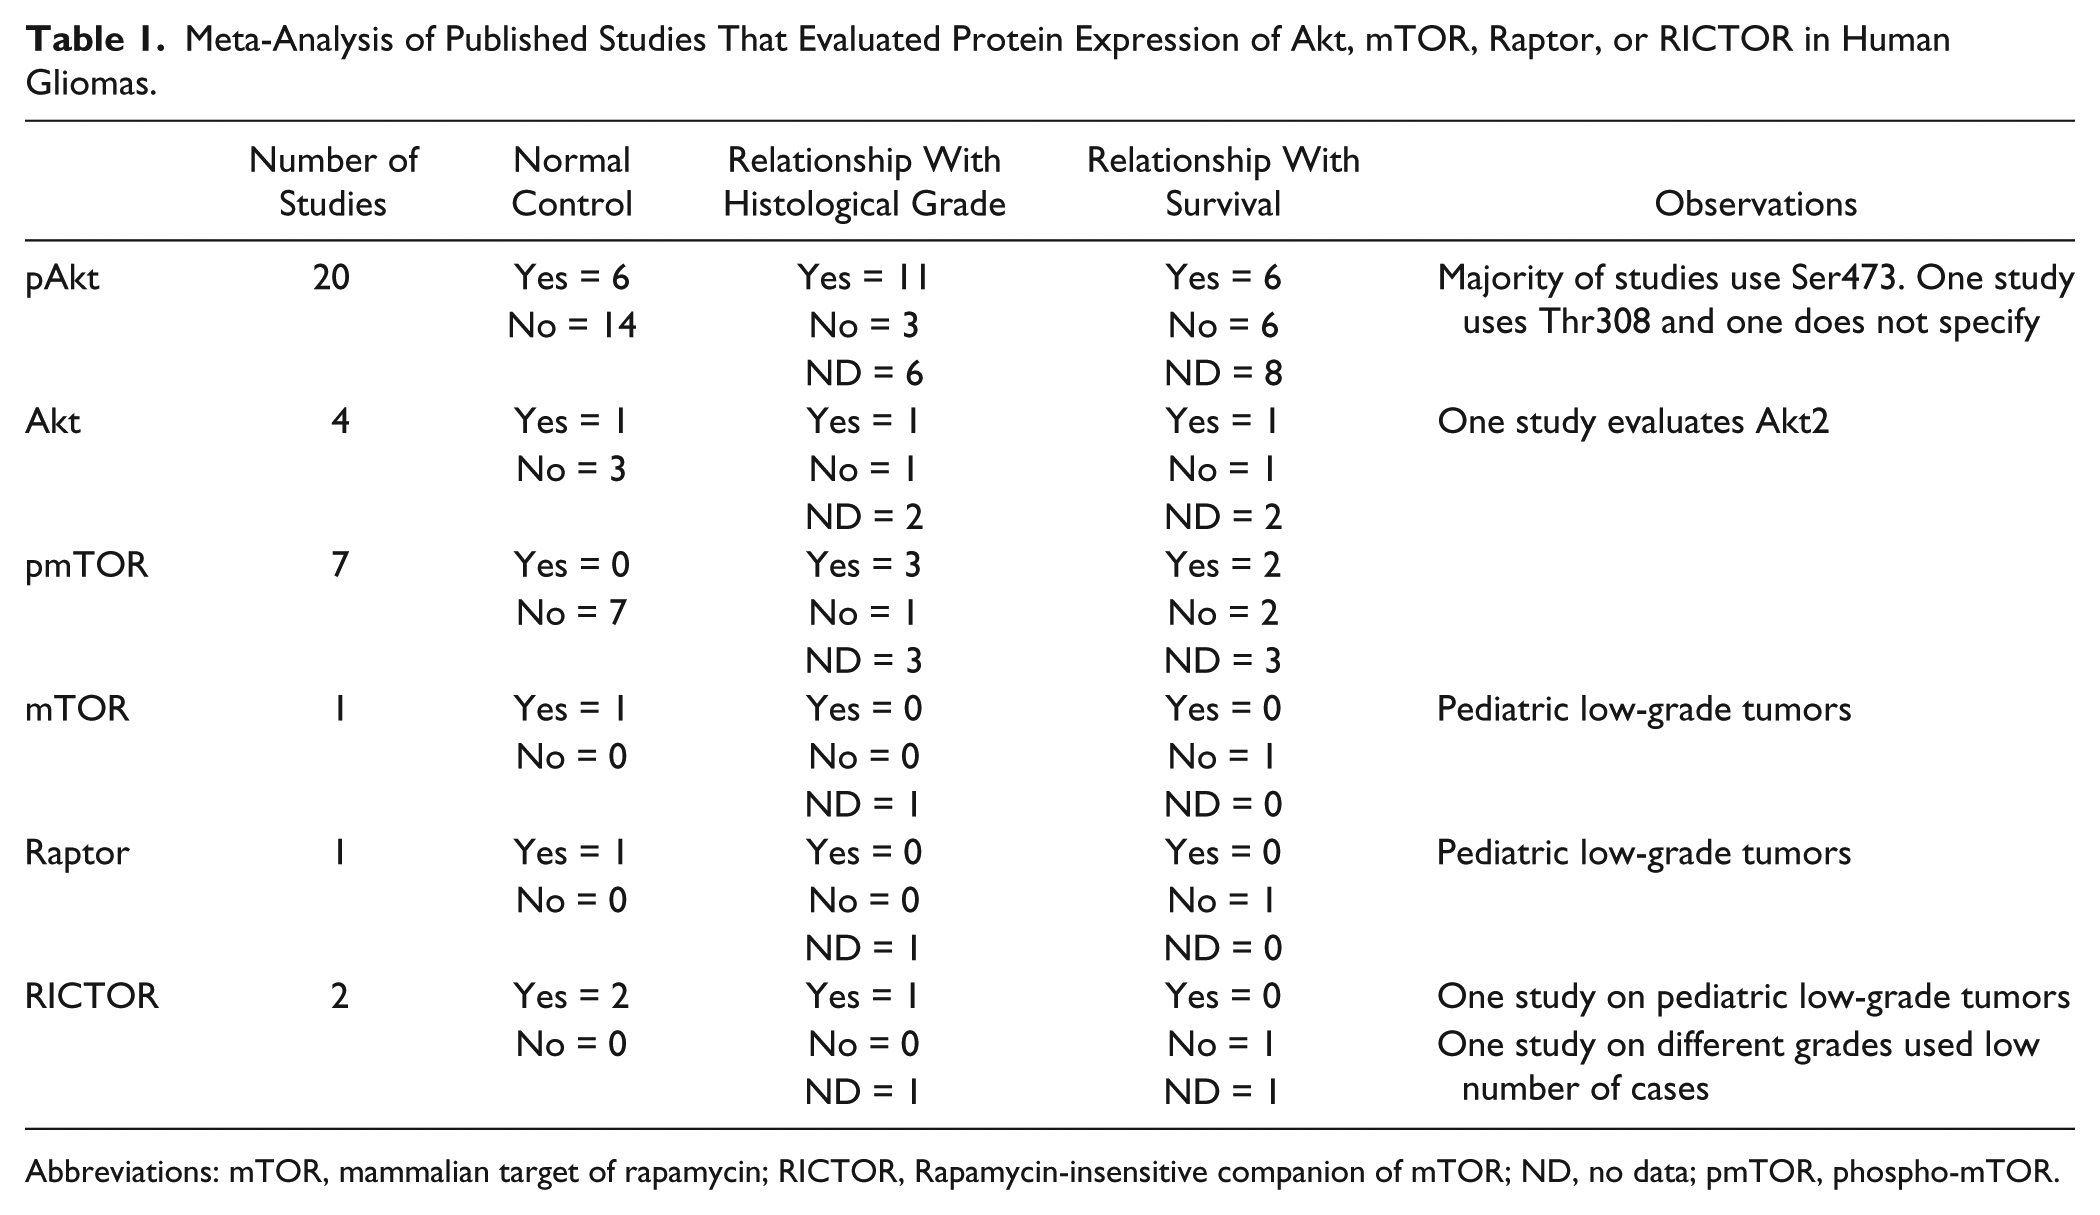
Abbreviations: mTOR, mammalian target of rapamycin; RICTOR, Rapamycin-insensitive companion of mTOR; ND, no data; pmTOR, phospho-mTOR.
Materials and Methods
Patient Selection
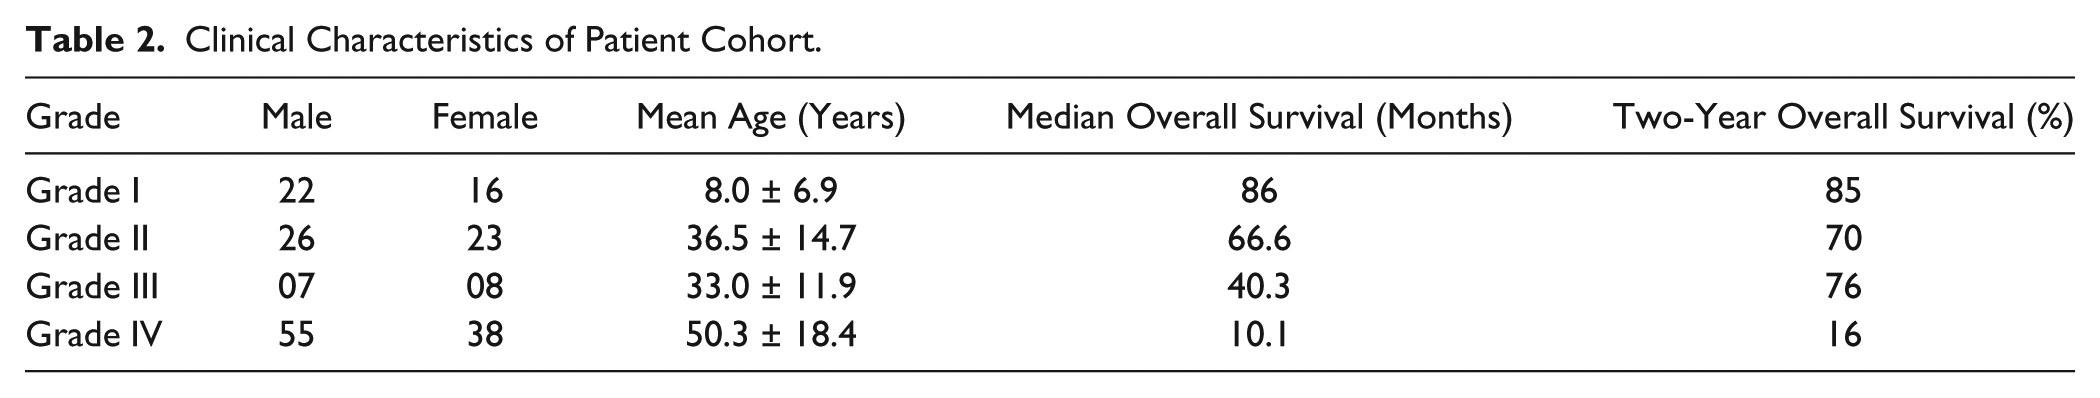
This is a study of 195 patients with astrocytomas that were surgically resected (attempt of debulking) at the neurosurgery department of A.C.Camargo Cancer Center, São Paulo, Brazil, during the period from 1980 to 2004 (Table 2). All cases were reviewed by an expert neuropathologist (L.F.B.T.) and assigned a histological grade according to the principles laid down in the latest WHO Classification. 2 The study population consisted of 38 cases of grade I, 49 grade II, 15 grade III, and 93 grade IV astrocytomas, in a total of 195 cases (Table 2 and Supplementary Table 2). Thirty controls cases were consisted of 14 non-tumoral brain tissues and 16 reactive gliosis tissue from epilepsy surgeries. For Western blot studies, tissues from 10 patients and one non-neoplastic control were used. All materials used were obtained before treatment. The study was approved by the Ethical Committee of the A.C.Camargo Cancer Center (approval numbers 1485/10 and 1692/12).
Clinical Characteristics of Patient Cohort.
Immunohistochemistry
IHC was performed using a 1-mm spotted tissue microarray (TMA) containing all the cases and controls. Immunohistochemical studies were performed as described in previous studies of the group. 26 Two slides per antibody were used. Anti-RICTOR (Cell Signaling, #2114) was used at 1:400 dilution, anti-p(S473)-Akt (Cell Signaling, #9277; Danvers, MA) at 1:50 dilution, and anti-Akt (Cell Signaling, 11E7) at 1:100 dilution. Ki-67 reaction (MIB-1; Dako, Glostrup, Denmark) was performed using a Ventana BenchMark XT automated stainer (Ventana Medical Systems; Tucson, AZ) at 1:50 dilution. The quality of the antibodies was verified by Western blot analyses of GBM cell lines (Supplementary Figure 1). Quantification was digitally made by ScanScope XT from Leica Biosystems (Nussloch, Germany) as described in previous studies. 26 Briefly, each pixel was classified as 0 (negative, threshold 256–220), 1 (weakly positive, threshold 220–175), 2 (positive, threshold 175–100), or 3 (strong positive, threshold 100–0); the number of pixels in each category was counted. HSCORE 27 was calculated according to the formula, HSCORE = Σ(i × Pi), where Pi = percentage of positive pixels, varied from 0% to 100%, and pixel staining intensity i = 0, 1, 2, or 3. For nuclear staining evaluation, automated identification and scoring of nuclei were performed by the ScanScope XT. Ki-67 labeling index (LI), considered as percentage of positive nuclei, was digitally made by ScanScope XT from Aperio. 26
Western Blot
Patient tissue was snap frozen in liquid nitrogen right after surgery. The histological grade of the tissue was confirmed by histological analyses, and only tissue with more than 80% tumoral tissue was used. Tissues homogenates were prepared in ice-cold lysis buffer (50 mM Tris-HCl, pH 8, 150 mM NaCl, 1% Nonidet P-40, 0.5% sodium deoxycholate, 1 mM EDTA, 16 µg/ml benzamidine HCl, 10 µg/ml phenanthroline, 10 µg/ml aprotinin, 10 µg/ml pepstatin A, 10 µg/ml leupeptin, 1 mM PMSF, 10 mM sodium fluoride, 1 mM sodium orthovanadate, 17.5 mM sodium β-glycerophosphate, and 6 mM sodium pyrophosphate) for 10 min on ice and centrifuged at maximum speed in a refrigerated microcentrifuge for 15 min. Total proteins in supernatants were quantified by Bradford (Sigma; St. Louis, MO) and subjected to SDS-PAGE (10% acrylamide gels for pAkt and Akt and 6% acrylamide gels for RICTOR) followed by blotting to Hybond-C extra membranes (GE Healthcare; Chicago, IL). Following incubation with primary antibodies—anti-RICTOR 1:500 (Cell Signaling, #2114), anti-p(S473)-Akt 1:1000 (Cell Signaling, #9277), anti-Akt 1:1000 (Cell Signaling, 11E7), anti-Erk1/2 1:2000 (Cell Signaling, #9102), and anti-GAPDH 1:5000 (MAB374; Millipore, Darmstadt, Germany)—these were recognized by horseradish peroxidase (HRP)–conjugated goat anti-rabbit or anti-mouse IgG (1:1000) and detected by chemoluminescence.
Statistical Analysis
Expression levels were tested by Kruskal–Wallis ANOVA and Dunn’s multiple comparison test. Correlation was assessed by Spearman’s nonparametric test. The effects of protein expression on clinical outcome of grade IV astrocytomas were assessed by the Kaplan–Meier method and comparing groups by use of the log-rank test. Survival analysis was performed using death from disease as the endpoint for overall survival. For the survival analysis, we excluded patients under the age of 20 years old and patients presenting additional tumors in other topologies, which is suggestive of a genetic syndrome. For the survival analysis cutoff point, we considered the first quartile value of HSCORE for each protein (meaning that expression values below the first quartile were classified as low expression, and values above the first quartile were considered high expression).
Results
We determined the expression and phosphorylation of Akt in TMAs containing cases of gliomas of different histological grades and non-tumoral brain (NB) samples (Figs. 1 and 2).The phosphorylation of Akt at residue S473 (Fig. 1A–D) does not seem to increase in gliomas of grades I to III when compared with normal tissue. GBMs, on the contrary, presented an expressive increase in P(S473)-Akt (Fig. 1E). Accordingly, the one fourth of GBM cases that express low P(S473)-Akt levels (below HSCORE 52) have increased survival when compared with patients with higher expression (Fig. 1F).
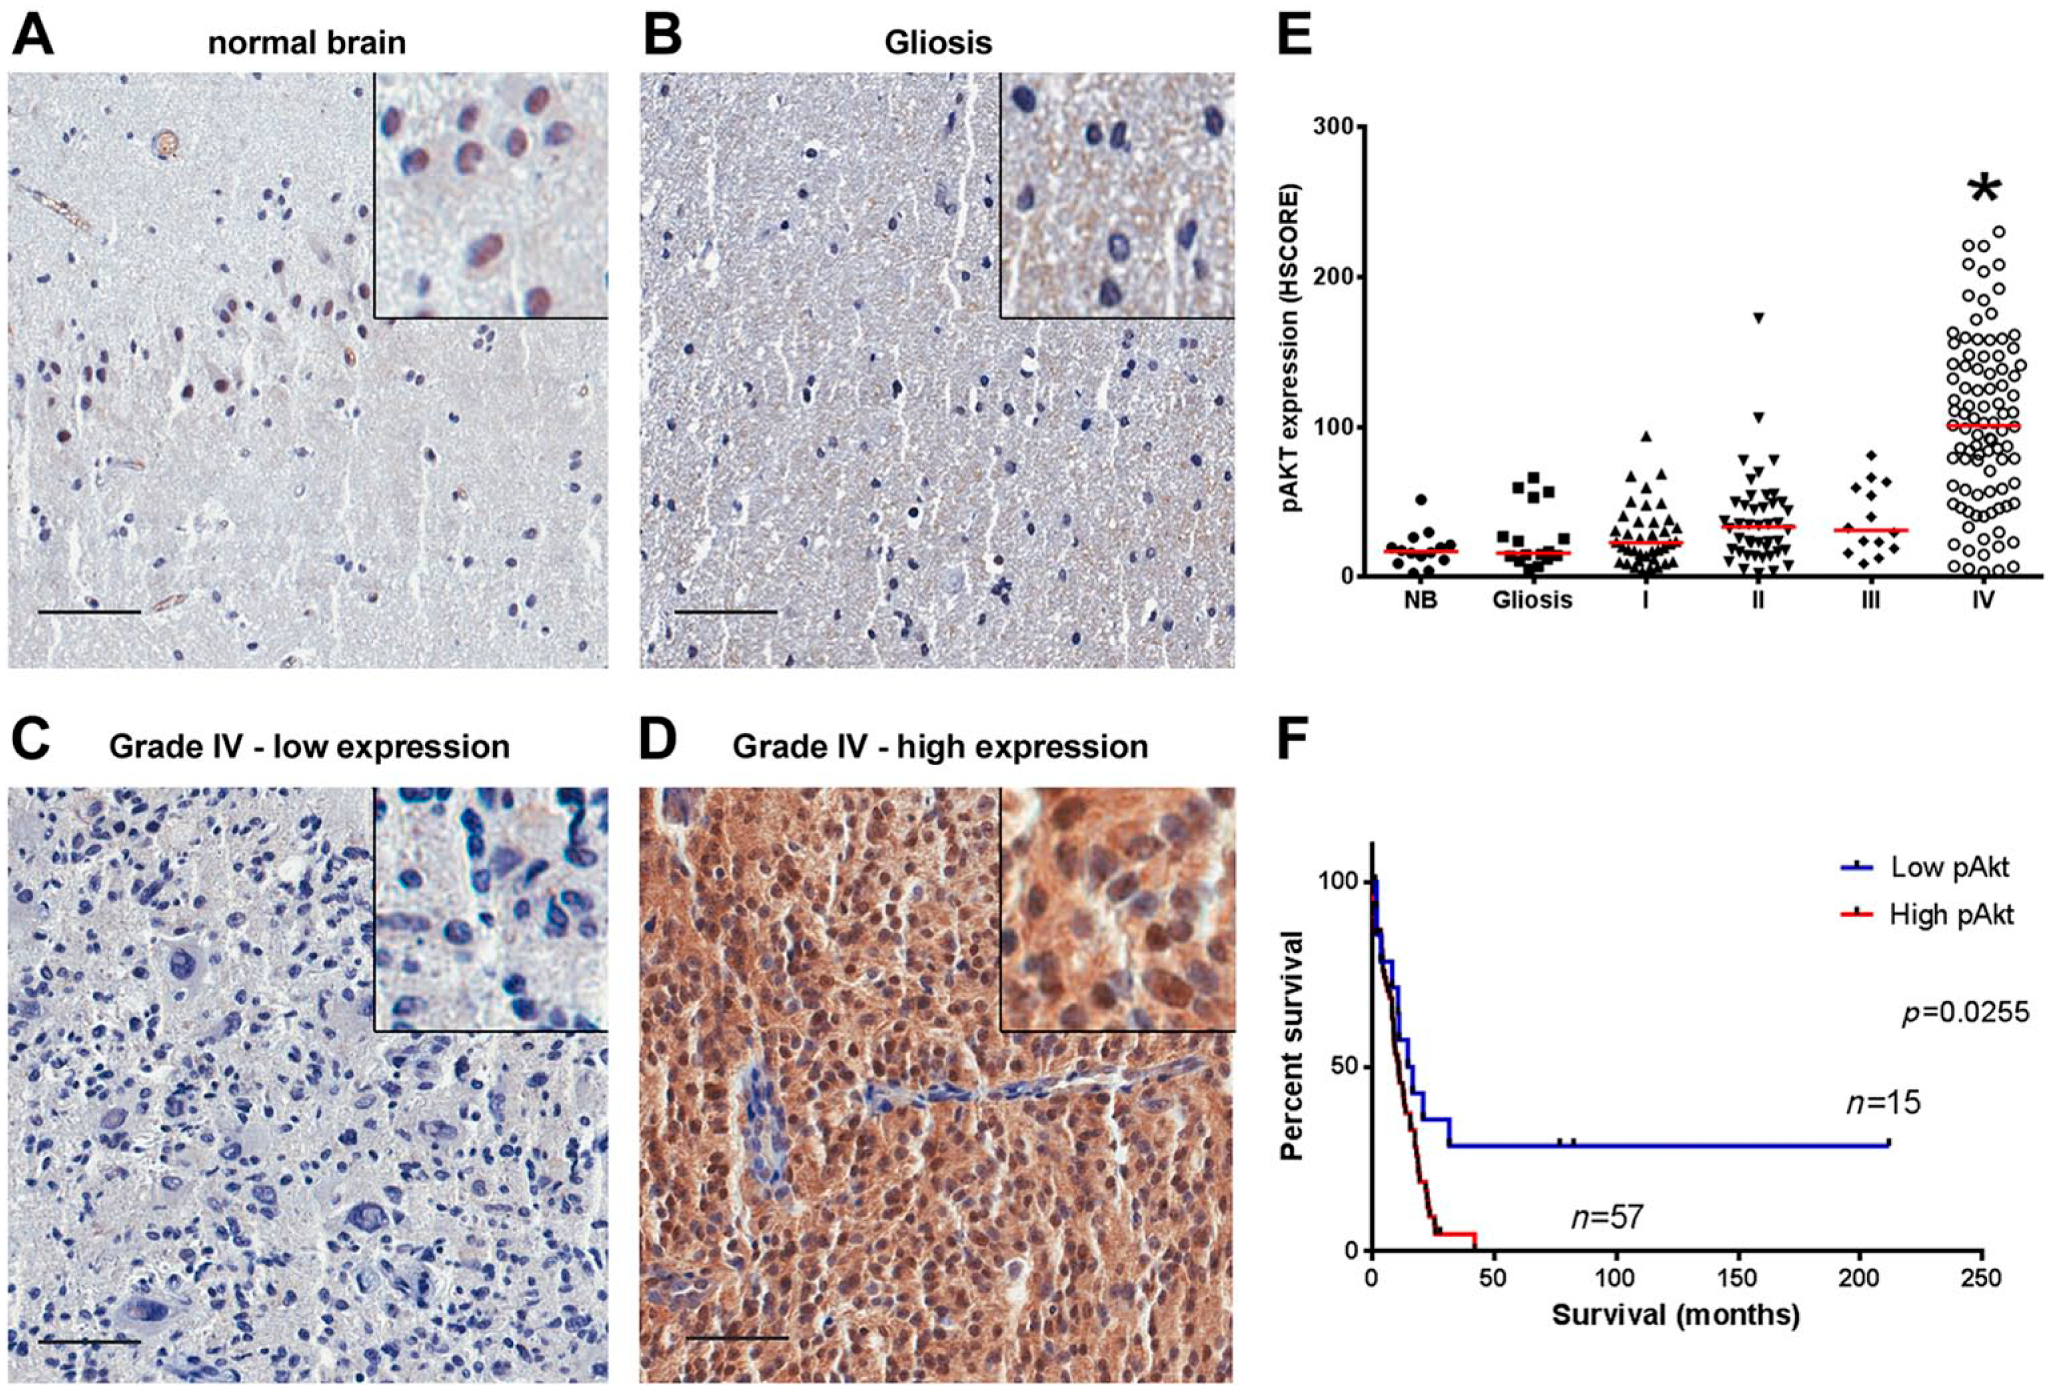
Akt phosphorylation in gliomas. Tissues of non-tumoral brain samples (NB), reactive gliosis (Gliosis), and astrocytomas of grades I to IV (I, II, III, and IV) were spotted into a TMA, and IHC reactions were performed for P(S473)-Akt. Representative IHC of non-tumoral brain (A), reactive gliosis (B), and grade IV astrocytomas with low (C) and high (D) Akt phosphorylation, respectively. Insets include higher magnifications of the pictures. (E) Reactions were quantified automatically and the HSCORE was calculated considering the intensity of labeling and number of labeled cells. (F) Survival curve of GB patients according to the levels of Akt phosphorylation. The cutoff for classification of samples between high and low was the first quartile (HSCORE 52). *Statistically different from NB, p<0.05. Scale bar = 50 µm.
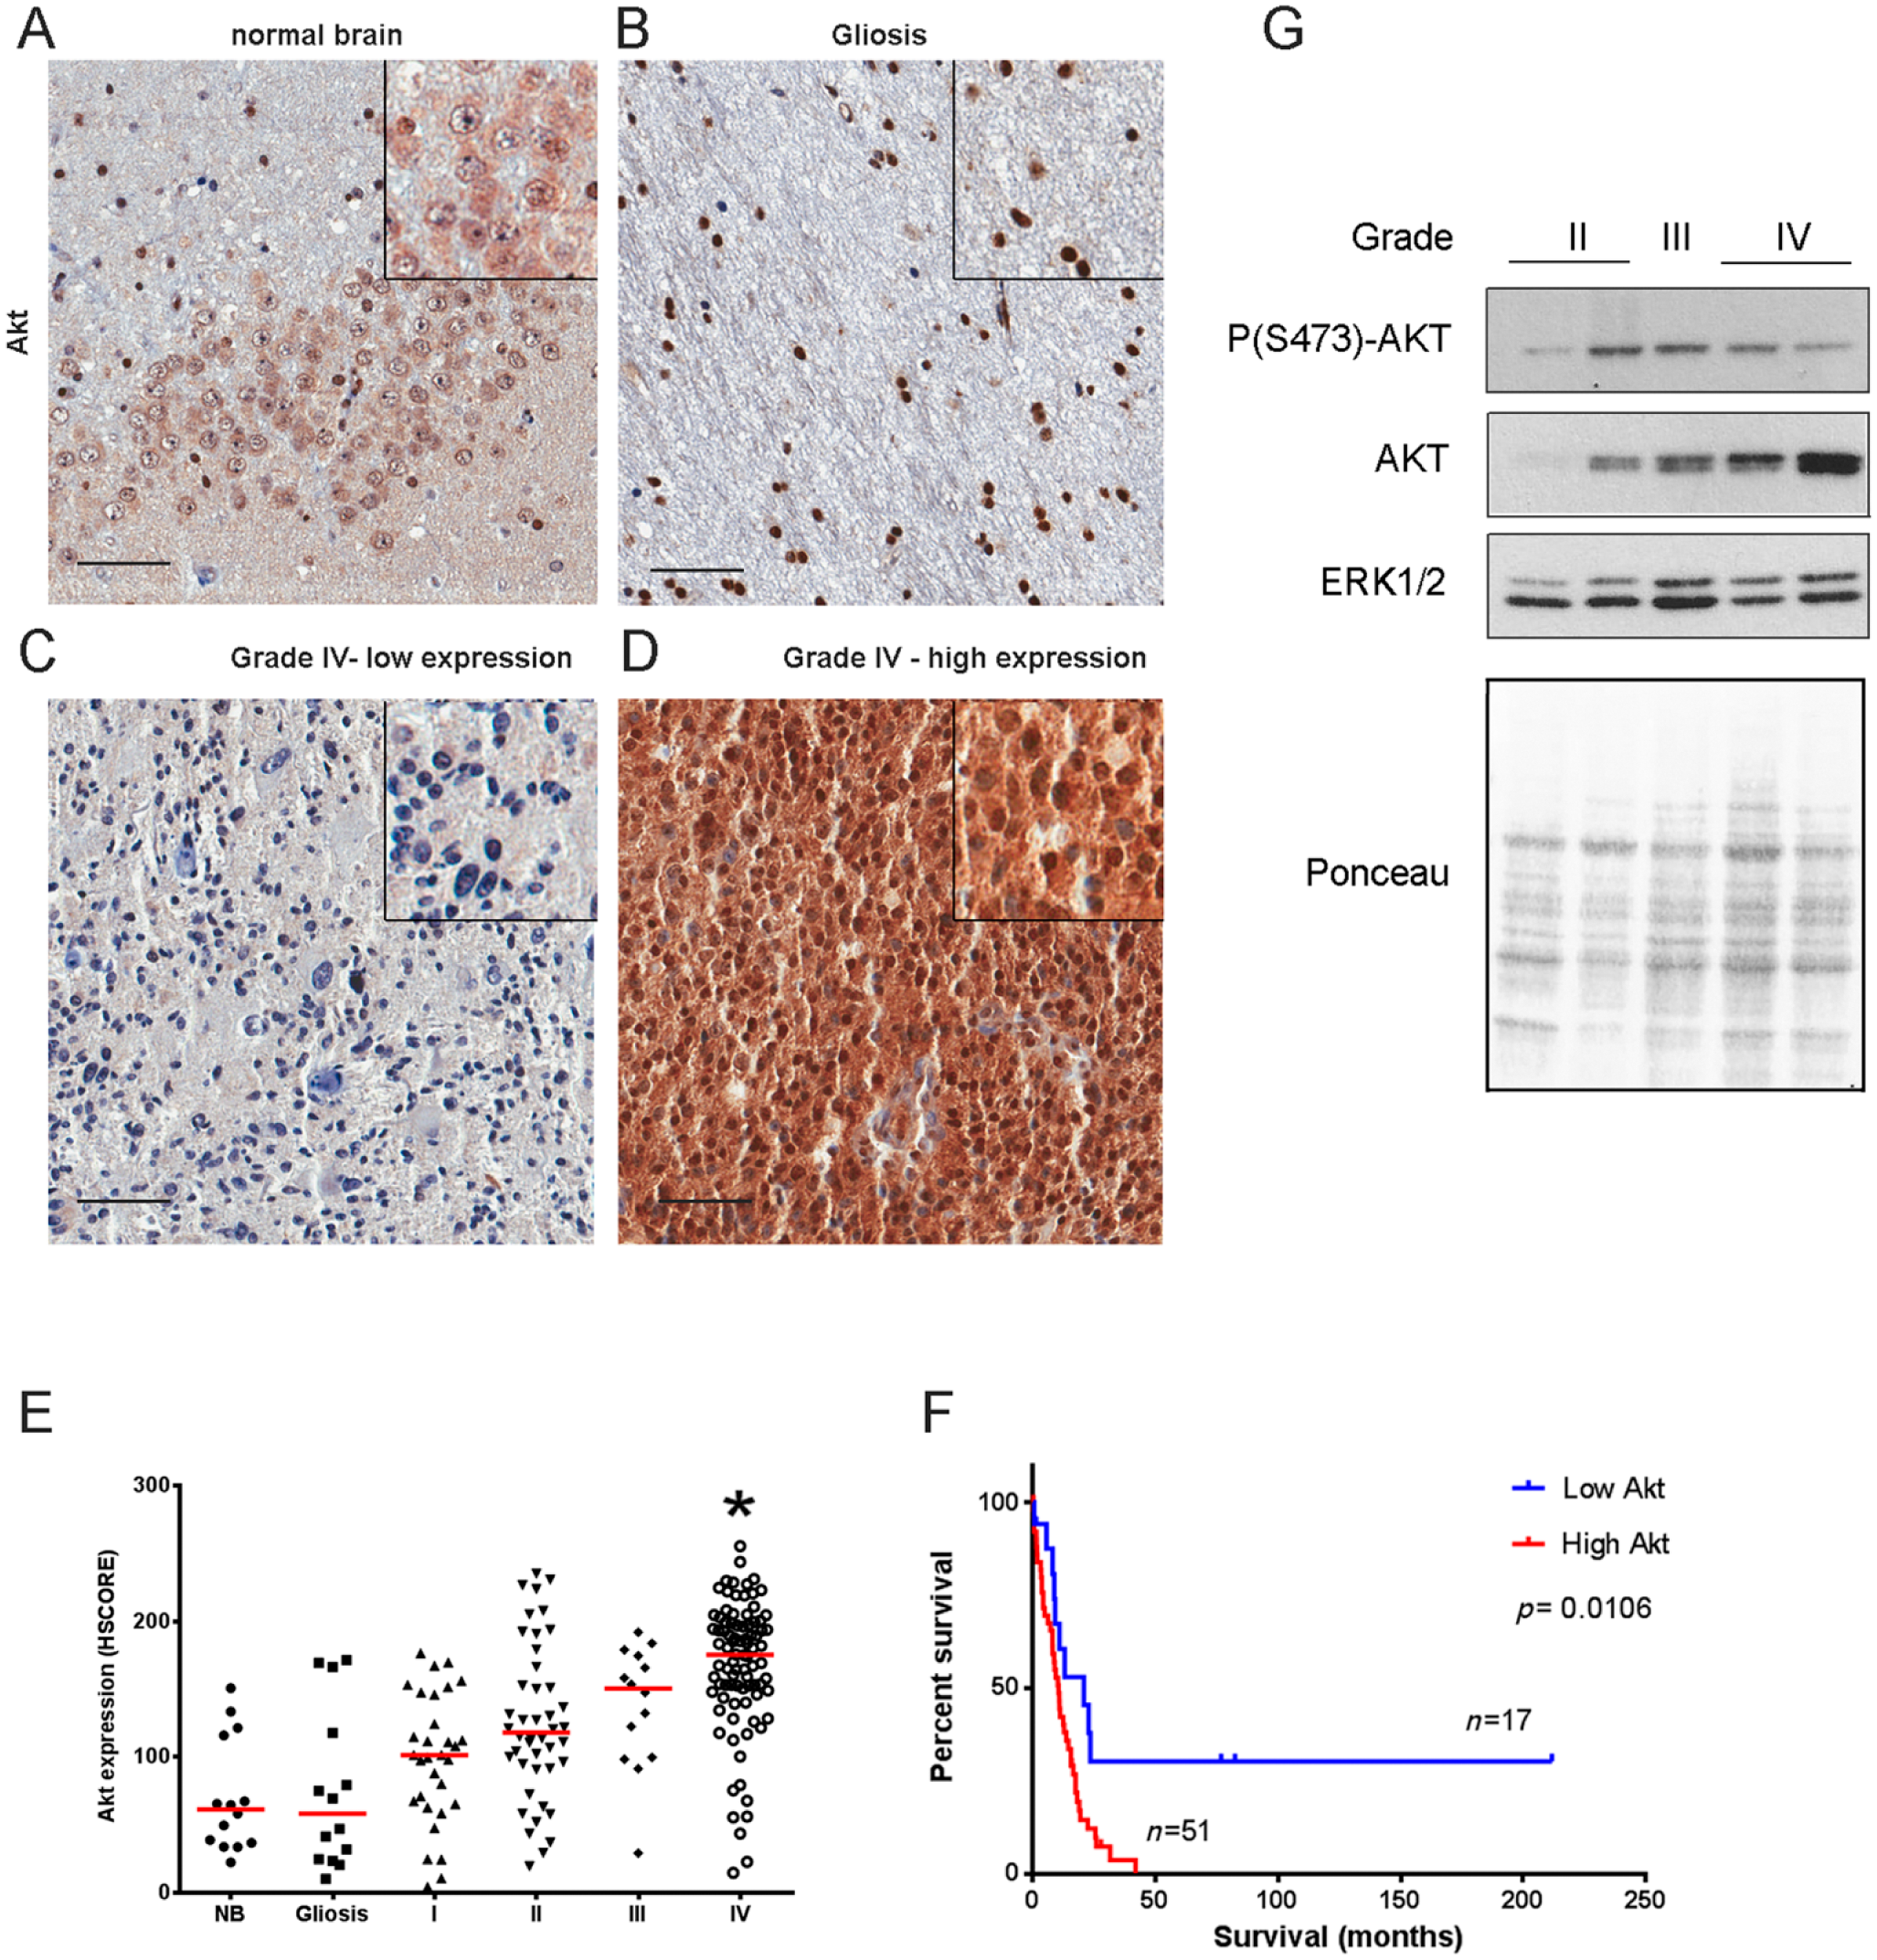
Akt expression in gliomas. Tissues of non-tumoral brain samples (NB), reactive gliosis (Gliosis), and astrocytomas of grades I to IV (I, II, III, and IV) were spotted into a TMA, and IHC reactions were performed for Akt. Representative IHC of non-tumoral brain (A), reactive gliosis (B), and grade IV astrocytomas with low (C) and high (D) Akt expression, respectively. Insets include higher magnifications of the pictures. (E) Reactions were quantified automatically, and the HSCORE was calculated considering the intensity of labeling and number of labeled cells. (F) Survival curve of GB patients according to the levels of Akt phosphorylation. The cutoff for classification of samples between high and low was the first quartile (HSCORE 140). *Statistically different from NB, p<0.05. Scale bar = 50 µm. (G) Akt expression and phosphorylation were also assessed by Western blot. Two grade II, one grade III, and one grade IV snap-frozen tissues were subjected to Western blot reaction for P(S473)-Akt and Akt. Ponceau staining and ERK1/2 were used as loading controls.
Regarding Akt expression, we observed that cases with expression of Akt higher than normal brain (NB) and gliosis were progressively more frequent according to the grade (I–III; Fig. 2A–E). In GBMs, the expression of Akt was significantly increased when compared with normal tissue with three quarters of samples showing expression higher than HSCORE 140. Interestingly, patients showing HSCORE higher than 140 presented reduced overall survival when compared with patients with low Akt expression (Fig. 2F). There is a strong correlation between the expression and phosphorylation (S473) of Akt in all grades and non-neoplastic brain (Table 3), suggesting that the increase in Akt phosphorylation follows the increase in Akt expression. Akt expression and phosphorylation were also observed by Western blot in a few samples (Fig. 2G). Even though there is a high variability in the phosphorylation of Akt between samples, the expression of Akt increases with grade (Fig. 2G).
Correlation Analysis of the Expression of the Proteins Analyzed in This Study.
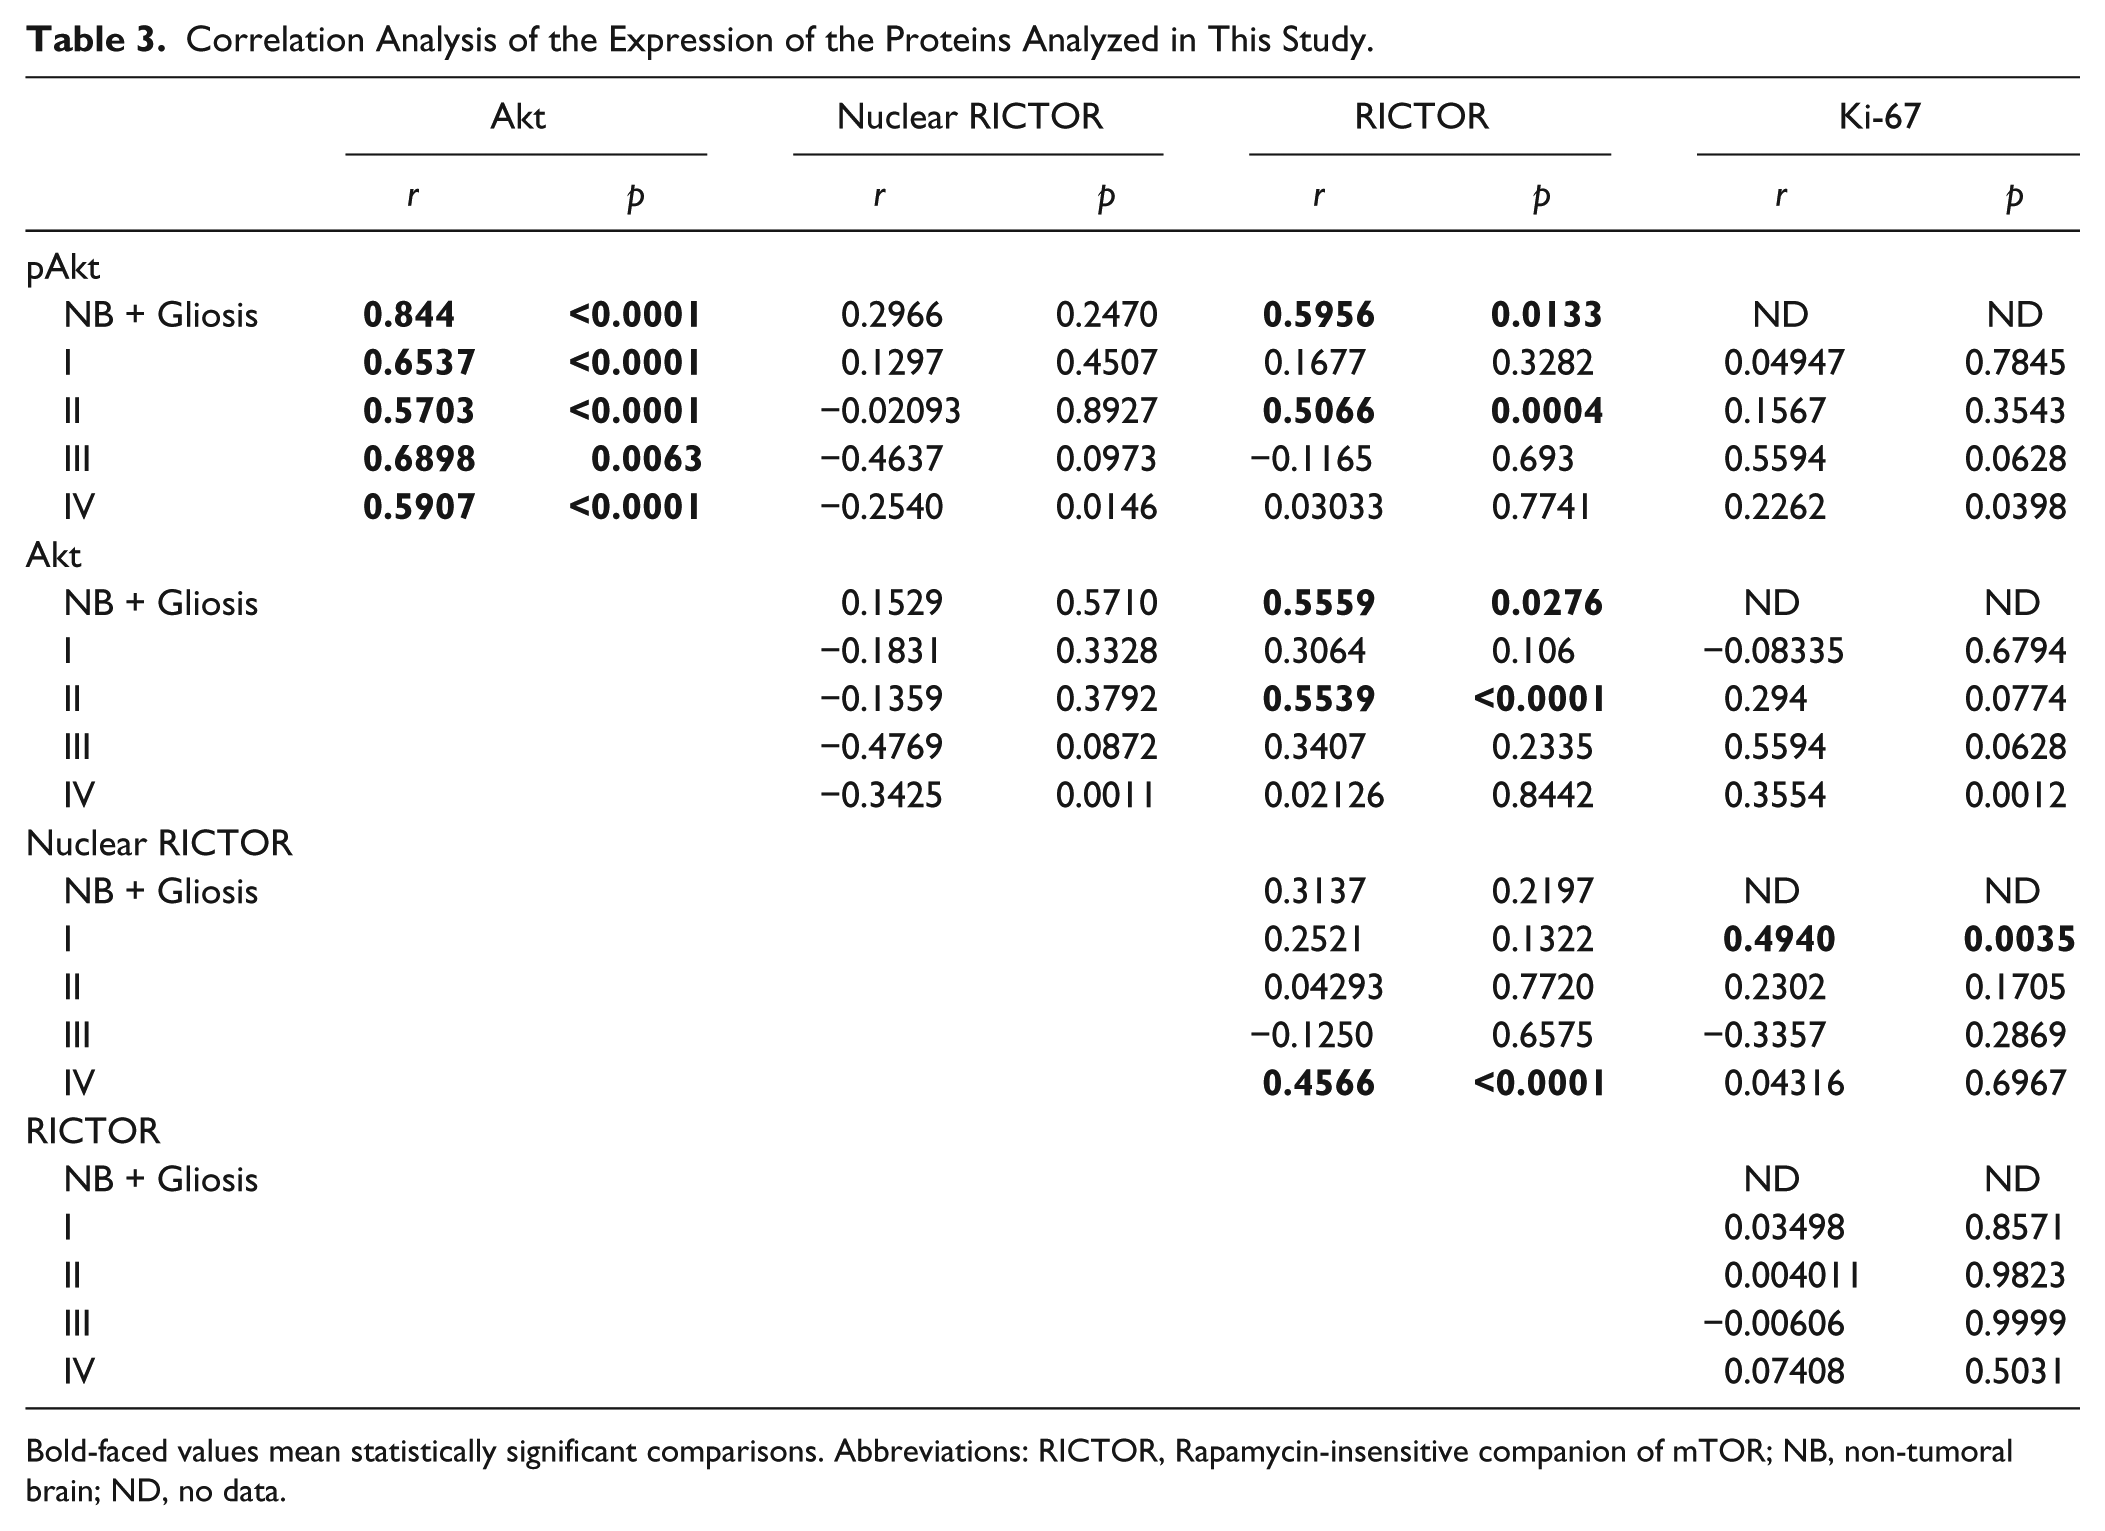
Bold-faced values mean statistically significant comparisons. Abbreviations: RICTOR, Rapamycin-insensitive companion of mTOR; NB, non-tumoral brain; ND, no data.
The expression of the mTORC2 component, RICTOR, was also analyzed (Fig. 3A–F). In grade I and II astrocytomas, there was a significant increase in the expression of RICTOR when compared with normal tissue and gliosis. However, in grade III and IV astrocytomas, the presence of cases with low RICTOR expression resulted in a more heterogeneous distribution (Fig. 2E). Interestingly, we observed a nuclear distribution of RICTOR in grade IV astrocytomas (Fig. 2F). We observed a strong correlation between the expression of RICTOR and Akt expression and phosphorylation (S473) in non-neoplastic brain and in grade II astrocytomas (Table 3). As mTORC2 is responsible for the phosphorylation of Akt in the S473 residue, this finding also has an important biological significance. The median survival time was 14.47 months for patients presenting low RICTOR and 10.37 months for high RICTOR. The median survival time was 12.7 months for patients presenting low RICTOR nuclear expression and 7.9 months for high RICTOR expression. However, these results were found not statistically significant (total RICTOR expression log-rank Hazard Ratio of 0.6550, p=0.1524; nuclear RICTOR expression log-rank Hazard Ratio of 0.8890, p=0.6992). RICTOR expression was also observed by Western blot in a few samples (Fig. 3G). Even though there is a high variability of RICTOR between samples, we were able to observe an increased expression in the tumor samples versus a non-tumoral one (Fig. 2G).
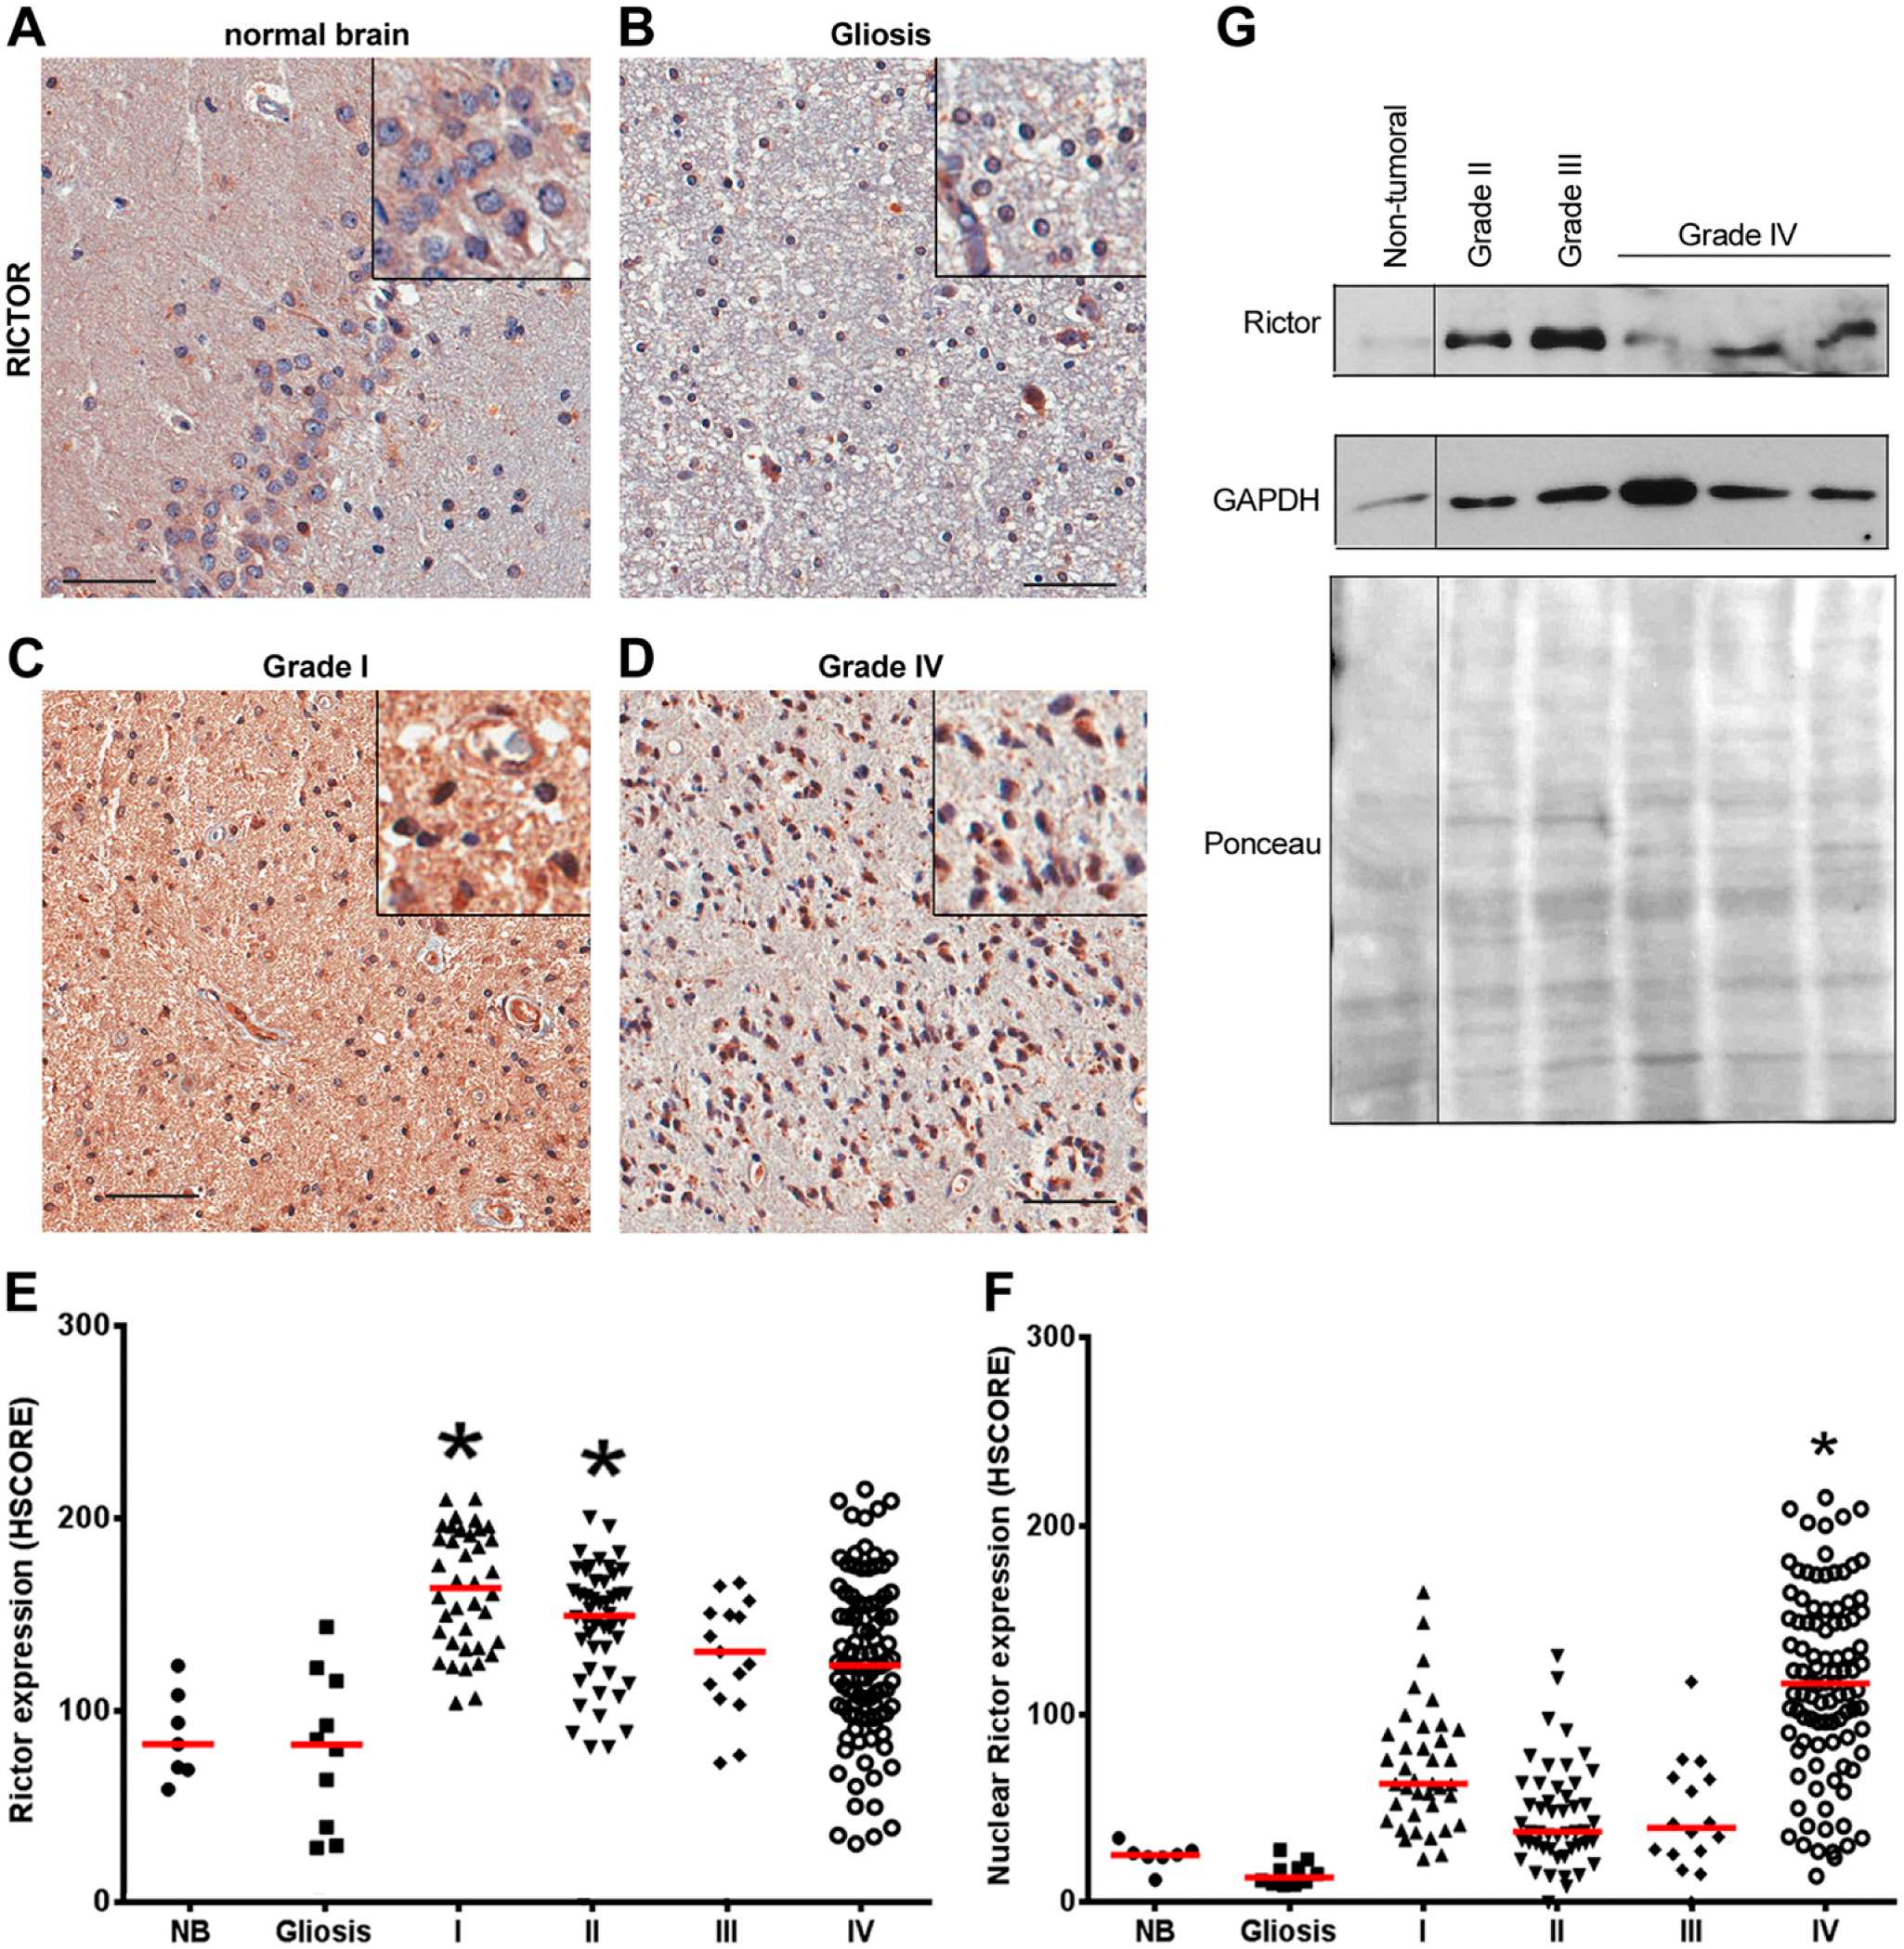
RICTOR expression in gliomas. Tissues of non-tumoral brain samples (NB), reactive gliosis (Gliosis), and astrocytomas of grades I to IV (I, II, III, and IV) were spotted into a TMA, and IHC reactions were performed for RICTOR. Representative IHC of RICTOR in non-tumoral brain (A), reactive gliosis (B), and grade I (C) and grade IV (D) astrocytomas. Insets include higher magnifications of the pictures. Reactions were quantified automatically, and the HSCORE for total (E) or nuclear (F) expression was calculated considering the intensity of labeling and number of labeled cells. *p<0.05 compared with NB. Kruskal–Wallis ANOVA and Dunn’s multiple comparison test. Scale bar = 50 µm. (G) RICTOR expression was also assessed by Western blot. One non-tumoral tissue, one grade II, one grade III, and three grade IV snap-frozen tissues were subjected to Western blot reaction for RICTOR. Ponceau staining and GAPDH were used as loading controls. Abbreviation: RICTOR, Rapamycin-insensitive companion of mTOR.
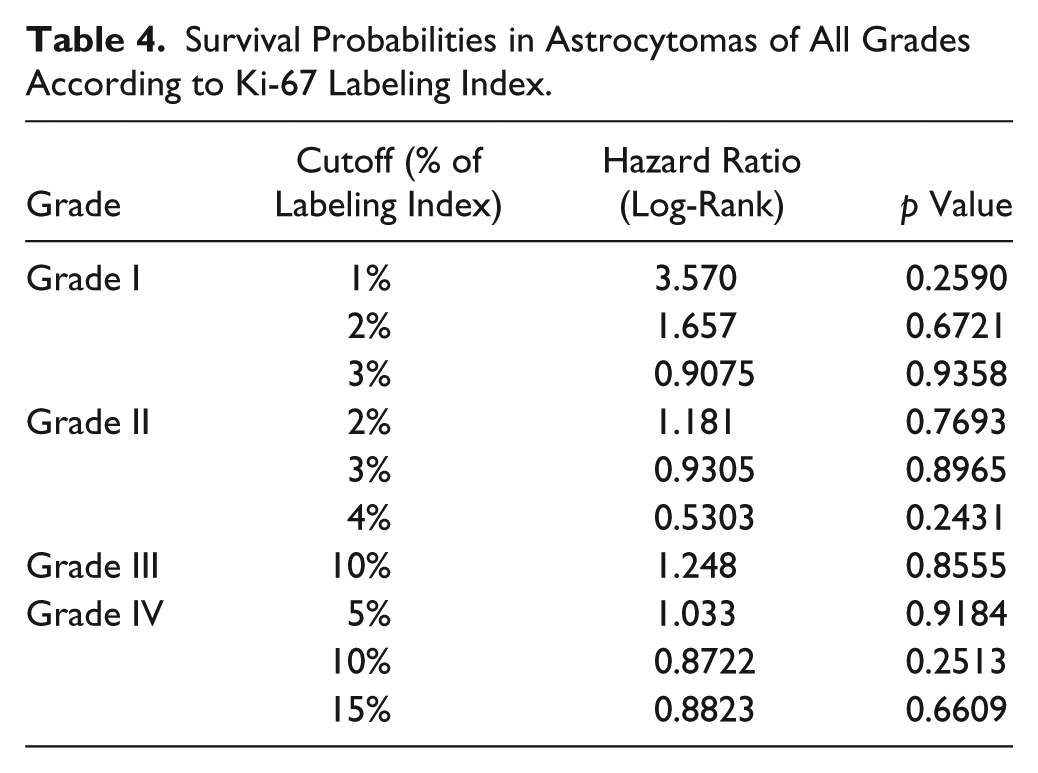
It was previously reported that the activity of mTORC2 is associated to increased growth in GBMs. 25 We thus analyzed the relationship between proliferation (measured by Ki-67) and the expression of Akt or RICTOR. Ki-67 was practically absent in normal tissue; however, cases showing different Ki-67 LI were frequent in astrocytomas of all grades (Fig. 4A–E). We observed a correlation between Ki-67 and the presence of nuclear RICTOR in grade I astrocytomas (Table 3). However, our results suggest that the increased proliferation observed in astrocytomas is not linked to an increased presence of the studied components of mTORC2. As Ki-67 labeling has been previously suggested as a prognostic marker, 28 we also evaluated its relationship with overall survival. No association between Ki-67 LI and survival was observed in any grade, despite of the use of different cutoff points 28 (Table 4).
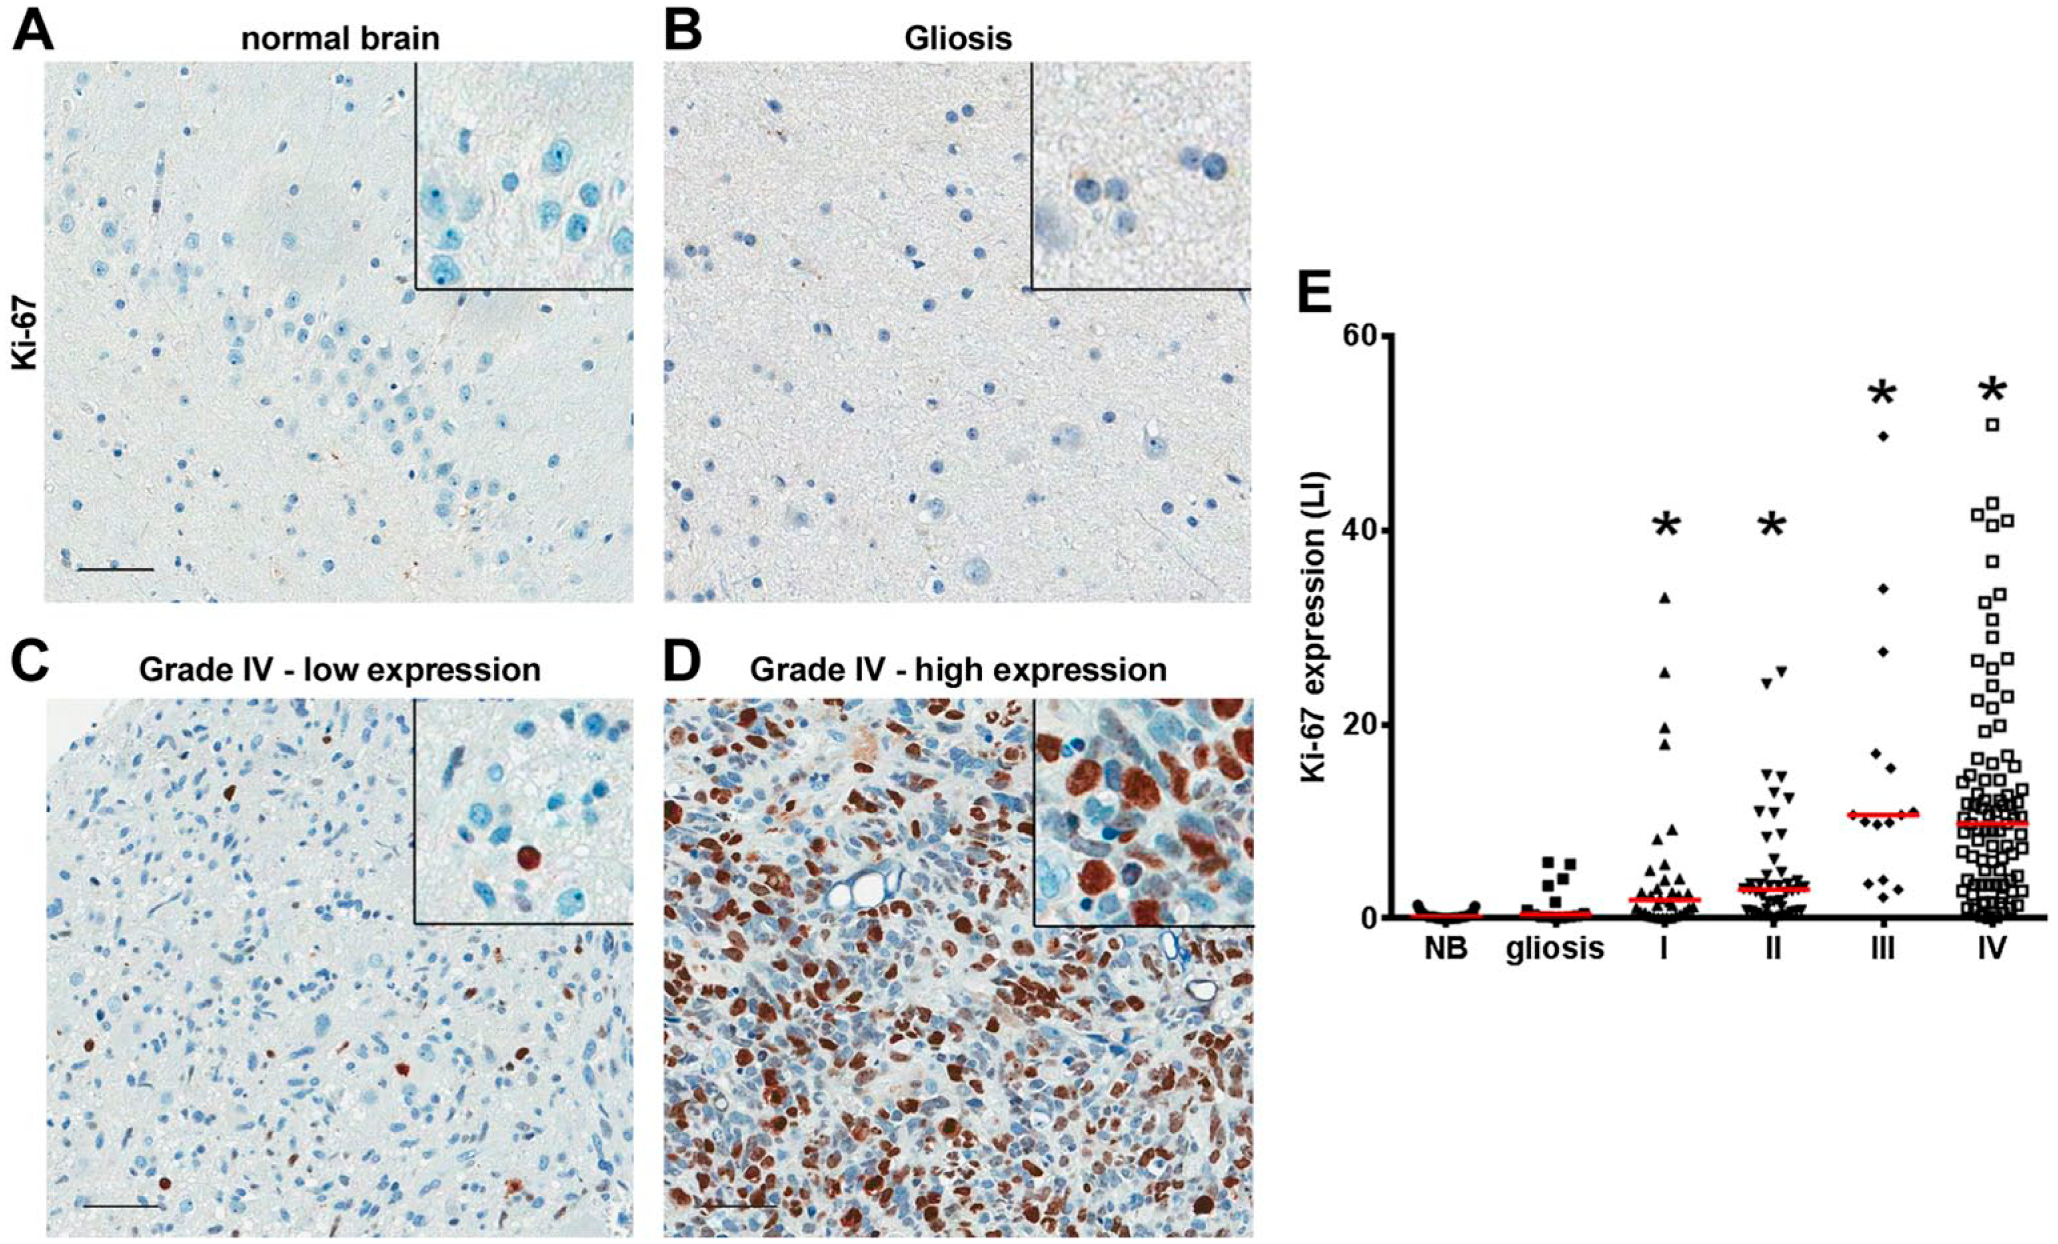
Ki-67 labeling index (LI) increases with grade. Tissues of non-tumoral brain samples (NB), reactive gliosis (Gliosis), and astrocytomas grades I to IV (I, II, III, and IV) were spotted into a TMA, and IHC reactions were performed for Ki-67. In non-tumoral brain (A) and gliosis (B), no detection of Ki-67 staining was observed, whereas in grade IV astrocytomas, low (C) and high (D) Ki-67 labeling can be observed. Insets include higher magnifications of the pictures. (E) For Ki-67, the number of labeled nuclei was quantified automatically, expressed as a percentage of total nuclei (LI). *p<0.05 compared with NB. Kruskal–Wallis ANOVA and Dunn’s multiple comparison test. Scale bar = 50 µm.
Survival Probabilities in Astrocytomas of All Grades According to Ki-67 Labeling Index.
Discussion
Constitutive PI3K-Akt-mTORC1 pathway activation is now considered a hallmark of GBMs. 29 Even though there is a large role of mTOR in GBMs, the first clinical trials with rapamycin or its analogs were disappointing.30–32 Reasons for this may include insufficient target inhibition or primary resistance by activation of alternative signaling pathways. Currently, numerous clinical and preclinical trials are devoted to analyze second-generation inhibitors of PI3K-Akt-mTORC1 pathway and dual mTORC1 and 2 inhibitors.33,34
Even though Akt is currently largely implicated in the mechanisms of gliomagenesis, the levels phosphorylation of Akt in human gliomas are controversial. In 20 articles (Table 1 and Supplementary Table 1) reporting Akt phosphorylation, there is a lack of agreement when evaluating the relevance of this phosphorylation for progression or survival (Table 1 and Supplementary Table 1). This lack of agreement may be due to several methodological variations. First, a non-neoplastic control is useful to determine whether a protein is overexpressed, underexpressed, or none. If no such a control is included, the mere presence or absence of the staining in the IHC reaction does not have a biological meaning. In addition, the absence of controls can be problematic in terms of reproducibility. Many factors influence the IHC reaction, such as type of antigenic retrieval, type of blockage, antibody concentration, and even time of the diaminobenzidine reaction. Thus, the inclusion of a non-tumoral control is a useful way for normalization, which increases reproducibility. A second issue regarding reproducibility is the methodology of quantification. All articles included in our meta-analysis used manual classification scores. Even though a pathologist opinion is essential to evaluate the overall IHC reaction and review tissue histology, manual classifications suffer from intra- and interobserver variability, which reduces reproducibility of experiments. An automated evaluation, on the contrary, can be identically performed in different laboratories, reducing the variability. 26 Our results in a large series of gliomas, including proper non-tumoral controls and automated evaluation, suggest that Akt phosphorylation increases with grade and is related to worst overall survival.
Conversely to the abundant literature on Akt phosphorylation, there are only two studies reporting the relation of total Akt expression with glioma progression. One of these studies reported the expression of Akt2 in a series of astrocytomas of different grades. 35 In the other article, the authors found no difference in Akt expression when comparing 56 GBM cases with a series of other tumor types (11 low-grade astrocytomas, 13 grade III astrocytomas, four oligodendrogliomas, one ependymoma, and one ganglioglioma). 13 Additional studies on Akt expression in gliomas did not present tumors of different histological grades for comparison. Two studies reported the influence of Akt on overall survival (Table 1 and Supplementary Table 1), one for grade II atrocytomas 36 and the other for PA. 37 Thus, the impact of increased Akt expression on the survival of GBM patients remains largely unaddressed. Our results demonstrated an increase in total Akt expression in GBMs, which is correlated with worse survival. Phosphorylated Akt is also associated with its total form, suggesting that increased phosphorylation of Akt in GBM may be due to its increased expression.
In GBMs, increased activity of the mTORC2 has been described in cell lines and human samples. Increased Akt phosphorylation at Ser243 and increased expression of RICTOR analyzed by Western blot and real-time PCR of 21 GBM samples versus three normal brain tissues were observed. 25 Our results in 195 astrocytomas and 30 non-tumoral samples are in agreement with an increased Akt phosphorylation at Ser473. Our results indicate that overexpression of RICTOR is not observed in GBMs; however, we did observe an increase in nuclear RICTOR in GBM cases. Although mTORC1 and 2 are mainly cytoplasmic, the presence or RICTOR has been documented in the nucleus of cell lines 38 and mice tissues in association with the insulin receptor substrate 2. 39 This shift in subcellular localization of RICTOR from low- to high-grade gliomas may reflect a change in the binding partners of this protein with functional consequences for the tumoral progression.
In glioma experimental models, the role of mTORC2 is controversial. Overexpression of RICTOR in transgenic mice induces the formation of malignant gliomas. 40 However, a negative role of RICTOR in invasion of glioma cell lines and primary cultures was also reported. In the same study, no role for RICTOR in glioma cell survival or proliferation was detected. 41 A recent report suggested a role of mTORC2 in metabolic control. By regulating the intracellular levels of c-Myc, mTORC2 would control the preferential use of glycolysis even in aerobic conditions (Warburg effect) that are commonly observed in gliomas. 42 However, that report did not evaluate the presence of the mTORC2 components in human gliomas. In low-grade astrocytomas, our results demonstrate an increase in RICTOR expression that could account for an increased activity of mTORC2 in this tumor type. In other reports, the expression of RICTOR was investigated in pediatric low-grade gliomas; however, no increase in expression could be documented because the article did not include non-tumoral tissue as control. 20
Ki-67 protein shows a significant quantitative relationship with the histological grades in gliomas. 28 In accordance, our casuistry shows a progressive increase in Ki-67 labeling with grade, presenting a significant overlapping between grades. Even though some studies have demonstrated a significant correlation between Ki-67 LI and postoperative survival in astrocytic gliomas,28,43 the majority of articles in the literature indicate that Ki-67 LI has no prognostic implication for GBM patients.2,5 In our study, Ki-67 LI also demonstrated no association with the survival probability. As literature indicates, 28 several cutoff indexes were used to calculate survival probabilities in GBM patients, 28 which can be one of the causes of discordant findings. We have thus used several LI cutoff indexes to assess survival; however, our data indicated no relationship between Ki-67 labeling and survival probability in astrocytomas of any grade (Table 3). We also found no association between the proliferation index and any of the markers included in this study.
Thus, our data show an overexpression and overphosphorylation of Akt in GBM cases that are relevant for the overall survival of GBM patients. In addition, our results show an increased RICTOR expression in low-grade astrocytomas and an increased nuclear expression of RICTOR in GBM.
Footnotes
Competing Interests
The author(s) declared no potential conflicts of interest with respect to the research, authorship, and/or publication of this article.
Author Contributions
AWA, BRR, and LEM conducted the IHC reactions and analyzed the data; FCSL and MR conducted Western blot experiments; PS reviewed clinical data; LFBT reviewed pathological classification; IWC supervised the IHC, reviewed pathological classification, and analyzed the data; VRM and MR analyzed the data; and GNMH analyzed the data and wrote the paper. All authors have read and approved the final manuscript.
Funding
The author(s) disclosed receipt of the following financial support for the research, authorship, and/or publication of this article: This work was funded by Fundação de Amparo à Pesquisa do Estado de São Paulo (FAPESP) grants to GNMH (2014/15550-9) and VRM (2009/14027-2) and fellowship to M.R. Coordenadoria de Apoio à Pesquisa (CAPES) fellowships to A.W.A. and L.E.M. are gratefully acknowledged.
References
Supplementary Material
Please find the following supplemental material available below.
For Open Access articles published under a Creative Commons License, all supplemental material carries the same license as the article it is associated with.
For non-Open Access articles published, all supplemental material carries a non-exclusive license, and permission requests for re-use of supplemental material or any part of supplemental material shall be sent directly to the copyright owner as specified in the copyright notice associated with the article.